
THERMAL FATIGUE OF A TOOL STEEL: EXPERIMENT
AND NUMERICAL SIMULATION
V. Velay, G. Bernhart and L. Penazzi
Research Centre on Materials Tools and Processes (CROMeP)
Ecole des Mines d’Albi Carmaux
Campus Jarlard
81013 Albi cédex 09
France
A. Persson and J. Bergström
Department of Materials Engineering
Karlstad University
SE-651 88, Karlstad
Sweden
Abstract
Tools for die casting and hot forging applications are exposed to thermal
cycling, which may induce stresses high enough to cause plastic deformation
during each cycle. The tool material behaviour in thermal fatigue loading is
determined by the material properties and the thermal and mechanical load
conditions. Coupled studies by experimental and numerical simulations are
necessary for an increased understanding of the material behaviour as related
to the interaction between the thermal and mechanical conditions.
In this study, thermal fatigue testing of a tool steel, 55NiCrMoV7, and
numerical simulation of its behaviour have been performed. The experimen-
tal test is based on induction heating and surface strain measurements by a
non-contact laser speckle technique, which enables studies on the surface
strain response during thermal cycling. Thermal cycling up to 600
◦
Cwere
included. The numerical model was developed to simulate the thermal con-
ditions in the specimen and to evaluate the non-isothermal stress-strain be-
haviour under thermal fatigue loading. It is based on a thermal analysis and
a mechanical cyclic elasto-visco- plastic constitutive model, taking into ac-
793

794
6TH INTERNATIONAL TOOLING CONFERENCE
count the cyclic softening of the material and complex loads to which tools
are subjected. The results from the experimental and numerical simulations
were compared.
Keywords:
Thermal fatigue, Tool steel, Simulation
INTRODUCTION
Tools for die casting and hot forging applications are exposed to demand-
ing thermal and mechanical conditions [1]. The cyclic thermal load on
the tool during those processes may induce stresses high enough to impose
plastic deformation in the tool surface and, eventually, cause thermal fatigue
cracking (heat checking). This type of damage is often seen as a network of
fine cracks on the die surface, and it is an important life-limiting failure mech-
anism of die casting and hot forging dies. High levels of hot yield strength,
temper resistance, toughness, and ductility are some important mechanical
properties required of the tool material.
The properties of the tool material and the complex interaction between
the thermal cycling and the mechanical conditions determine the behaviour
of the material during the tool’s work cycles. Elasto-viscoplastic behaviour
models have successfully been utilised to simulate the non-isothermal stress-
strain response of material exposed to thermomechanical load conditions [2].
However, running experimental and numerical simulations is necessary for
an increased understanding of the behaviour of the material during thermal
cycling, as well as for the development of new models to describe the cyclic
material response.
In this study, the thermal fatigue response of tool steel specimens (55NiCr-
MoV7) were experimentally evaluated for thermal cycling to 500 and 600
◦
C ,
and numerical simulations of the behaviour of the material were performed.
The test is based on induction heating and surface strain measurements
through a non-contact laser speckle technique. This enables studies of the
surface response during thermal cycling. The non- isothermal stress-strain
behaviour of the material during thermal cycling was numerically simulated
using an elasto-visco-plastic constitutive model. The results from the exper-
imental and numerical simulations were compared.

Thermal Fatigue of a Tool Steel: Experiment and Numerical Simulation
795
Table 1.
Properties of the 55NiCrMoV7 tool steel at different temperatures (Poisson’s ratio
ν = 0.30 and density ρ = 7769 kg/m
3
)
Temperature
[
◦
C]
E-modulus
[GPa]
Yield
Strength
R
p0
.2
[MPa]
Thermal
expansion
coefficient
[10
−6
]
Thermal
conductivity
[W/m
◦
C]
Specific
heat
[J/kg
◦
C]
20
210
1240
8.4
38.6
526
200
—
1080
11.0
38.2
566
300
181
1020
12.2
35.6
587
400
175
890
12.7
34.0
621
500
160
750
13.1
33.1
673
600
—
430
—
31.1
733
700
—
—
—
30.9
929
EXPERIMENTAL AND NUMERICAL CONDITIONS
MATERIAL
A low-alloy special purpose tool steel (55NiCrMoV7 equivalent to AISI
L6), with the nominal chemical composition (wt.%) 0.56 C, 1.70 Ni, 1.10 Cr,
0.5 Mo, 0.10 V, 0.20 Si, 0.70 Mn and Fe balance, was used as test material.
The specimens were hardened (austenitizing 1h at 875
◦
C , followed by oil
quenching) and tempered (2h at 560
◦
C ) to a nominal hardness of 42 HRC.
The properties of the tool steel at different temperatures are given in Table
1.
EXPERIMENTAL CONDITIONS
The test equipment is based on induction heating and surface strain mea-
surements through a non-contact laser speckle technique, which makes it
possible to calculate the strains induced in the specimen surface during ther-
mal cycling. The strain obtained by the laser speckle technique is the total
strain of the surface, which is composed of mechanical and thermal strain.
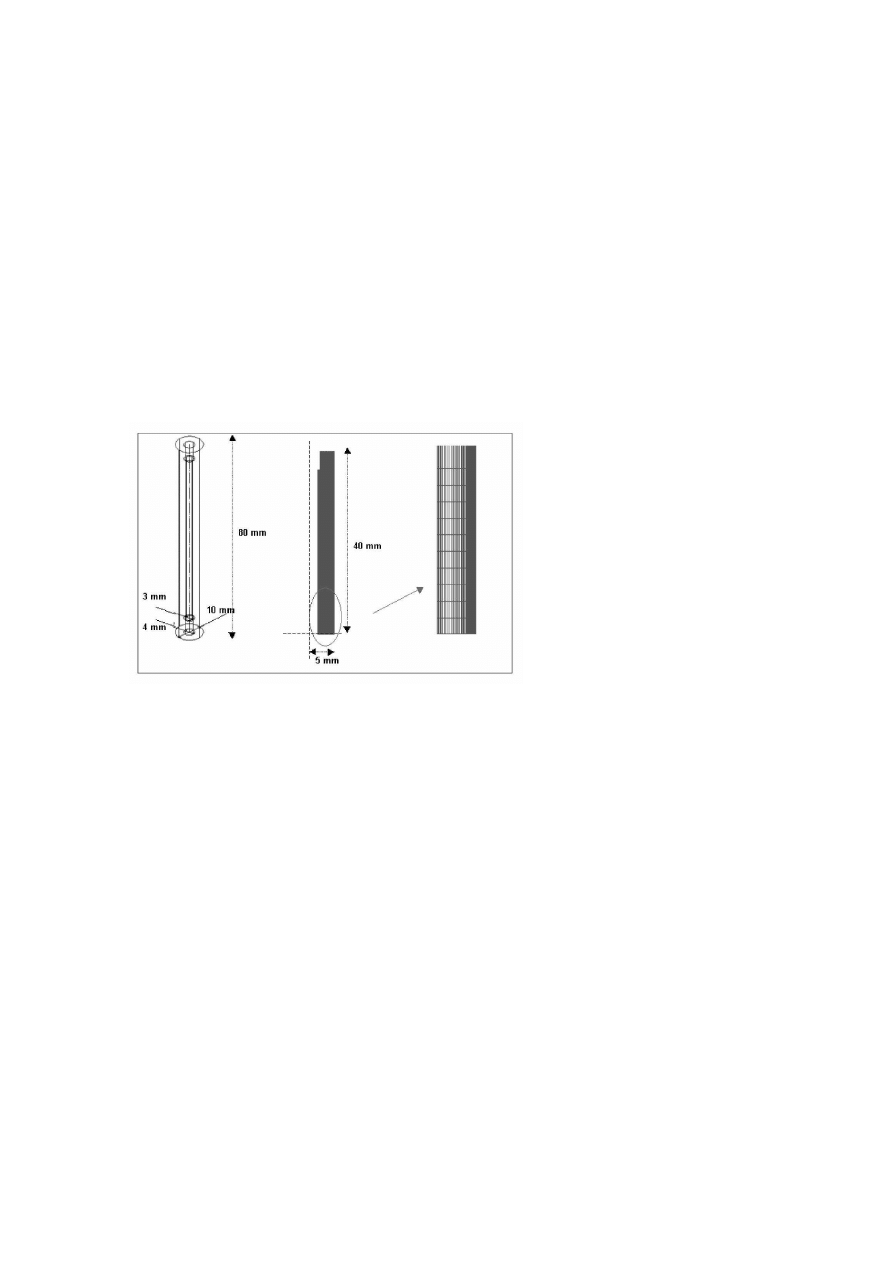
The test specimens were hollow cylinders with a diameter of 10 mm, a
length of 80 mm and having a 3 mm axial hole for internal cooling. An
induction unit (25 kW, 3 MHz) heats approximately 20 mm of the specimen
surface. Induction heating using a frequency of 3 MHz results in heating of
only a thin surface layer. Continuous cooling was performed by circulating

796
6TH INTERNATIONAL TOOLING CONFERENCE
Table 2.
Temperature cycles used in the thermal fatigue tests
Designation
Maximum
temperature
[
◦
C]
Minimum
temperature
[
◦
C]
Heating time
[s]
Total cycle time
[s]
500/fast
537
170
0.2
9.7
500/slow
495
180
1.1
12.1
600/fast
602
183
0.3
11.8
silicon oil of 60
◦
C through the specimen. More information is presented
elsewhere [3].
Three different temperature cycles were obtained by varying the max-
imum temperature and heating time, see Table 2. The cycles included a
steep ramp to the maximum temperature, followed by cooling to the min-
imum temperature. The total cycle time was set to obtain approximately
the same minimum temperature for all cycles. The three temperature cycles
are denoted as given in Table 2, where 500 and 600 denotes the maximum
temperatures, and fast and slow is short and long heating time, respectively.
Finally, K-type (Chromel-Alumel) thermocouples with a wire diameter of
0.13 mm were welded to the specimen to measure the surface temperature
in the middle of the specimen, as well as at several positions within 15 mm
from that position.
GENERAL METHODOLOGY OF THE NUMERICAL SIM-
ULATIONS
To get a more complete understanding of the stress-strain loops during
testing, numerical simulations of the sample behaviour were performed.
This is an approach, complementary to the experimental method, to evaluate
thermal loads at different locations on the surface as well as within the
specimen. The latter is quite difficult to achieve from an experimental point
of view.
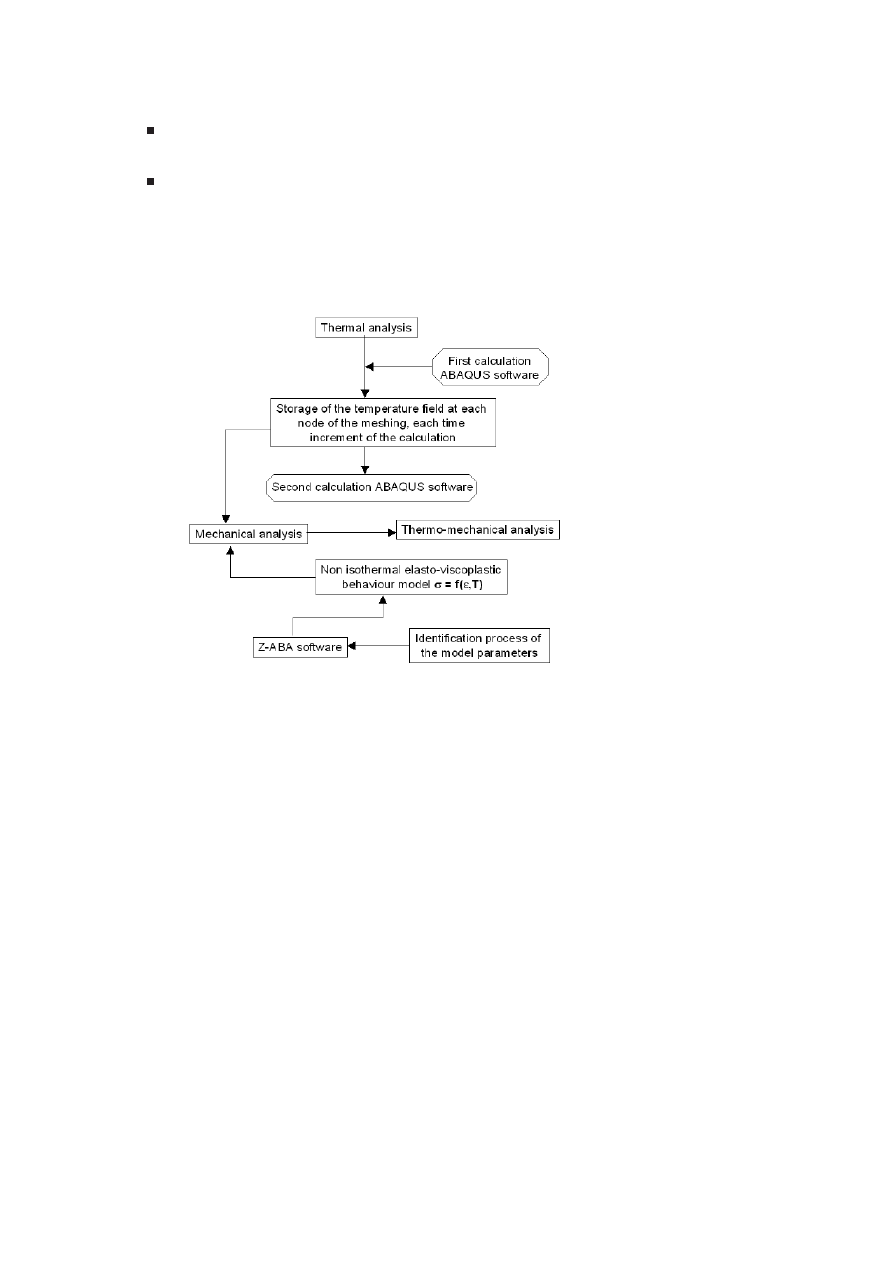
The numerical analysis using the ABAQUS finite element software was
made in two steps. First, a pure thermal analysis was performed to re-
produce the surface thermal loads and to obtain the temperature evolution
in the specimen. Second, a mechanical analysis was performed, using an
elasto-viscoplastic constitutive model and the previous thermal maps. Here,
Thermal Fatigue of a Tool Steel: Experiment and Numerical Simulation
797
the numerical simulation methodology assumes a weak coupling between
thermal and mechanical analysises.
Due to the axisymmetrical geometry of the specimen, only a quarter of
the specimen is meshed with four node rectangular axisymmetric elements
and used in the calculations. The sample geometry and the axisymmetrical
meshing is shown in Fig. 1. The meshing is refined near the centre and near
the surface of the sample in order to take into account the thermal gradient,
why the surface element thickness is only 2 µm. A comparison with an
analytical solution [4] for the case of a semi- infinite medium was used to
validate the accuracy of the meshing refinement.
From the numerical simulations, temperature-strain loops at several loca-
tions in the specimen were obtained, and they were compared to those from
the experimental tests. In addition, stress-strain loops, which give useful
information with respect to heat checking occurrence, were also calculated.
Figure 1.
Three dimensional specimen design and axisymmetrical meshing.
Thermal analysis conditions
Three different thermal cycles were investi-
gated, using the same maximum temperatures and heating rates as obtained
in the experimental study (see Table 2). The following boundary conditions
were considered for thermal analysis.

798
6TH INTERNATIONAL TOOLING CONFERENCE
Table 3.
Parameters applied in the numerical simulations
Designation
Oil exchange
coefficient
[W/m
2
K]
Air exchange
coefficient
[W/m
2
K]
Heat flux
[MW/m
2
]
500/fast
2200
20
8.37
500/slow
2200
20
2.28
600/fast
2200
20
7.65
Convective exchange conditions to describe the internal oil cooling
and the external air cooling. The exchange coefficients (oil and air)
were estimated from literature (hollow cylinder) [5]. After approxi-
mating the Prandtl, Nusselt and Reynolds numbers and considering oil
properties, values retained in this simulation are reported in Table 3.
A radiative condition was applied on the heating surface. A constant
black body emissivity (equal to 1) was used, since the specimens were
pre-oxidised prior to the thermal fatigue tests.
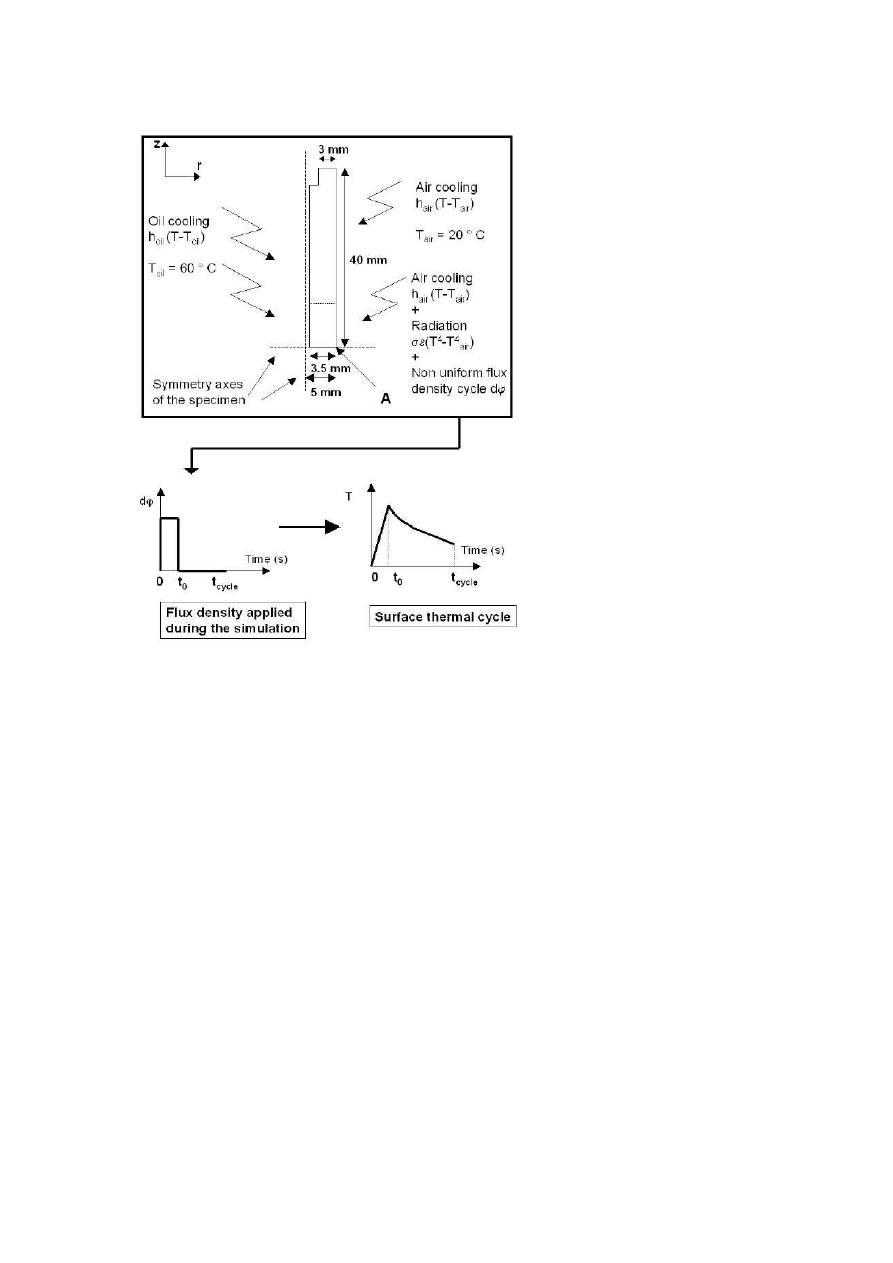
Surface heating was introduced through a flux density cycle, which
was non-uniform on the heating surface in order to reach a better
fitting with the experimental thermal cycles. The flux density for the
different thermal cycles at the point A (the middle location) is reported
in Table 3.
The boundary conditions considered in the thermal analysis are sum-
marised in Fig. 2.
Final mechanical results are directly related to the reliability of the tem-
perature distribution of the specimen. Several measurements have been
performed along the specimen axis beneath the induction coil to obtain the
surface temperature. On the upper zone, an increased temperature was ob-
served at 6 mm from the middle of the sample, whereas at the lower zone
no temperature increase was measured. Thus, the surface temperature dis-
tribution is non-uniform, therefore in the simulation, flux density was pro-
gressively adjusted in order to reach a best fitting with the surface thermal
cycles at all locations. The flux amplitude was adjusted to increase from the
middle of the specimen to the location 6 mm, then decreasing to a distance
Thermal Fatigue of a Tool Steel: Experiment and Numerical Simulation
799
Figure 2.
Summary of the boundary conditions considered in the thermal analysis.
equal to 15 mm from the middle position The shape of the flux density is
defined previously, see Fig. 2.
Mechanical analysis conditions
A three dimensional elasto-viscoplastic
model is implemented in ABAQUS [6] with the Z-ABA [7] software. Model
description and parameters identification process are reported elsewhere [8].
It includes two different internal variables:
800
6TH INTERNATIONAL TOOLING CONFERENCE
A kinematic component (back stress) allows the description of cyclic
plasticity.
An isotropic component (drag stress) describes the cyclic softening.
These components accounts for properties and complex load conditions
of martensitic tool steels in hot work applications.
The general methodology of the weak coupling between thermal and
mechanical calculations is presented in Fig. 3.
Figure 3.
Methodology of the thermo-mechanical calculation.
RESULTS
EXPERIMENTAL SURFACE STRAIN RESPONSE
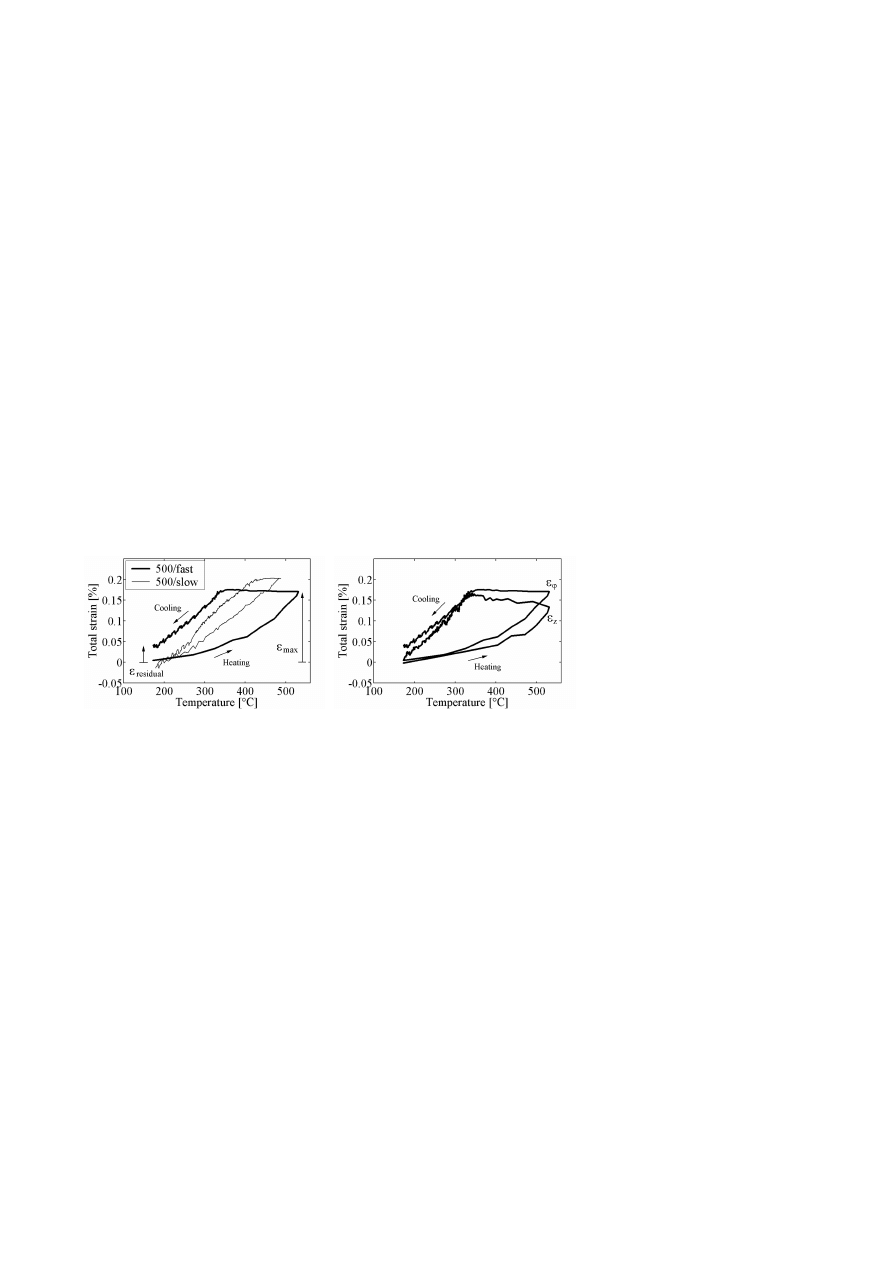
Typically, the surface strain obtained by the laser speckle technique in-
creases with temperature, followed by an almost constant or a slightly in-
Thermal Fatigue of a Tool Steel: Experiment and Numerical Simulation
801
creasing strain level during the first part of the cooling, see Fig. 4. Sub-
sequently, the surface strain decreases with temperature. It is seen that the
strain loops may end with a residual surface strain. The following strain loop
begins where the previous loop ended. A difference in the surface strain re-
sponse in the tangential and axial direction, respectively, is also observed,
see Fig. 4b.
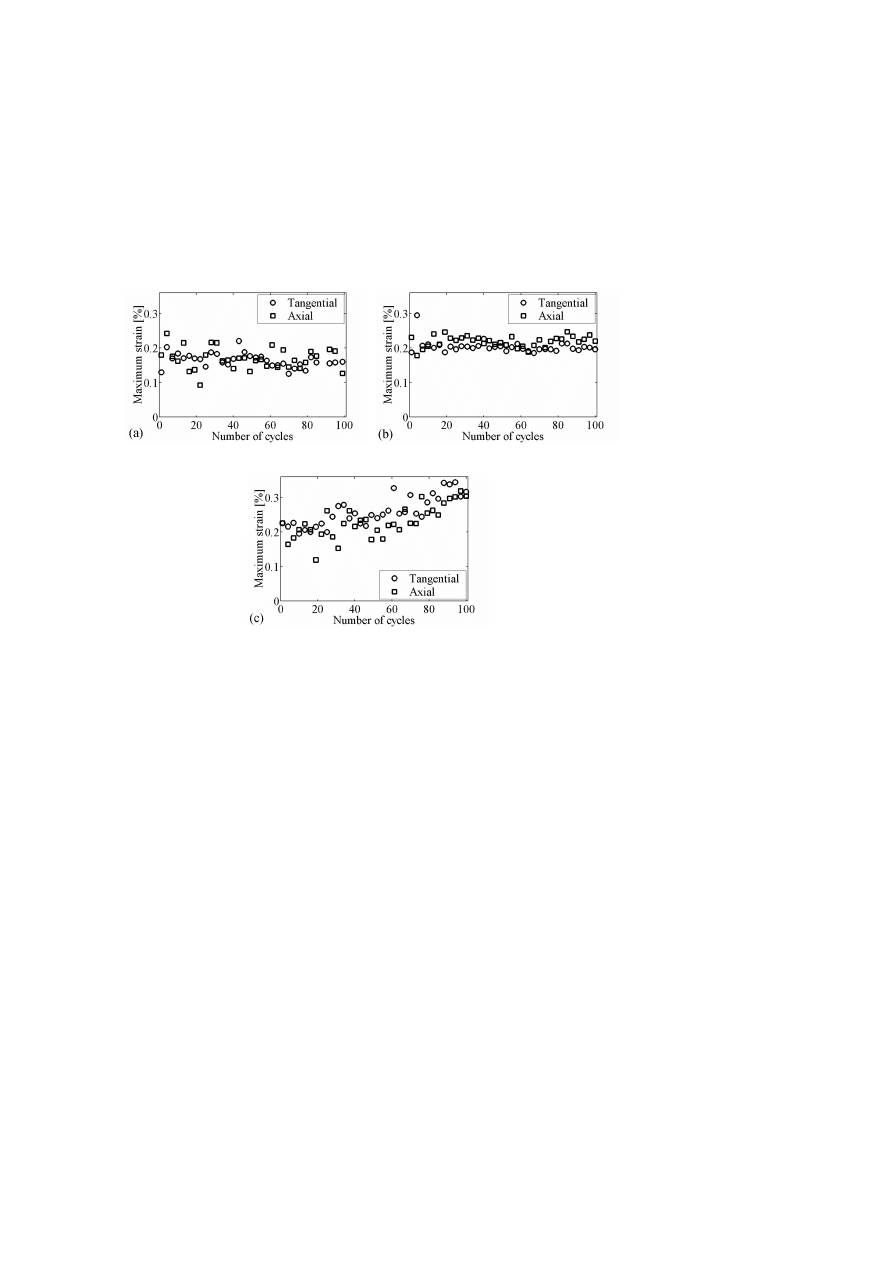
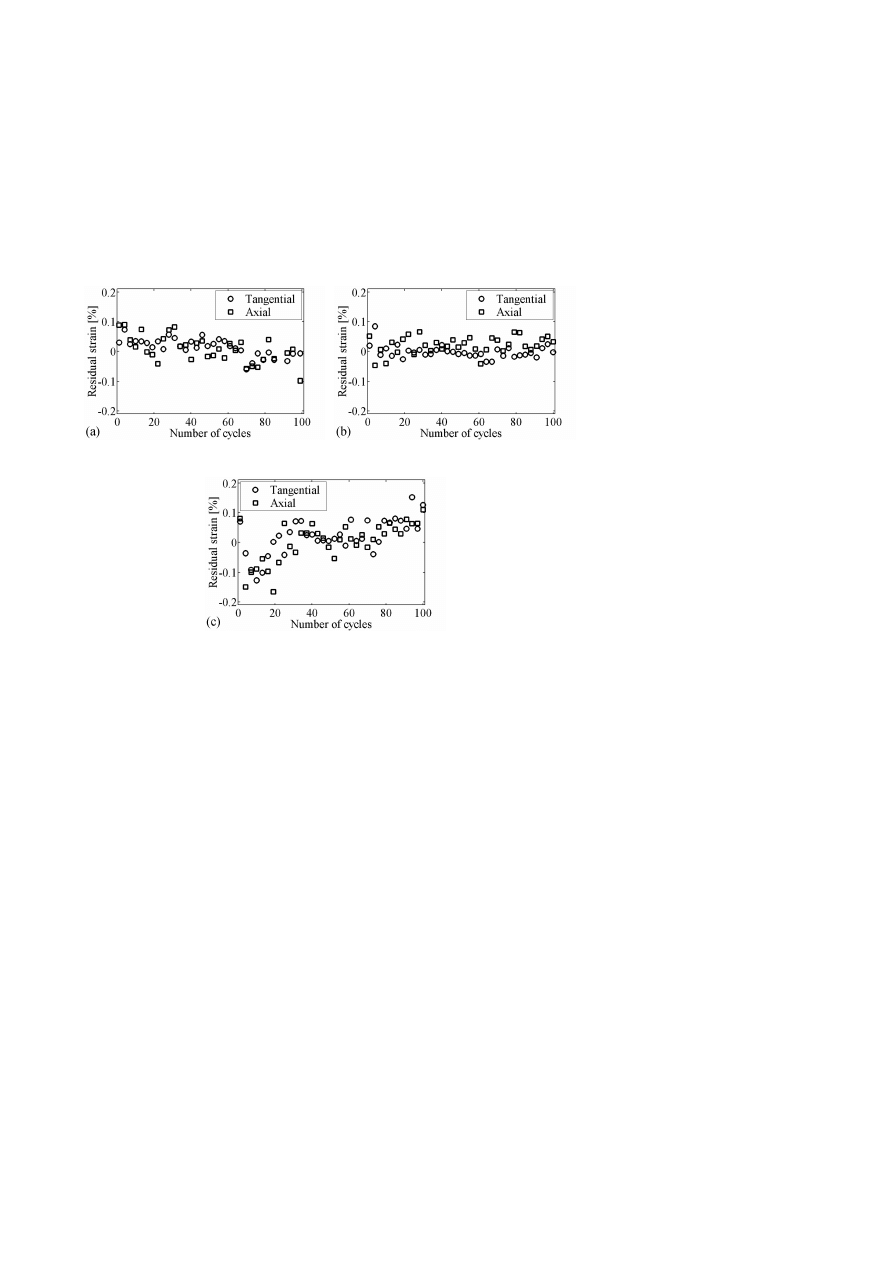
From the surface strain response such as those of Fig. 4, the maximum
surface strain (ε
max
) and the residual surface strain ( ε
residual
) of each cycle
can be deduced and represented as a function of number of cycles, see Figs. 5
and 6. For the 500/fast and 500/slow cycles, it is seen that the maximum
surface strains are approximately constant with number of cycles, whereas
an increase of the maximum strain is observed for the 600/fast cycle, see
Fig. 5. It is also seen that the maximum strain is somewhat higher for the
500/slow cycle than for the 500/fast cycle (see also Fig. 4a), and that the
strain level during the initial cycles for the 600/fast cycle is approximately
equal to that for the 500/slow cycle.
The residual surface strain for the 500/fast cycle has a tendency to decease
with number of cycles, whereas that for the 500/slow cycle seem to fluctuate
around zero residual strain, see Fig. 6. For the 600/fast cycle, an initial
decrease of the residual surface strain with number of cycles is seen, followed
by an increasing level with number of cycles.
(a)
(b)
Figure 4.
Example of surface strain response during thermal cycling (cycle 55). (a) Com-
parison of surface strain response for the 500/fast and 500/slow cycle, respectively (tangential
strain), including definition of maximum strain (ε
max
) and residual strain (ε
residual
). (b)
Comparison between tangential strain (ε
ϕ
) and axial strain (ε
z
) for the 500/fast cycle.
802
6TH INTERNATIONAL TOOLING CONFERENCE
(a) 500/fast cycle.
(b) 500/slow cycle.
(c) 600/fast cycle.
Figure 5.
Maximum surface strain vs. number of cycles.
Thermal Fatigue of a Tool Steel: Experiment and Numerical Simulation
803
(a) 500/fast cycle.
(b) 500/slow cycle.
(c) 600/fast cycle.
Figure 6.
Residual surface strain vs. number of cycles.
804
6TH INTERNATIONAL TOOLING CONFERENCE
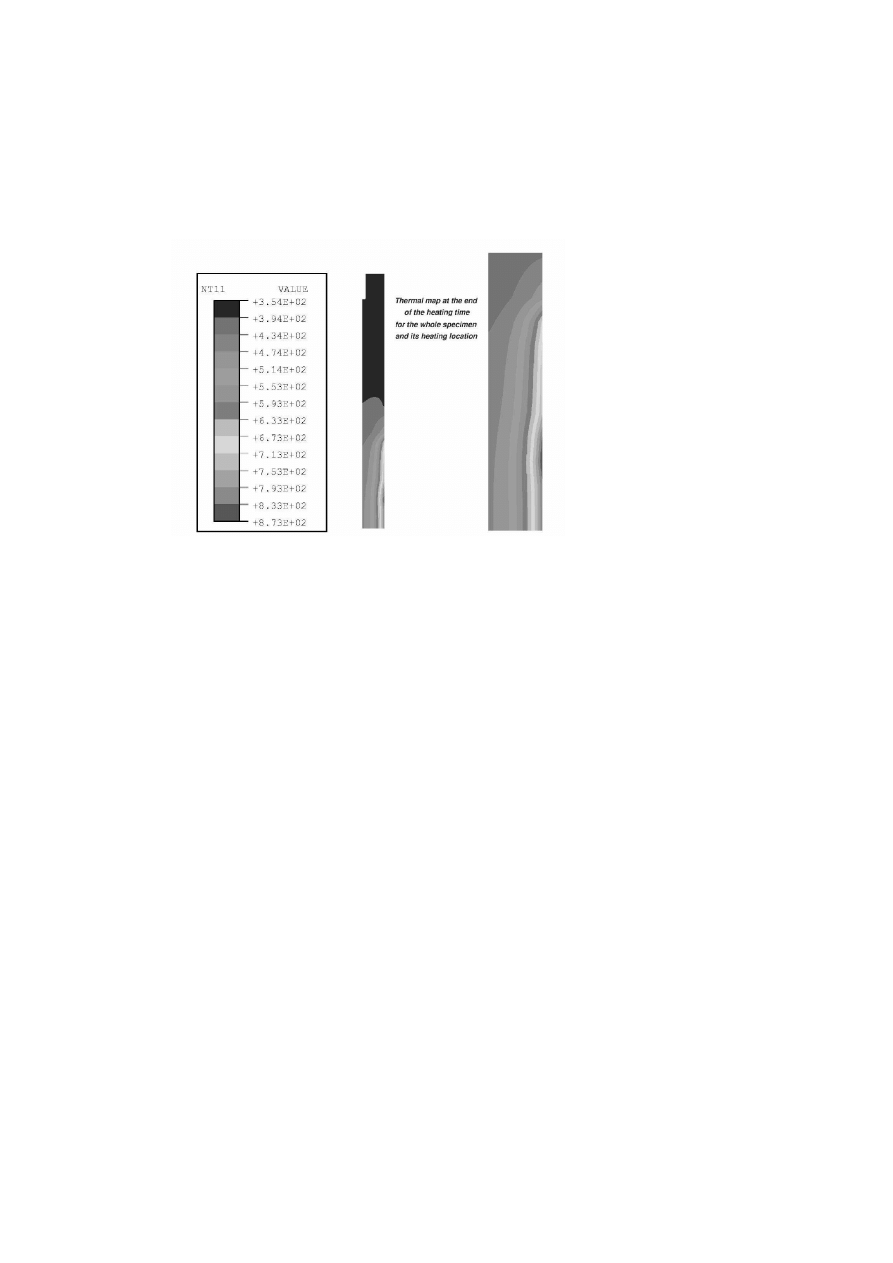
THERMAL ANALYSIS OF NUMERICAL SIMULATION
The output of the thermal analysis is the temperature field in the specimen
during the thermal cycling. An example is given in Fig. 7, where the thermal
map at the end of the heating period (time t
0
) for the 500/fast thermal cycle
is shown.
Figure 7.
Thermal map [Kelvin] at the end of the heating time (0.2 s) for the 500/fast
cycle.
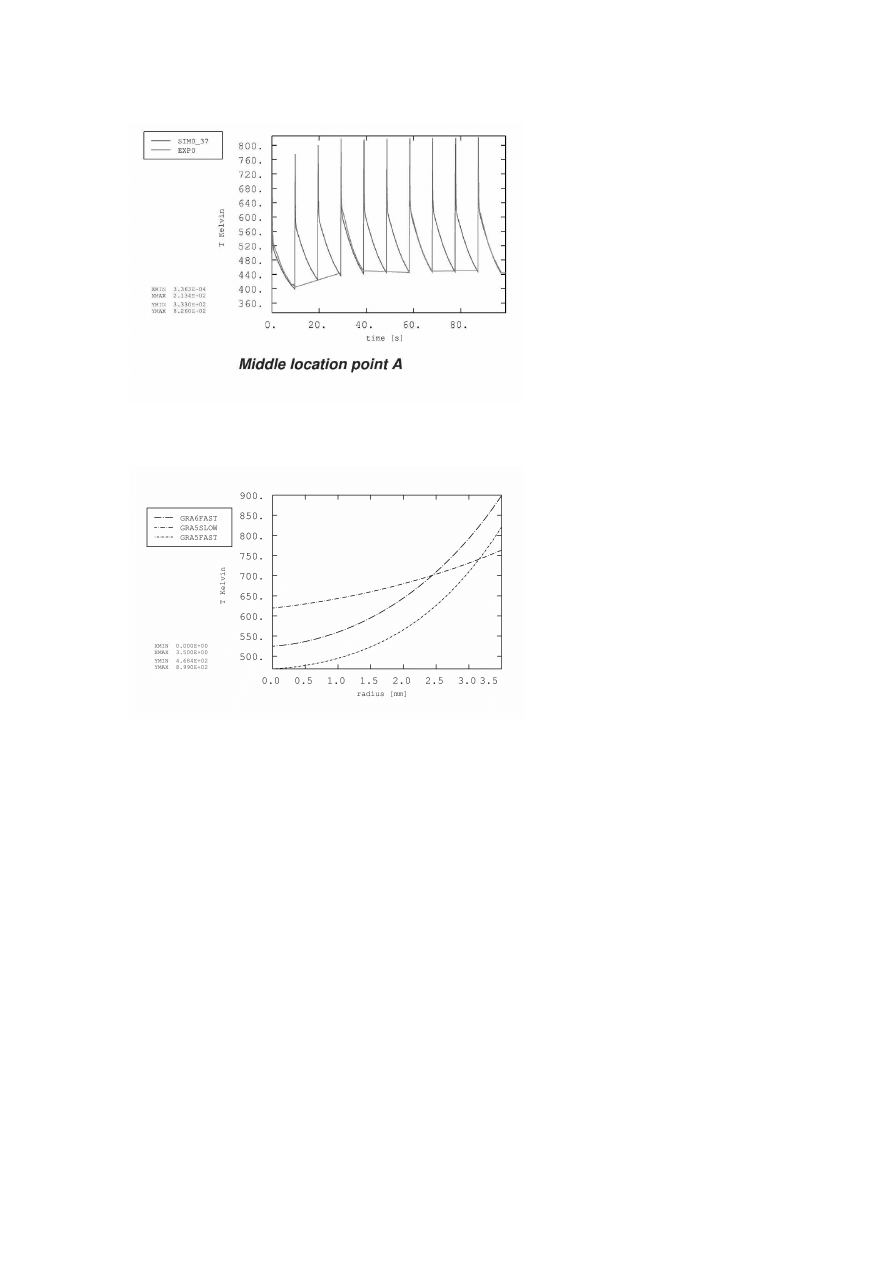
Figure 8 shows the evolution of the temperature on the surface of the
specimen and compares simulation and experiment. In Fig. 9 is the radial
temperature distribution at maximum surface temperature shown for the
three different thermal cycles. A comparison between experimental and
simulated temperature cycles is shown in Fig. 10, where the effect of the
locally increased temperature is included.
RESULTS OF MECHANICAL SIMULATION
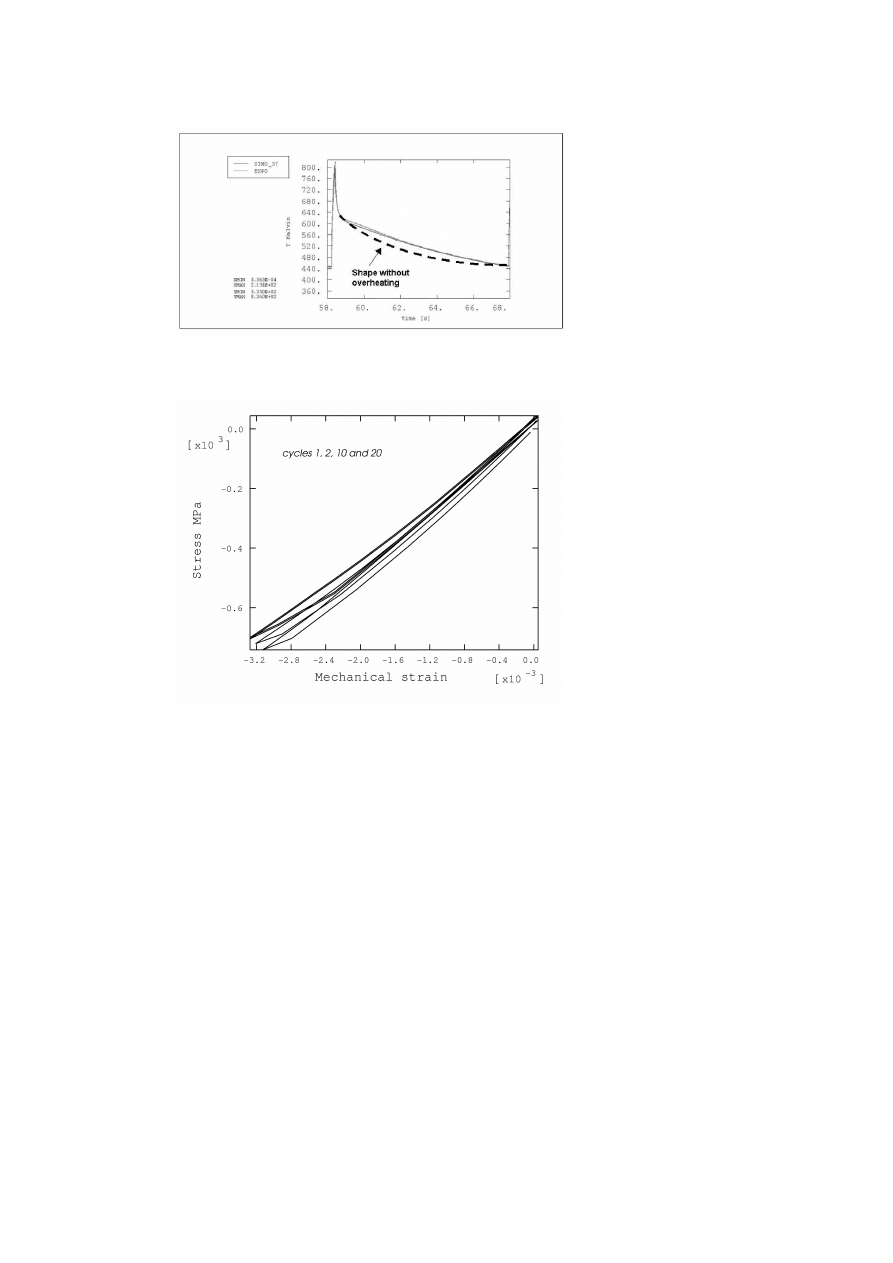
As an example, axial stress versus mechanical strain for cycle number 1,
2, 10 and 20, are reported in Fig. 11 for point A (defined by Fig. 2) for fast
heating. It shows plastic accommodation of the material in the compressive
range.
Thermal Fatigue of a Tool Steel: Experiment and Numerical Simulation
805
Figure 8.
Evolution of surface temperature for the 500/fast cycle (comparison experi-
ment/simulation).
Figure 9.
Evolution of the radial temperature within the specimen (at the end of the heating
time) for the three different thermal cycles.
DISCUSSION
THERMAL ASPECT
First, the calculated surface temperature distribution can be compared
with the experimental measurements, e.g. the surface temperature history
806
6TH INTERNATIONAL TOOLING CONFERENCE
Figure 10.
Typical cooling curve due to the overheating phenomenon (500/fast cycle).
Figure 11.
Plastic accommodation of the material for the 500/fast thermal cycle (cycles
1, 2, 10 and 20).
of Fig. 8. Here, the initial temperature cycle is at a lower level, but it
increases with time and reaches a more stable temperature cycle within 10
thermal cycles. Experiment and simulation compare well to each other.

Thermal Fatigue of a Tool Steel: Experiment and Numerical Simulation
807
Radial temperature profile evolution is reported in Fig. 9 for the mid plane
at time t
0
(maximal temperature at the end of the heating period) and for the
three cycles. The most important gradient is observed for the faster heating
time cycle (0.2 s) and a maximal temperature of 500
◦
C . The value of the
cycle with a maximal temperature of 600
◦
C is lower because its heating time
is longer (0.3 s).
Moreover, the increased temperature in the upper portion beneath the in-
duction coil, seems to have a significant influence on the shape of the thermal
cycles. Indeed, during each cycle, a fast cooling after the cycle maximum
temperature is observed during a few milliseconds followed by a change of
the slope of the cooling rate, see Fig. 10. This phenomenon is only reached
when the localized increased temperature effect is introduced, whereas a
continuous exponential shape is calculated if not taken into account.
Note that only a direct surface thermal impact is reproduced by the simu-
lation. Indeed, the in-depth magnetic induction (as used in the experiments)
is not considered in this work. The average depth of the surface layer, af-
fected by the high frequency induction used in the tests, is estimated to only
about 10 µm using the magnetic properties of the martensitic steel around
400
◦
C [9].
MECHANICAL ASPECT
The typical appearance of the surface strain response during thermal cy-
cling is exemplified in Fig. 4. During heating, the total strain (ε
tot
) of the
surface, composed of mechanical strain (ε
mech
) and thermal strain (ε
th
)
according to Eq. 1 [10], increases with temperature.
ε
tot
= ε
mech
+ ε
th
(1)
The response during heating is a result of the constraint conditions of the
cooler bulk material, which retains the expansion of the surface. During
the initial part of the cooling, the surface contracts simultaneously as the
bulk material expands and, consequently, maintain or slightly increase the
total strain level. Thereafter, both the surface and bulk are contracting. From
Fig. 4b, it is seen that the surface response in the tangential and axial direction
is different. This indicates that there is a difference in constraint conditions
between the tangential and axial direction, as a result of the temperature
distribution within the specimen.
808
6TH INTERNATIONAL TOOLING CONFERENCE
The temperature cycle with the long heating time (1.1 s) to 500
◦
C increases
the slope of the strain response during heating as well as the maximum level
of the surface strain, as compared to those for the short heating time (0.2 s),
see Figs. 4a and 5a,b. The long heating time increases the contribution from
the interior thermal expansion of the material and, therefore, decreases the
mechanical surface strain as compared to the short time. The mechanical
strain generates the stress which contributes to mechanical damage through
fatigue or creep. The mechanical surface strain imposed during heat cy-
cling can be estimated based on the experimentally obtained surface strain
response, temperature cycle, and thermal expansion coefficient of the tool
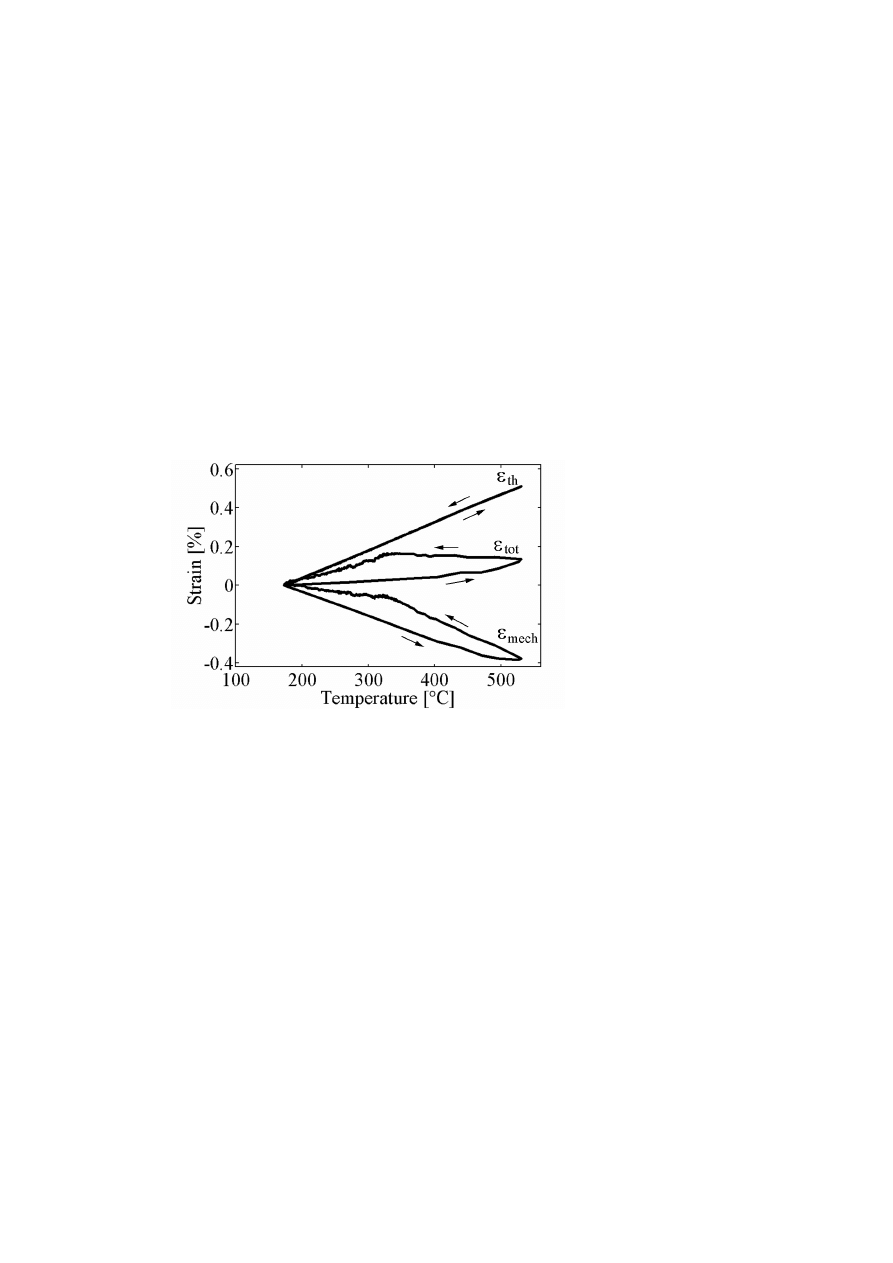
material. A mechanical surface strain response during thermal cycling to
500
◦
C is exemplified by Fig. 12. The figure also illustrates the relation be-
tween the total, thermal and mechanical surface strain. From Fig. 12, it
is seen that a maximum compressive mechanical strain of about 0.38% is
imposed. This magnitude in compressive mechanical strain is somewhat
higher than that obtained by the numerical simulations, cp. Fig 11.
Figure 12.
Example of total (ε
tot
), thermal (ε
th
), and mechanical (ε
mech
) surface strain
response for the 500/fast cycle (axial strain).
From the surface strain response such as those of Fig. 4, it is expected
that an elastic behaviour during the heat cycling results in zero residual
surface strain at the end of the strain history. The residual strain, see Fig. 6,

Thermal Fatigue of a Tool Steel: Experiment and Numerical Simulation
809
represents a cyclic creep strain and it is governed by the plasticity of the
material and the constraint conditions [11].
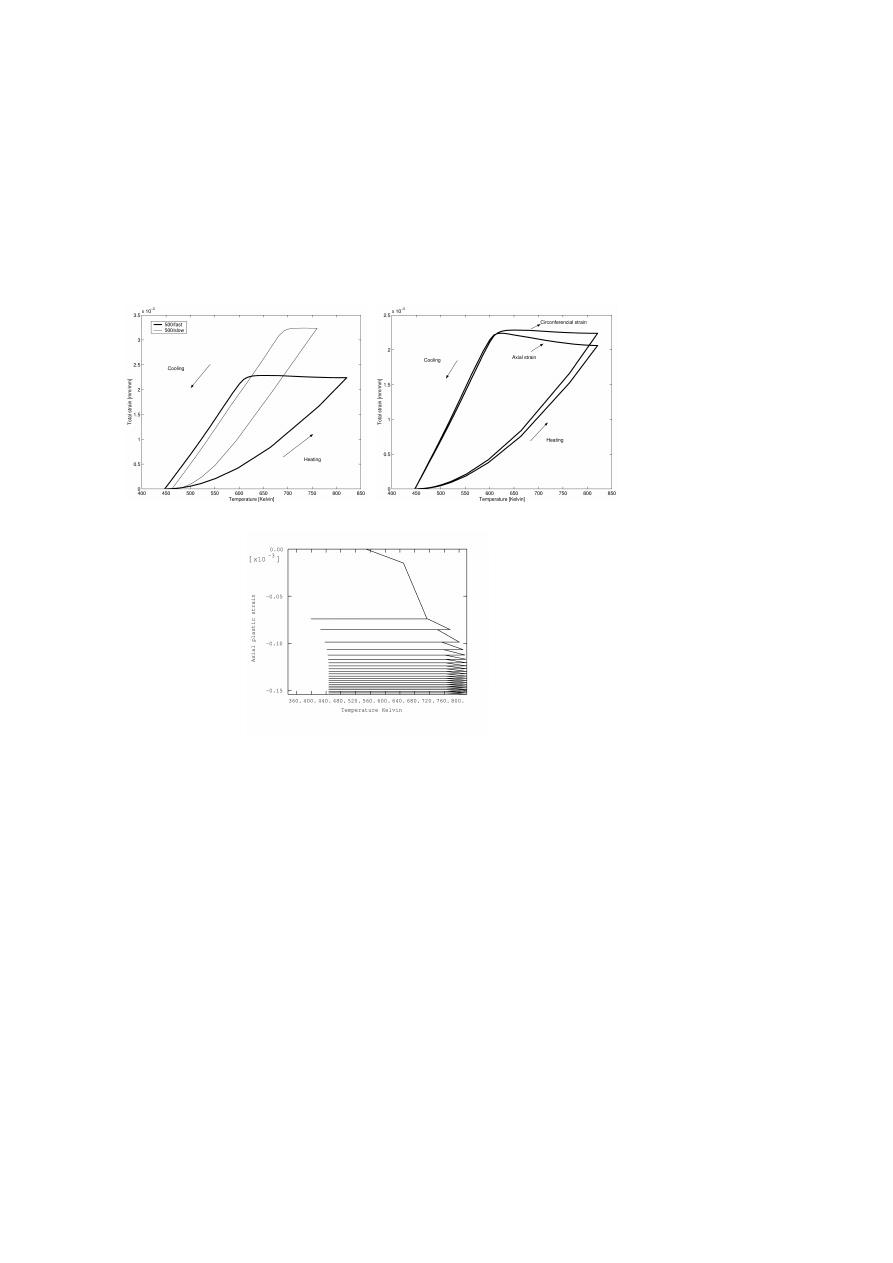
From a numerical aspect, the 20 first cycles were simulated. The experi-
mental phenomena previously described were equally observed (see Fig. 13).
Indeed, the shape of the loops for the different cycles (500
◦
C slow and
fast) are in a good correlation with experiment. Numerical simulation con-
firms the experimental difference between tangential and axial responses
(see Fig. 13b). In the slow heating case, simulation reveals that no plastic-
ity occurs during all the thermal cycles. So here, the shape of the loops is
only due to thermo-elasticity. On the contrary, in the fast heating case, an
important plastic strain is calculated at the first cycle, which subsequently
decreases with the number of cycles (see Fig. 13c). Thus, the shape of the to-
tal strain loop can be explained not only by the thermal expansion variation,
but also by a compressive plastic strain effect.
Figure 14 shows the evolution of maximal and residual strains for the
500/slow and fast configuration. Same trends, as the previously reported
experimental ones, are observed for maximal strain even if the calculated
level are higher (between 10 to 20%). For the two simulated configurations,
there is a stabilisation during the 10 first cycles and values are constant
afterwards. Nevertheless, the calculated residual strain tend to zero for the
two test configurations; similar to experimental results.
Several aspects may be considered to explain differences between calcu-
lated and experimental results:
Error in the calculated bulk temperature distribution where no exper-
imental correlation has been made.
Incomplete model formulation.
Error in the experimental strain measurements.
Since the thermal cycling to 500
◦
C is below the tempering temperature
(560
◦
C ) of the tool steel, microstructural stability is expected. However,
when the material is exposed to heat cycling above the tempering tempera-
ture microstructural stability cannot be maintained. The maximum surface
strain increases with number of cycles during thermal cycling to 600
◦
C ,
whereas not at the lower temperature 500
◦
C (see Fig. 5), due to different
yield conditions and increased softening at the higher temperature. No nu-
merical result for the 600/fast cycle are reported in this paper. Indeed, the
810
6TH INTERNATIONAL TOOLING CONFERENCE
behaviour model is not accurate when important microstructural evolutions
occur. However, it can be improved in order to take into account these
evolutions [12].
IMPLICATIONS FOR THE USE OF TOOLS
The difference in results between slow and fast heating rates illustrates
the effect of thermal gradients in a tool. The fast heating rate induces a
(a)
(b)
(c)
Figure 13.
Example of calculated surface strain response during thermal cycling. (a)
Comparison of surface strain response for the 500/fast and 500/slow cycle, respectively
(tangential strain). (b) Comparison between tangential strain and axial strain for the 500/fast
cycle. (c) Evolution of the axial plastic strain vs. temperature.

Thermal Fatigue of a Tool Steel: Experiment and Numerical Simulation
811
(a)
(b)
Figure 14.
(a) Maximum surface strain vs. number of cycles for the 20 first cycles (500/fast
and 500/slow cycle). (b) Residual surface strain vs. number of cycles for the 20 first cycles
(500/fast and 500/slow cycle).
larger gradient leading to a higher degree of constraint and higher mechani-
cal stresses and strains, why there is a greater risk of plastic deformation and
surface damage. Here, the 500/slow cycle is approximately thermoelastic,
while the 500/fast cycle induces plastic deformation. For tooling applica-
tions the thermal load may be converted into typical heat inputs, dependent
on melt temperature, melt thermal capacity and work piece wall thickness.
The heat input used in the present tests (2.2–8.4 MW/m
2
), may be related
to typical figures in tooling applications of forging (2 MW/m
2
) [13], alu-
minium die casting (5 MW/m
2
) [14], and brass die casting (9.8 MW/m
2
)
[15].
Often in tooling applications as die casting, there is an extra cooling of
the tool surface by spraying, the intention being to cool or to lubricate. This
will introduce an effect of reversed plasticity, furthermore increasing the
mechanical damage in the die.
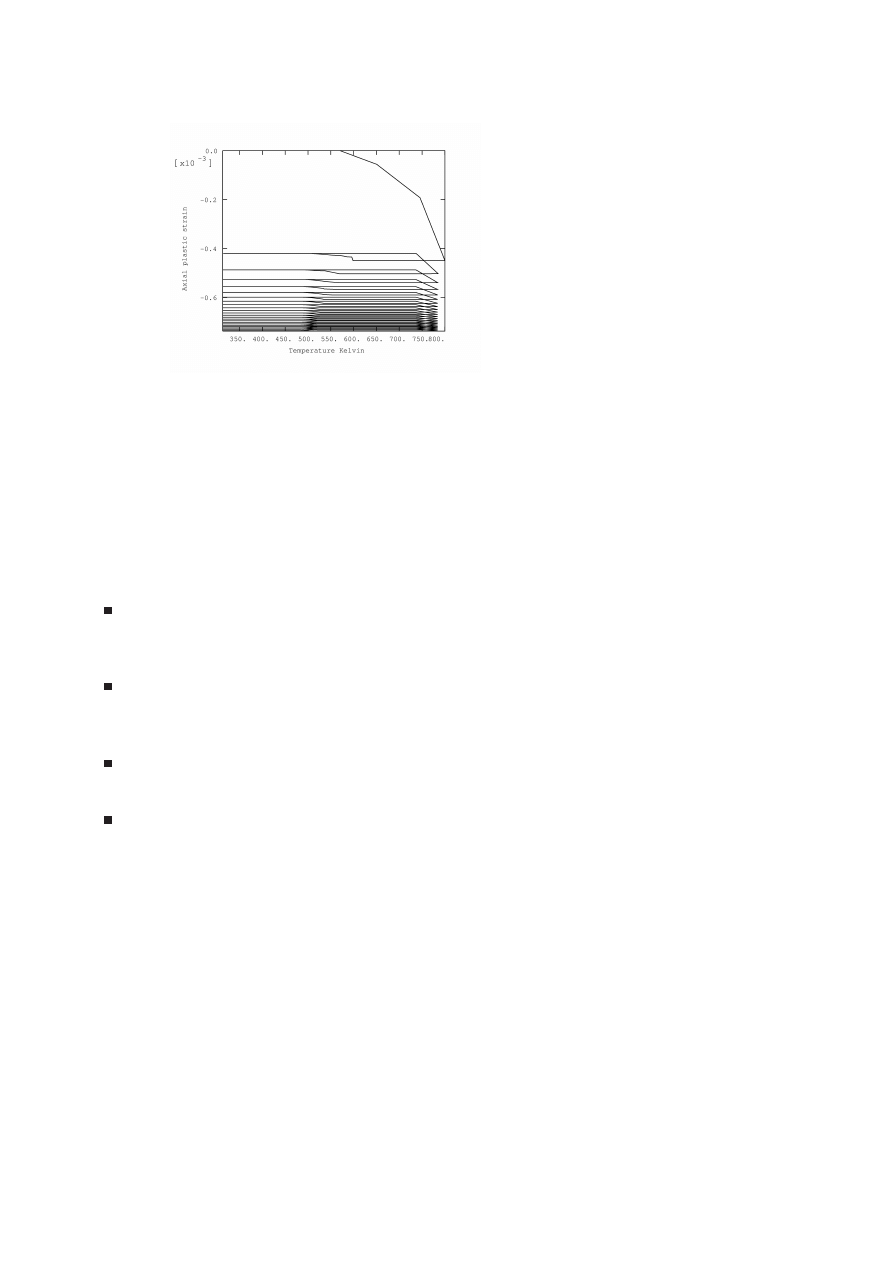
As an example, the impact of the industrial spraying process has been in-
vestigated using the thermal cycle with a maximal temperature of 500
◦
C and
a fast heating. In this case, the external exchange coefficient which repro-
duces the air cooling is increased (equal to the oil coefficient) in order to
take spraying into account. Thus, the cooling at point A is faster than in the
previous case (see Fig. 15), and the minimum temperature reaches the oil
temperature. The changes in cooling conditions have a significant impact

812
6TH INTERNATIONAL TOOLING CONFERENCE
Figure 15.
Evolution of the thermal cycle in the case of the spraying process.
on the mechanical calculation, where the behaviour model allows to confirm
the reversed plasticity, see Fig. 16. In this case, a very important compres-
sive plastic strain level is also observed at the first cycle (ten times higher)
in comparison with the previous thermal cycles investigated, see Fig. 13c,
which is due to the very drastic cooling occurring in the spraying process.
Thermal Fatigue of a Tool Steel: Experiment and Numerical Simulation
813
Figure 16.
Evolution of the axial plastic strain versus temperature in the case of the
spraying process (reversed plasticity).
CONCLUSIONS
In this study, the surface strain response of a tool steel during thermal
fatigue was experimentally evaluated. In addition, the non-isothermal stress-
strain behaviour of the material during thermal cycling was numerically
simulated using an elasto- viscoplastic constitutive model. The following
conclusions can be drawn.
The cyclic surface strain response of a tool steel exposed to thermal
cycling is significantly influenced by the maximum temperature and
heating rate of the applied heat cycle.
Numerical simulation is able to provide the thermal map of the speci-
men validated by comparison with experimental surface temperature
measurements.
The model implemented in ABAQUS translates the strain levels and
gives a good description on the shape of the strain loops.
It allows the calculation of stress, mechanical and plastic strain com-
ponents which can afterwards be used for lifetime prediction.

814
6TH INTERNATIONAL TOOLING CONFERENCE
Simulation can be used for parametric study and is, in this way, an
interesting tool to define/optimise experimental test configurations, as
well as for optimising in-service conditions of hot-work tools.
REFERENCES
[1] J.R. DAVIS (Ed.), in "ASM Speciality Handbook, Tool Materials" (ASM International,
Materials Park, Ohio, 1995) p. 218, p. 251.
[2] Z. ZHANG, D. DELAGNES and G. BERNHART, in International Journal of Fatigue
24(2002) p. 635.
[3] A. PERSSON, J. BERGSTRÖM and C. BURMAN, in Proceedings of the 5th Inter-
national Conference on Tooling, Leoben, 1999, p. 167.
[4] J.F. SACADURA, in ”Initiation aux transferts thermiques ” (Lavoisier, Paris, 1993)
p. 225.
[5] M. NECATI OZISIK, in ”Heat conduction”, 2nd edition, a wiley interscience publi-
cation, p. 59.
[6] HIBBITT, KARLSSON and SORENSEN, in ”ABAQUS/Standard” User manual
[7] Z-SET, Ecole Nationale Supérieure des Mines de Paris – Northwest Numerics and
Modelling, http://www.nwnumerics.com/ .
[8] V. VELAY, G. BERNHART, Z. ZHANG and L. PENAZZI, in proceedings of the
Conference on Applied Mechanics, Materials Science, Joining and Forming Processes,
Paderborn, 2002, p.64.
[9] S. JEAN, in Méthodologie d’exploitation mécanique et microstructurale d’un essai de
fatigue thermique: application à l’étude du faiencage d’un acier pour outil de forge à
chaud, PhD thesis, Ecole des Mines de Paris, 1999.
[10] H. SEHITOGLU, in "ASM Handbook, Vol. 19" (ASM International, Materials Park,
Ohio, 1996) p. 527.
[11] S. SURESH, in "Fatigue of Materials, 2nd ed." (Cambridge University Press, Cam-
bridge, 1998).
[12] Z. ZHANG, D. DELAGNES and G. BERNHART, in Proceedings of the 6th Interna-
tional Tooling Conference, Karlstad, September 2002.
[13] Z. MALINOWSKI, J.G. LENARD and M.E. DAVIES, in Journal of Materials Pro-
cessing, 41(1994) p. 125, p. 142.
[14] V.VENKATASAMY, J.BREVICK, C.MOBLEY and G. PRIBYL, in Proceedings of
the 19th International Die Casting Congress and Exposition, Minneapolis, 1997, p.
151.
[15] A. PERSSON, S. HOGMARK and J. BERGSTRÖM, Submitted to Journal of Mate-
rials Processing Technology.
Wyszukiwarka
Podobne podstrony:
EDM OF TOOL STEEL
53 755 765 Effect of Microstructural Homogenity on Mechanical and Thermal Fatique
43 597 609 Comparison of Thermal Fatique Behaviour of Plasma Nitriding
50 707 719 Thermal Fatique and Softening Behaviour of Hot Work Steels
84 1199 1208 The Influence of Steel Grade and Steel Hardness on Tool Life When Milling
6 63 76 Influence of Surface Heat Treatment on Thermal Fatique Behaviour
55 781 792 Computer Aided Evaluation of Thermal Fatique Cracks on Hot Works
49 687 706 Tempering Effect on Cyclic Behaviour of a Martensitic Tool Steel
53 755 765 Effect of Microstructural Homogenity on Mechanical and Thermal Fatique
51 721 736 Evaluation of the Cyclic Behaviour During High Temperature Fatique of Hot Works
więcej podobnych podstron