
341
R. Przybylak et al. (eds.), The Polish Climate in the European Context:
An Historical Overview
, DOI 10.1007/978-90-481-3167-9_15,
© Springer Science + Business Media B.V. 2010
15.1 Introduction
The Cracow series of nephologic and heliographic observations is unique on a
global scale, due to its uniformity as to the place of measurements, their uninter-
rupted continuity, as well as its length and the reliability of data. Only on the basis
of long and uninterrupted climatologic series is it possible to obtain reliable infor-
mation about trends and tendencies with a certain level of significance and Cracow’s
observations belong to such a series.
The present study aims at characterizing the multi-annual variability of cloudi-
ness and sunshine duration in Cracow on the basis of archive data from the
1826–2005 period.
15.2 Cloudiness
The commencement of the uninterrupted observation series dates back to 1826.
However, “The records of daily meteorological observations” (“Dzienniki co-
dziennych spostrze
żeń meteorologicznych”) only includes the results of fixed time
observations of cloudiness on a 0–10 scale starting on 1 December 1862.
The present study uses archive materials from the following sources: the cloudi-
ness in the 1826–1852 period has been reconstructed on the basis of a publication
P. Lewik
Pedagogical University of Cracow, Podchor
ążych 2, 30-084, Cracow, Poland
e-mail: lewik@up.krakow.pl
D. Matuszko
Institute of Geography and Spatial Management, Jagiellonian University, Gronostajowa 7,
30-387, Cracow, Poland
e-mail: d.matuszko@geo.uj.edu.pl
M. Morawska-Horawska
Institute of Meteorology and Water Management, P. Borowego 14, 30-215, Cracow, Poland
Chapter 15
Multi-Annual Variability of Cloudiness
and Sunshine Duration in Cracow Between
1826 and 2005
Piotr Lewik, Dorota Matuszko, and Maria Morawska-Horawska
342
P. Lewik et al.
by Wierzbicki
concerning the monthly number of clear and overcast days;
the data for 1853–1862 come from a manuscript by Karli
ński (Morawska
which lists the mean monthly values of cloudiness; and data for the years 1863–
2005 have been obtained from “The records of daily meteorological observations”
with fixed time observations of cloudiness. The amount of cloudiness in the initial
period of the observations has been reconstructed by means of two methods: by
using the following formula:
(
)
(
)
/
z
a b
s k
n
= + ⋅
−
s
– number of overcast days, k – number of clear days, n – number of days in a
given period,
a
, b – calculated numerical parameters (Gorczy
ński and Wierzbicka
, as
well as by applying regression analysis.
The regression equation has the following form:
z
a b k c s
= + ⋅ + ⋅
The cloudiness calculated by means of both methods was almost identical. The
correctness of the applied method has been verified on the basis of the values of
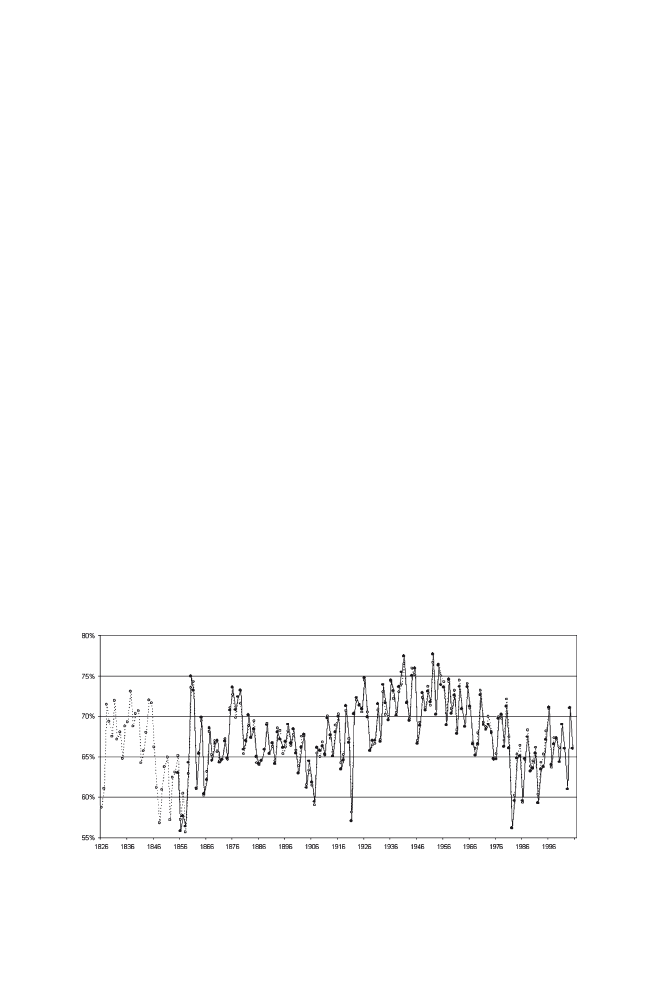
actual cloudiness for the 1854–2005 period (Fig.
). A similar course of oscilla-
tions has been registered in all months. Clear and overcast days for the entire
1826–2005 period have been identified according to the guidelines provided by
Wierzbicki
and valid in the nineteenth century. According to the guidelines,
the mean daily cloudiness on clear days equalled from 0.0 to 3.3, whereas on over-
cast days it amounted to 6.7–10.0. The application of the data concerning the num-
ber of clear and overcast days permitted to lengthen the examination period by 37
years, that is move back to 1826.
The amount of cloudiness recorded from 1826 to 1852 has been assessed on a
4-degree scale (Morawska
, from 1853 to 31 December 1990 on a 1–10 scale
Fig. 15.1
Mean annual cloudiness in Cracow between 1853 and 2005 – actual and calculated by
extrapolation for the years 1826–2005
343
15 Multi-Annual Variability of Cloudiness and Sunshine Duration
and from 1 January 1991 onwards on a 1–8 scale. In order to obtain comparable
data, the values of cloudiness have been standardized according to a 10-degree
scale and converted to percentage values.
The mean annual cloudiness in Cracow during the entire series (1826–2005)
totals 67.5% and thus, it is 0.4% lower than the mean calculated on the basis of the
results of fixed-time observations carried out between 1863 and 2005. In the analy-
sed multi-annual period, the value of the mean annual cloudiness repeatedly under-
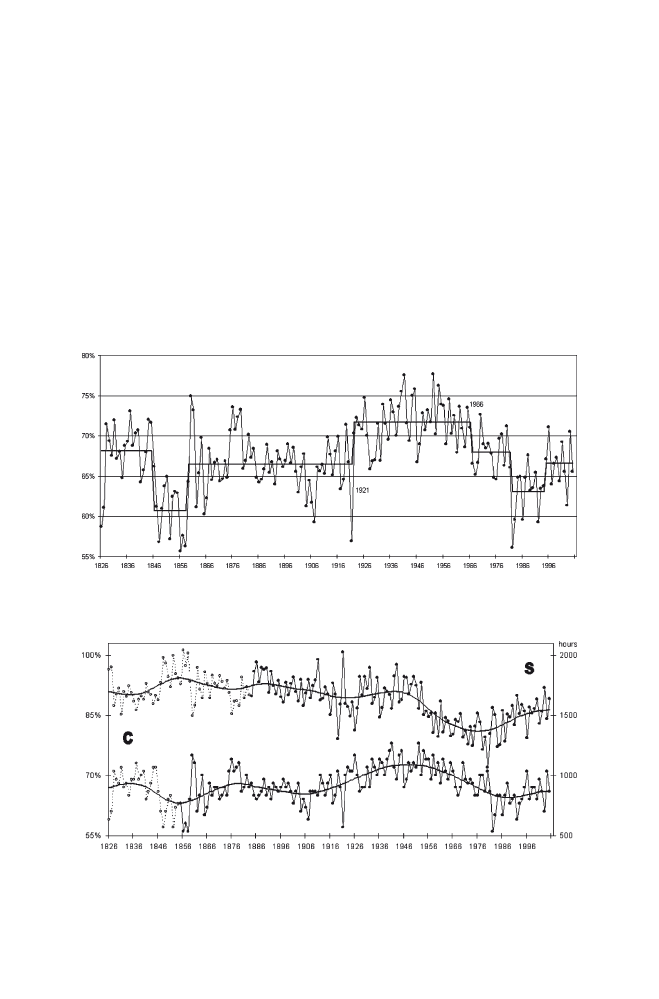
went considerable changes (Fig.
). The course of cloudiness, smoothed by
means of a Gaussian filter, is a sinusoid with a changing amplitude (Fig.
). The
segmentation of the course of the cloudiness data series according to Alexandersson
, refers to the division into NAO circulation epochs and splits the series into
the following intervals: 1826–1846 (mean cloudiness, ca. 68%), 1847–1858 (mean
cloudiness, ca. 60%), 1859–1921 (mean cloudiness, ca. 67%), 1922–1966 (mean
Fig. 15.2
Mean annual cloudiness in Cracow between 1826 and 2005 and its segmentation
according to the Alexandersson test
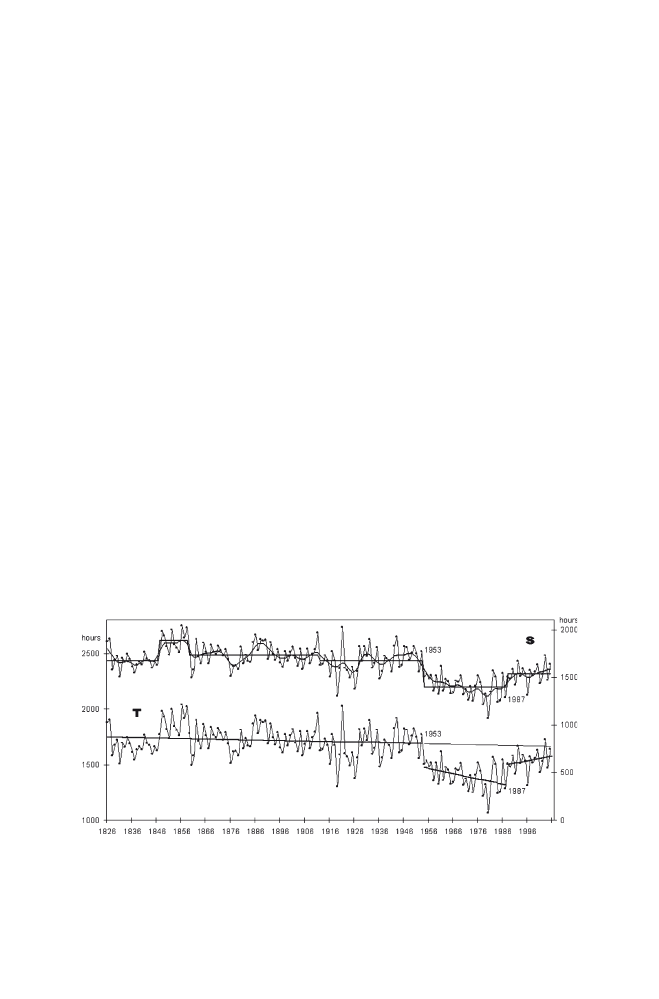
Fig. 15.3
Cloudiness (C) and sunshine duration (S) in Cracow between 1826 and 2005, smoothed
by Gaussian filter. Solid line – actual values, broken line – extrapolated values

344
P. Lewik et al.
cloudiness > 70%), 1967–1981 (mean cloudiness, ca. 68%), 1982–1994 (mean
cloudiness <65%), 1995–2005 (increase in cloudiness >65%). All the tests used for
the segmentation of the series indicated a breakthrough in the amount of cloud
cover: first, between 1921/1922 and to a lesser degree in 1966/1967. In the analy-
sed multi-annual period, the mean annual cloudiness minimum equalled ca. 56%
(1856, 1858, 1982), and the maximum, 78% (1941, 1952). The highest values of
mean monthly cloudiness reached 98% and were registered in February 1913 and
1952, as well as in December 1959. The absolute minimum (32%) was recorded in
March 1921.
The entire analysed period is characterized by a small increase in cloudiness in
Cracow, which is statistically significant at a confidence level of 0.05. The course
of cloudiness in the twentieth century, and especially in its second half, exhibits a
significantly greater variability than it does in the nineteenth century. This can be a
result of the significantly greater dynamics and the range of changes in circulation
conditions (Ustrnul
. The course of cloudiness, both in terms of the mean
values and the extreme phenomena, seems to be correlated with the cyclonicity
index. The index has been calculated by means of a method presented by
Niedz´wiedz´
and on the basis of data received from the same author. This can
be illustrated using the year 1921 as an example, in which the minimum (−228) of
the index within the entire investigated period occurred. The mean annual cloudi-
ness (57%) in that year was close to the absolute minimum. In the years character-
ized by the greatest cloudiness (1941 and 1952), high values of the index could be
observed. The values of the index increase from 1922 onwards, with a maximum in
the 1960s, when western circulation is also weakened (Ustrnul
.
In the first half of the twentieth century, a growing trend in cloudiness was
observable. It was especially clearly visible in autumn. The second half of the cen-
tury was characterized by a downward trend, very pronounced in wintertime. The
decrease in cloudiness observed since the beginning of the 1950s was also recorded
at other stations in Poland (Wibig
and in the countries of the former Soviet
Union (Sun and Groisman
, as well as in Potsdam and other regions of the
globe. The presented results from Cracow are also concurrent with the results of
work by Henderson-Sellers
regarding the changes in cloud cover in
Europe.
The occurrence of similar tendencies everywhere in Europe indicates that circu-
lation is the predominant reason for cloudiness variability in Cracow, which is also
modified by local factors. In addition, it confirms earlier conclusions concerning
this issue (Morawska
. The role of local factors intensified after World War
II, during a period of territorial and industrial growth of the city, which occurred
during the years with the greatest cloudiness. The increase in the emission of air
pollutants caused a greater concentration of condensation nuclei in the atmosphere
and contributed not only to the increase in cloudiness but to a change in its structure
as well. The emission of anthropogenic heat, amelioration of land and replacing
vegetation areas with artificial ones caused a decrease in the frequency of occur-
rence of morning fogs and stratus clouds as well as an increase in the amount of
convective ones (Morawska-Horawska
; Matuszko
.
345
15 Multi-Annual Variability of Cloudiness and Sunshine Duration
Cracow’s cloudiness is most strongly correlated with the cyclonicity index
(r = +0.38) and to a lesser degree with the optical thickness of volcanic aerosol
(
http://data.giss.nasa.gov/modelforce/strataer
) (r = −0.32). These two factors
account for 34% of cloudiness variability. The cyclonicity index reflects the fre-
quency of occurrence of cyclonic meteorological situations, irrespective of the
direction of advection (Nied
. However, if the directions of the influx
of air are taken into account, it is easy to state that advections in cyclonic systems
from all directions except SE (r = −0.01) contribute to high cloudiness. The advec-
tions which are especially strongly correlated with cloudiness are the ones originat-
ing from the following directions: E (r = +0.37), N (r = +0.33), W (r = +0.33). An
anti-cyclonic wedge is an especially unfavourable situation (r = −0.38). The fluc-
tuations of cloudiness in Cracow are cyclical, exhibiting the following periods,
expressed in years: 3.0–3.6, 5.7–8.9, 16.4, 20 and 60, on the basis of a harmonic
analysis. These results are similar to those obtained for the 1880–1979 period
(Morawska-Horawska
.
15.3 Clear and Overcast Days
The number of clear and overcast days, calculated according to Wierzbicki’s crite-
rion and used in his work (Wierzbicki
, is greater in comparison to the number
of such days determined according to the currently valid guidelines (Matuszko
On average, 69 clear days occur in Cracow. This value varies in individual years,
because in certain years with little cloudiness the number of clear days was twice
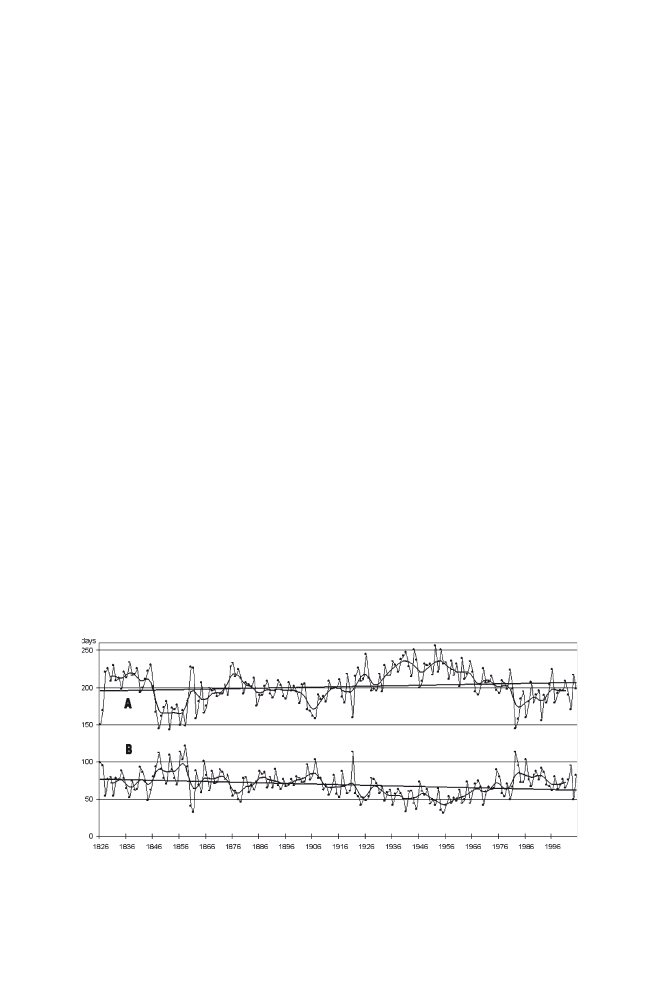
as high or twice as low (Fig.
). The curve of the multi-annual course of the
annual number of clear days exhibits a downward trend, although in the second half
of the twentieth century an increase in the number of such days could be observed.
Fig. 15.4
The number of clear (B) and overcast (A) days in Cracow between 1826 and 2005,
leveled by a 31-element Gaussian filter, and their trends

346
P. Lewik et al.
It is worth mentioning that a large number of clear days (over 70, and even 100 a
year) occurred in the 1850s. The fewest clear days, fewer than 60 a year, were
registered in the period comprised between 1924 and 1972. In the multi-annual
course, only March presents a growing trend of the number of clear days, and
spring can be characterised by the smallest decrease in their number. The most
significant downward trend can be observed in summer, especially in June. This
fact can be explained by the increase in convective cloudiness which dominates in
the warm part of the year and whose increase can often be noticed in the second
half of the twentieth century in Cracow (Matuszko
, Łód
ź (Wibig
and
the countries of the former Soviet Union (Sun et al.
In Cracow, there are three times as many overcast as clear days, 201 per year on
average. In the multi-annual course, the annual number of overcast days increased,
although expressed by a weak trend (Fig.
). In the majority of the months a
growing trend is observable, and the number of overcast days only decreased in
October. The largest number of overcast days in the multi-annual period (30 days
each) was registered in December 1945 and January 1953.
15.4 Sunshine Duration
The measurements of sunshine duration in Cracow were started in 1883, using a
Campbell-Stokes heliograph. They have been carried out in the same exact location
ever since. In 1941 the measurement instrument was replaced, which many studies
fail to mention. Due to the necessity to homogenize the measurement series, a
comparison of the readings of the new and the old heliograph was carried out
(Morawska
. For the purpose of the present study, the values of corrections
for individual months have been calculated, on the basis of the regression equation
and using the values of corrections based on the comparison from the years
1957/58. The calculations also took into account the annual course of the optical
mass of the atmosphere, the length of time when the Sun was located higher than
5° above the horizon and the coefficient of transparency and vapour pressure. The
new values of the corrections acquired a regular annual course. The mean annual
difference in the readings of both instruments is significant and equals 8.5%. After
they have been applied to the readings of the old heliograph, tests showed the
homogeneity of the entire series which was not observable before.
The publication of Wierzbicki
was used, as it contains the monthly values
of the number of clear and overcast days from the 1826–1852 period. These num-
bers, as well as the cloudiness values calculated on their basis, were used to calcu-
late the value of sunshine duration. Equations of multiple stepwise backward
regression and standard regression equations were used. Then, various methods of
extrapolation of annual sunshine duration were compared. The methods were based
on various juxtapositions of the following causative variables: annual cloudiness,
cloudiness in particular months, the number of clear and overcast days and the
number of said days together with the NAO index and air temperature. The degree
347
15 Multi-Annual Variability of Cloudiness and Sunshine Duration
of adjustment of various regression functions to the data was considered. In
addition, the variability of the multi-annual course of sunshine duration was com-
pared, both for the extrapolated part and the part obtained from observations. It was
found that the best results were obtained by means of standard (not stepwise)
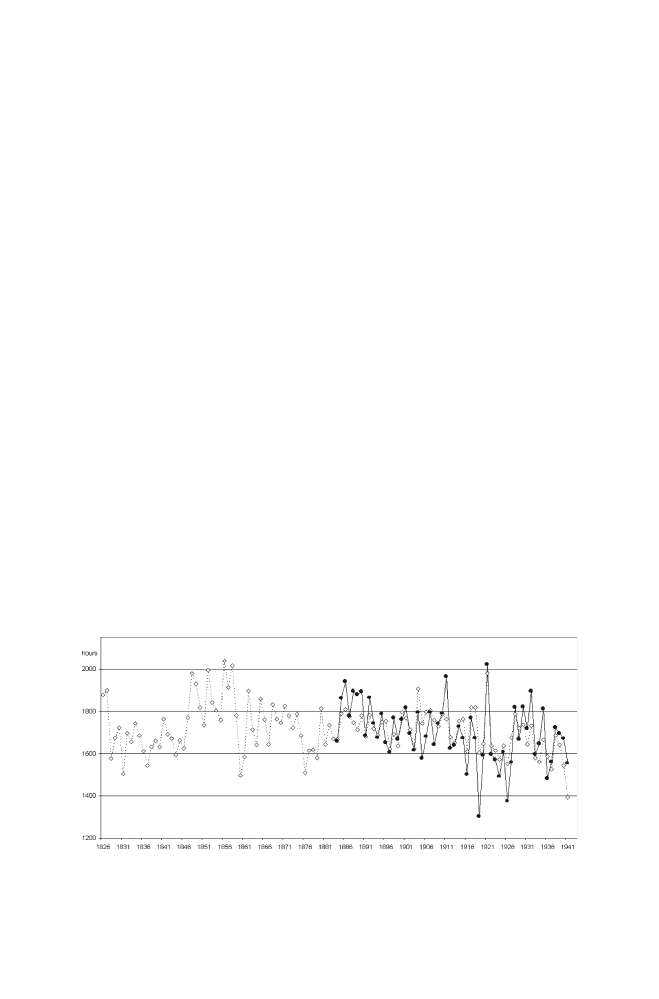
regression on the basis of cloudiness values for all 12 months (Fig.
). The
dependence of sunshine duration on cloudiness was determined on the basis of the
corrected data from the old heliograph, that is from the period in which there was
no strong anthropogenic interference. The mean annual difference between the
values from the measurements and the extrapolated values, calculated from the years
1884–1941, equals 76 h.
The reconstruction of the series up to 1826, that is its extension to 180 years,
allowed for a new, broader perspective on the variability observed in the course of
the annual sums of sunshine duration in Cracow (Fig.
). The shape of the curve
smoothed by the Gaussian filter resembles a descending sinusoid. The mean annual
sum of sunshine duration, calculated on the basis of data for 1884–2005, corrected
due to the replacement of the heliograph, equals 1,595.5 h. The mean calculated for
the 1826–2005 period (in which the values for 1826–1883 were calculated on the
basis of monthly values of cloudiness) equalled 1,639.6. The maximum annual sum
of sunshine duration for the 1884–2005 period equals 2,022.1 and occurred in
1921. In the reconstructed part of the series, a slightly higher value can be noticed:
2,040.3 in 1856. The lowest annual sum of sunshine duration (1,067.2) was regis-
tered in 1980.
In the multi-annual course of sunshine duration it is possible to observe periods
of relative stabilization, which can last for several decades, during which values in
individual years oscillate around the average level for the given period. In order to
determine the change points separating the periods of relative stabilization in the
course of sunshine duration in Cracow, five different statistical methods were used:
the sequential t-test analysis of regime shift – STARS (Rodionov
, the
Standard Normal Homogeneity Test – SNHT (Alexandersson
, Two-Phase
Fig. 15.5
Mean annual sunshine duration in Cracow between 1884 and 1941 and its values
calculated by extrapolation for 1826–1941
348
P. Lewik et al.
Regression – TPR (Easterling et al.
, as well as procedures presented by
Hubert et al.
and by Taylor
.
All of the methods used for the segmentation of the series, pointed firstly to 1954
as the year of the change. Four out of five methods indicated 1988 and 1847, as well
as 1859, in which however, the change was weaker. Three methods pointed to 1912.
Eventually, the Rodionov test was used to carry out the segmentation of the sun-
shine duration series (S, Fig.
).
The course of sunshine duration throughout the entire 180-year-long period
exhibits a very clear, steep decrease in sunshine duration between 1953 and 1954,
and then its subsequent, further diminishing until 1987 (T, Fig.
). The down-
ward trend of the 1954–1987 period is statistically significant at the level of 0.03.
The decrease in sunshine duration was especially visible between 1953 and 1980.
After 1987 there was an increase in the average level around which the values of
sunshine duration for 1988–2005 oscillated. However, they do not reach the level
which was observable before 1954. They do not even reach the values which could
be expected due to the extension of the line of the downward trend from the years
1826–1953! (T, Fig.
)
Taking the entire 1826–1953 period into consideration, it is possible to see
numerous fluctuations in the course of the annual sums of sunshine duration.
However, throughout the entire period they oscillate around an almost identical
level. A small downward trend can be observed; however, it is not statistically sig-
nificant. Analysing the 1826–1953 period in detail, it is possible to divide it into
certain sub-periods. The years 1847–1858 are especially noteworthy, with their
increased sunshine duration, which is especially clear when compared with previ-
ous years. It is also possible to see that in the 1859–1911 sub-period the oscillations
in sunshine duration were weaker and occurred around an average level that was
slightly higher than in the 1912–1953 period.
Fig. 15.6
Mean annual sunshine duration in Cracow between 1826 and 2005, smoothed by a
nine-element Gaussian filter, and its segmentation (S) according to the Rodionov test, together
with trends (T)

349
15 Multi-Annual Variability of Cloudiness and Sunshine Duration
The above described method of describing the course of sunshine duration
within the last decades is based on objectively determined dates of the change
points and on the assumption that these points separate periods of relative stabiliza-
tion. The multi-annual course of sunshine duration can also be presented in a dif-
ferent way; by describing the trends (Fig.
) which are characteristic of
individual sub-periods: a slight decrease between 1826 and 1953, a rapid drop
between 1953 and 1954, a very clear negative trend in the 1954–1987 period (espe-
cially strong between 1955 and 1980) and a leap to a higher level between 1987 and
1988. The period after 1988 is too short for us to determine whether it is possible
to observe oscillations around a certain stable level or rather a permanent increasing
trend. The most visible change in the course of sunshine duration, which occurred
in 1954, is to a large degree related to the increase in the amount of air pollution
caused by the opening of a steelworks in Cracow and the increase in dust and gas
emissions from other industrial and municipal facilities/plants (Morawska
;
Lewin´ska
. The emission of pollutants only dropped in the 1980s as a result
of a decrease in industrial production. It needs to be emphasized that the decrease
in sunshine duration between 1955 and 1980 occurred in spite of the decrease in
cloudiness and the number of overcast days and in spite of the increase in the num-
ber of clear days. The decrease in the intensity of direct radiation, caused by the
decrease in atmospheric transparency was identified by means of actinometrical
measurements (Morawska-Horawska and Olecki
. Between 1968 and 1985,
direct radiation in Cracow, in comparison to the area outside the city, was on aver-
age 17% lower in individual years. In winter, that is during the heating season, it
was lower by 30–40%. The sunshine duration in Cracow is clearly correlated (r = −0.57)
with the total solar irradiance (
ftp://atmos.sparc.sunysb.edu/pub/sparc/clim_force/
), stronger than with the number of sunspots, the cyclonicity
index (r = −0.54) and cloud cover (r = −0.47). Because the degree of cloud cover
is also correlated with the cyclonicity index (r = +0.38), the primary natural causes
of the variability of sunshine duration are in the first place changes in solar activity
and in the macro-scale circulation (Fig.
). Anti-cyclonic meteorological situa-
tions are favourable conditions for sunshine, especially the ones with advection
from the following directions: W (r = +0.49), SE (r = +0.29), SW (r = +0.28), NW
(r = +0.26), as well as an anti-cyclonic wedge (r = +0.23). A north cyclonic (Nc)
situation is especially unfavourable (r = −0.39).
Together, the changes in irradiance and the cyclonicity index explain 44% of the
variability of sunshine duration within the entire analysed period. In turn, in the
years after 1969, in which anthropogenic factors are very strong and for which data
about dust content in Cracow’s air are available (Voivodship Sanitary and
Epidemiological Station in Cracow) of cloudiness and dust content. The cyclonicity
index is positively correlated with irradiance (r = +0.37), and cloudiness is also
positively correlated with the index (r = +0.38). In the periods of increased solar
activity, the frequency of cyclonic situations and the amount of cloudiness increase,
while sunshine duration decreases. This is probably due to the intensification of
Atlantic cyclonic pressure patterns and their increased activity or the change in the
course of their itinerary from the Ocean to Europe. The correlation of sunshine
350
P. Lewik et al.
duration with irradiance (r = −0.57) and with the number of sunspots (r = −0.22) is
negative. In the periods of increased solar activity, sunshine duration decreases
(Fig.
). This is a result of various complex and interrelated radiation, photo-
chemical and dynamic processes occurring in the troposphere, stratosphere as well
as on the surface of the Earth.
Even slight changes in the solar constant can cause various indirect effects,
especially because one third of the variability of the inflow of total solar irradiance
is caused by UV radiation fluctuations. The increase in the intensity of solar radia-
tion in the periods of high solar activity causes the creation of larger amounts of
ozone. The enriched ozone layer absorbs UV radiation with greater intensity, at the
same time reducing its inflow to the surface of the Earth and the sunshine duration
measured at the surface. The instability of UV radiation inflow, which is caused
both directly by the changes in solar activity and indirectly by the changes in the
amount of ozone in the atmosphere, exerts considerable influence on the cloudiness
and sunshine duration in Cracow. Changes in cloudiness (r = +0.40) and sunshine
duration (r = −0.55) are obviously strong and significantly correlated with the con-
tent of ozone in the atmosphere over Poland, measured in the observatory in Belsk
(Central Geophysical Observatory at Belsk).
Moreover, sunshine duration is also influenced by the most explosive volcanic
eruptions which discharge dust and gases to the stratosphere. For instance, in
1912, following the eruption of Mount Katmai in June, only low values of sun-
shine duration were registered in Cracow in September (Morawska
. The
correlation of Cracow’s sunshine duration with the optical thickness of the strato-
spheric volcanic aerosols (on the 50th parallel, at the altitude of 15–20 km,
data.giss.nasa.gov/modelforce/strataer/
) is almost zero. However, this does not
have to indicate a lack of influence of volcanoes on sunshine duration in Cracow,
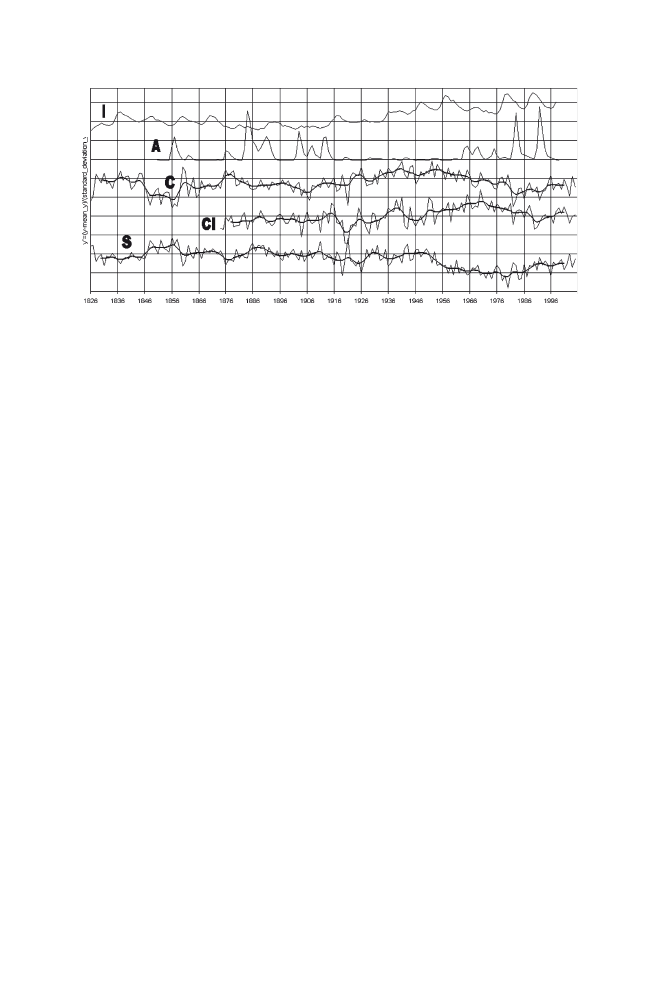
Fig. 15.7
Standardized courses of sunshine duration (S) and cloudiness (C) in Cracow between
1826–2005, as well as of the cyclonicity index (CI), stratospheric aerosol optical thickness (A) and
total solar irradiance (I). The course of S, CI, C – smoothed by a nine-element Gaussian filter. In
order to make it possible to compare data expressed in various units, they have undergone a stan-
dardization procedure. The values of the variables have been converted to standardized y’ values;
y
’ = (y-mean_y)/(standard_deviation_y)

351
15 Multi-Annual Variability of Cloudiness and Sunshine Duration
but can rather result from the fact that various opposing direct and indirect effects
of volcanic activity neutralize each other. It is well known that volcanic dusts and
aerosols absorb and scatter direct solar radiation and decrease sunshine duration.
Increased scattering favours the photodissociation of ozone. Chlorine released dur-
ing the eruption decomposes ozone particles. Due to the loss of ozone, more UV
radiation reaches the surface of the Earth and sunshine duration increases. The
amount of ozone over Poland is significantly correlated with the optical thickness
of volcanic aerosol (r = −0.43).
Coefficients of correlation with the AO Thompson index (
ton.edu/ao/aojfm18992002.ascii
) are a proof of the influence of macro-scale circu-
lation on sunshine duration and especially on the cloudiness in Cracow. They equal
r
= +0.29 and r = −0.42 for sunshine duration and cloudiness, respectively, calcu-
lated for winter months (JFM) and r = +0.17 and r = −0.36 for the whole year. The
coefficient of correlation of these elements with Hurrel’s NAO index (
cgd.ucar.edu/cas/jhurrell/indices.data.html#naostatann
) equal r = +0.14 and r = −0.33
for sunshine duration and cloudiness, respectively, calculated for winter months
(JFM) and r = +0.18 and r = −0.28 for the whole year.
Cloudiness and sunshine duration in Cracow do not appear to be correlated with
the activity of the solar corona, which emits solar wind, and they are weakly and
insignificantly correlated with cosmic radiation (
SOLAR_DATA/COSMIC_RAYS/kiel.tab
), which supplies condensation nuclei by
ionizing air. Sunshine duration is significantly and weakly (r = −0.27) correlated
with geomagnetic activity (aa indices:
http://www.wdcb.ru/stp/data/geomagni.ind/
15.5 Results and Conclusions
1. The analysis of the data concerning the number of clear and overcast days form
the 1826–1852 period made it possible to calculate the cloudiness in that precise
time frame, and on that basis, to extrapolate the values of sunshine duration,
which was not recorded at that time. Thanks to that, both of these vital meteoro-
logical elements obtained a 180 year-long data series.
2. The segmentation of the course of cloudiness divides the series into seven main
periods (…–1846, 1847–1858, 1859–1921, 1922–1966, 1967–1981, 1982–1994,
1995–…), with different degrees of cloudiness and tendencies. The overall trend
for the entire period is a growing one, clear days exhibit a downward trend and
overcast days an increasing one.
3. Cloudiness is most strongly correlated with the cyclonicity index (r = +0.38),
and somewhat more weakly with the optical thickness of volcanic aerosol (r =
−0.34). The changeability of atmospheric circulation and volcanic aerosol
account for 34% of the variability of cloudiness.
4. The segmentation of sunshine duration showed six periods (…–1846, 1847–
1858, 1859–1911, 1912–1953, 1954–1987, 1988–…). The overall sunshine

352
P. Lewik et al.
duration trend obtained from the entire period is a downward one, mainly due to
the low values in the second half of the twentieth century.
5. The segmentation of the course of cloudiness and sunshine duration is not fully
asynchronous. The asynchronicity occurring until the mid-nineteenth century is
caused by the method used to obtain values of sunshine duration on the basis of
cloudiness. Starting with the 1920s a synchronization of the course of cloudiness
and sunshine duration begins, caused by anthropogenic factors. This is another
proof of the lack of an exclusive influence of cloudiness on sunshine duration.
A classical example of such a situation is the last 50 years, in which a significant
influence of air pollution in Cracow on the values of sunshine duration has
become observable.
6. Sunshine duration is most strongly correlated with irradiance (r = −0.57), and to
a lesser degree with the cyclonicity index (r = −0.55) and cloudiness (r = −0.47).
The first two factors account for 44% of the variability of sunshine duration in
the entire analysed period.
7. The positive correlation of irradiance with the cyclonicity index (r = +0.37) sug-
gests that it can contribute to a growth of cyclonic activity which causes an
increase in the cloudiness observed in Cracow.
Acknowledgments
This study was partly supported be a grant from the Ministry of Science and
Higher Education (No N306 047 31/2905).
References
Alexandersson A (1986) A homogeneity test applied to precipitation data. Int J Climatol 6:661–
675. doi:
Easterling DR, Peterson TC, Karl TR (1996) On the development and use of homogenized climate
datasets. J Clim 9:1429–1434. doi:10.1175/1520-0442(1996) 009<1429:OTDAUO>2.0.CO; 2
Gorczy
ński W, Wierzbicka W (1916) O rozkładzie geograficznym dni pogodnych i pochmurnych
w Polsce. Spraw Tow Nauk Warszawskiego, Warszawa
Henderson-Sellers A (1986) Cloud changes in a warmer Europe. Clim Change 8:25–52
Hubert P, Carbonnel JP, Chaouche A (1989) Segmentation des séries hydrométéorologiques.
Application à des séries de précipitations et de débits de l’Afrique de l’Ouest. J Hydrol
110:349–367
Lewi
ńska J (2000) Klimat miasta. Zasoby, zagrożenia, kształtowanie. Instytut Gospodarki
Przestrzennej i Komunalnej, Kraków
Matuszko D (2003) Cloudiness changes in Cracow in the 20th Century. Int J Climatol
23(8):975–984
Matuszko D (ed) (2007) Klimat Krakowa w XX wieku. IG i GP UJ, Kraków
Morawska M (1963) Zachmurzenie i usłonecznienie Krakowa w latach 1859–1958. Prace PIHM
81:1–46
Morawska-Horawska M (1985) Cloudiness and sunshine in Cracow 1861–1980 and its contem-
porary tendencies. J Climatol 5:633–642
Morawska-Horawska M, Olecki Z (1996) Wieloletnie zmiany w zachmurzeniu, usłonecznieniu i
dopływie promieniowania słonecznego w Krakowie. Folia Geogr., ser. Geogr- Phys 26–27:59–74
Nied
źwiedź (1981) Sytuacje synoptyczne i ich wpływ na zróżnicowanie przestrzenne wybranych
elementów klimatu w dorzeczu górnej Wisły. Rozpr hab UJ, 58, Kraków

353
15 Multi-Annual Variability of Cloudiness and Sunshine Duration
Rodionov SN (2004) A sequential algorithm for testing climate regime shifts. Geophys Res Lett
31:L09204. doi:
Sun B, PYa G (2000) Cloudiness variations over the Former Soviet Union. Int J Climatol
20:1097–1111
Sun B, PYa G, Mokhov II (2001) Recent changes in cloud-type frequency and inferred increases
in convection over the United States and the Former USRR. J Clim 14:1864–1880
Taylor WA (2000) Change-point analysis: a powerful new tool for detecting changes.
variation.com/cpa/tech/changepoint.html
Ustrnul Z (2007) Warunki cyrkulacyjne In: Matuszko D (ed) Klimat Krakowa w XX wieku. IG i
GP UJ, Kraków
Wibig J (2004) Zachmurzenie w Łodzi w latach 1951–2000, 100 lat obserwacji meteorologic-
znych w Łodzi. Acta Geogr Lodz 89:115–129
Wierzbicki D (1873) Untersuchungen über climatographischen Verhältnisse zu Krakau nach
45-jähringen Beobachtungen 1826–1870. Jahrbücher der k.k. Central-Anstalt für Meteorologie
und Erdmagnetismus, Wien 7:209–246
Document Outline
Wyszukiwarka
Podobne podstrony:
racismz int (2) , Racism has become one of the many burdens amongst multi-cultural worlds like Canad
Fundamentals of Anatomy and Physiology 15 Chapter
The Rights of Persons Belonging to National or Ethnic, Religious and Linguistic Minorities, Annual R
Historia gry Heroes of Might and Magic
Overview of Exploration and Production
Blanchard European Unemployment The Evolution of Facts and Ideas
Magnetic Treatment of Water and its application to agriculture
ABC Of Arterial and Venous Disease
68 979 990 Increasing of Lifetime of Aluminium and Magnesium Pressure Die Casting Moulds by Arc Ion
ABC Of Occupational and Environmental Medicine
Inequality of Opportunity and Economic Development
On The Manipulation of Money and Credit
The Hound of?ath and Other Stories
31 411 423 Effect of EAF and ESR Technologies on the Yield of Alloying Elements
21 269 287 Effect of Niobium and Vanadium as an Alloying Elements in Tool Steels
7 3 1 2 Packet Tracer Simulation Exploration of TCP and UDP Instructions
History of Jazz and Classical Music
Mock Exam? Use of English and Vocabulary
The Repentance of Compassion and Enlightenment Path
więcej podobnych podstron