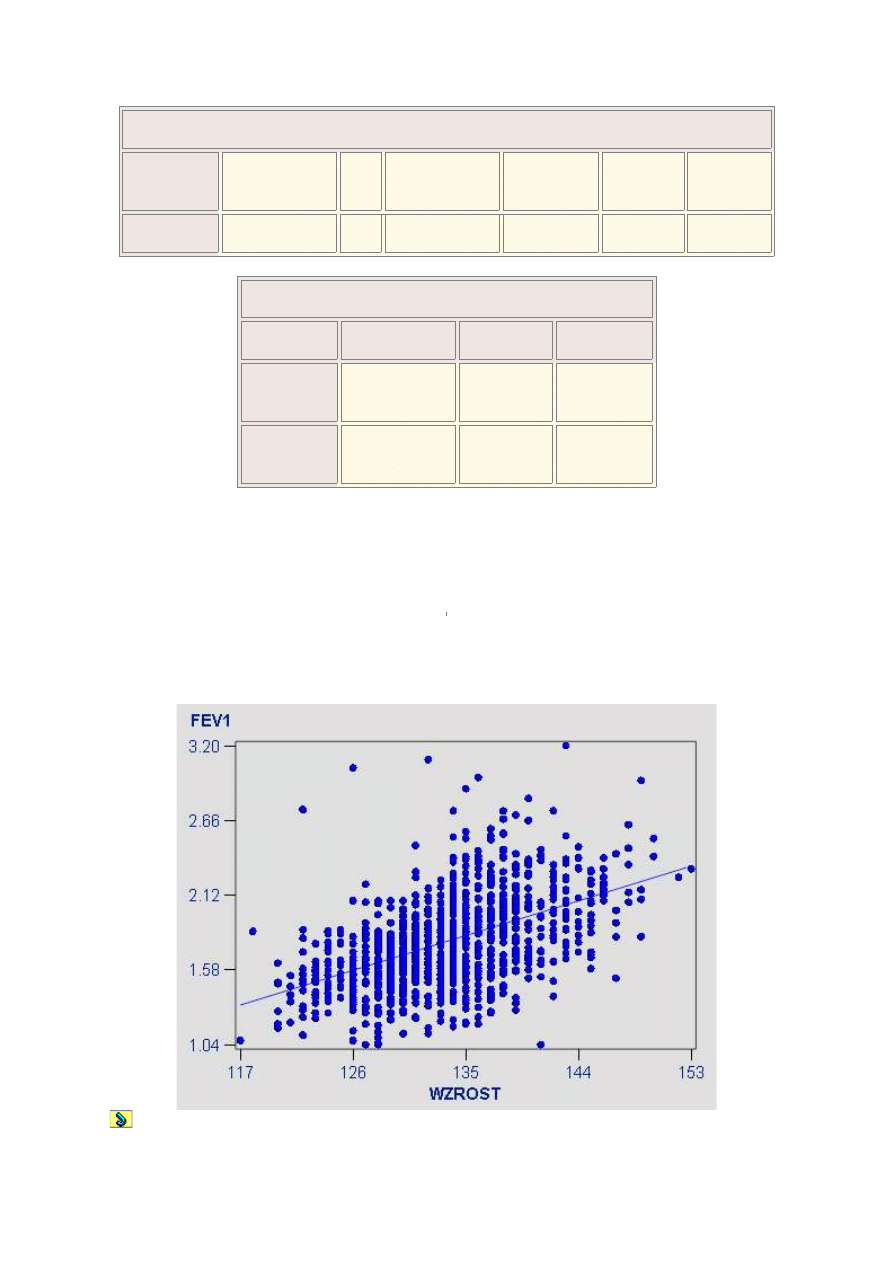
Obejrzyj zależność liniową między zmiennymi i
porównaj ze współczynnikami korelacji
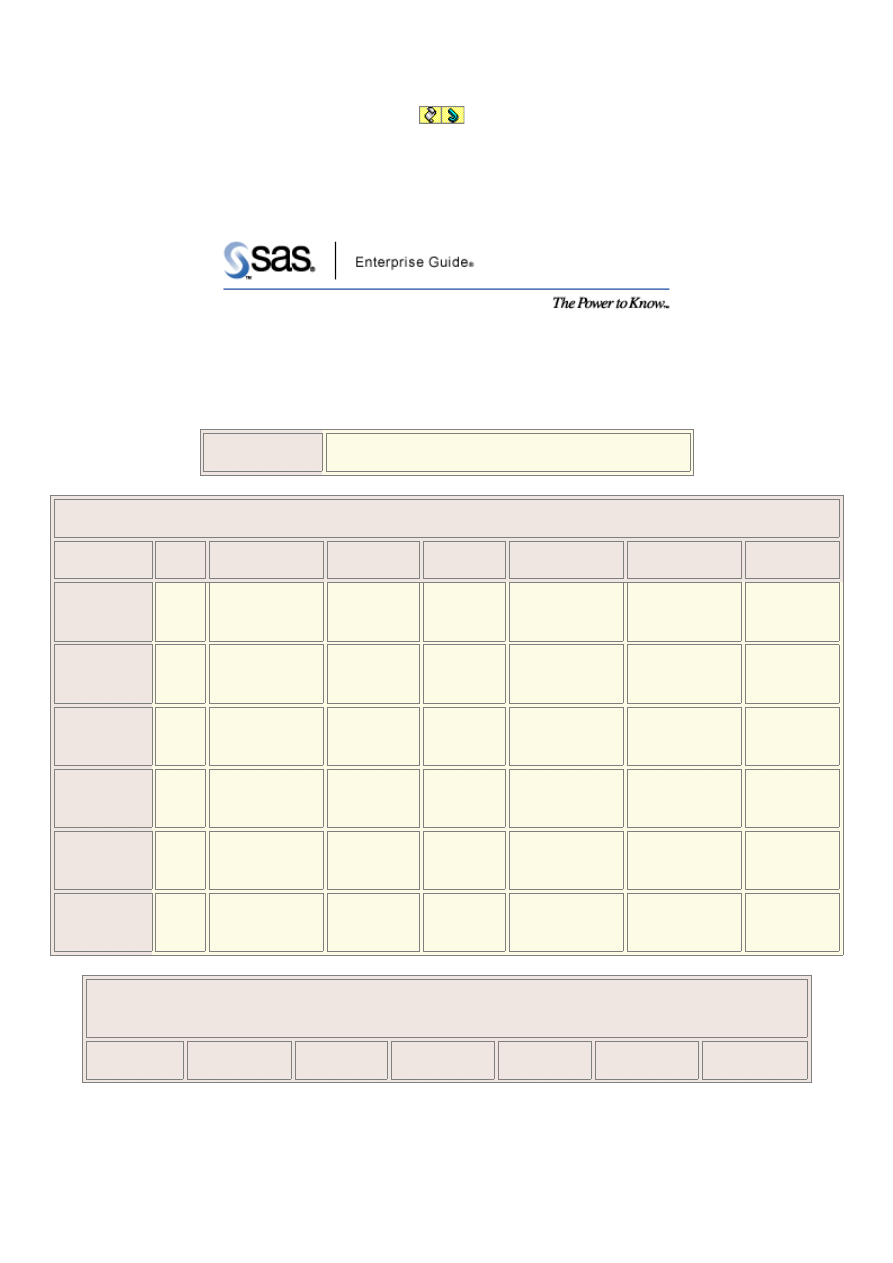
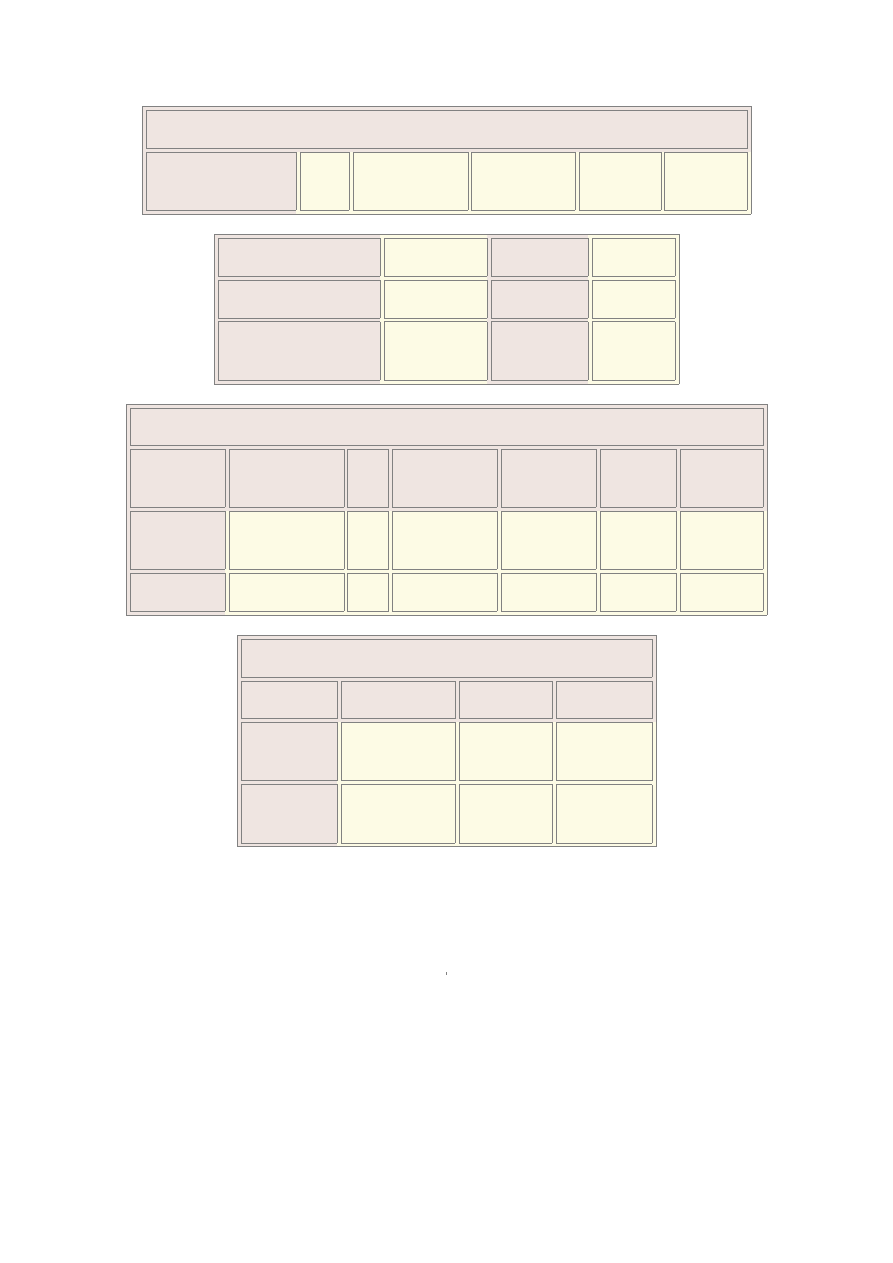
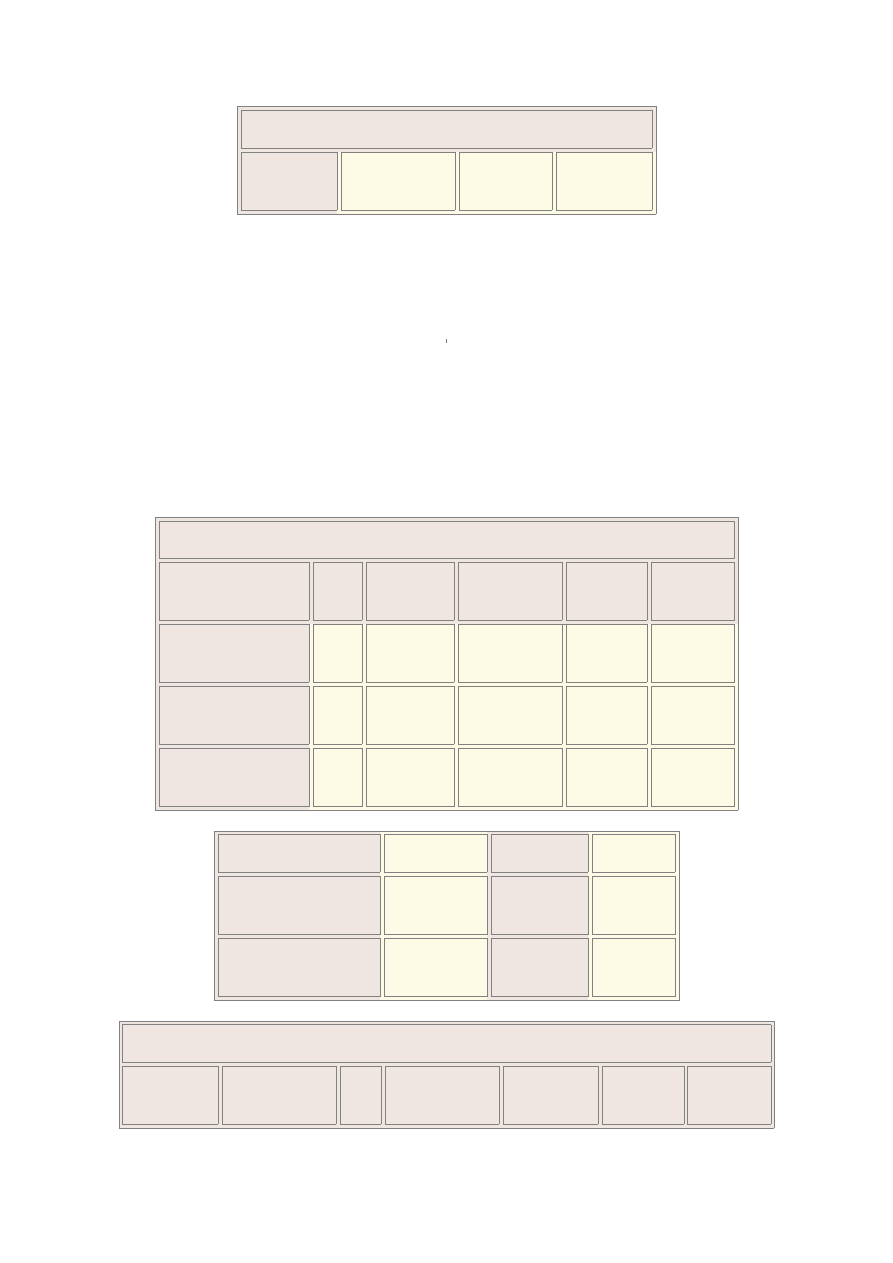
Analiza korelacji 'WZROST ' 'WIEK ' 'WAGA ' 'FEV1 ' 'VC ' 'FEV1_VC ' z ...
The CORR Procedure
6 Variables:
WZROST WIEK WAGA FEV1 VC FEV1_VC
Simple Statistics
Variable
N
Mean
Std Dev
Sum
Minimum
Maximum
Label
WZROST
99
8
133.7505
0
5.8817
2
13348
3
117.0000
0
153.0000
0
WZROST
WIEK
99
8
8.92655
0.4030
8
8909
7.77000
10.37000
WIEK
WAGA
99
8
30.09719
5.6141
0
30037
18.00000
59.00000
WAGA
FEV1
99
8
1.79332
0.3283
2
1790
1.04000
3.20000
FEV1
VC
99
8
1.91643
0.3722
9
1913
1.05000
3.61000
VC
FEV1_VC
99
8
94.02385
7.1746
7
93836
61.30000
133.3000
0
FEV1_VC
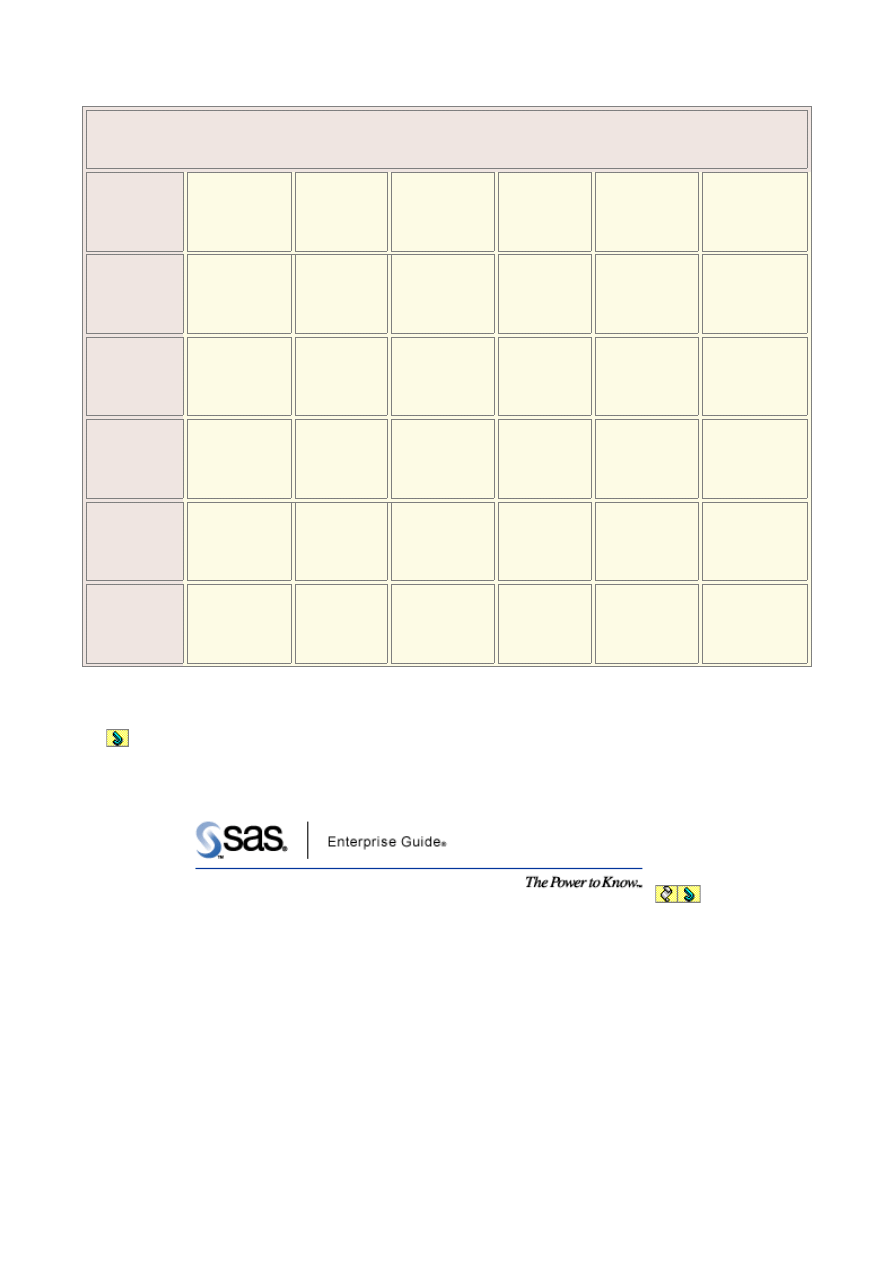
Pearson Correlation Coefficients, N = 998
Prob > |r| under H0: Rho=0
WZROST
WIEK
WAGA
FEV1
VC
FEV1_VC
Pearson Correlation Coefficients, N = 998
Prob > |r| under H0: Rho=0
WZROST
WZROST
1.00000
0.2455
1
<.0001
0.68965
<.0001
0.4995
5
<.0001
0.50753
<.0001
-0.09098
0.0040
WIEK
WIEK
0.24551
<.0001
1.0000
0
0.14842
<.0001
0.1372
4
<.0001
0.12750
<.0001
0.00809
0.7984
WAGA
WAGA
0.68965
<.0001
0.1484
2
<.0001
1.00000
0.4449
3
<.0001
0.45156
<.0001
-0.07918
0.0123
FEV1
FEV1
0.49955
<.0001
0.1372
4
<.0001
0.44493
<.0001
1.0000
0
0.91987
<.0001
0.06447
0.0417
VC
VC
0.50753
<.0001
0.1275
0
<.0001
0.45156
<.0001
0.9198
7
<.0001
1.00000
-0.32225
<.0001
FEV1_VC
FEV1_VC
-0.0909
8
0.0040
0.0080
9
0.7984
-0.0791
8
0.0123
0.0644
7
0.0417
-0.3222
5
<.0001
1.00000
Wygenerowane przez System SAS (Local, WIN_PRO) dnia 08JUN2004 o godz.
7:45 PM
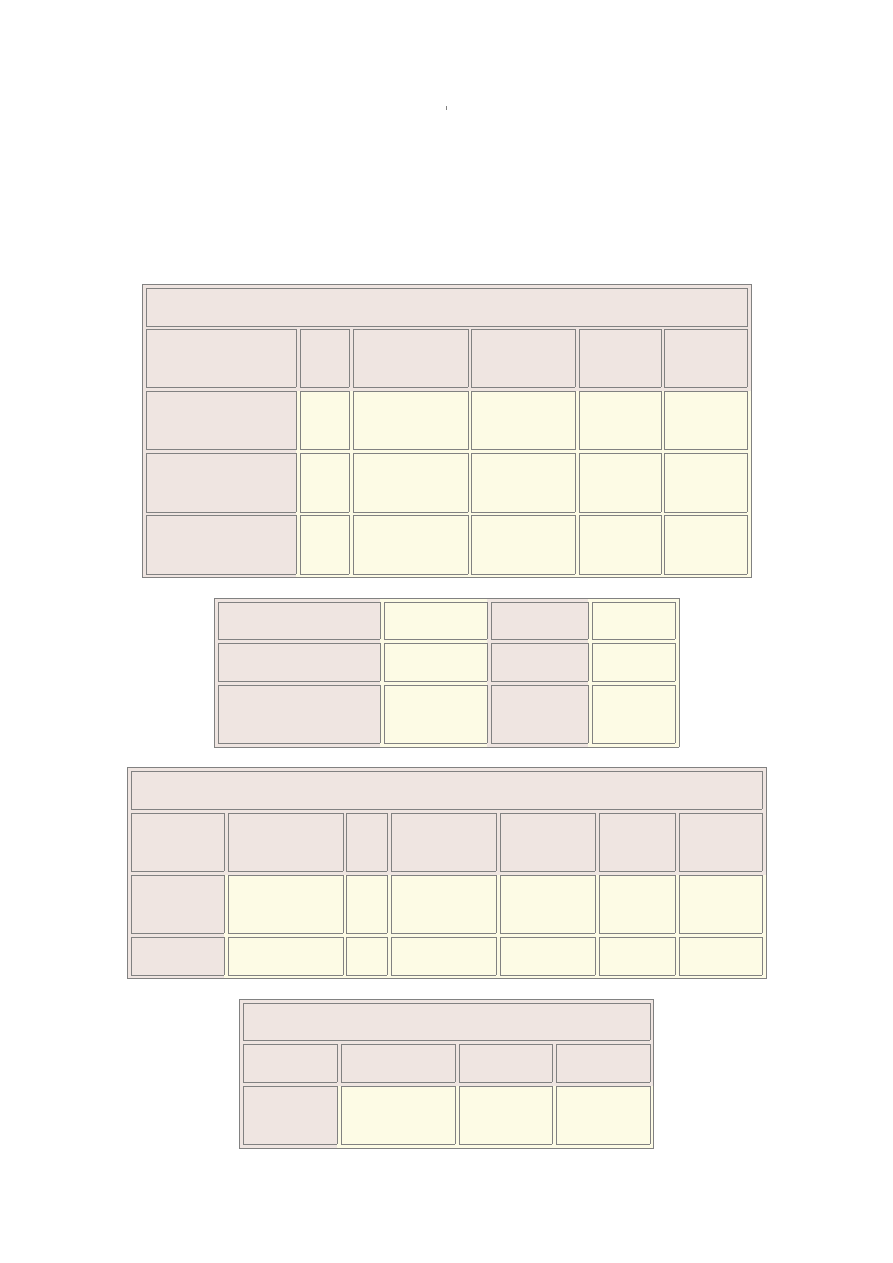
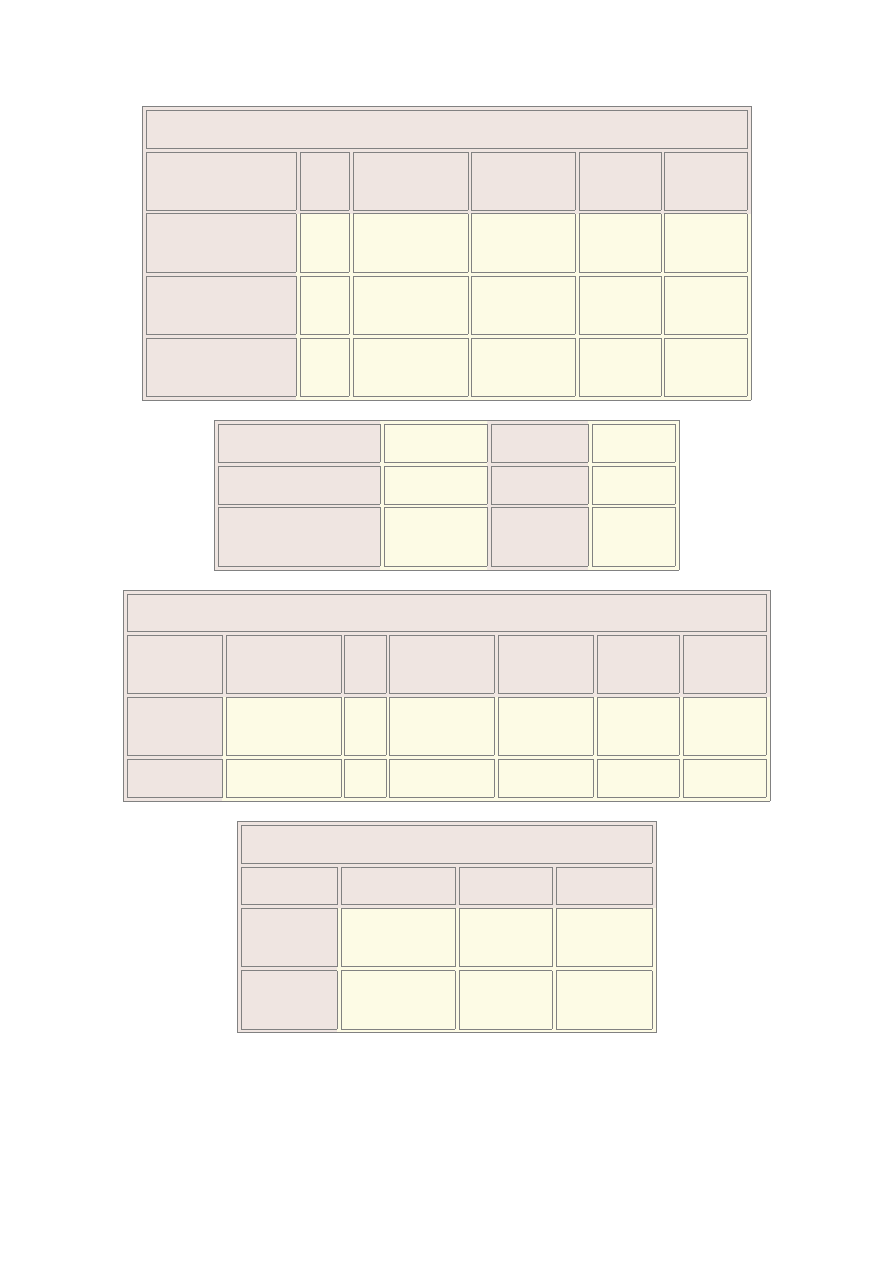
Regresja liniowa
Rezultaty
The REG Procedure
Model: Linear_Regression_Model
Dependent Variable: FEV1 FEV1

Analysis of Variance
Source
DF
Sum of
Squares
Mean
Square
F Value
Pr > F
Model
1
21.27591
21.2759
1
245.8
4
<.0001
Error
99
6
86.19641
0.08654
Corrected Total
99
7
107.4723
2
Root MSE
0.29418
R-Square
0.1980
Dependent Mean
1.79332
Adj R-Sq
0.1972
Coeff Var
16.4043
1
Parameter Estimates
Variable
Label
DF
Parameter
Estimate
Standard
Error
t Value
Pr > |t|
Intercept
Intercep
t
1
1.01017
0.05081
19.88
<.0001
WAGA
WAGA
1
0.02602
0.00166
15.68
<.0001
Correlation of Estimates
Variable
Label
Intercept
WAGA
Intercept
Intercep
t
1.0000
-0.9831
WAGA
WAGA
-0.983
1
1.0000
Wygenerowane przez System SAS (Local, WIN_PRO) dnia 08JUN2004 o godz.
7:44 PM
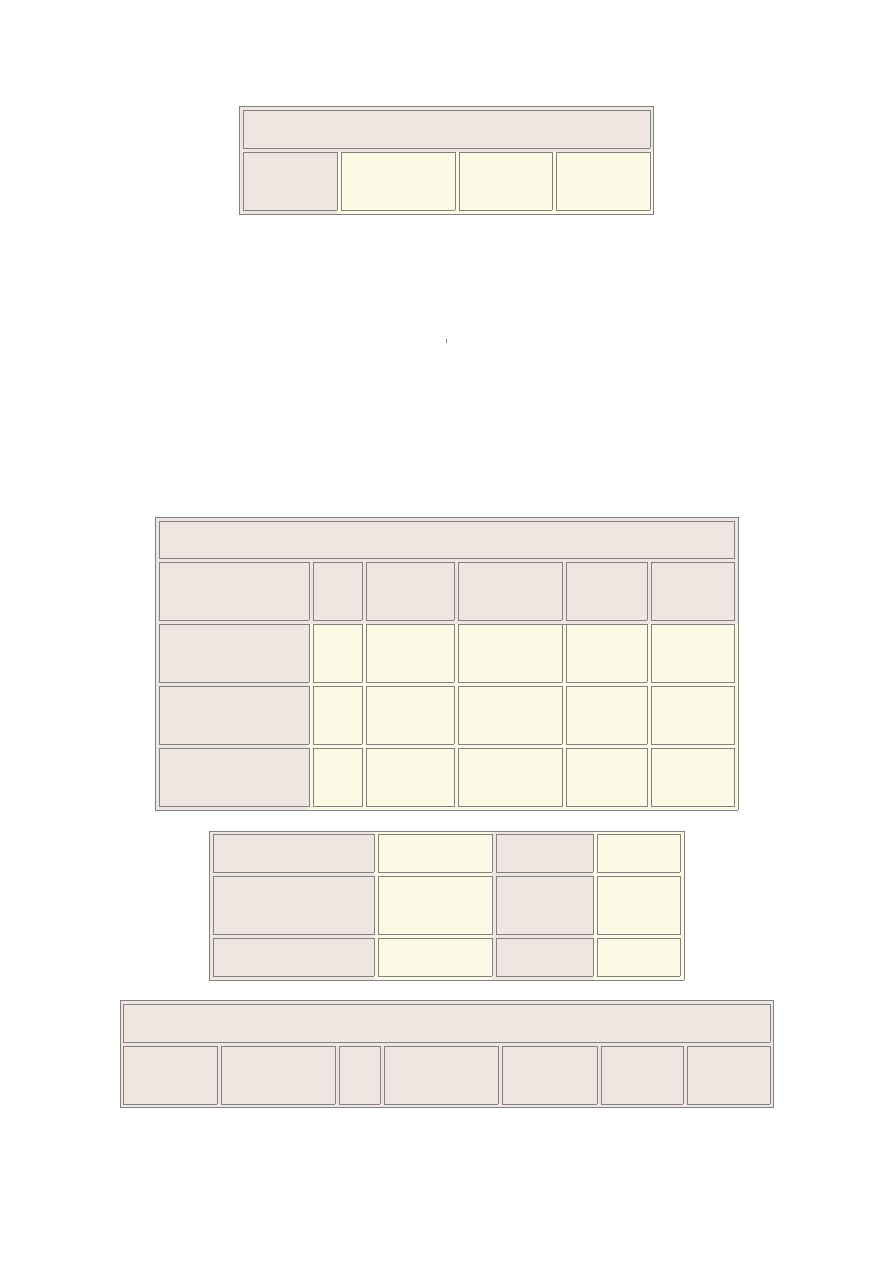
Regresja liniowa
Rezultaty
The REG Procedure
Model: Linear_Regression_Model
Dependent Variable: DVC DVC
Analysis of Variance
Source
DF
Sum of
Squares
Mean
Square
F Value
Pr > F
Model
1
33.76963
33.7696
3
319.4
0
<.0001
Error
99
6
105.3059
5
0.10573
Corrected Total
99
7
139.0755
8
Root MSE
0.32516
R-Square
0.2428
Dependent Mean
2.14085
Adj R-Sq
0.2421
Coeff Var
15.1883
4
Parameter Estimates
Variable
Label
DF
Parameter
Estimate
Standard
Error
t Value
Pr > |t|
Intercept
Intercep
t
1
1.15421
0.05616
20.55
<.0001
WAGA
WAGA
1
0.03278
0.00183
17.87
<.0001
Correlation of Estimates
Variable
Label
Intercept
WAGA
Intercept
Intercep
t
1.0000
-0.9831
Correlation of Estimates
WAGA
WAGA
-0.983
1
1.0000
Wygenerowane przez System SAS (Local, WIN_PRO) dnia 08JUN2004 o godz.
7:44 PM
Regresja liniowa
Rezultaty
The REG Procedure
Model: Linear_Regression_Model
Dependent Variable: WZROST WZROST
Analysis of Variance
Source
DF
Sum of
Squares
Mean
Square
F Value
Pr > F
Model
1
16404
16404
903.3
6
<.0001
Error
99
6
18087
18.1592
4
Corrected Total
99
7
34491
Root MSE
4.26137
R-Square
0.4756
Dependent Mean
133.7505
0
Adj R-Sq
0.4751
Coeff Var
3.18606
Parameter Estimates
Variable
Label
DF
Parameter
Estimate
Standard
Error
t Value
Pr > |t|
Parameter Estimates
Intercept
Intercep
t
1
112.0046
4
0.73598
152.1
8
<.0001
WAGA
WAGA
1
0.72252
0.02404
30.06
<.0001
Correlation of Estimates
Variable
Label
Intercept
WAGA
Intercept
Intercep
t
1.0000
-0.9831
WAGA
WAGA
-0.983
1
1.0000
Wygenerowane przez System SAS (Local, WIN_PRO) dnia 08JUN2004 o godz.
7:44 PM
Regresja liniowa
Rezultaty
The REG Procedure
Model: Linear_Regression_Model
Dependent Variable: FEV1_VC FEV1_VC
Analysis of Variance
Source
DF
Sum of
Squares
Mean
Square
F Value
Pr > F
Model
1
321.7310
9
321.7310
9
6.28
0.0123
Error
99
6
51000
51.20456
Corrected Total
99
7
51321
Root MSE
7.15574
R-Square
0.0063
Dependent Mean
94.0238
5
Adj R-Sq
0.0053
Coeff Var
7.61055
Parameter Estimates
Variable
Label
DF
Parameter
Estimate
Standard
Error
t Value
Pr > |t|
Intercept
Intercep
t
1
97.06925
1.23587
78.54
<.0001
WAGA
WAGA
1
-0.10119
0.04037
-2.51
0.0123
Correlation of Estimates
Variable
Label
Intercept
WAGA
Intercept
Intercep
t
1.0000
-0.9831
WAGA
WAGA
-0.983
1
1.0000
Wygenerowane przez System SAS (Local, WIN_PRO) dnia 08JUN2004 o godz.
7:44 PM
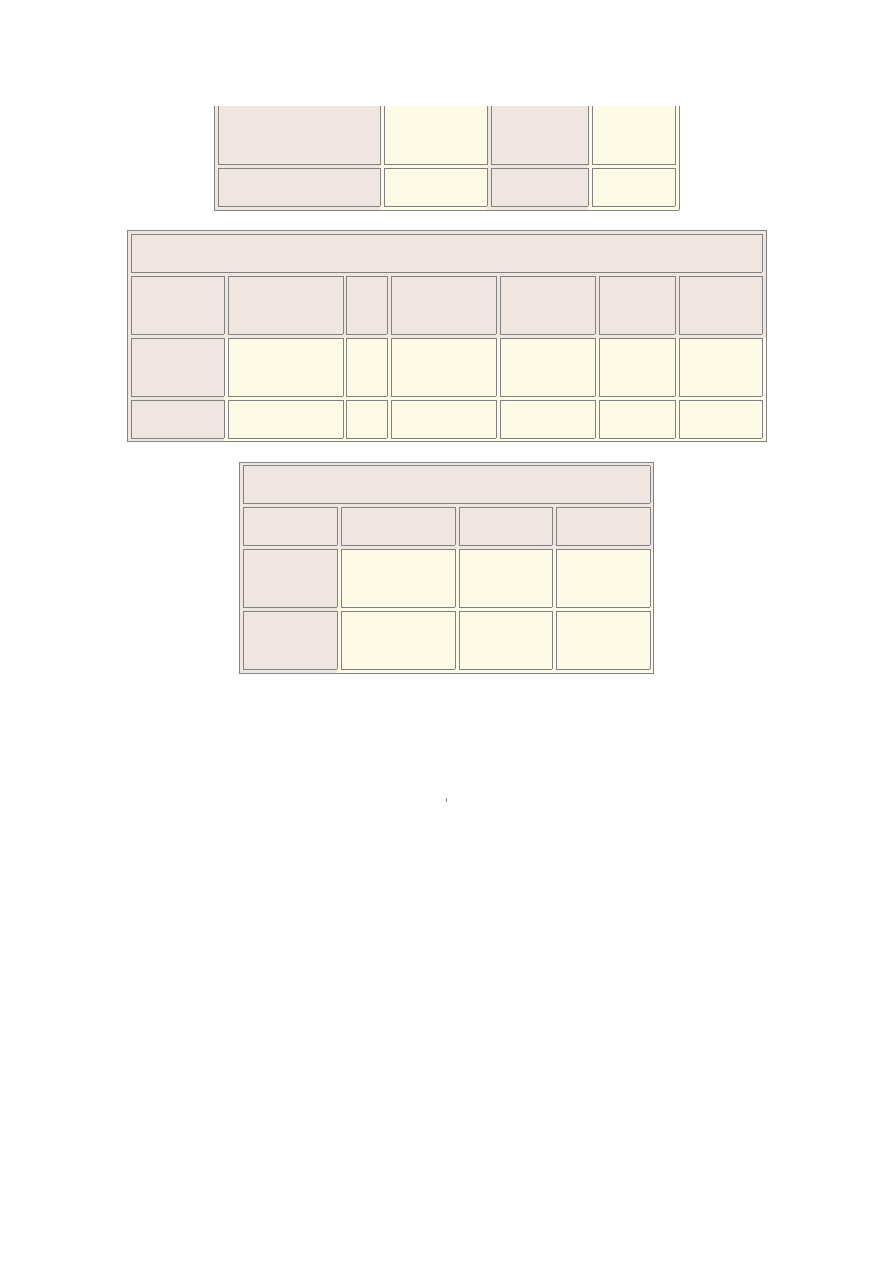
Analiza regresji
Wykresy
Obserwowane FEV1 od WAGA
Wygenerowane przez System SAS (Local, WIN_PRO) dnia 08JUN2004 o godz.
7:44 PM
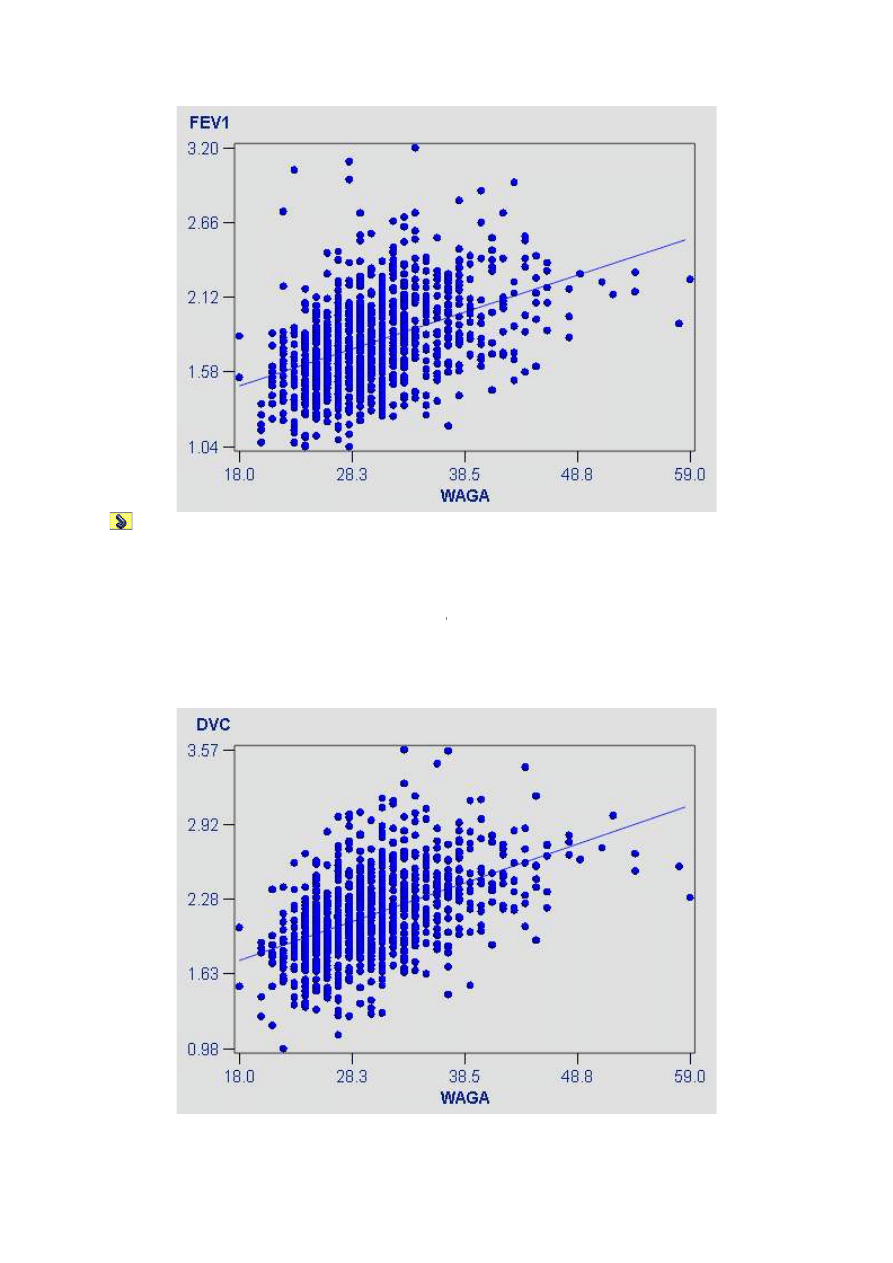
Analiza regresji
Wykresy
Obserwowane DVC od WAGA
Wygenerowane przez System SAS (Local, WIN_PRO) dnia 08JUN2004 o godz.
7:44 PM
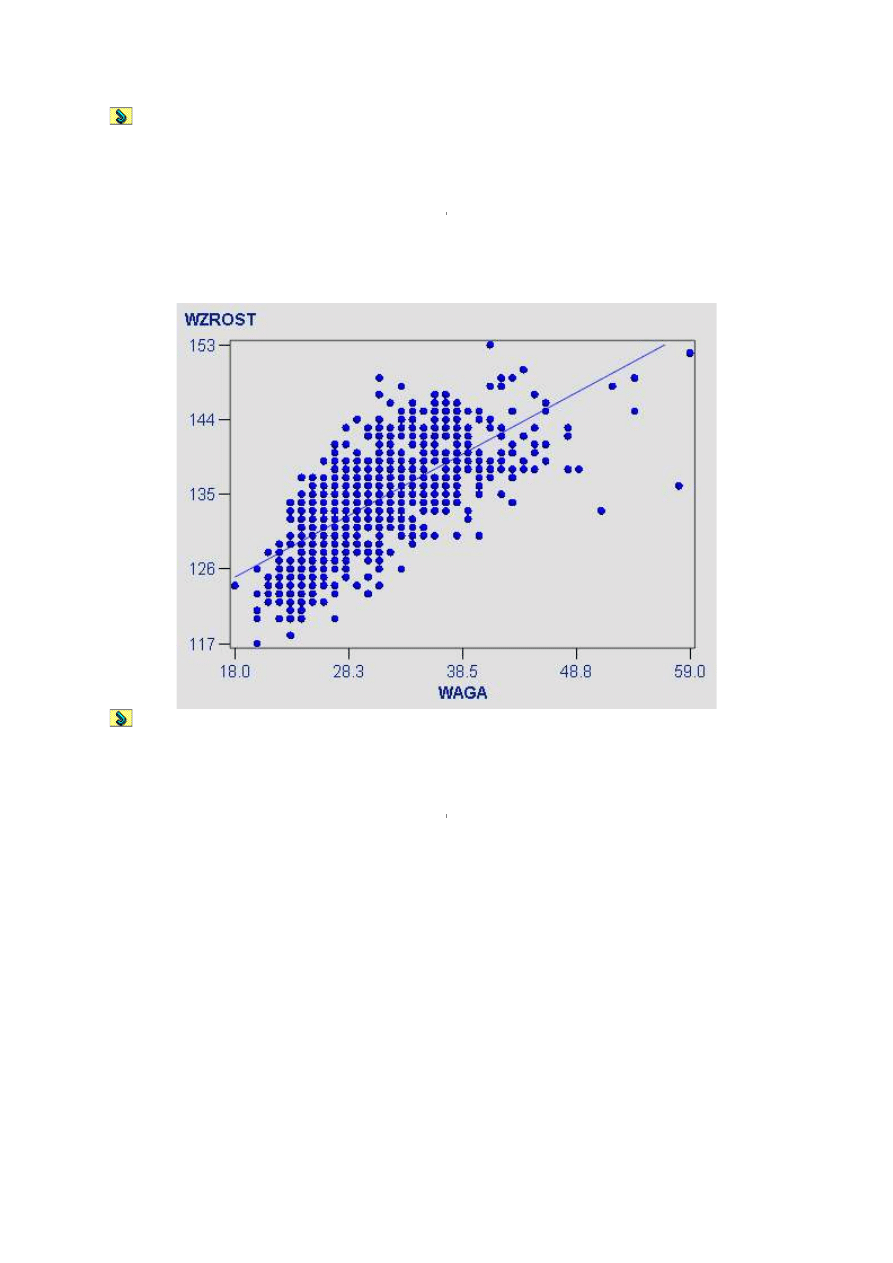
Analiza regresji
Wykresy
Obserwowane WZROST od WAGA
Wygenerowane przez System SAS (Local, WIN_PRO) dnia 08JUN2004 o godz.
7:44 PM
Analiza regresji
Wykresy
Obserwowane FEV1_VC od WAGA
Wygenerowane przez System SAS (Local, WIN_PRO) dnia 08JUN2004 o godz.
7:44 PM
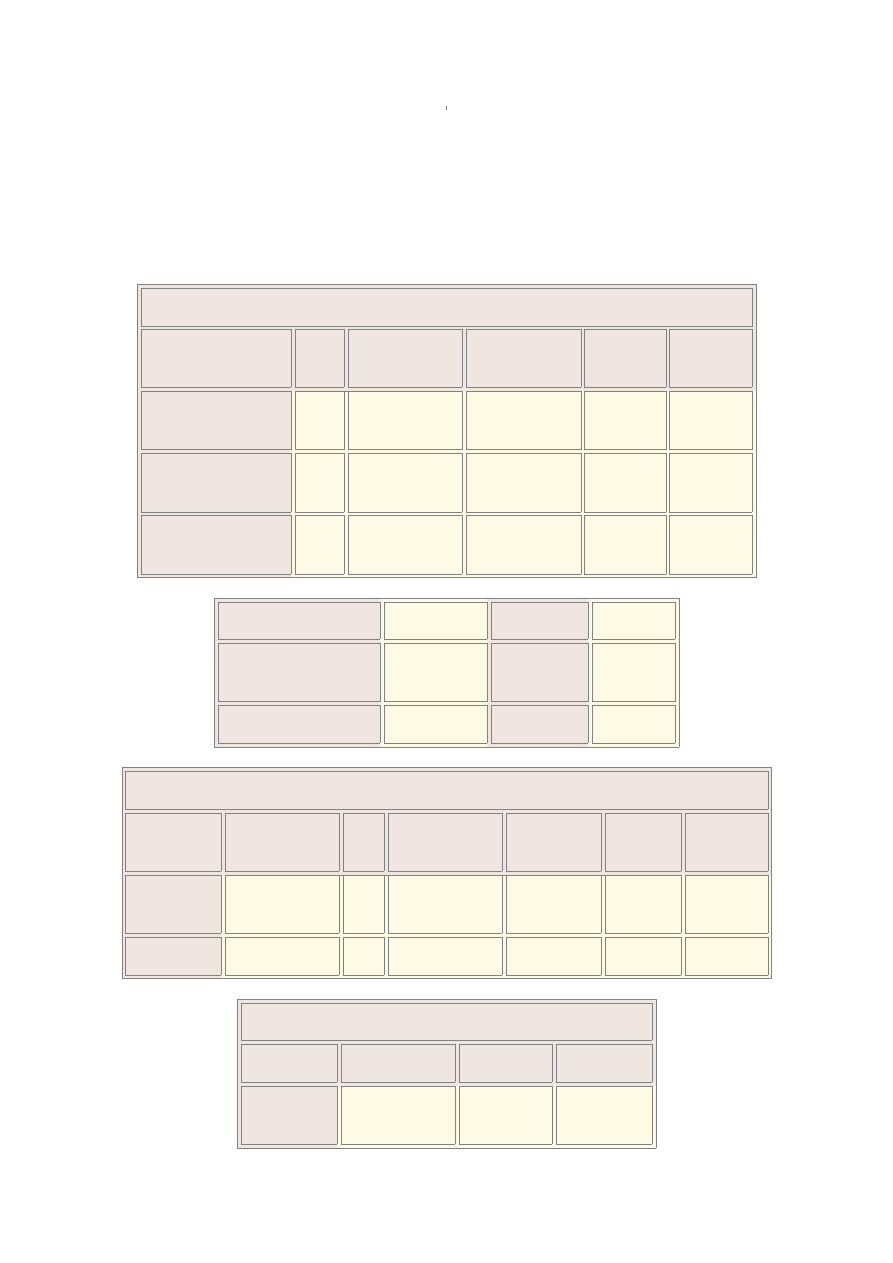
Regresja liniowa
Rezultaty
The REG Procedure
Model: Linear_Regression_Model
Dependent Variable: FEV1 FEV1
Analysis of Variance
Source
DF
Sum of
Squares
Mean
Square
F Value
Pr > F
Model
1
26.82017
26.8201
7
331.2
1
<.0001
Error
99
6
80.65215
0.08098
Analysis of Variance
Corrected Total
99
7
107.4723
2
Root MSE
0.28456
R-Square
0.2496
Dependent Mean
1.79332
Adj R-Sq
0.2488
Coeff Var
15.8679
7
Parameter Estimates
Variable
Label
DF
Parameter
Estimate
Standard
Error
t Value
Pr > |t|
Intercept
Intercep
t
1
-1.93639
0.20514
-9.44
<.0001
WZROST
WZROST
1
0.02789
0.00153
18.20
<.0001
Correlation of Estimates
Variable
Label
Intercept
WZROST
Intercept
Intercep
t
1.0000
-0.9990
WZROST
WZROST
-0.999
0
1.0000
Wygenerowane przez System SAS (Local, WIN_PRO) dnia 08JUN2004 o godz.
7:51 PM
Regresja liniowa
Rezultaty
The REG Procedure
Model: Linear_Regression_Model
Dependent Variable: DVC DVC
Analysis of Variance
Source
DF
Sum of
Squares
Mean
Square
F Value
Pr > F
Model
1
43.44342
43.4434
2
452.4
6
<.0001
Error
99
6
95.63216
0.09602
Corrected Total
99
7
139.0755
8
Root MSE
0.30986
R-Square
0.3124
Dependent Mean
2.14085
Adj R-Sq
0.3117
Coeff Var
14.4739
1
Parameter Estimates
Variable
Label
DF
Parameter
Estimate
Standard
Error
t Value
Pr > |t|
Intercept
Intercep
t
1
-2.60600
0.22338
-11.6
7
<.0001
WZROST
WZROST
1
0.03549
0.00167
21.27
<.0001
Correlation of Estimates
Variable
Label
Intercept
WZROST
Intercept
Intercep
t
1.0000
-0.9990
WZROST
WZROST
-0.999
0
1.0000
Wygenerowane przez System SAS (Local, WIN_PRO) dnia 08JUN2004 o godz.
7:51 PM
Regresja liniowa
Rezultaty
The REG Procedure
Model: Linear_Regression_Model
Dependent Variable: FEV1_VC FEV1_VC
Analysis of Variance
Source
DF
Sum of
Squares
Mean
Square
F Value
Pr > F
Model
1
424.8232
9
424.8232
9
8.31
0.0040
Error
99
6
50897
51.10105
Corrected Total
99
7
51321
Root MSE
7.14850
R-Square
0.0083
Dependent Mean
94.0238
5
Adj R-Sq
0.0073
Coeff Var
7.60286
Parameter Estimates
Variable
Label
DF
Parameter
Estimate
Standard
Error
t Value
Pr > |t|
Intercept
Intercep
t
1
108.8677
3
5.15320
21.13
<.0001
WZROST
WZROST
1
-0.11098
0.03849
-2.88
0.0040
Correlation of Estimates
Variable
Label
Intercept
WZROST
Intercept
Intercep
t
1.0000
-0.9990
Correlation of Estimates
WZROST
WZROST
-0.999
0
1.0000
Wygenerowane przez System SAS (Local, WIN_PRO) dnia 08JUN2004 o godz.
7:51 PM
Regresja liniowa
Rezultaty
The REG Procedure
Model: Linear_Regression_Model
Dependent Variable: WAGA WAGA
Analysis of Variance
Source
DF
Sum of
Squares
Mean
Square
F Value
Pr > F
Model
1
14945
14945
903.3
6
<.0001
Error
99
6
16478
16.5443
3
Corrected Total
99
7
31424
Root MSE
4.06747
R-Square
0.4756
Dependent Mean
30.0971
9
Adj R-Sq
0.4751
Coeff Var
13.5144
5
Parameter Estimates
Variable
Label
DF
Parameter
Estimate
Standard
Error
t Value
Pr > |t|
Parameter Estimates
Intercept
Intercep
t
1
-57.9463
3
2.93216
-19.7
6
<.0001
WZROST
WZROST
1
0.65827
0.02190
30.06
<.0001
Correlation of Estimates
Variable
Label
Intercept
WZROST
Intercept
Intercep
t
1.0000
-0.9990
WZROST
WZROST
-0.999
0
1.0000
Wygenerowane przez System SAS (Local, WIN_PRO) dnia 08JUN2004 o godz.
7:51 PM
Analiza regresji
Wykresy
Obserwowane FEV1 od WZROST
Wygenerowane przez System SAS (Local, WIN_PRO) dnia 08JUN2004 o godz.
7:51 PM
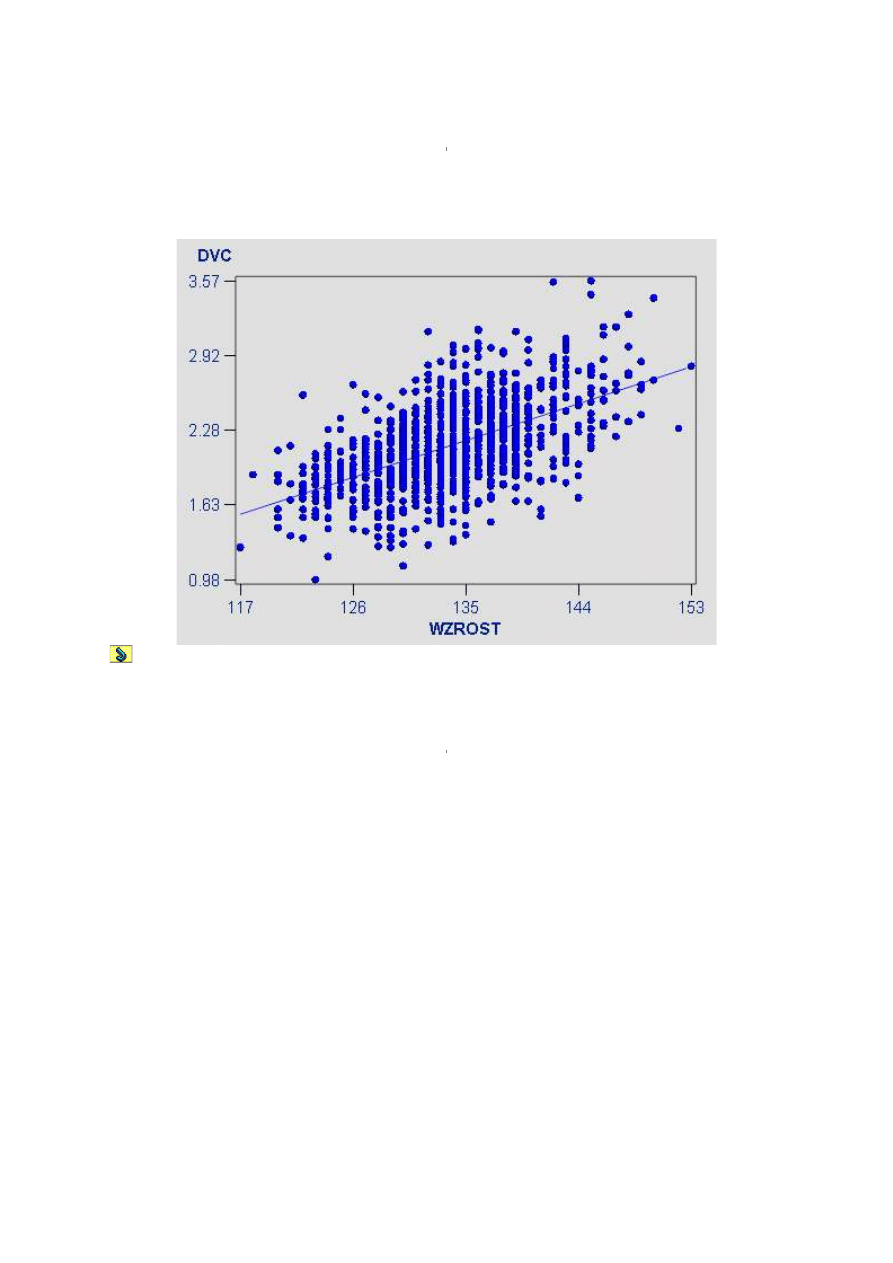
Analiza regresji
Wykresy
Obserwowane DVC od WZROST
Wygenerowane przez System SAS (Local, WIN_PRO) dnia 08JUN2004 o godz.
7:51 PM
Analiza regresji
Wykresy
Obserwowane FEV1_VC od WZROST

Wygenerowane przez System SAS (Local, WIN_PRO) dnia 08JUN2004 o godz.
7:51 PM
Analiza regresji
Wykresy
Obserwowane WAGA od WZROST

Wygenerowane przez System SAS (Local, WIN_PRO) dnia 08JUN2004 o godz.
7:51 PM
Wyszukiwarka
Podobne podstrony:
48 Na czym polega różnica między zmiennymi Lagrangea i zmiennymi Eulera
ZALEŻNOŚĆ HIERARCHICZNA MIĘDZY?LAMI ORGANIZACYJNYMI
Zadania ze statystyki cz5 związki między zmiennymi
2009 2010 STATYSTYKA ZALEZNOSC LINIOWA
Zależności nieantagonistyczne między populacjami biologia
Regresja liniowa dwoch zmiennych, materiały z roku 2011-2012, Semestr II, Statystyka opisowa - ćwicz
2009 2010 STATYSTYKA ZALEZNOSC LINIOWAid 26684
współzależność, Współczynnik korelacji liniowej oraz funkcja regresji liniowej dwóch zmiennych
Liniowe przeksztalcenie zmienny Nieznany
48 Na czym polega różnica między zmiennymi Lagrangea i zmiennymi Eulera
Model liniowy z dwiema zmiennymi objaśniającymi
zadanie 1- zmienne i zaleznosci miedzy nimi, Statyst. zadania
30 Struktury zaleznosci miedzy wskaznikami zrow rozw K Chmura
8 WZAJEMNE ZALEŻNOŚCI MIĘDZY SIŁAMI
EKSPERYMENTY Z POMIARAMI DYSTANSOWYMI WARTOŚCIAMI ZMIENNEJ ZALEŻNEJ
więcej podobnych podstron