
Taxation trends in the
European Union
Main results
2012 edition
Kata Prolic

1. About publication
2. Introduction
3. Taxation of consumption
4. Taxation of labour
5. Corporate income taxes
6. Environmental taxation
7. Taxation of property
8. Conclusion
Agenda

About publication
•
The objective of the report - to present a
complete view of the structure, level and trends
of taxation in the Union over a medium to long-
term period
•
Issued by the Directorate-General for Taxation
and Customs Union and Eurostat
•
Available only in English
•
Download: http://ec.europa.eu/taxtrends or
http://ec.europa.eu/eurostat
•
Covers each EU Member State + Iceland and
Norway

Introduction
•
EU - a high tax area
•
38,4% in the GDP-weighted average
•
Among developed countries only Canada and
New Zealand have tax ratios that exceed 30%
of GDP
•
Less developed countries - relatively low tax
ratios
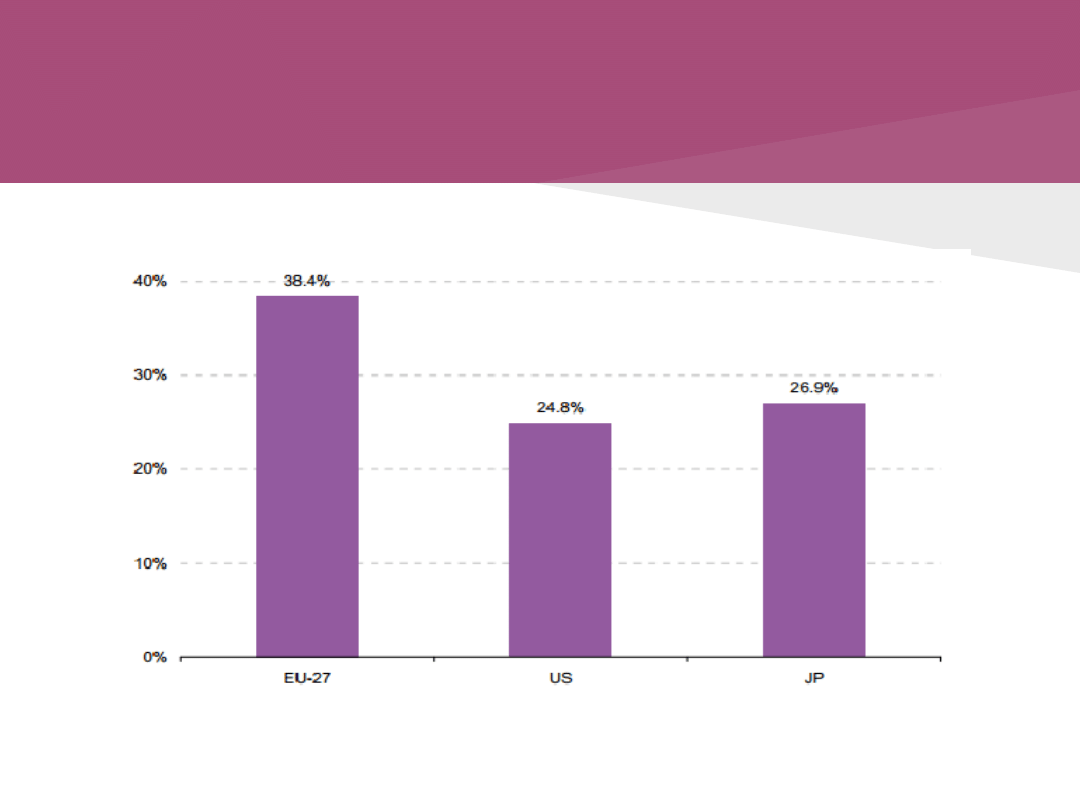
Overall tax-to-GDP ratio in the EU,
US and Japan, 2010
Source: Commission Service and Eurostat (ESA95) for the EU, OECD
(SNA2008) for the US and Japan

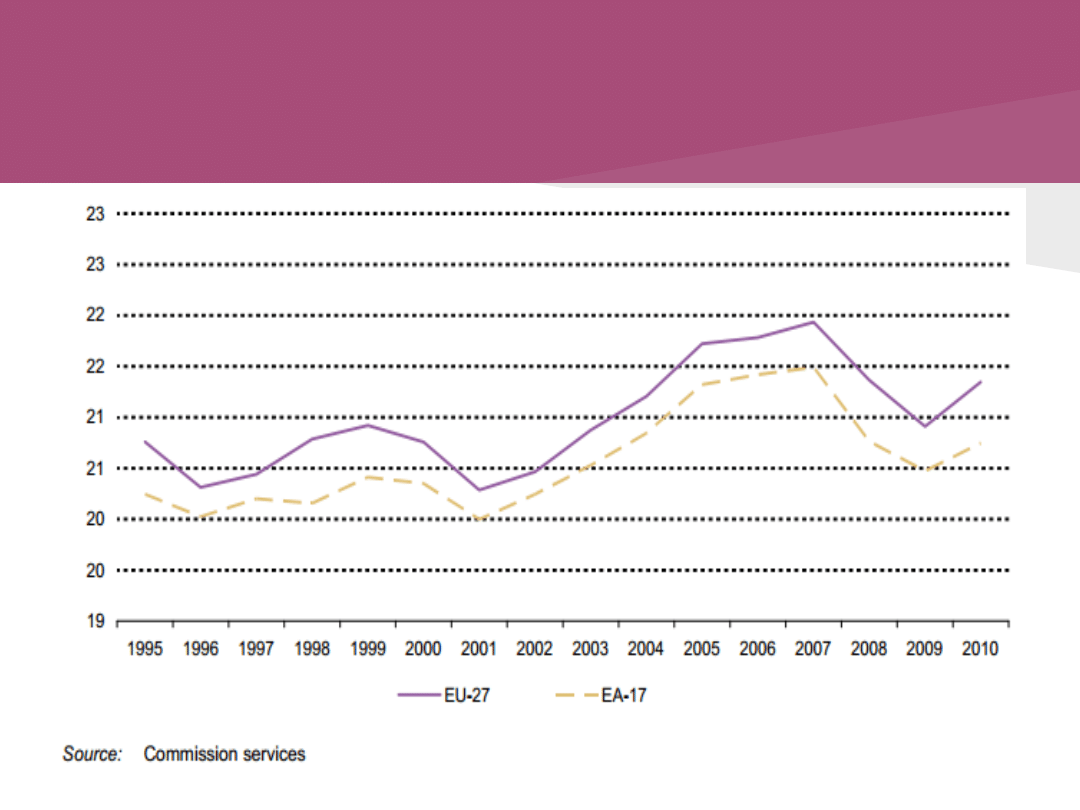
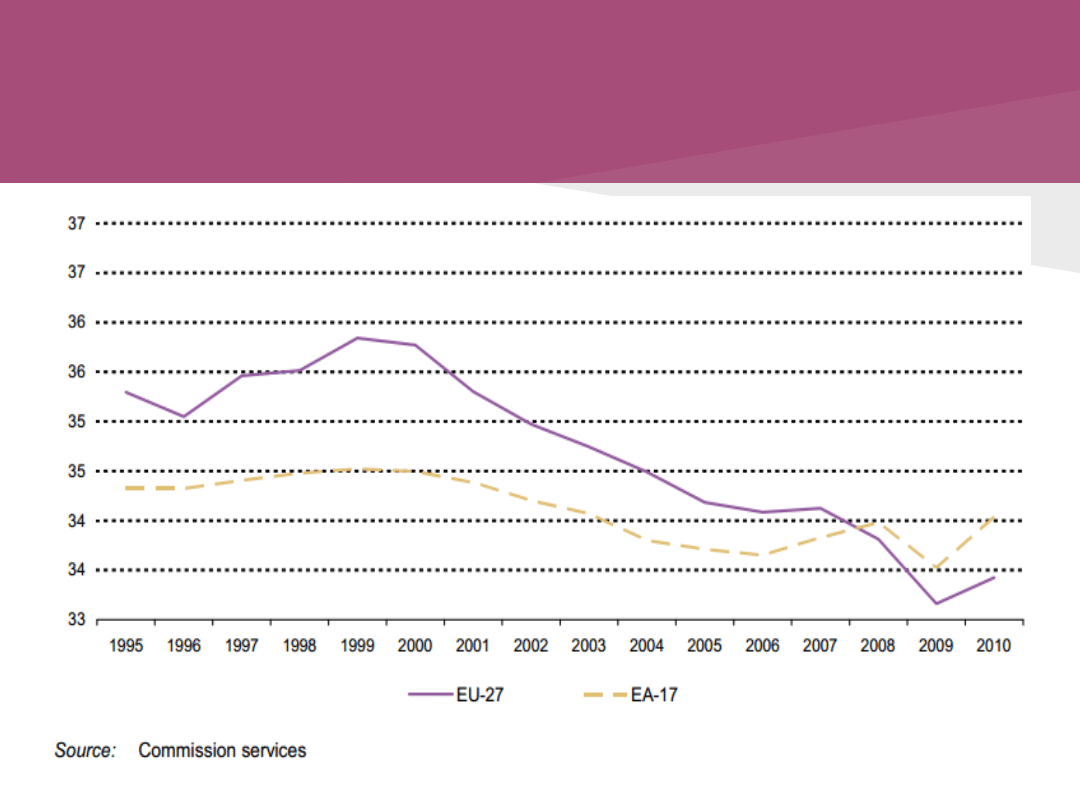
Trends from 1970 until 2010
•
Increasing trend from the 1970s
•
Decreasing trend from 2000 - lasted only
few years
•
Tax ratios picked up again until 2007
•
Tax revenues dropped as a result of the
crisis, but stabilised already in 2010
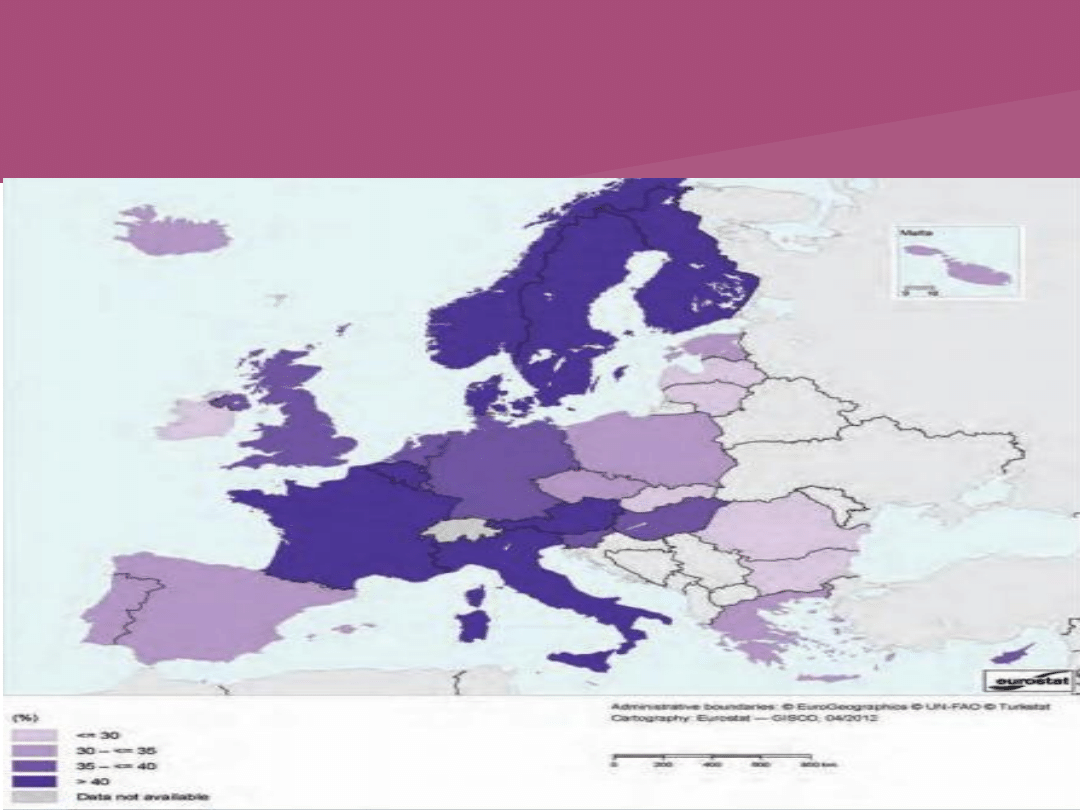
Total taxes as % of GDP,
2010

Taxation of consumption
1. VAT (Value added tax)
2. Non-VAT taxes:
•
Taxes on energy (motor fuels and
heating fuels, such as petrol and
gasoline, electricity, natural gas, coal
and coke)
•
Taxes on tobacco
•
Taxes on alcohol
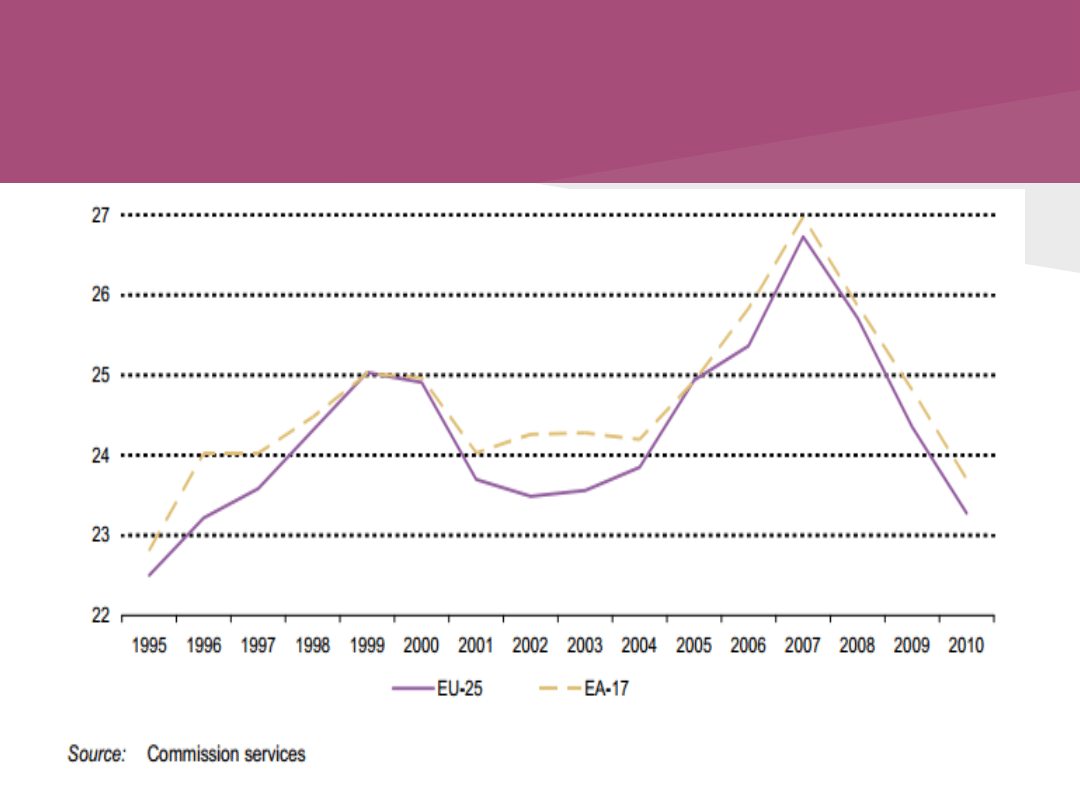
Implicit tax rate on consumption
1995-2010, in % (arithmetic averages)
VAT rates (standard rates)
Highest rates:
1. Hungary 27%
2. Sweden & Denmark 25%
3. Romania 24%
Lowest rates:
1. Luxembourg 15%
2. Cyprus 17%
3. Malta 18%
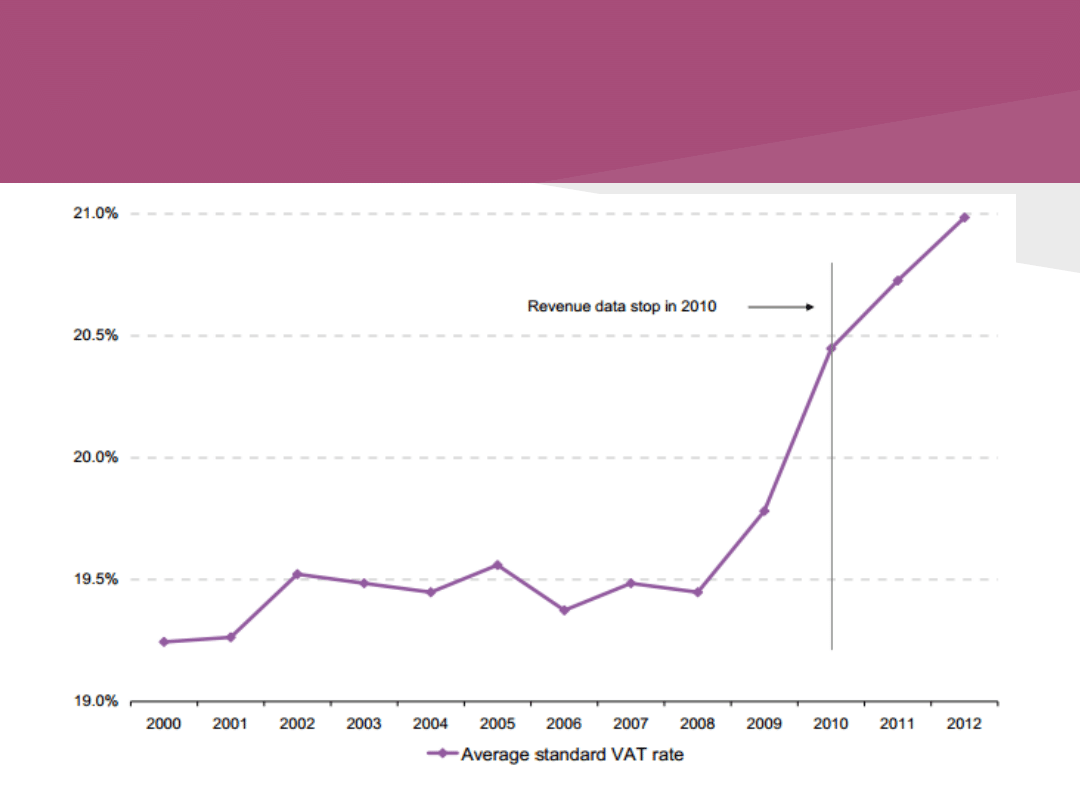
Development of average
standard VAT rate, EU-27
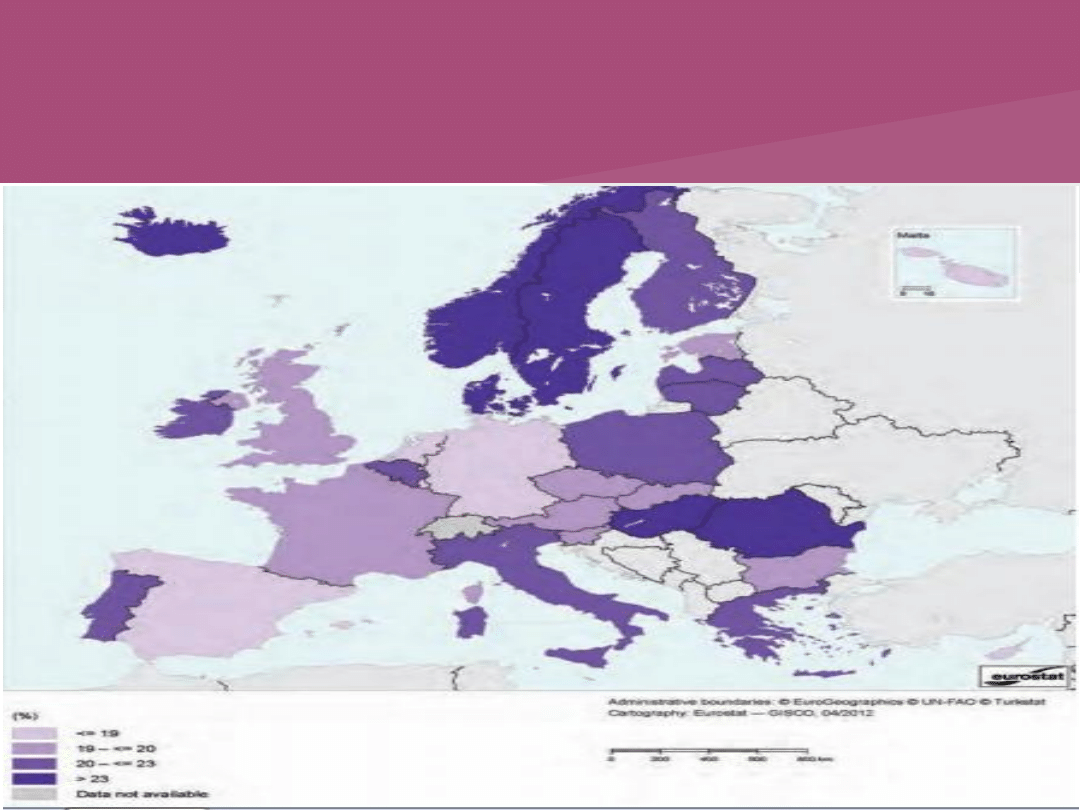
Distribution of standard
VAT rate, 2012

Taxation of labour
1. Personal income taxes (PIT)
2. Social security contributions (SSC)
•
About 2/3 of the overall ITR on labour
consists of non-wage labour costs
•
Exceptions: Denmark, Ireland and the UK
•
Poland, Greece and Slovakia: less than 20%
of the ITR on labour consists of the PIT
Implicit tax rate on labour
1995-2010, in % (arithmetic averages)

Implicit tax rate on labour
•
Highest reduction in the ITR on labour since
2000 have taken place in Bulgaria and
Lithuania (all above 8 percentage points)
•
Nordic Member States brought the tax
burden closer to the EU average in recent
years
•
The highest ITR on labour: Italy (42%) and
Belgium (42,5%)
•
The lowest ITR on labour: Malta, Portugal
and Bulgaria
PIT rates
•
38,1% on average
•
Lowest:
Bulgaria (10%),
the Czech Republic,
Lithuania and
Romania
•
Highest:
Nordic countries
(55,4%)
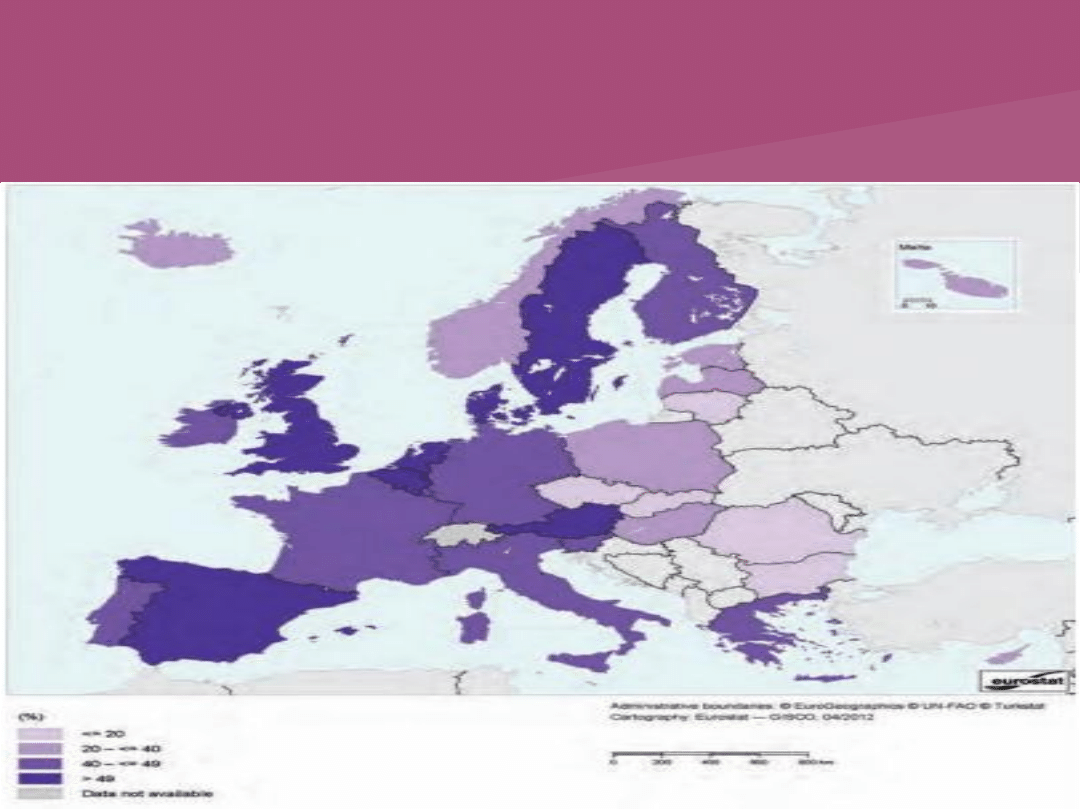
Top personal income tax
rates, 2012 (%)
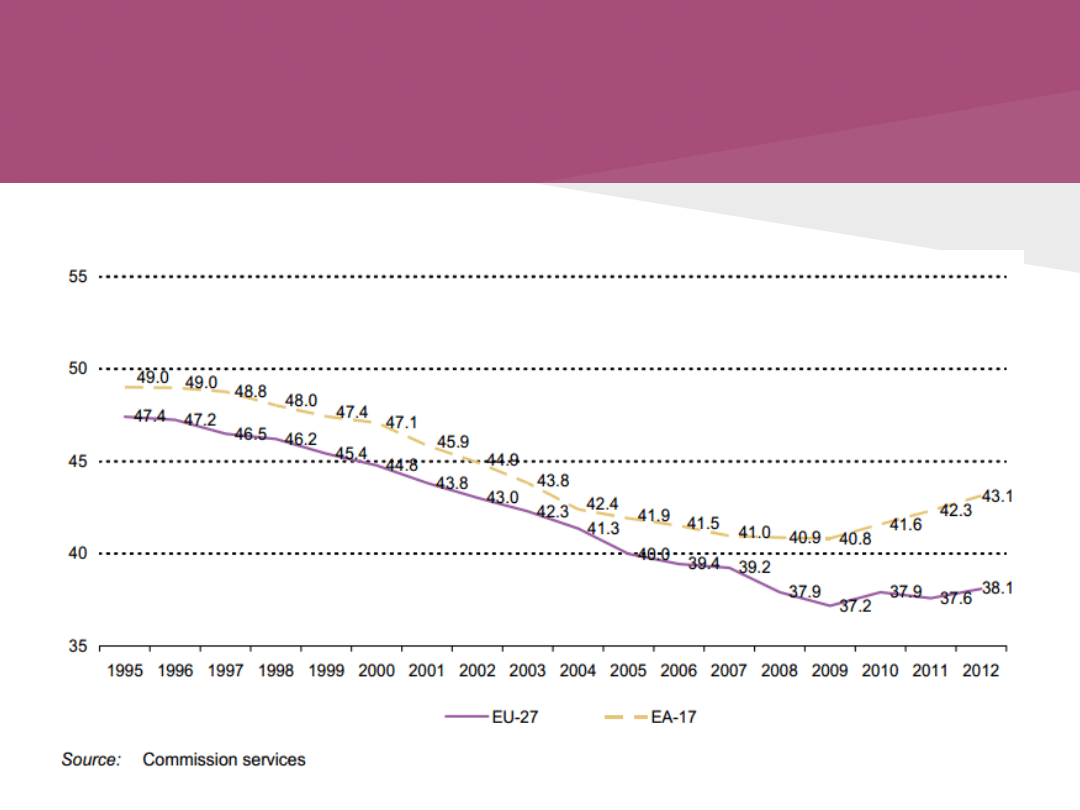
Development of top personal
income tax rate
1995-2012, in % (arithmetic averages)

Corporate Income Taxes
(CIT)
•
The most important tax on capital income
•
Bulgaria & Cyprus: 10%
•
France: 36,1%
•
Denmark & Sweden display corporate tax
rates that are not much above the average!
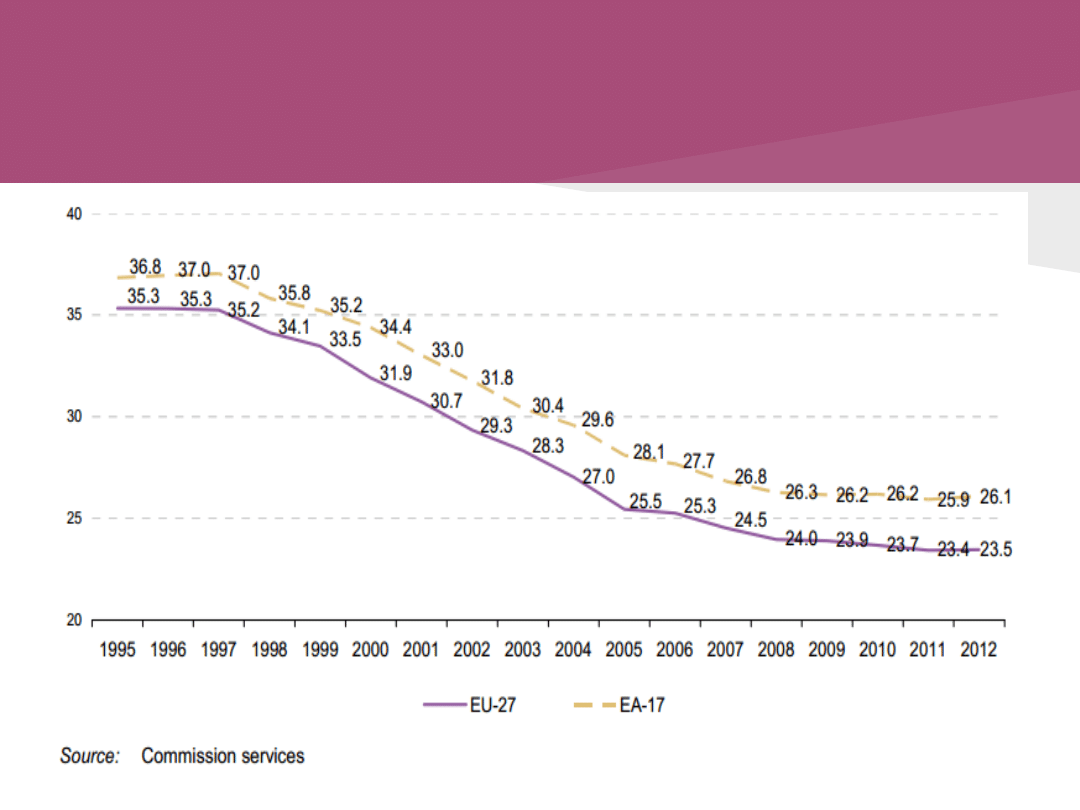
Development of adjusted top statutory
tax rate on corporate income
1995-2012, in % (arithmetic averages)
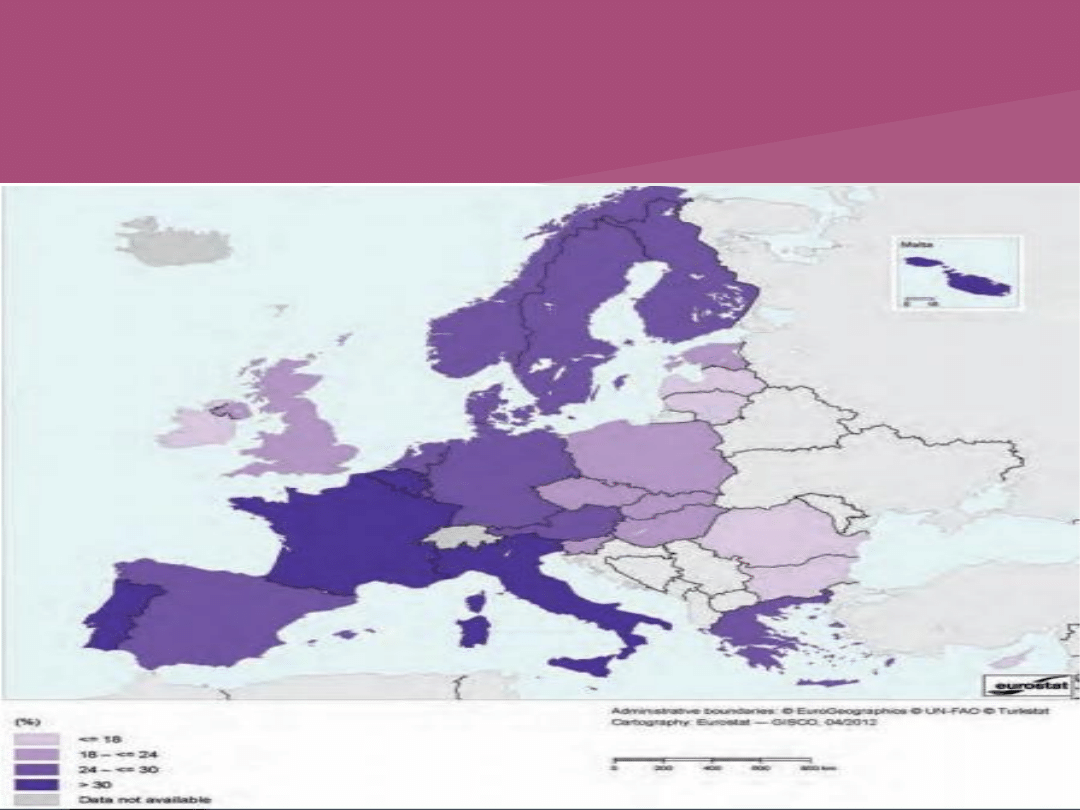
Distribution of top
corporate tax rates, 2012 in %
Implicit tax rate on capital
1995-2010, in % (arithmetic averages)

Environmental taxation
1. Excise duties on energy products
2. Taxes on transport vehicles
3. Pollution taxes
•
Tax base is a physical unit of something that
has a proven negative impact on the
environment
•
Environmental taxation raises on average
3% of GDP
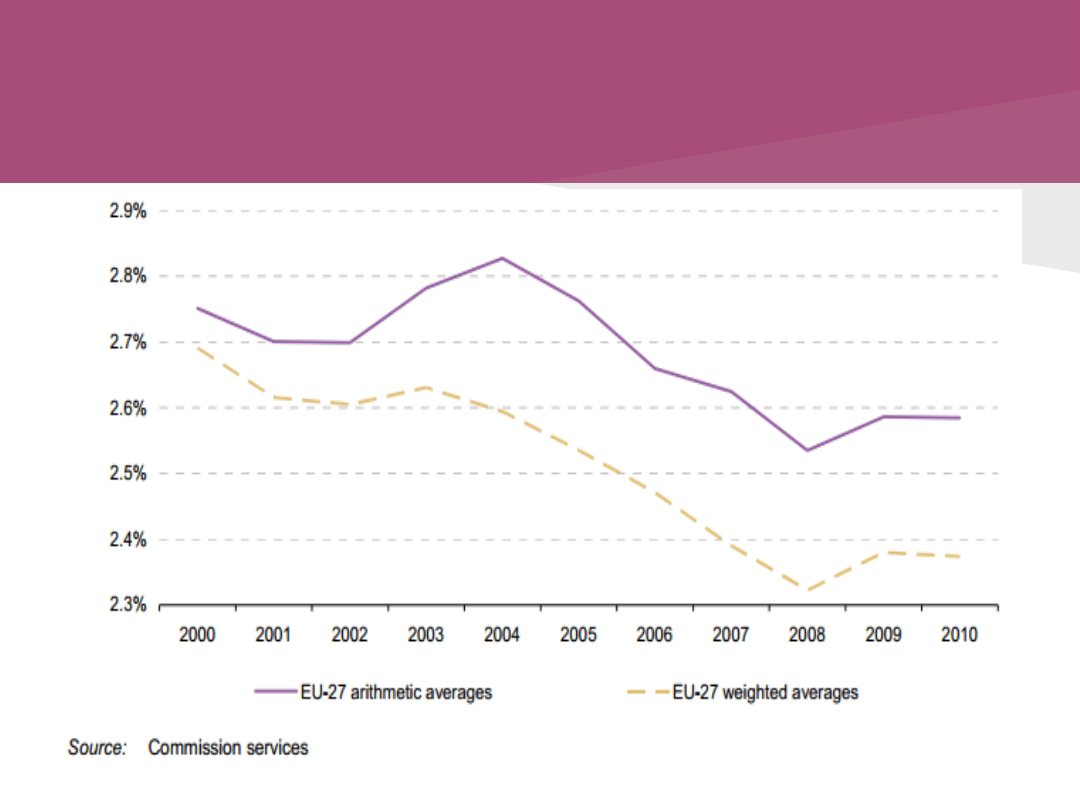
Environmental tax revenue
2000-2010 in % of GDP
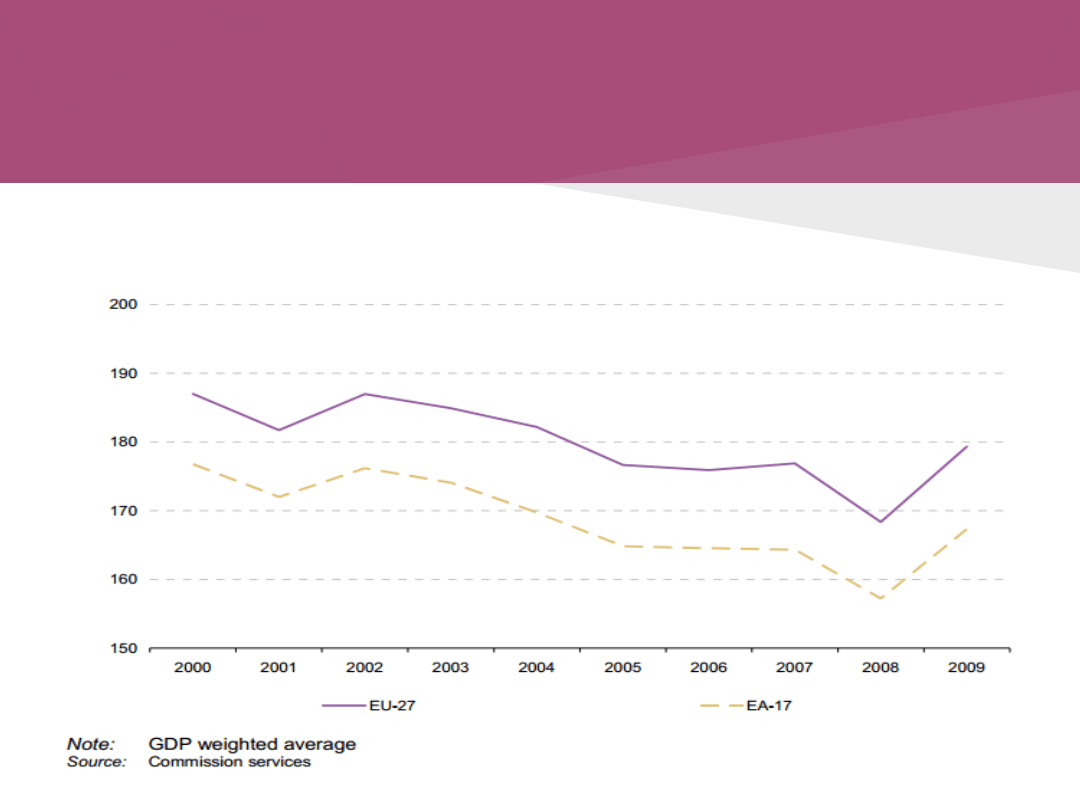
Energy tax revenues in relation to final
energy consumption (real ITR on energy)
Euro per tonne of oil equivalent, deflated with
cumulative % change in final demand deflator
(2000=100)

Fuel taxes
•
Importance varies across Member States
•
Above 90%: Latvia, Lithuania, Bulgaria,
Luxembourg
•
About 50%: Denmark, Sweden
•
Some Member States apply the EU required
minimum rate and others 200 times the
minimum

Taxation of property in the
EU
1. Recurrent taxes on immovable property
2. Transaction taxes
Taxes on property-total:
•
3,6% of total taxation
•
1,3% of GDP
Recurrent taxes on immovable property:
0,7% of GDP
Transaction taxes on property in general:
0,6% of GDP

Conclusion (1)
•
EU-15: raise equal shares of revenues from
direct, indirect taxes and social security
contributions
•
NMS-12: display a lower share of direct taxes
in the total (except for Malta)
•
Labour income taxes: 50% of receipts
•
Consumption: 1/3
•
Capital: 1/5

Conclusion (2)
•
Tax revenues stabilised in 2010 and expected
to grow in the future
•
Ongoing strong increase in VAT rates,
spreading to more countries
•
Environmental taxes up on excise tax hikes
•
Other tax rates have stopped declining and
show signs of increasing
•
Growth-friendly taxation: mixed picture -
increase in consumption taxes but no cut in
labour taxes

Thank you for your
attention!
Wyszukiwarka
Podobne podstrony:
M Hallerberg Fiscal federalism reforms in the European Union and the Greek crisis
Kamiński, Tomasz The Chinese Factor in Developingthe Grand Strategy of the European Union (2014)
Mandelson Peter The European Union in the Global Age
The law of the European Union
The European Union is the world
The law of the European Union
Enlarging the European Union Where does Turkey Stand
Hodgson Julian Trends in the Czech Schmid Benoni 1991 OCR, 46p
Pavel Pavlov Human Presence In The European Arctic Nearly 40 000 Years Ago
Hodgson Julian Trends in the Torre and Trompovsky 2, 1995, NoOCR, 40p
Karen Alter Judicial Law Making in the European Court
INTRODUCTION TO THE EUROPEAN UNION
Lalic Bogdan Trends in the English with 1 e5, 1995 NoOCR, 40p
Galician and Irish in the European Context Attitudes towards Weak and Strong Minority Languages (B O
Błaszczyk, Maria Celina Poland’s Integration with the European Union (2015)
Barry McLoughlin, Kevin McDermott Stalin s Terror, High Politics and Mass Repression in the Soviet
McNab Collin Trends in the English with 1 c5, 1990 NoOCR, 44p
A F Harding, European Societies in the Bronze Age (chapter 6)
The History of the Western European Union
więcej podobnych podstron