
EUROPEAN UNEMPLOYMENT:
THE EVOLUTION OF FACTS AND IDEAS
Olivier Blanchard
Working Paper
11750

NBER WORKING PAPER SERIES
EUROPEAN UNEMPLOYMENT:
THE EVOLUTION OF FACTS AND IDEAS
Olivier Blanchard
Working Paper 11750
http://www.nber.org/papers/w11750
NATIONAL BUREAU OF ECONOMIC RESEARCH
1050 Massachusetts Avenue
Cambridge, MA 02138
November 2005
Prepared for the Economic Policy Panel, London, October 2005. I thank Giuseppe Bertola, Ricardo
Caballero, Emmanuel Farhi, Thomas Philippon, Steve Nickell, Julio Rotemberg, Thomas Sargent, and Robert
Solow for comments. The views expressed herein are those of the author(s) and do not necessarily reflect
the views of the National Bureau of Economic Research.
©2005 by Olivier Blanchard. All rights reserved. Short sections of text, not to exceed two paragraphs, may
be quoted without explicit permission provided that full credit, including © notice, is given to the source.

European Unemployment: The Evolution of Facts and Ideas
Olivier Blanchard
NBER Working Paper No. 11750
November 2005
JEL No. E24, J6
ABSTRACT
In the 1970s, European unemployment started increasing. It increased further in the 1980s, to reach
a plateau in the 1990s. It is still high today, although the average unemployment rate hides a high
degree of heterogeneity across countries. The focus of researchers and policy makers was initially
on the role of shocks. As unemployment remained high, the focus has progressively shifted to
institutions. This paper reviews the interaction of facts and theories, and gives a tentative assessment
of what we know and what we still do not know.
Olivier Blanchard
Department of Economics
E52-357
MIT
Cambridge, MA 02139
and NBER
blanchar@mit.edu

Introduction
From the end of World War II to the end of the 1960s, European unemployment
was very low. In the 1970s, it started increasing. It continued to increase in the
1980s, and to reach a high plateau in the 1990s. It is still high today, although
the average European unemployment rate hides a high degree of heterogeneity
across countries.
This has been a tough learning experience, both for economists and for policy
makers. When the 1970s started, the concept of a natural rate of unemploy-
ment was just born, and still far from operational. The following quote from
Milton Friedman (1968) is revealing: “The natural rate of unemployment is the
level which would be ground out by the Walrasian system of general equilib-
rium equations, provided that there is imbedded in them the actual structural
characteristics of the labor and commodity markets, including market imper-
fections, stochastic variability in demands and supplies, the cost of gathering
information about job vacancies and labor availabilities, the costs of mobility,
and so on.”
One might have hoped that, with thirty years of data, with clear differences
in the evolution of unemployment rates and policies across countries, we would
now have an operational theory of unemployment. I do not think that we do.
Many theories have come and—partly—gone. Each has added a layer to our
knowledge, but our knowlege remains very incomplete. To use a well worn for-
mula, we have learned a lot, but we still have a lot to learn.
The purpose of this paper is to review the developments, both on the unemploy-
ment and the theory fronts, and give an assessment of where we are today. Let
me start with two caveats. I have not tried to be encyclopedic.
1
And, because
the editors unwisely encouraged me to do so, I have certainly focused too much
on my own research—one of the results being a Stiglitz–like bibliography. For
my defense, I would argue that it is broadly representative of the twists and
turns of our theories over the last thirty years.
I review the basic facts, across time and across countries, in Section 1. As
1.
A more encyclopedic and very good survey, but now 10 years old, was given by Charles
Bean (1994). A more recent one was given by Stephen Nickell (1997). The standard reference
on unemployment in general, and European unemployment in particular, remains the book
by Richard Layard, Stephen Nickell, and Richard Jackman published in 1991 (2nd edition,
2005).
2

unemployment increased in the 1970s, the initial focus was on the role of shocks,
from oil price increases to the slowdown in productivity growth. This is the
topic of Section 2. As the shocks receded but unemployment remained high, the
focus shifted in the 1980s to persistence mechanisms, from the role of capital
accumulation, to the role of insiders in bargaining. This is the topic of Section 3.
In the early 1990s, the focus shifted yet again, this time towards the role of labor
market institutions, from employment protection to unemployment insurance.
This is the topic of Section 4. Since then, research has tried to sort out the
respective role of shocks, institutions, and interactions. The main directions of
exploration and the open questions are the topic of Section 5. The state of play,
and whether we know enough to usefully guide policy and reforms, are taken
up in Section 6.
1
Basic Facts
Figure 1 gives the evolution of the unemployment rate for the EU15 as a whole
(the 15 member countries of the European Union) since 1960. It shows the
steady increase in unemployment from 2% in the 1960s to 8% in the 1980s, and
a rough plateau—with cyclical declines at the end of the 1980s and 1990s—since
then.
2
4
6
8
10
percent
1960
1970
1980
1990
2000
Figure 1. EU15 unemployment rate, since 1960
3
Source: OECD database.
How much of the increase reflects an increase in the natural rate, and how much
reflects an increase of the actual rate over the natural rate? The answer to
that question is relatively straightforward: Since 2000, EU15 inflation has been
indeed roughly constant—around 2% using the CPI index. If we take a stable
inflation rate to be an indication that unemployment is roughly at the natural
rate, this suggests that, today, the EU15 actual unemployment rate is close to
the natural rate.
2
It follows that the increase in the actual unemployment rate
since 1970 reflects, for the most part, an increase in the natural rate.
2
4
6
8
10
percent
1960
1970
1980
1990
2000
actual
natural
Figure 2. EU15 actual and constructed natural rate
Source: OECD database and text
Can one tell how the natural rate has increased over time? The answer to that
question is obviously much harder. Despite its limits, I find the following exercise
to be useful: If we are willing to assume that, when unemployment is below the
natural rate, inflation will tend to increase, and when unemployment is above
the natural rate, inflation will tend to decrease, we can construct a series for
the natural rate using the actual rate and the change in inflation. The results of
2.
One may question however whether this relation holds at very low rates of inflation; I
return to the issue in the last section of the paper.
4

such a construction are presented in Figure 2.
3
They suggest that the natural
rate increased in the 1970s and early 1980s, and has remained roughly stable
since then.
Heterogeneity across countries
Turning from the EU15 average to individual countries, Figure 3 gives the
unemployment rates in each of the EU15 countries as of May 2005 (for reference,
the evolution of unemployment rates in each EU15 country is shown in the
appendix.)
0
2
4
6
8
10
percent
Ireland
Austria
United Kingdom
Luxembourg
Denmark
Netherlands
Sweden
Portugal
Italy
Belgium
Finland
Germany
France
Spain
Greece
Figure 3. EU15 unemployment rates, 2005
Source: Eurostat
The figure shows the large heterogeneity of unemployment rates across coun-
tries. While this heterogeneity has always been present, it is more marked today,
3.
The series for the natural rate is constructed as follows: Start from the relation π =
π(−1) − a(u − u
∗
) where π is the rate of inflation, u and u
∗
are the actual and natural rates of
unemployment respectively. Rewrite the relation as u
∗
= u + (1/a)(∆π). The series for u
∗
in
Figure 2 is constructed using this relation, using a = .5 (a value consistent with econometric
estimates for Europe) and a three-year moving average of the change in CPI inflation for ∆π.
(A different value for a would change the amplitude of the movements in u
∗
relative to u, but
not the ordering of the two rates in a given year.)
5

to the point where talking about “European unemployment” is indeed mis-
leading. Unemployment is low in many countries: As of mid–2005, the United
Kingdom, the Netherlands, Denmark, Ireland, and Austria all have unemploy-
ment rates lower than the United States. And high average European unem-
ployment reflects high unemployment in the four large continental countries,
Germany, France, Italy, and Spain. Even among these four countries, the dif-
ferences are striking. Spain’s unemployment rate is down from more than 20%
in the early 1990s.
4
Germany’s unemployment rate is instead up from its low
pre-reunification level, and shows sharp regional differences between the West
and the East. Italy’s and France’s unemployment rates have been high since
the early 1980s. But Italy’s rate shows sharp regional differences between the
North and the South. France’s does not.
Unemployment, Flows, and Duration
As a matter of arithmetic, a high unemployment rate may be the result of high
flows in and out of unemployment, or/and a high average duration of unem-
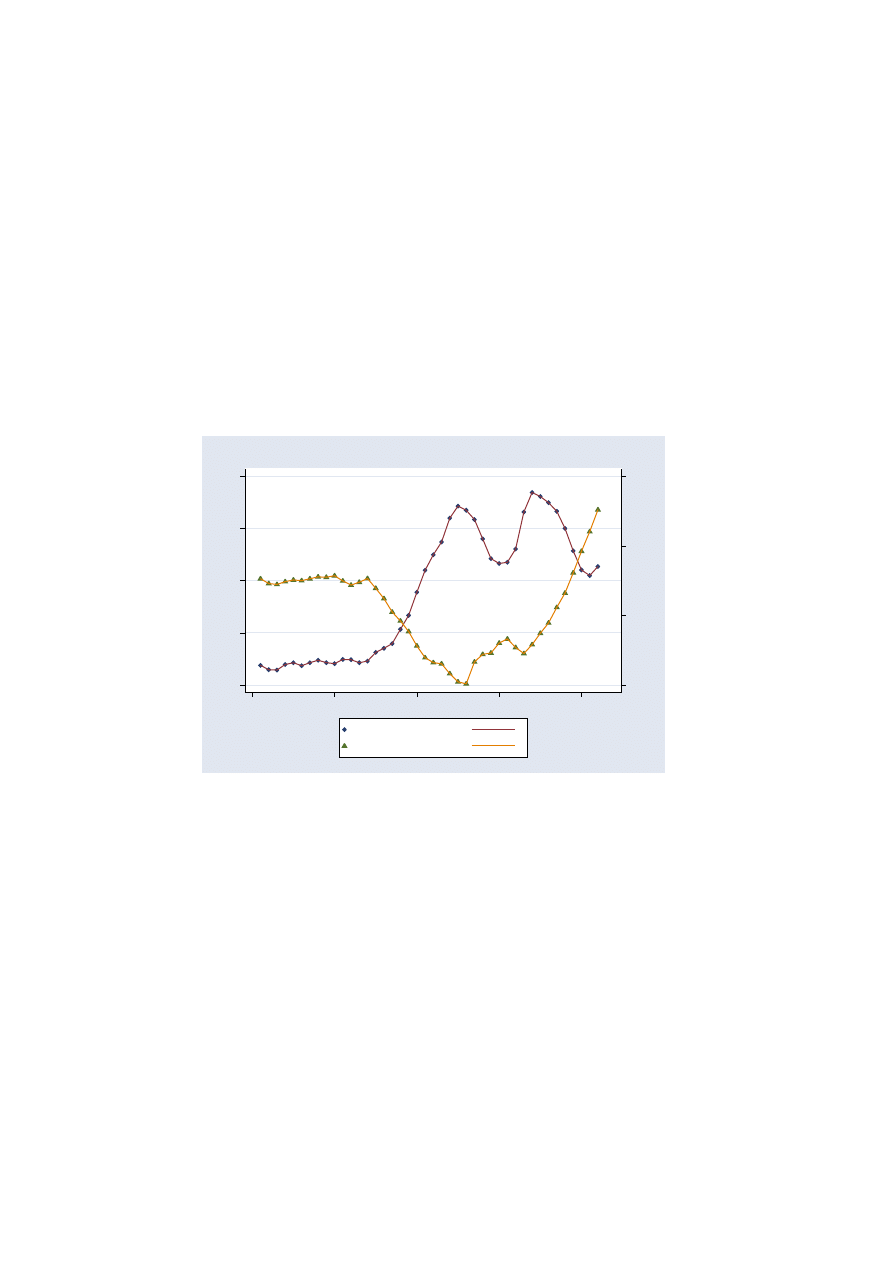
ployment. Figure 4, which gives the evolution of the unemployment rate and
unemployment duration in France (for which data on the composition unem-
ployment by duration exists going back to 1968) shows that the increase in
the unemployment rate has come with a large increase in duration.The figure
suggests that duration, which was already higher than that of United States in
the late 1960s, has more than doubled since then, and now stands as well over
a year.
5
The proportion of long term unemployed (unemployed for more than a
year) has increased from 20% in the late 1960s, to more than 40% today. From
the point of view of the unemployed, being unemployed in Europe has always
been a different experience from being unemployed in the United States—where
mean duration has remained around 3 months—, and has become increasingly
so over time.
4.
In 1994, the official number for the unemployment rate reached 24%. The definition of
unemployment and the numbers have since been revised, and the current time series have
unemployment peaking at 18.4% in 1994.
5.
The increase in duration would be even larger, were it not for the increasing role of
temporary contracts since the early 1980s, contracts which are typically associated with shorter
ensuing unemployment spells.
6
6
8
10
12
14
16
Average duration
2
4
6
8
10
12
Unemployment rate
1970
1980
1990
2000
2010
Unemployment rate
Unemployment duration (months)
Figure 4. Unemployment rate and duration in France
Source: Enqu`etes Emploi, INSEE, series longues; with adjustment by author
for 1968 to 1974.
Unemployment rates across workers
Another dimension of unemployment is how it affects different groups, skilled
versus unskilled workers, young versus older workers, men versus women. One
often-mentioned characteristic of European unemployment is how high the un-
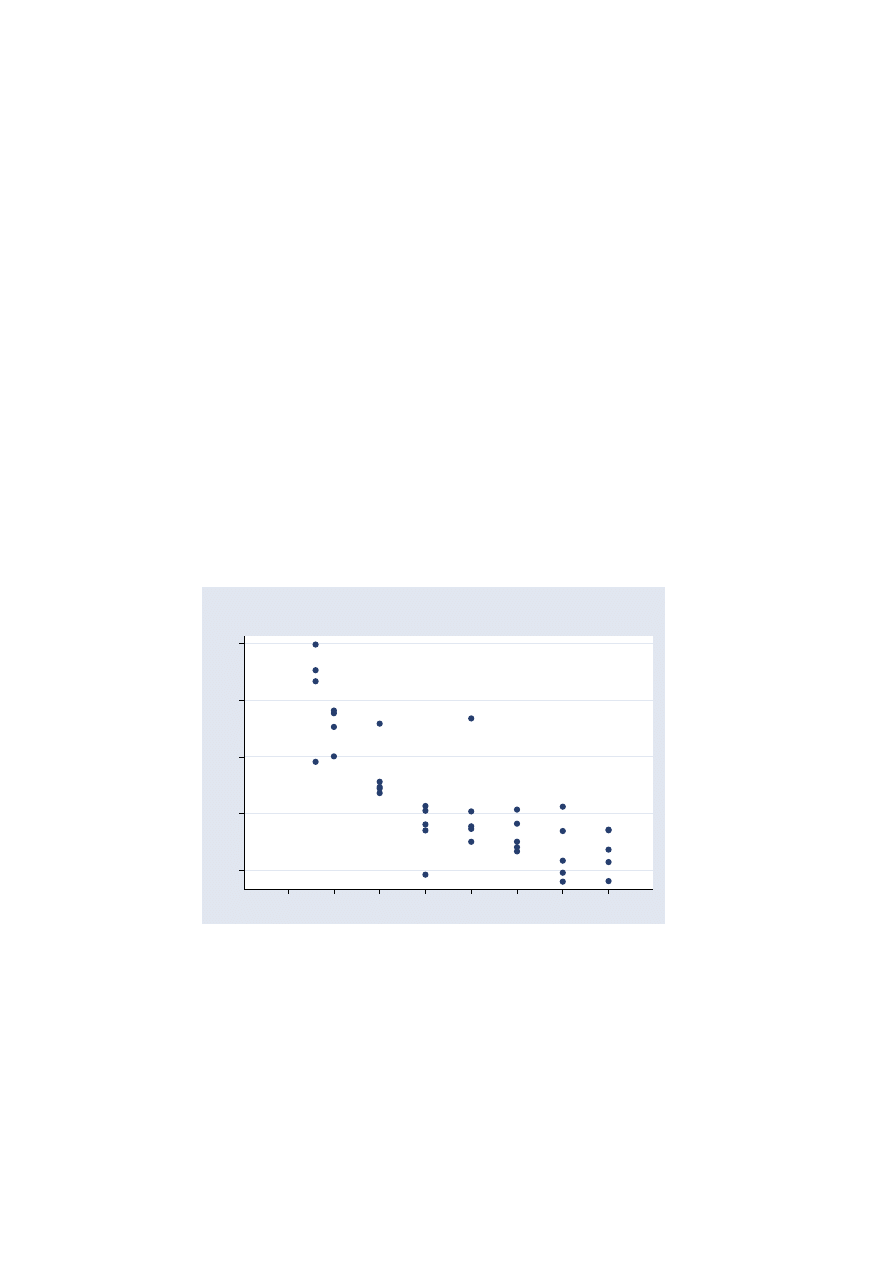
employment rate is among young workers. This is shown in Figure 5, which
plots the unemployment rate for the 15-24 age group against the overall unem-
ployment rate for each EU15 country for the year 2004. Some countries, such as
Italy and Greece, indeed have very high youth unemployment rates, in excess of
25%. Whether this reflects a uniquely European pathology is less clear however.
In all countries, high unemployment is associated with higher unemployment
for some groups, the young and the unskilled in particular. To see whether the
experience of Europe is unusual in this respect, I also plot in Figure 5 the cor-
responding numbers for the United States for each year since 1960—each year
represented by a small circle. Put simply, the points for the cross section of
European countries are not far off the regression line one would obtain from
US time series. Italy and Greece indeed have much more youth unemployment
7
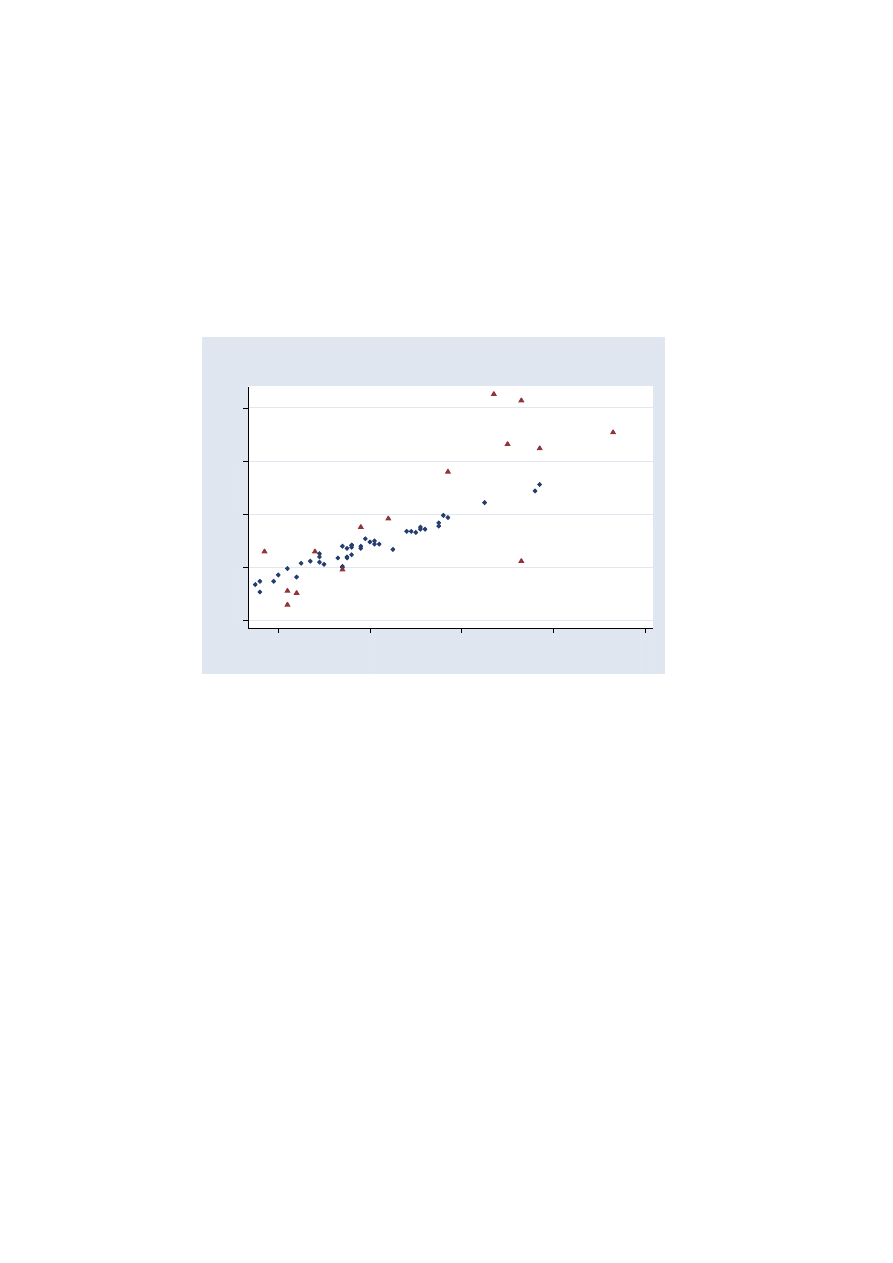
than the regression line would predict, Germany much less (because of its ap-
prenticeship programs); on average, the experience of the EU15 does not appear
that unusual.
AUT
BEL
DEU
DNK
ESP
FIN
FRA
GBR
GRC
IRL
ITA
LUX
NLD
PRT
SWE
5
10
15
20
25
Unemployment rate, 15−24 year olds, percent
4
6
8
10
12
Unemployment rate, percent
across EU15 countries and across time for the US
Figure 5. Youth unemployment rate,percent
Source: OECD database
Unemployment Versus Other Labor Market Indicators
Yet another question is whether focusing on the unemployment rate is mean-
ingful. The answer, in the case of European unemployment, is yes. Governments
have indeed used various measures to decrease unemployment numbers; these
have ranged from training programs, real or perfunctory, to generous invalidity
programs (the example of the Netherlands being the best known), to subsidized
early retirement programs. One would want to construct a measure which in-
cluded these workers in these categories in addition to those unemployed. In the
absence of such a measure, focusing on the unemployment rate is not mislead-
ing. As these programs have typically swelled when unemployment increased,
the measure would move in general in the same direction as unemployment, ex-
cept with larger amplitude. To take one example, the participation rate of men,
aged 55 to 59, in France, went from 85% in the late 1960s to below 70% in the
8
mid 1980s, reflecting subsidized early retirement, precisely at the time when un-
employment was increasing. More generally, movements in unemployment rates
have typically been associated with deviations of participation rates from trend
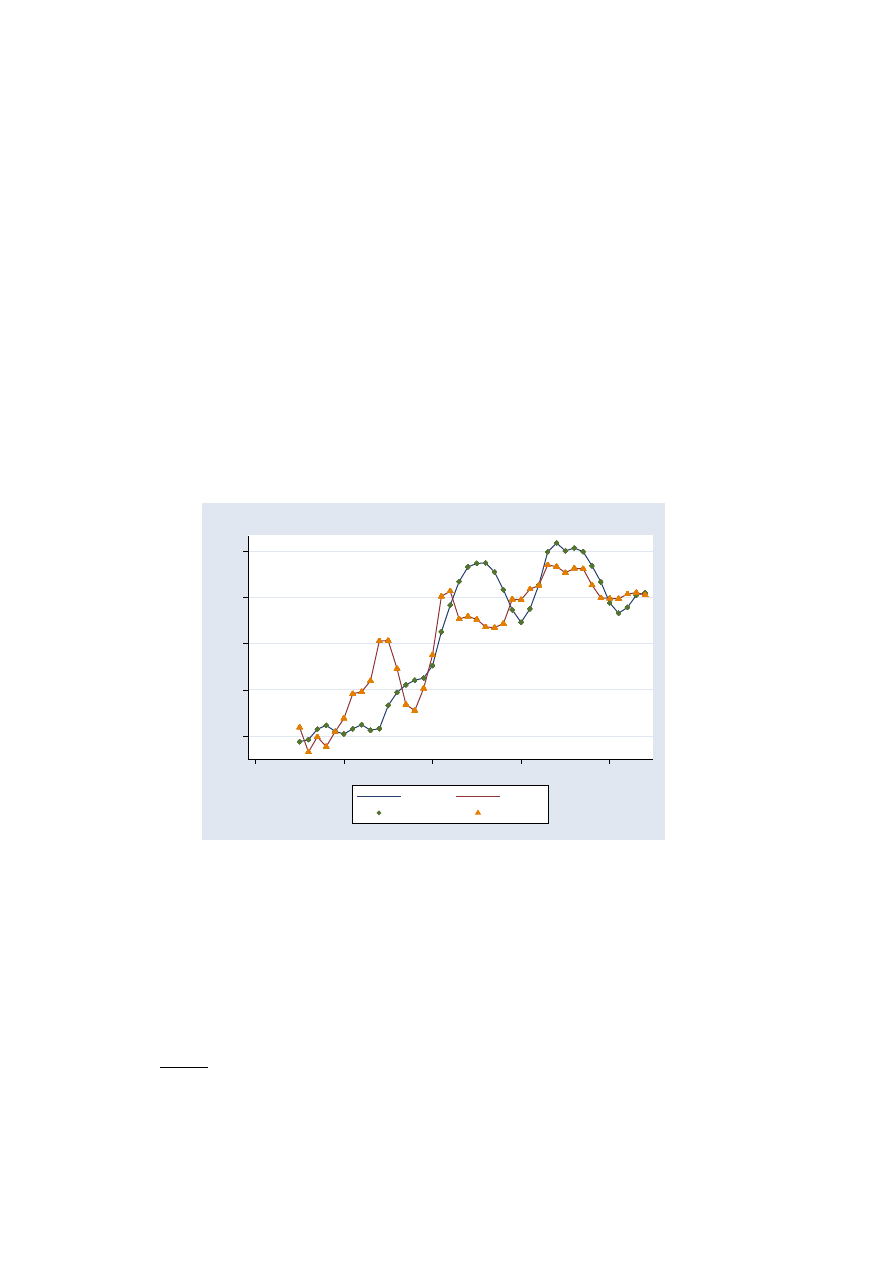
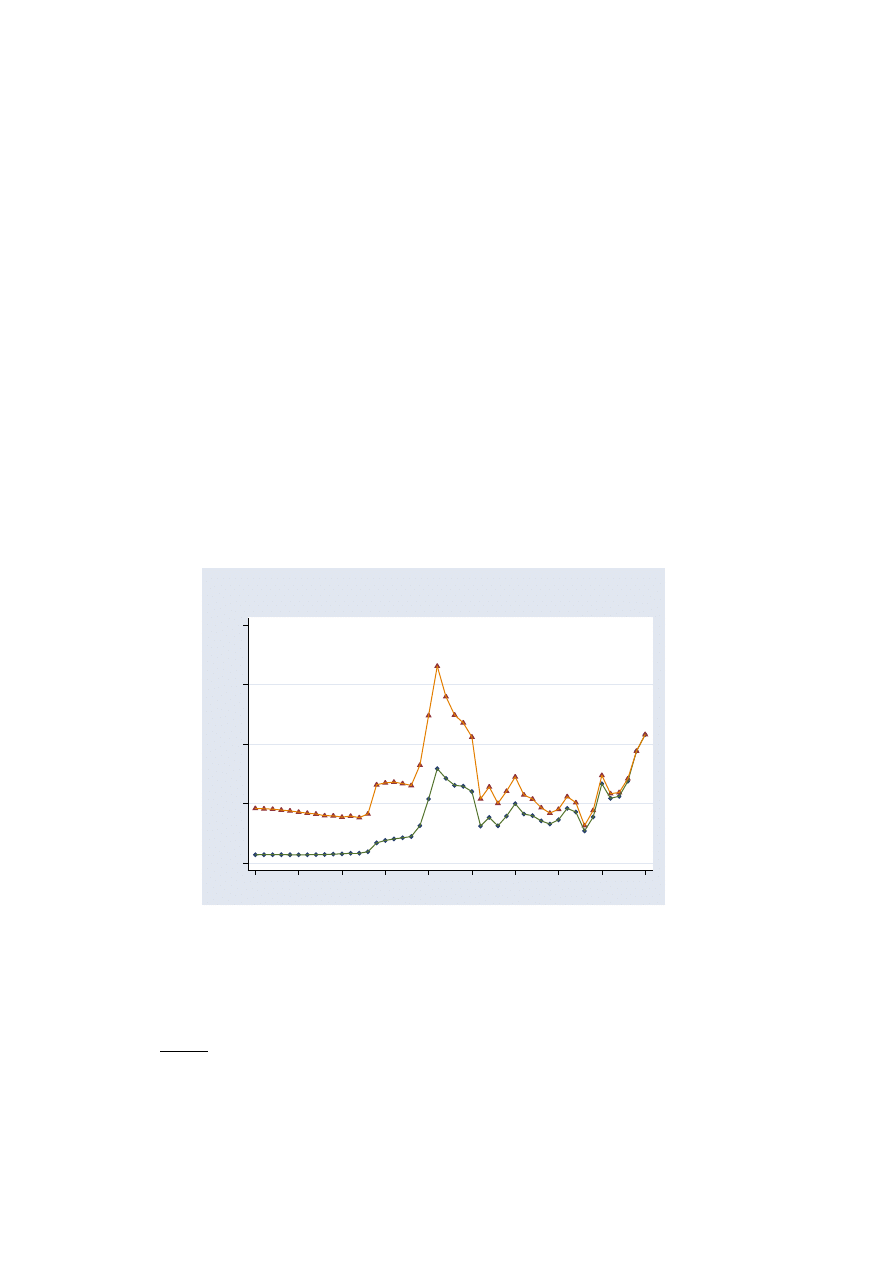
in the opposite direction. Figure 6 shows for example the evolution of the two
rates for Spain since 1960. It shows how the large increase in unemployment was
associated with a decrease in participation, and how the more recent decrease
has been associated in turn with a large increase in participation.
55
60
65
70
Participation rate,percent
0
5
10
15
20
Unemployment rate, percent
1960
1970
1980
1990
2000
Unemployment rate
Participation rate
Figure 6. Unemployment and participation rate in Spain
Source: OECD database.
What is not appropriate however is to simply focus, as some do, on the em-
ployment rate—the ratio of employment to the population of working age. Here
country differences in both the levels and the evolution of the participation rate
of women, which are linked to many non-economic factors, play an important
role. For example, it is not clear that a lower participation rate of women is,
per se, an indication of a problem in the labor market.
Having laid the basic facts, I now look at the history more closely.
9
2
The Initial Rise in Unemployment. The Role of Shocks
Along a balanced growth path, the wage consistent with stable employment
must grow at the rate of Harrod–neutral technological progress.
6
In addition,
if the prices of the other factors of production increase, the wage must de-
crease so as to maintain zero net profit for firms. Call this wage the “warranted
wage.” Call the wage set in bargaining the “bargained wage”. If, for given labor
market conditions, the bargained wage grows faster than the warranted wage,
equilibrium employment will decline, and the natural rate of unemployment will
increase.
This proposition is the key to understanding what happened to unemployment
in the 1970s. European countries were hit by a series of adverse shocks, shocks
which implied a slowdown in the rate of growth of the warranted wage:
0
20
40
60
80
nominal/real
1960
1965
1970
1975
1980
1985
1990
1995
2000
2005
2005 dollars
Figure 7. Nominal and real price of crude oil
Just like the rest of the world, European countries were hit by two major oil
price increases, the first one triggered by the Arab oil embargo of 1973-1974,
the second by the Iranian revolution in 1979 and the Iran-Iraq war of 1980.
Figure 7 gives the price of oil, in dollars and in real (U.S.) terms, since 1960. It
6.
Much of our intuition and most of our models are based on the assumption that techno-
logical progress is Harrod–neutral and that there is a balanced growth path. What happens
if not is largely unexplored, but may well be relevant.
10
shows that, by the early 1980s, the real price of oil, in dollars, stood at nearly
4 times its level at the start of the 1970s.
Another shock, less visible initially but eventually more important, both in
terms of its impact on growth and on unemployment, was also at work. Total
factor productivity (tfp) growth, which had been high in the 1950s and 1960s,
slowed down considerably. By the late 1970s, the rate of Harrod–neutral tech-
nological progress (constructed using the Solow residual, and dividing it by the
labor share), which had run at more than 5% in the 1950s and 1960s, was
down to 2%. In other words, the annual rate of growth of warranted wages had
decreased by 3 percentage points, a dramatic decline. Figure 8 gives five-year
averages of estimates for the five major EU countries (Germany, France, Spain,
Italy, and the UK)—the EU5 for short. It shows that the decline was largely
similar across countries.
DEU
DEU
DEU
DEU
DEU
DEU
DEU
DEU
ESP
ESP
ESP
ESP
ESP
ESP
ESP
ESP
FRA
FRA
FRA
FRA
FRA
FRA
FRA
FRA
GBR
GBR
GBR
GBR
GBR
GBR
ITA
ITA
ITA
ITA
ITA
ITA
ITA
ITA
0
.02
.04
.06
.08
Rate of technological progress
1965
1970
1975
1980
1985
1990
1995
2000
Centered five−year averages, 1968 on
Figure 8. Rate of Harrod Domar technological progress, EU5
Source: Blanchard Wolfers (2000) database.
These two shocks would have required slowdowns in the rate of growth of actual
wages to avoid an increase in unemployment. In fact, both came after a period of
labor unrest in many European countries—May 1968 in France, Spring 1969 in
Italy, the end of dictatorships in Portugal and Spain in 1974 and 1975—in which
11

workers had asked for increases in wages. Not surprisingly, the joint outcome
of lower growth of warranted wages and higher wage demands was an increase
in unemployment. By the end of the 1970s, unemployment for the EU15 had
increased to 5%, up from 2% at the start of the decade; Spain’s unemployment
rate exceeded 10%, France’s and Italy’s exceeded 6%.
The development of a conceptual frame, and the econometric fleshing out of
this story, were largely the work of Michael Bruno and Jeffrey Sachs, who put
it together in a series of articles and then in a book in 1985.
7
Their book can be
seen as a first attempt to put together a working theory of movements in the
natural rate. They argued that the rise in unemployment could be explained of
shocks interacting with two types of rigidities, real and nominal (Box 1 gives
the basic algebra):
•
“Real wage rigidities” captured the speed at which real wages adjusted
to changes in warranted real wages, the speed at which, for given un-
employment, workers would for example accept a slowdown in actual
wages in response to a productivity slowdown. The slower the adjust-
ment, the higher and the longer lasting the effects of adverse shocks on
unemployment.
•
“Nominal wage rigidities” captured the speed to which nominal wages
adjusted to changes in prices. The slower the adjustment, the larger
the decrease in the real wage in response to an unanticipated increase
in prices. And by implication, the slower the adjustment, the more the
monetary authorities could use inflation to reduce real wages and there-
fore limit the increase in actual unemployment in response to an adverse
supply shock.
Differences in real and nominal rigidities could explain why, despite largely sim-
ilar shocks, different countries experienced different increases in unemployment.
A smaller increase in unemployment could be due to smaller real rigidities, re-
sulting in a smaller increase in the natural rate; or it could be due to larger
nominal rigidities, allowing policy makers to achieve, through the use of in-
flation, an unemployment rate below the natural rate; or it could be due to
a more aggressive use of monetary policy, leading to higher inflation and an
unemployment rate below the natural rate.
7.
Other researchers share the credit, among them Robert Gordon (for example Gordon
1975), Franco Modigliani and Tomaso Padoa-Schioppa (1977), Branson and Rotemberg (1980).
12

Where did these differences in real and nominal rigidities themselves come from?
Differences in real rigidities were naturally traced to differences in the structure
of collective bargaining. Sweden, with an unemployment rate of 2.2% at the
end of the decade, was seen as a poster child for the case for corporatism, i.e.
centralized bargaining and strong unions. An important contribution here was
that of Lars Calmfors and John Driffill (1988), who argued, both theoretically
and empirically, that, in the face of adverse supply shocks, countries with either
very centralized bargaining or very decentralized bargaining would fare better
than those with intermediate bargaining structures. With centralized bargaining
in particular, the parties at the bargaining table could see the need for and
implement the wage adjustment required to maintain employment.
Differences in nominal rigidities were also traced to collective bargaining, albeit
to different aspects of it. The degree of indexation, present in many European
countries, played a central role. High indexation in effect prevented the use of
monetary policy to limit the increase in unemployment, or required a very high
rate of inflation.
Overall, this initial strand of research must be seen as a major achievement.
Macroeconomists had entered the 1970s without a model of the natural rate,
and had not anticipated stagflation. By the end of the decade, there was a
working model of the natural rate, and stagflation was well understood. And
the increase in unemployment was explained by adverse shocks interacting with
country–specific collective bargaining structures.
3
Continuing unemployment. Sources of persistence
Unemployment continued to increase throughout the 1980s, from 5% for the
EU15 in 1980, to 8% at the end of the decade, with a peak of 9.5% in 1986.
The further increase in the first half of the 1980s was still easy to explain.
Partly accomodating monetary policy in response to the adverse shocks of the
1970s had led to a large increase in inflation: In 1980, EU15 inflation was 12.5%.
Throughout Europe, governments and central banks decided to reduce inflation
through tight monetary policy, starting with Mrs Thatcher in the UK in 1979.
By 1986, the EU15 inflation rate was down to 3%. This was achieved however
13

through a large increase in the unemployment rate—reflecting an increase in
the actual rate of unemployment over the natural rate.
For the rest of the decade however, inflation was roughly stable, an indication
that the actual unemployment rate was now close to the natural unemployment
rate—around 8-9% for the EU15. This high natural rate was more difficult to
explain: As can be seen from Figure 7 earlier, by the mid-1980s, the sharp
increases in oil prices had been largely reversed. The decline in productivity
growth was still very much present, and now well understood and documented.
But it appeared increasingly unlikely, more than ten years after the decline, that
wage setters would not have adjusted to the new reality of lower productivity
growth.
This led researchers to focus on persistence mechanisms, on why the initial ad-
verse shocks might have very long lasting effects on unemployment. Research
focused mainly on two mechanisms, capital accumulation, and the role of insid-
ers in collective bargaining.
Capital accumulation was already one of the themes of Bruno and Sachs. It was
the focus of a major project later on, directed by Charles Bean and Jacques
Dr`eze (1986). The basic logic was straightforward: If, in response to a slow-
down in productivity growth or an increase in the price of non labor inputs,
bargained wages did not adjust fast enough, employment decreased. If employ-
ment decreased, so did the profit rate. And as long as the profit rate was below
the user cost, capital decreased over time, leading to a further decrease in em-
ployment. The dynamics of capital accumulation could therefore lead to a long
and deep increase in unemployment.
8
This had interesting and highly relevant implications for monetary policy:
In that context, expansionary monetary policy potentially played two roles. The
first was, as before, to decrease real wages and limit the decrease in employ-
ment for a given capital stock. The second was to decrease the real interest
rate, and by implication the user cost; by doing so it limited the decrease in
capital accumulation, and so the further decrease in employment over time.
Both channels had clearly been at work in the second half of the 1970s. In-
flation steadily increased; ex-post real interest rates were negative, and—using
8.
The focus here is on the effect on the increase in the natural rate. The decrease in invest-
ment demand could well lead to an even larger increase in the actual unemployment rate.
14

forecasts of inflation at the time—so were ex-ante real interest rates in most
European countries (Blanchard and Summers 1984).
By symmetry, a monetary contraction, such as that engineered by most central
banks in the early 1980s, also had two effects. The first one was to increase
real wages, and thus decrease employment given the capital stock. The second
was to increase the real interest rate, and thus decrease capital accumulation,
and by implication, further decrease employment. Again, both channels were
clearly at work in the first half of the 1980s. Inflation was sharply lower, and
real interest rates were much higher than they had been earlier.
In short, the delayed reaction of monetary policy, first accomodating and later
contractionary, could explain why the effects of the initial shocks were in ef-
fect delayed. Under this interpretation, with a more neutral monetary policy,
the increase in unemployment would have been higher initially, but shorter in
duration.
An interesting twist to the theory was suggested by Hellwig and Neuman (1987)
in their study of Germany. If bargained wages were set by looking at labor pro-
ductivity growth rather than at the underlying rate of technological progress,
then a vicious circle could easily emerge. Suppose workers asked for too high
wages. Firms would respond by reducing employment, thereby increasing the
capital–labor ratio, and thus increasing labor productivity—relative to the un-
derlying rate of technological progress. This might trigger further wage de-
mands, further decreases in employment, further increases in labor productivity,
and so on, leading to a potentially very large increase in unemployment.
The second line of research focused on collective bargaining. It was based on
the idea that wage bargaining typically takes place between employed workers
(or, more specifically, their union representatives) and firms, and that the un-
employed are not represented at the bargaining table. This “insider–outsider”
theory was developed by Lindbeck and Snower (as summarized for example in
their 1985 book), and applied to unemployment, first by Robert Gregory (1985),
then by Olivier Blanchard and Lawrence Summers (1986) and by Nils Gottfries
and Henrik Horn (1987).
The basic idea was straightforward. Suppose that unions set the wage subject
to the firms’ demand for labor. And suppose that unions cared only about
the employment prospects of the currently employed. Then, they might set the
15

wage so that, in expected value, employment remained the same. Because of
unexpected shocks, employment would be sometimes smaller and sometimes
larger than expected. In other words, employment would follow a random walk,
and for a given labor force, so would unemployment. There would no longer
be a natural rate of unemployment to which the economy would return; unem-
ployment would exhibit “hysteresis”, not returning to any particular value, but
being determined instead by the whole history of shocks to the economy.
This extreme form of the theory was provocative, and rightly criticized as being
too strong:
Empirically, it implied that movements in the labor force would not be reflected
in employment; but a strongly established fact is that, even in economies with
high unemployment, exogenous movements in the labor force—due to demogra-
phy or repatriation, such as the return of European nationals after the indepen-
dence of former colonies (for example Hunt [1992])—translate fairly quickly into
movements in employment. Empirically also, why would hysteresis be relevant
for Europe from the 1970s on, but not elsewhere and at other times?
Theoretically, even if the unemployed do not participate in bargaining, there
are at least two reasons to think unemployment will affect the outcome. The
first is that, given the positive probability of finding themselves unemployed,
employed workers should and will care about the state of the labor market:
The higher the unemployment rate, the more careful they will be in setting the
wage. The second is that wages are not set unilaterally by unions, but rather
by bargaining between unions and firms. And firms can threaten to hire the
unemployed; the higher the unemployment rate, the more relevant the threat.
These criticisms suggested that the central role of employed workers in bar-
gaining implied persistence of unemployment in response to adverse shocks,
but typically not hysteresis. The effect of unemployment on wages might be
weak, but was not zero; even if the unemployed were not present at the bar-
gaining table, high unemployment still led the economy to return to the natural
rate, albeit slowly.
An important extension to this line of argument was provided by Richard La-
yard and Stephen Nickell (1987), focusing on the effects of high unemployment
on human capital—following an argument first developed by Phelps in 1972.
They pointed out that, in European countries, high unemployment typically
16

implied very high average unemployment duration (recall Figure 4). Such high
duration was likely to lead to loss of skills, loss of morale, and thus make many
of the long term unemployed in effect unemployable. In that case, the higher
the unemployment rate, the higher the duration, the higher the loss of skills,
the lower the pressure on wages from a given unemployment rate. Separating
the unemployment rate between short–term unemployment (the ratio of those
unemployed less than a year to the labor force) and long–term unemployment
(the ratio of those unemployed for more than a year to the labor force), Layard
and Nickell indeed showed that, in Phillips curve type relations, what seemed
to matter was short–term unemployment, not long–term. This provided a po-
tential explanation for why persistence was higher in Europe than, say, in the
United States (where the proportion of long term unemployed was and is very
low).
Overall, these developments again represented progress. The focus on the joint
movement on employment and capital, on the role of monetary policy through
real wages and the real interest rate, on the implications of collective bargain-
ing, were important extensions of the initial framework. They also made clear a
number of holes, theoretical and empirical, in our understanding of wage deter-
mination. Were wages in collective bargaining set with an eye to TFP growth
(more specifically, the rate of Harrod–neutral technological progress) or labor
productivity growth? As we saw earlier, the answer makes a lot of difference
to the dynamic effects of capital accumulation on unemployment for example.
Looking at bargaining more closely, how did unemployment affect wage bargain-
ing? How did employment protection, which clearly affects the probability that
employed workers will find themselves unemployed, affect the outcome? This
takes us to the next stage, the shift in focus towards labor market institutions.
4
Stubbornly High Unemployment. The Role of Institutions
In the 1990s, average European unemployment remained very high, peaking at
10.4% for the EU15 average in 1993, and ending at 7.6% in 2000 (a cyclical
peak; the unemployment rate stands at 8.6% in mid–2005.) But this average
reflected an increasing heterogeneity of evolutions across countries:
•
Unemployment remained high in France, Spain, and Italy. Germany’s
unemployment rate, which had remained relatively low until the early
17

1990s, steadily increased after reunification; it now stands (mid 2005)
at about 10% (8.5% in Western Germany, twice as much in Eastern
Germany).
•
Unemployment decreased to under 5% in the UK, Ireland, and the
Netherlands, all from high levels in the early 1990s. (Belgium, with an
unemployment rate of 8%, is an interesting case; the unemployment rate
in the Flemish provinces—those close to the Netherlands—is 5%, while
the unemployment rate in the Wallon provinces—those close to France—
is 11.0%).
•
Unemployment remained relatively low in Austria, Norway, and Portu-
gal. And, while it went up sharply in Sweden, Denmark, and Finland, the
behavior of inflation suggests that this was mostly a cyclical movement—
an increase in the actual unemployment rate over the natural rate—and
unemployment sharply declined thereafter; of the three countries, only
Finland still has high unemployment.
With these evolutions, a clear shift in focus took place, both among policy mak-
ers and among researchers, for two reasons. First, continuing high unemploy-
ment in the major continental countries made the earlier explanations, based
on adverse shocks and persistence, increasingly implausible: Could shocks in
the 1970s and the 1980s still have such strong effects in the 1990s and 2000s?
And second, given the continued large commonality of shocks, the differences
in unemployment rates across countries pointed to differences in institutions as
central to any explanation of unemployment.
The most dramatic evidence of this shift in focus was the 1994 OECD “Jobs
Study.”
9
Ill-adapted labor market institutions, the OECD report argued, were
the source of high unemployment. And the report went on to advocate reforms,
from the design of unemployment insurance and employment protection, to a
reduction of the tax wedge and the minimum wage, to better training and active
labor market policy programs. The report was—and its general line still is—
extremely influential. The notion that “labor market rigidities” are at the core
of European unemployment has gained wide acceptance among policy makers.
9.
To be historically fair, the importance of institutions was already an important theme in
the first edition (1991) of the book by Layard, Nickell, and Jackman.
18

In parallel, on the academic research side, the shift in focus towards institutions
was made easier by the emergence of a new and richer framework to think
about unemployment, a framework based on flows, matching, and bargaining.
For some time already, Christopher Pissarides, building on earlier work by Peter
Diamond on search and bargaining (1981), had explored models of the labor
market which explained unemployment in the labor market as a result of a
process of creation and destruction, large flows of workers in the labor market,
and a complex matching and bargaining process between firms and workers
(for example, Chris Pissarides (1985)). His 1990 book (with a second edition in
2000), and the development and extension of the model in a series of articles with
Dale Mortensen (for example 1994) made the framework extremely influential,
and rightly so. One of its strengths was to allow for a much more specific analysis
of the role of institutions, both theoretically and empirically (Box 3 gives a more
formal description):
The framework started from a basic fact: The labor market is characterized
by large flows—high rates of separations from firms, and high rates of hires by
firms. In France for example, 1.5% of all jobs are destroyed each month and
roughly as many are created— interestingly, this is about the same percentage
as in the United States. As there are many reasons other than job destruction
why a worker may separate from a firm, the flows of workers are typically much
higher. In France, they are of the order of 4% per month (Pierre Cahuc and
Andr´e Zylberberg 2004).
In such a labor market, the process of matching workers and jobs is a complex
one, and there will always be workers looking for jobs (unemployment) and jobs
looking for workers (vacancies). From the point of efficiency, there is an optimal
rate of unemployment, and this rate of unemployment is clearly positive.
Actual unemployment is unlikely to be optimal however, and depends on the
nature of bargaining. Even in the absence of collective bargaining, both the firm
and the worker typically have some bargaining power. The worker can threaten
to walk away from the job, but walking away and finding another job is costly,
the more so the higher the unemployment rate. The firm can threaten to fire
the worker; but doing so and replacing the worker by another is also costly, the
more so the tighter the labor market, the lower the unemployment rate. This
has two main implications. First, the bargained wage depends on the labor
19

market prospects of workers and firms: High unemployment weakens workers
and strengthens firms. Second, labor market institutions also play a central role
in wage determination: The more generous the unemployment insurance, the
less costly it is for the worker to look for another job. The higher the level of
employment protection, the more costly it is for the firm to fire a worker.
From a methodological viewpoint, this framework led to major progress:
It allowed for a more careful analysis of the implications of complex labor market
institutions than could be done before. Take for example employment protec-
tion. The framework made three broad predictions. First, employment protec-
tion, to the extent that it increased the cost of laying off workers, was likely to
decrease layoffs, and thus to reduce the flow of workers entering unemployment.
Second, by increasing the costs to firms, and more importantly, by strength-
ening the bargaining power of workers, it was likely to lead to an increase in
bargained wages, and in turn to an increase in the duration of unemployment.
Third, given that the unemployment rate is the product of the flows into unem-
ployment and unemployment duration, lower flows and higher duration implied
that the effect of employment protection on the unemployment rate itself was
ambiguous. All three implications have proven to fit the facts well (for exam-
ple Olivier Blanchard and Pedro Portugal (2001)). Employment protection is
probably one of the main factors behind the long unemployment duration in
Europe; differences in employment protection seem however largely unrelated
to differences in unemployment rates across countries.
It allowed for a better mapping between the increasingly available panel-data
microeconomic evidence on firms and households, and macroeconomic models.
Take for example unemployment insurance. The framework points to two sep-
arate effects of insurance on unemployment. The first is through its effect on
search intensity, and thus the matching between unemployment and vacancies.
The second is through the reservation wage: Higher unemployment benefits
make unemployment less painful and are likely to lead to an increase in the
bargained wage. Both effects in turn imply an increase in equilibrium unem-
ployment duration, and thus an increase in the natural rate. Guided by search
theory, much empirical work has looked into the effects of the schedule of unem-
ployment benefits on search by the unemployed. The findings in turn allow for a
better calibration of our macro models. (There has been however little empirical
20

micro work on the other channel, namely the effects of unemployment insur-
ance on bargained wages. This reflects a more general shortcoming, a still poor
empirical understanding of wage determination in environments such as Europe
where both individual and collective bargaining are likely to play a role.)
It gave new macro tools to interpret facts and look at the sources of unemploy-
ment. In particular, it gave a way to combine the evidence from the Phillips
curve with the evidence from the Beveridge curve—the relation between un-
employment and vacancies. Conceptually, the Beveridge curve evidence tells us
about factors that affect matching in the labor market, whereas the Phillips
curve evidence tells us also about factors that affect bargaining. A shift in the
Phillips curve not associated with a shift in the Beveridge curve points to fac-
tors related to bargaining; a joint shift points to factors related to matching.
I initially hoped that the joint use of these two tools would prove powerful
(Olivier Blanchard and Peter Diamond 1989), Olivier Blanchard 1990c); I have
been disappointed, at least in its application to unemployment in Europe (For
a recent examination, and a slightly more optimistic conclusion, see Stephen
Nickell et al (2002)). It has proven hard to learn much from the shifts in the
Beveridge curve across countries; one reason may be that data on vacancies are
often of poor quality.
Did the shift in focus towards institutions give us the key to the evolution of
European unemployment, across countries and time? The first systematic look
at the data, at the end of the 1990s, gave a mixed answer:
Differences in institutions appeared able to explain much of the differences in
unemployment rates across countries either in the 1980s or in the 1990s. This
was first shown in a cross-country regression by Stephen Nickell in 1997. Using
quantitative indexes for a number of labor market institutions for the mid– and
late–1980s, he found that, together, they did a good job of explaining differences
across 20 OECD countries. Among the most economically significant variables
in his regression were the duration of unemployment benefits (which increased
unemployment), and the degree of coordination in collective bargaining (which
decreased it).
Changes in institutions did not appear able however to explain the evolution
of unemployment rates over time. Even if the initial increase in unemployment
was due to shocks rather than institutions, the difference between unemploy-
21

ment today and unemployment in the 1960s should be explained by much less
“employment friendly” institutions than 40 years ago. And the first pass at the
time series evolution of institutions, which I undertook with Justin Wolfers in
2000, was not very encouraging:
GBR
FRA
ESP
DEU
ITA
GBR
ITA
ESP
DEU
FRA
GBR
ESP
FRA
ITA
DEU
ITA
DEU
GBR
FRA
ESP
GBR
ITA
ESP
FRA
DEU
ITA
GBR
ESP
DEU
FRA
DEU
ITA
FRA
ESP
GBR
0
10
20
30
40
average
1960
1970
1980
1990
2000
a: Average
FRA
ESP
GBR
ITA
DEU
DEU
GBR
FRA
ITA
ESP
ESP
DEU
FRA
GBR
ITA
FRA
DEU
ITA
GBR
ESP
GBR
ESP
DEU
ITA
FRA
FRA
ITA
DEU
GBR
ESP
DEU
GBR
FRA
ITA
ESP
0
20
40
60
80
maximum
1960
1970
1980
1990
2000
b: Maximum
Figure 9. Replacement rates, EU5 since 1960
Source: Blanchard and Wolfers (2000)
Figures 9 and 10 reproduces two of the time series we gave in that paper, for
replacement rates and for employment protection respectively, for each EU5
country, for each five-year period since 1960. The replacement rates shown in
Figure 9 were constructed from an OECD data set, which measured the ratio of
pre-tax social insurance and social assistance benefits to the pre-tax wage, for
various categories of unemployed workers, depending on income, family status,
and duration of unemployment. Figure 9a gives an unweighted average of these
replacement rates, the summary measure often used by the OECD. What is
22

striking are the different evolutions of the five countries, and the absence of
a common trend. Figure 9b provides a different and more relevant angle by
showing the maximum replacement rate over all categories for each country and
each subperiod. Again, no clear trend emerges. Clearly, some of the maximum
replacement rates increased in the early 1980s, but they have declined since
then.
The indexes of employment protection shown in Figure 10 were constructed
by combining two sources, the series constructed by Ed Lazear (1990) for the
period before 1985, and the indexes constructed by the OECD for the 1980s
and the 1990s. Again, what is striking is the absence of a clear trend, and the
heterogeneity of evolutions across countries.
FRA
FRA
FRA
FRA
FRA
FRA
FRA
FRA
DEU
DEU
DEU
DEU
DEU
DEU
DEU
DEU
ITA
ITA
ITA
ITA
ITA
ITA
ITA
ITA
ESP
ESP
ESP
ESP
ESP
ESP
ESP
ESP
GBR
GBR
GBR
GBR
GBR
GBR
GBR
GBR
0
1
2
3
4
Employment protection index
1960
1970
1980
1990
2000
Figure 10. Employment protection index, EU5 since 1960
Source: Blanchard and Wolfers (2000)
A more systematic construction of time varying measures by others (in partic-
ular Michele Belot and Jan Van Ours (2001)) suggested roughly similar conclu-
sions. In panel data regressions of unemployment rates on institutions across 20
countries since 1960, and allowing for country and time dummies, none of the
labor market institutions appeared significant.
In this context, one variable deserves particular mention because it often comes
back in discussions. The “tax wedge,” i.e. the difference between take–home pay
23

for workers and the cost of labor for firms, divided by the wage, has steadily
gone up in most European countries since the 1960s. In many countries, it
stands at above 30%, and it is often blamed by firms and policy makers as one
of the major sources of unemployment. Most economists are more skeptical (a
formal discussion is given in Box 4): On theoretical grounds, taxes or social
contributions that treat income equally whatever its source (labor income or
unemployment benefits) should not affect the cost of labor to firms, and thus not
affect unemployment. The same should be true for taxes or social contributions
which come with corresponding benefits, such as retirement contributions, so
long as they are not redistributive.
10
On empirical grounds, while the increase
in the tax wedge fits the general increase in unemployment, it does poorly
in explaining differences in unemployment across countries. This is shown in
Figure 11, which plots the tax wedge (defined as the sum of payroll taxes paid
by employers and employees and income taxes paid by employees) in 1960 and
2000 for each EU15 country and for the United States.
AUT
BEL
DNK
FIN
FRA
DEU
IRE
ITA
NLD
PRT
ESP
SWE
GBR
USA
0
10
20
30
40
50
Tax wedge 2000
0
10
20
30
40
50
Tax wedge 1960
Figure 11. Tax wedge, 2000 versus 1960, by country
Source: OECD (courtesy of Luca Nunziata)
10. Major effects of the tax wedge are likely to be present only for wages which are at or close
to a minimum wage floor. In this case, additional contributions by firms cannot be shifted to
workers, and thus lead to an increase in cost. For this reason, many European countries have
decreased the tax wedge for low wages since the late 1980s, sometimes by substantial amounts.
24

All the points are above the 45 degree line, indicating that the tax wedge is
higher in all countries in 2000 than it was in 1960. But the ranking of countries
shows little relation to unemployment rates. Three of the four countries with
the highest tax wedge, Finland, Sweden, and Austria, are also countries with a
low natural rate.
To take stock: We ended the 1990s with a much better framework to study
unemployment. But we also ended with many questions. Even if the earlier
shocks were no longer the main source of unemployment, they clearly were
responsible for the initial increase. If institutions were primarily responsible for
unemployment at the end of the century, is it because they had become steadily
less employment friendly? If so, why was it not reflected in the series we were
constructing? One can see the research since then as exploring different answers
to these questions. This is the topic of the next section.
5
Institutions and Shocks. Current Directions of Research
Giving a clear description of current research is always harder than giving one of
past research; research appears to go in many directions, only some of which will
eventually pan out. I see roughly three main directions at this point. The first is
an exploration of the role of other shocks, other institutions, other interactions.
The second is a more careful exploration and measurement of institutions. The
third is an attempt to look not only at unemployment, but at the joint behavior
of unemployment, employment, capital, wages and user costs. I take them in
turn.
5.1
Other Shocks, Other Institutions, Other Interactions?
Another line of research has extended the initial panel data examination of
institutions and shocks, to look at other shocks, other institutions, other inter-
actions:
•
There are potentially many more relevant institutions than those in-
cluded in the initial regressions by Nickell and Blanchard and Wolfers.
Researchers have examined the effects of many others, from measures of
product–market regulation, to measures of home ownership—a variable
suggested by Andrew Oswald (1997).
25

•
There are potentially many shocks as well. There used to be a sign at
train crossings in France that said: “A train may hide another”. It is
not implausible that, in the same way that oil price increases initially
hid the decline in productivity growth, the slowdown in productivity
growth also hid other shocks. Researchers have looked for example at
shifts in labor demand away from low skilled workers, or at increased
turbulence—due to higher competition in the world economy, through
deregulation of domestic goods markets, the decrease in trade barriers,
and globalization. (I return to this particular theme below.)
•
There are potentially many interactions between shocks and institutions.
Recall that the initial focus of research by Bruno and Sachs was on the
interaction between adverse supply shocks and the structure of collective
bargaining. Recall that the focus of the research on persistence was on
the strength of insiders; this strength clearly depends on institutions such
as employment protection and unemployment benefits.
•
There are also potentially many interactions between institutions, a
theme explored for example by David Coe and Dennis Snower (1997).
The effects of taxation may depend for example on the structure of col-
lective bargaining, a theme explored by Francesco Daveri and Guido
Tabellini (2000). The effects of employment protection—which reduce
layoffs—may be partly offset by collective bargaining focused on reduc-
ing wage dispersion—which may increase layoffs, a hypothesis explored
by Giuseppe Bertola and Richard Rogerson (1997) to explain the sur-
prisingly high labor turnover numbers in Europe.
All these and a few more, have been explored through panel data regressions.
A partial summary of the results is given in Dean Baker et al (2002). Some
correlations are intriguing; the conclusion by Stephen Nickell et al (2005) that
time series for institutions do a better (but still mediocre) job of fitting some
of the evolutions of unemployment across time than intially suggested by the
Blanchard Wolfers series is perhaps the most interesting. It is clear however that
the number of potential shocks, institutions, and interactions is sufficiently large
that the ability of such panel data regressions to tell us what exact combination
matters is limited. Such regressions allow us to check for simple and partial
correlations; they are unlikely to tell us about which combination of shocks and
institutions is responsible for unemployment (for a similar view, see Freeman
2005).
26

Of all the hypotheses listed above, at least one deserves a longer treatment.
11
It
is the idea that higher competition in the goods market, lower trade barriers and
higher integration of goods markets across countries, higher globalization and
outsourcing, are all leading to a more turbulent environment, an environment
with more job destruction and job creation. When the environment becomes
more turbulent, existing labor market institutions may become dysfunctional
and lead to substantially higher unemployment. Employment protection, which
was rarely binding before as firms rarely laid off workers, becomes binding and
increases the cost of firms. Unemployment benefits, which were not very costly
so long as few workers were laid off, become costly, requiring higher contribu-
tions and leading again to higher costs of firms. The general story is appealing,
and most of us believe that, indeed, there is more economic turbulence today
than there was thirty years ago. There is one catch however. We may all believe
it, but the data just do not show it...
This puzzle showed up early on, when European unemployment was just rising
in the late 1970s. Increased turbulence already seemed to be a plausible can-
didate. But it turned out that the measures of reallocation we could construct
then—typically measures based on the standard deviation of rates of change of
employment, either across sectors or across regions—showed no trend increase.
The evidence as of the early 1980s is well summarized in Johnson and Layard
(1986), who construct a table of standard deviations by industry or by region
for a number of countries: Half of the standard deviations are higher in 1979
than they were in 1960, half are lower. In all cases, the changes are small. I
could not locate an update of this table for the 1980s and 1990s, but the series
I have seen for a few countries yield the same conclusion: There is no apparent
increase.
One may reasonably argue that these measures are too raw. Perhaps, the in-
crease in reallocation is taking place mostly within industries or regions, rather
than across industries or across regions. In that respect, measures of job flows
based on plant–level data, along the lines of the work by Davis and Haltiwanger
(1996) are clearly preferable. The practical issue is that they typically do not
go back far enough in time. But to the extent that they do, they also show little
11. Another hypothesis worthy of a longer treatment is the presence and the role of skilled-
biased technological progress. I shall not do it here, except to mention that, while it is surely
relevant, one observes that, in countries with high unemployment, unemployment is typically
high across the skill spectrum (although obviously higher for low-skilled workers).
27

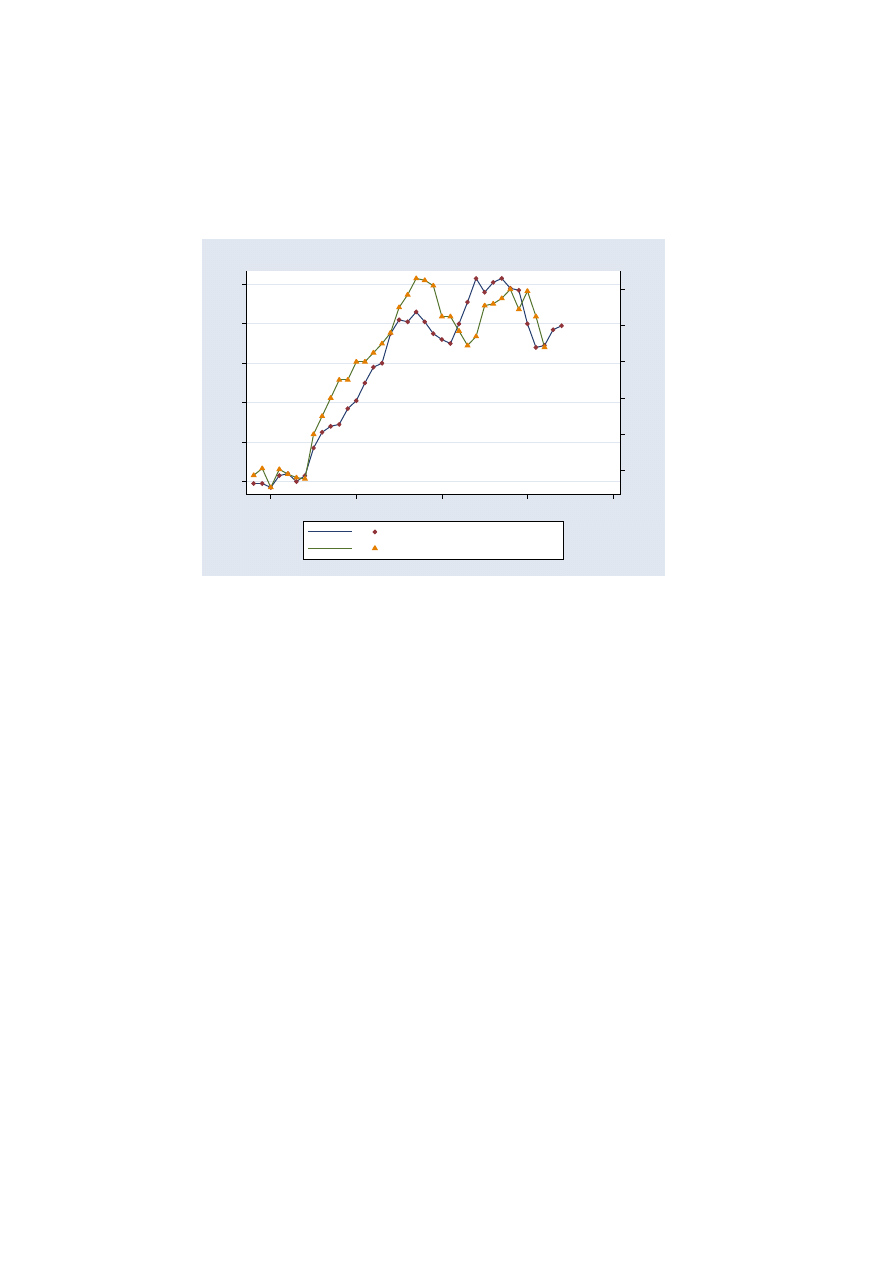
sign of increased turbulence. Figure 12 gives the evidence for France, based on
two studies, one by Nocke [1994] for 1985 to 1990, and the other by Duhautois
for 1990 to 1996.
12
The lower line shows the evolution of job destruction (the
sum of all employment changes at plants with decreasing employment, divided
by total employment); the upper line shows the evolution of job reallocation,
defined as the sum of job destruction and job creation. The conclusion is clear:
At least starting from when data becomes available, namely 1985, there is no
evidence of an increase in turbulence.
13
0
5
10
15
20
25
30
Destruction and reallocation rate (per year)
1985
1990
1995
France 1985−1996
Figure 12. Job destruction and job reallocation
Is the argument therefore settled? No, for two reasons, one empirical, the other
theoretical:
The empirical reason is that other—admittedly conceptually less appropriate—
measures of turbulence send a different message from job flows. For example, the
measure of sales volatility constructed by Diego Comin and Thomas Philippon
(2005), based on the firms in the Compustat data set, show a steady increase
12. The juxtaposation of the two series, constructed using slightly different data and method-
ology, imply that there may be an artificial break in the series between 1990 and 1991.
13. One might argue that, in the case of France, turbulence has increased, but its effects on
flows has been offset by increasing employment protection. This suggests looking at data for
the United States, where employment protection is low and has not increased. The evidence
there is that, if anything, there has been a decrease in flows relative to total employment over
the last thirty years (Steve Davis et al 2005, Figure 4 for the private sector since 1990, and
Figure 5 for manufacturing since 1947.)
28

in this measure of variability over time since the late 1960s. Reconciling the
evidence on flat job flows and increasing sales variability remains to be done.
14
Until then, the discrepancy should make us more careful about conclusions.
The theoretical reason is that one can construct models in which turbulence is
not necessarily reflected in higher job flows. Such models have been explored
by Ljunqvist and Sargent in a series of contributions (for example, 1999, 2005).
In their formalization, increased turbulence is reflected in an increase in the
specificity of skills associated with particular jobs. The implication is that an
involontary job change is associated with a larger drop in the wage distrib-
ution facing a laid-off worker than was the case in the past. In this case, if
unemployment benefits are linked to past wages, the unemployed may have
high reservation wages, and remain unemployed for a long time. Furthermore,
if skills deteriorate through unemployment, some of the unemployed may even
become trapped into unemployment. Differences in the generosity of the unem-
ployment insurance system, Sargent and Ljunqvist argue, may therefore explain
why Europe is doing so much worse than the United States in facing the same
increase in turbulence—an example of the interaction between institutions and
shocks. While the theory is appealing, direct evidence of a larger decrease in
skills for laid-off workers is however so far very limited.
5.2
A Closer Look at Institutions
Labor market institutions are typically multidimensional. Reducing them to
quantitative indexes is not easy: How does one compare for example two un-
employment insurance systems, if the first has more generous unemployment
benefits, but also more conditionality of benefits on search effort? How does one
compare two systems of employment protection, when the first includes higher
protection for some workers, and lesser protection for others?
In the process of looking at the effects of institutions, I have become less con-
vinced that existing measures fully capture what is going on. This has led me
to explore, in on-going work with Daniel Cohen and Cyril Nouveau (2005), the
evolution and the determinants of labor market institutions in France since the
1950s.
15
What emerges is a more complex picture than that given by quantita-
14. The two series differ in coverage in many ways—plant versus firm level data, manufacturing
for the long series for job flows, large firms for Compustat, employment versus sales.
15. For an exercise in the same spirit for Germany since 1990, see Conny Wunsch (2005).
29

tive measures.
What we find is that the increase in unemployment in the mid–1970s led to
major changes in institutions. Under the initial assumption that the shock, and
therefore the increase in unemployment, was temporary, unemployment insur-
ance was made substantially more generous, and employment protection was
sharply increased. As high unemployment turned out to persist, both financial
pressures on the unemployment system, and the realization that some of the
earlier measures probably contributed to unemployment, have led most of the
initial changes to be reversed. But the reversal has not taken the form of a
return to earlier institutions. The decrease in employment protection has come
in the form of the introduction of two types of labor contracts, traditional and
highly protected permanent contracts, and new, less protected, temporary con-
tracts. Whether such a reform actually decreases unemployment is ambiguous;
what is certain is that it has created a dual labor market, with protected and
marginal workers.
So, while existing time series for labor market institutions in France show little
change since the 1960s, a closer look at history suggests that, at least for France,
institutions indeed became less employment-friendly in the 1970s and early
1980s. While things turned around starting in the early 1980s, many of the
reforms have had perverse effects, either because of poor design, unanticipated
consequences, or political constraints. Institutions today are less employment
friendly than they were in the early 1970s.
I do not know whether the conclusions reached from similar studies of other
European countries will be similar. I suspect that the message is more general:
One of the reasons why the shocks of the 1970s and 1980s have led to high
unemployment in some European countries today is that they triggered a change
in institutions, which has been partly and poorly undone in these countries.
5.3
Employment, Capital, Wages and Interest Rates
All the theories we have discussed have testable implications not only for unem-
ployment, but also for capital accumulation, wages, profits, and interest rates.
For example, an increase in bargained wages, for given labor market conditions,
should lead not only to an increase in unemployment, but also to a decrease in
the labor/capital ratio, a decrease in the profit rate, and, for a given user cost, a
30

decrease in capital accumulation over time. Yet, few of these theories have been
tested using more than data on unemployment and through the estimation of
unemployment equations.
This led me, in the late 1990s, to perform a conceptually simple exercise, that
of looking jointly at capital, employment, wages, profits, and user costs, and
use this information to try to identify shifts in either “labor demand” (the re-
lation giving warranted wages as a function of employment, capital, and the
level of technology) or “labor supply” (the relation giving bargained wages as
a function of labor market conditions) (Blanchard 1997, 1998).
16
On the labor
demand side, I assumed that firms chose capital and labor subject to convex
costs of adjusting both investment and factor proportions. On the demand side,
I assumed that bargained wages depended on the level of technology, the un-
employment rate, with all other factors showing up as shifts in the relation. I
then constructed shifts in labor demand and labor supply for 14 OECD coun-
tries for the period 1970–1995. My papers were primarily an exercise aimed at
organizing the empirical evidence in a simple but interpretable way. A concep-
tually more ambitious attempt was made by Ricardo Caballero and Mohamad
Hammour (1998), who constructed a structural model starting more explicitly
from bargaining and institutions such as employment protection, and allowing
for endogenous technological progress. Their model was not estimated, but cali-
brated, and Caballero and Hammour used it to look at the evolution on capital,
employment, productivity and factor prices in France.
Both exercises proved interesting, and the evidence more complex than I had
expected. On the one hand, many of the dynamics suggested by the early work
of Bruno and Sachs and the later work on the role of capital accumulation, were
clearly present in the data. The early 1970s were characterized by “adverse labor
supply shifts”—that is, increases in bargained wages given unemployment. The
effect of profit rates and interest rates on capital accumulation were also clearly
visible, with low interest rates delaying the slowdown in capital accumulation
to the 1980s. These labor supply shifts were largely reversed starting in the mid
1980s. Countries, such as the Netherlands and Ireland, which had seen a major
decrease in unemployment, also showed a large decrease in wages in efficiency
16. Semantics are not settled here. The relation giving warranted wages is often called the
“price setting relation” as it gives the prices set by firms given wages and other variables. The
relation giving bargained wages is often called the “wage setting” relation, because it gives
the wages set in bargaining, given the price level, actual or expected, and other variables.
31

units—wages divided by the index of Harrod neutral progress.
The reversal of adverse labor supply shifts should have led to a decrease in
unemployment over time. But, the data suggested, something else was at work
starting in the early 1980s. At a given wage (in efficiency units) and given capital
stock, employment was lower: There was an adverse shift in labor demand. The
result was a decrease in the labor share in most European countries, starting
in the early 1980s. Figure 13a gives the behavior of the labor share in France,
one of the countries where the decline was the most dramatic, for the business
sector, from 1965 to 2001. The labor share, which had gone up by 5 percentage
points from 1970 to 1981, then went down by 12% percentage points from 1980
to the early 2000s; it has remained roughly at that level since then.
17
Figures
13b and 13c show the proximate causes of the evolution of the labor share.
Figure 13b shows the evolution of the wage (in efficiency units), and figure 13c
shows the evolution of the ratio of employment (in efficiency units) to capital,
since 1965.
In the second half of the 1970s, the wage (in efficiency units) went up, and the
ratio of employment (in efficiency units) went down over time in response; the
result was an increase in the labor share, and this is exactly what we would
expect in response to an adverse labor supply shock—an increase in the bar-
gained wage for given labor market conditions. Since then however, the wage
has come down; since 1990, it has remained roughly at its 1970 level. The ra-
tio of employment to capital has not recovered however: Lower employment at
a given wage is what mechanically explains the lower labor share. (The basic
algebra of the labor share is given in Box 5)
Why is employment lower at a given wage? In my 1997 and 1998 papers, I
considered various candidates and converged on a decrease in “labor hoarding”,
due perhaps to higher competition and tougher corporate governance, as the
more likely one. Under this explanation however, the decrease in excess labor
should have led to an increase in profit, an increase in capital accumulation,
and an eventual recovery of employment; so far the increase in capital and
17. There are many issues of measurement associated with the labor share. The series used
in the figure is adjusted for self employment. Labor income includes not only the wage but
also payroll taxes and other social contributions paid by firms. Some of the data have been
reconstructed by the OECD since 2000, and the current series for France shows a smaller
decrease; the basic evolution is still the same. Some of the evolution of the labor share is
due to composition effects, the result of a shift to sectors with lower labor shares. Again, for
France, this composition effect is small. (Alain de Serres et al, 2002).
32

employment has not taken place, at least not in France or in Germany, where
a similar evolution of the labor share has taken place.
.6
.65
.7
.75
Labor share
1960
1970
1980
1990
2000
Labor share
.013
.0135
.014
.0145
.015
Real wage
1960
1970
1980
1990
2000
Real wage per efficiency unit
20
25
30
35
40
Employment to capital
1960
1970
1980
1990
2000
Ratio of employment in efficiency units to capital
France
Figure 13. Share, employment and real wage
Source: Olivier Blanchard (2000), updated
An alternative interpretation was given by Caballero and Hammour. They ar-
gued that the decline in the labor share below its initial level reflected instead
an increase in the marginal wage relative to the average wage (an increase in the
33

marginal wage for a given average wage will lead to a decrease in employment,
and thus a decrease in the labor share.) Caballero and Hammour’s conclusion
was therefore that the low labor share reflected the firms’ desire to decrease
labor beyond what the average cost of labor would suggest. And, they argued,
this reluctance of firms to hire labor could be traced to a worsening of labor
market institutions. Their explanation leads to a much less optimistic view of
the future: A low labor share does not lead to higher incentives to invest, nor
to an increase in employment.
I see the labor share puzzle as largely unsolved. The decrease in the labor share
has been much smaller in the UK and the United States than in continental
Europe, pointing indeed to factors specific to continental Europe: Institutions
are a natural starting point. At the same time, within continental Europe, the
decrease in the labor share has taken place both in countries that have reduced
unemployment (the Netherlands for example), and in countries that still have
high unemployment (France for example). I also see the puzzle as a potentially
major piece of the story of European unemployment, and one on which more
work should be done.
6
Do We Know Enough to Give Advice?
At the end of this tour, one may ask whether we know enough to give advice
to policy makers about how to reduce unemployment. I believe we do—with
the proper degree of humility. In this last section, I summarize what I think we
know and we do not know.
6.1
A General Story Line
Going back over the last thirty years, there is little question that the initial
increase in unemployment in Europe was primarily due to adverse and largely
common shocks, from oil price increases to the slowdown in productivity growth.
There is not much question that different institutions led to different initial
outcomes. Whether collective bargaining led to a decrease in the growth of
bargained wages, whether inflation could be used to reduce real wage growth,
all played a central role in determining the size of the increase in unemployment.
34

There is not much question, but not much question that the increase in unem-
ployment led, in most countries, to changes in institutions as most governments
tried to limit the increase in unemployment through employment protection,
and to reduce the pain of unemployment through more generous unemploy-
ment insurance.
There is not much question that, since the early 1980s, because of financial
pressure and intellectual arguments, most governments have partly reversed
the initial change in institutions. But this reversal has been partial, and some-
times perverse. The different paths chosen may well explain the differences in
unemployment rates across European countries today.
Despite the twists and turns of research, the sediments from the successive theo-
ries are nearly all relevant. The role of shocks and the interaction with collective
bargaining emphasized by initial theories, the role of capital accumulation and
insider effects emphasized by the theories focusing on persistence, the role of
specific institutions clarified by flow-bargaining models, all explain important
aspects of the evolution of European unemployment.
6.2
Which Institutions?
It is one thing to say that labor market institutions matter, and another to
know exactly which ones and how.
Humility is needed here, and there is no better reminder than the comparison
between Portugal and Spain. Both experienced revolutions and wage explosions
in the 1970s (the Portuguese labor share reached 100% in the mid 1970s...); both
have, at least on the surface, rather similar institutions, including high employ-
ment protection. Yet, Spanish unemployment has been very high, exceeding 20%
in the mid–1990s, whereas Portuguese unemployment has remained low, with
a high of 8.6% in the mid–1980s, and a decrease thereafter. Many researchers,
including myself, have tried to trace the differences to differences in shocks or
institutions (for a recent attempt, see Olympia Bover et al 2000). I am not sure
that our explanations are much more than ex-post rationalizations.
18
18. Along the same lines, the rapid decrease of the unemployment rate in Spain—which has
now fallen below 10%—is also hard to trace back to either shocks or dramatic changes in insti-
tutions. Yet another puzzle is the coincidence of very low productivity growth—zero measured
tfp growth in Spain over the last 15 years—and decreasing unemployment.
35

And the history of the last thirty years is a series of love affairs with sometimes
sad endings, first with Germany and German–like institutions—until unemploy-
ment started increasing there in the 1990s...—then with the United Kingdom
and the Thatcher–Blair reforms, then with Ireland and the Netherlands and the
role of national agreements, and now with the Scandinavian countries, especially
Denmark, and its concept of “flexisecurity”.
19
Nevertheless, even if one cannot pretend to have much confidence about the
optimal overall architecture, much has been learned about the effects of the
various pieces, especially from the large number of empirical micro-studies and
natural or designed experiments. As a review of the relevant research would re-
quire another survey, let me just mention a few directions of research. We know
much more about the incentive aspects of unemployment insurance on search
intensity and unemployment duration, be it the length and time shape of un-
employment benefits, or the form of conditionality or training programs (see
for example the surveys by Peter Fredriksson and Bertil Holmlund (2003) on
unemployment insurance, and by John Martin and David Grubb (2001) on ac-
tive labor market policies). We know more about the effects of decreasing social
contributions on low wages (for example Bruno Cr´epon and Rosenn Desplatz
(2001) on the French experience). We know more about the effects of employ-
ment protection, and the effects on the labor market of introducing temporary
contracts at the margin while keeping employment protection the same for most
workers (Olivier Blanchard and Augustin Landier (2002) for France).
From both the macro evidence and this body of micro–economic work, a large
consensus—right or wrong—has emerged:
It holds that modern economies need to constantly reallocate resources, includ-
ing labor, from old to new products, from bad to good firms. At the same time,
workers value security and insurance against major adverse professional events,
job loss in particular.
While there is a trade-off between efficiency and insurance, the experience of
the successful European countries suggests it need not be very steep. What is
important in essence is to protect workers, not jobs.
This means providing unemployment insurance, generous in level, but condi-
19. For descriptions of events and reforms see Stephen Nickell and Jan van Ours(2000) for the
Netherlands and Ireland, Patrick Honovan and Brendan Walsh for Ireland (2002), David Card
and Richard Freeman (2001) for the UK, and Niels Westergaard-Nielsen (2000) for Denmark.
36

tional on the willingness of the unemployed to train for and accept jobs if
available. This means employment protection, but in the form of financial costs
to firms to make them internalize the social costs of unemployment, including
unemployment insurance, rather than through a complex administrative and
judicial process.
This means dealing with the need to decrease the cost of low skilled labor
through lower social contributions paid by firms at the low wage end, and the
need to make work attractive to low skill workers through a negative income
tax rather than a minimum wage.
This consensus underlies most recent reforms or reform proposals, for example
in the recent Hartz reforms in Germany (for a description, see Conny Wunsch
2005), or the “Camdessus Report” on reforms in France (2004).
These measures are probably all desirable. If they were to be implemented,
would they be enough to eliminate the European problem? I see at least two
reasons to worry.
6.3
Collective Bargaining and Trust
The first worry is that these reforms deal only with a subset of the institutions
that govern the labor market. An early theme of the research on European
unemployment was the importance of collective bargaining. And it is a fact that
some of the successful countries, the Scandinavian countries in particular, have
very different structures of collective bargaining from, say, France or Italy, with
much more of an emphasis on national, trilateral, discussions and negotiations
between unions, business representatives, and the state.
This raises two questions. First whether countries such as France or Italy need to
also modify the structure of collective bargaining. Second whether, even if they
did, the results would be the same as in Sweden or Denmark. I think we do not
know the answer to either of the two questions. In work with Thomas Philippon
(2004), we explored the hypothesis that differences in trust between unions and
firms, perhaps tracable to differences in economic models between unions and
firms, explain some of the difference in unemployment rates across countries.
We found that various measures of trust, from strike intensity in the 1960s to
survey measures of trust between firms and workers, could explain a substantial
37

fraction of differences in unemployment across European countries.
20
Even if
these findings reflect causality from lack of trust to unemployment, it is just a
start. The question is whether trust can be created. The example of the UK
where the unions have not only become weaker but have also changed attitudes,
suggests that trust cannot be taken as an immutable country characteristic.
21
6.4
Low Inflation, the Natural and the Actual Rate of
Unemployment
Since 2000, European unemployment has been associated with roughly constant
inflation. This would suggest that the current high unemployment rate reflects
a high natural unemployment rate, rather than a large deviation of the actual
unemployment rate above the natural rate. This is indeed the assumption which
justifies the focus on inflation by the European Central Bank: Maintaining
constant inflation is then equivalent to maintaining unemployment close to its
natural rate; this natural rate can only be reduced by labor market reforms,
and this is not the responsability of the central bank.
One may however question this assumption. Inflation in the EU15 is now run-
ning under 2%, and close to 0% in countries such as Germany. At these low
inflation rates, it is not implausible that nominal rigidities matter more, that
workers for example are reluctant to accept nominal wage cuts—a hypothesis
explored, for example, by Akerlof et al (1996). In such an environment, it may
be that an unemployment rate above the natural rate may lead to low rather
than declining inflation. Put another way, it may be that, in fact, an expansion
of demand might decrease unemployment without leading to steadily higher
inflation. The experience of Spain, where unemployment has steadily decreased
without major labor market reforms and without an increase in inflation, can
be read in this light.
Another, conceptually different, argument for a more expansionary monetary
policy, is that institutional reforms encounter less opposition when economies
are growing and unemployment is decreasing. In other words, a decrease in
20. A recent paper by Cahuc and Algan [2005] takes another step in that direction, and
argues, theoretically and empirically, that the efficiency cost of social insurance depends on
civic attitudes.
21. This section can be seen as a variation on the old theme of whether there are different
national models, adapted to different countries, an “anglo-saxon” model, a “scandinavian”
model, and so on.
38

unemployment below the natural rate may actually help decrease the natural
rate itself. This argument is an old one (Blanchard et al (1985) already argued
for such a “two-handed” approach in Europe) but is still relevant today. One
issue however is whether, in fact, growth and the decrease in unemployment do
not alleviate the political need for reform, and thus delay rather than encourage
reforms. The experience of the late 1990s in Europe, where a cyclical expansion
often delayed reforms, is not reassuring in that respect. Developing this last
point would take us to the political economy of labor market reform, and this
should be the topic of another survey.
39

Box 1. Real and Nominal Rigidities
The purpose of these and the following boxes is to formalize some of the argu-
ments in the text. I have made the choice of presenting simple, related, but ad–
hoc models. References to explicitly micro-founded models—which are needed
if one wants to derive optimal policy—are given when available.
This box shows the role of real and nominal rigidities in shaping the effects of
adverse shocks to warranted wages on unemployment.
Consider firms with constant returns to labor (we leave aside capital for the
time being), so, using logs:
y = a + n
where y is log output, n is log employment, and a is log productivity (either
tfp or labor productivity; the two are the same here). Assuming either compe-
tition in the goods market or a constant markup, the wage paid by firms, the
“warranted real wage”, is given by:
w − p = a
where w is the log nominal wage, and p is the price level (constant terms are
left out throughout for notational simplicity). Assume further that a follows:
a = a(−1) + ǫ
so we can focus on the effects of a negative realization of ǫ, a decrease in pro-
ductivity.
Assume the bargained wage is given by:
w − p = Ea − βu
The bargained wage depends on expected productivity Ea and is a decreas-
ing function of the unemployment rate u. Assume that expected productivity
adjusts over time to actual productivity according to:
Ea = λEa(−1) + (1 − λ)a
I take the speed of adjustment of expected to actual productivity, (1 − λ) as
given here. In more explicit models, the λ like parameter has been derived
40

from learning in a Bayesian environment in which firms and workers have to
assess whether shocks are temporary or permanent, or from staggering of wage
decisions (a la Taylor (1979) or Calvo (1981)), or both.
Combining the equations for the warranted and the bargained wage gives:
u = −
1
β
(a − Ea)
An unexpected decrease in productivity leads to an increase in unemployment.
Combining the equation for expected productivity with the equation above gives
the behavior of the natural rate of unemployment:
u = λu(−1) −
λ
β
ǫ
A permanent decrease in productivity increases equilibrium unemployment (equiv-
alently, the “natural rate” of unemployment) for some time, but not forever. λ
and β capture the two dimensions of real rigidities. The higher λ, i.e the slower
the adjustment of expectations, the longer lasting the effects of the shock. The
lower β, the larger the effect of the adverse shock on unemployment.
Now introduce nominal rigidities. To do so, replace the equation for the bar-
gained wage by:
w = Ep + Ea − βu
The nominal wage is set on the basis both of the expected price level and
expected productivity. Combining the equations for the warranted and the bar-
gained wage gives:
u = −
1
β
[(a − Ea) + (p − Ep)]
(Ignoring the unexpected productivity term and moving terms around gives the
conventional expectational Phillips curve, p = Ep−βu). The central implication
of this equation is that, in the presence of nominal rigidities, monetary policy
can, to the extent that it can increase p − Ep, potentially offset the adverse
effects of adverse productivity shocks. Put another way, expansionary monetary
policy can offset the increase in the natural rate by maintaining the actual rate
below the natural rate. The precise form of monetary policy required to do so
depends on the formation of price expectations and the rest of the model; it is
not essential to the argument made here.
41

In short, this box has shown how, in general, the response of unemployment to
adverse supply shocks will depend on real and nominal rigidities. (An explicitly
micro-founded treatment of these issues is given in Blanchard and Gali (2005)).
Box 2. Persistence Mechanisms
The first persistence mechanism focuses on capital accumulation and its im-
plications for the warranted wage. The second focuses on collective bargaining
and its implications for the bargained wage.
Capital accumulation, and the two effects of monetary policy
Assume that, instead of the assumption of constant returns to labor we made
in the previous box, the production function is Cobb–Douglas in capital and
labor, and constant returns to scale:
y = α(a + n) + (1 − α)k
where k is the log of the capital stock, and a is the index of Harrod neutral
technology (“technology for short). Assuming perfect competition in the goods
market or a constant markup, the wage paid by firms, the “warranted real wage”
is given by (up to a constant term, that I ignore) :
w − p = (α − 1)(n − k + a) + a
For a given capital stock, the higher is employment, the lower is the marginal
product of labor, the lower is the warranted real wage.
The profit rate associated with a given real wage is given by the factor price
frontier relation (up to a constant term, again ignored)
π = −
α
1 − α
(w − p − a)
where π is the log of the profit rate.
42

Let r be the log of the user cost of capital. If π is less than r, k decreases over
time. If π is greater than r, k grows over time. In the long run, the profit rate
must be equal to the user cost, so the warranted real wage is given by:
w − p = a +
1 − α
α
r
Assume the bargained wage is given, as in Box 1, by:
w − Ep = Ea − βu
Let ¯
n the log of the labor force, so u ≈ ¯
n − n. Then, using the equation for the
warranted real wage in the short run and the equation for the bargained wage
gives:
p + (α − 1)(¯
n − k + a) − (α − 1)u = Ep + Ea − βu
Or, reorganizing:
u = −
1
1 − α + β
[(a − Ea) + (p − Ep) + (α − 1)(¯
n − k + a)]
In the short run, unemployment depends, as in the previous box, on a − Ea,
and p − Ep. But it also depends on the capital stock. The lower the capital
stock, the lower the demand for labor, the higher the unemployment rate.
Now consider a permanent decrease in productivity, leading, initially, to a neg-
ative a − Ea. For the time being, ignore nominal rigidities and the term p − Ep.
Other things equal, unemployment will initially go up, and then come down as
expectations of productivity adjust to the new lower level. This is what we saw
in the previous box. But, now, another mechanism is at work. So long as employ-
ment is lower, so is profit, and so is capital accumulation. Thus, unemployment
returns to normal, but this may take a long time.
In the context of this model, it is worth returning to the role of monetary
policy. First, and as before, expansionary monetary policy, to the extent it can
affect p − Ep, can reduce real wages and limit the increase in unemployment,
by having actual unemployment remain below the natural rate. Second, to the
extent that it also reduces the real interest rate and therefore the user cost, it
can also reduce the effect on capital accumulation, and thus reduce the increase
in the natural rate over time. What happened in the second half of the 1970s can
43

be interpreted in this light. Had monetary policy been tighter, unemployment
would have been higher, and the decrease in capital accumulation larger.
If, however, monetary policy turns contractionary, then both effects work in
reverse. Tight money leads to an increase in the unemployment rate over the
natural rate. And high real interest rates lead to a decrease in capital accumula-
tion, and to an increase in the natural rate. This can be seen as what happened
during the disinflationary episodes of the early 1980s.
Insider Effects, Hysteresis, and Persistence
Assume that technology, and so the warranted wage are the same as above. The
real wage paid by firms—equivalently the relation between employment and the
real wage—is given by:
w − p = (α − 1)(n − k + a) + a = (α − 1)(n − k) + αa
To focus on the dynamics from collective bargaining, we turn off the other
source of persistence, and assume the capital stock is fixed.
Turn to wage setting. Think of wages as being set by a monopoly union that
chooses the wage, and then lets the firm decide about employment.
Suppose the nominal wage is chosen so that, in expected value, the membership
of the union is employed:
w | En = m
where m is log membership. Suppose that membership is given by:
m = n(−1) + θ(¯
n − n(−1))
If θ = 0, then membership is just equal to employment last period: The union
cares only about the employed. If 1 > θ > 0, the union puts some weight
on employment of the unemployed, but less than on the employment of those
already employed.
Assume that the union chooses the nominal wage, based on the warranted wage
relation above, and based on expectations of both technology and the price
level, so
w = Ep + (α − 1)(n(−1) + θ(¯
n − n(−1) − k)) + αEa
44

Combining the equations for the warranted and the bargained wage, and reor-
ganizing, using u = ¯
n − n(−1), gives:
u = (1 − θ)u(−1) −
1
1 − α
[(p − Ep) + α(a − Ea)]
Unemployment adjusts over time to unexpected movements in prices and tech-
nology. The lower θ—the lower the weight of unemployment in bargaining—
the higher the persistence. The initial Blanchard–Summers (1986) formulation
assumed θ equal to zero. Under that assumption, the process for the unem-
ployment rate has a unit root: The unemployment rate does not return to any
particular value, and where it is depends on the history of surprises to both the
price level and technology. It exhibits “hysteresis”.
As many pointed out however, the assumption that θ is equal to zero is too
strong. Even if the union does not care about the unemployed, they care what
could happen to their members if there were adverse shocks and some members
became unemployed. The higher the unemployment rate, the more careful they
will be in their wage demands. Also, unions rarely set the wage unilaterally; to
the extent that there is bargaining, firms can threaten to hire the unemployed.
The higher the unemployment rate, the stronger the threat. All these factors
imply a positive value of θ, and thus persistence rather than hysteresis.
Box 3. Flows, Matching, and Bargaining. The Beveridge Curve
and the Phillips Curve.
The purpose of this box is to present the basic implications of the flow approach
for understanding unemployment. I have presented it in a way which makes it
most easily comparable to the theories presented in the previous boxes. For a
full treatment, see the book by Pissarides (2000).
Gross Flows
The starting point of the theory is that relatively stable aggregate employment
is the result of large gross flows of job creation and job destruction. Let x and y
45

be respectively the logs of the flows of jobs created and jobs destroyed. Assume
that x and y are given by:
x = −θ
x
(w − p) + z
x
y = θ
y
(w − p) − z
y
w and p are the logs of the nominal wage and the price level respectively. Job
creation is decreasing in the real wage, job destruction increasing in the real
wage. z
x
and z
y
are the factors that affect creation and destruction given the
real wage (for example, productivity, oil prices, the cost of capital, which we
focused on earlier).
In steady state, employment must be stable, so creation must be equal to de-
struction: x = y. This implies that the “warranted” real wage satisfies:
w − p = z ≡
1
θ
x
+ θ
y
(z
x
+ z
y
)
This in turn determines steady state gross flows x and y.
Matching, Unemployment, and Vacancies
At any point in time, there are workers looking for jobs (the unemployed),
and jobs looking for workers (vacancies). The matching process is characterized
by a “matching function”, which relates hires to the stock of unemployed and
vacancies. Assume this function is of the form:
h = αU + (1 − α)V + z
m
h is the log of hires, U and V are the logs of unemployment and vacancies
respectively. The higher the number of unemployed, or the higher the number
of vacancies, the more matches, the more hires. z
m
captures all the factors
that affect the efficiency of the matching process. For example, a decrease in
the search intensity of the unemployed, or an increased mismatch between the
skills of the unemployed and the skills desired by firms, both lead to a decrease
in z
m
.
The relation between unemployment and vacancies for a given h is called the
Beveridge curve. Shifts in the Beveridge curve correspond to changes in z
m
.
46

The relation between h, U and V can also be written as:
(h − U ) = (1 − α)(V − U ) + z
m
h − U is the log of the ratio of hires to unemployment, thus the log of the prob-
ability per period of finding a job when unemployed, or, put yet another way,
minus the log of average unemployment duration. The relation therefore says
that unemployment duration is a decreasing function of the ratio of vacancies
to unemployment.
Bargaining, and the Determination of the Bargained Wage
If we think of wages as being the result of bargains between individual workers
and firms, the outcome will depend on the state of the labor market. The higher
h−U , the easier it is for a worker to find a job if unemployed, and so the stronger
the worker will be in bargaining. Symmetrically, the higher h−V , the easier it is
for a firm is to fill a vacancy, and so the stronger the firm will be in bargaining.
This suggests a wage relation of the form:
w − Ep = β[(h − U ) − (h − V )] + z
b
where the nominal wage depends, as before, on the expected price level, the
difference between the labor market prospects of the worker, h − U , and of the
firm, h−V . z
b
stands for all the other factors that affect bargaining; for example,
the level of unemployment benefits if unemployed—which strengthen the worker
in bargaining and increase the wage, or employment protection—which makes
it more costly for the firm to replace a worker by another.
Note that the wage equation can be rewritten as:
w − Ep = −β(U − V ) + z
b
Or equivalently, using the relation derived from the matching function:
w − Ep =
β
1 − α
(h − U ) +
1
1 − α
z
m
+ z
b
Note that this suggests the correct labor market variable in the equation for
the bargained wage is not the unemployment rate (the variable traditionally
used in such equations), but either the ratio of unemployment to vacancies, or
47

the probability of exiting unemployment (or its inverse, average unemployment
duration).
Combining the first of the two wage equations with the equation for the war-
ranted wage earlier gives a Phillips curve relation:
p − Ep = −β(U − V ) − z + z
b
The Natural Unemployment Rate
Combining this equation and the equation for the warranted wage, and assuming
Ep = p, gives a characterization of equilibrium unemployment duration:
h − U =
1
β
[(1 − α)z − z
m
+ (1 − α)z
b
]
Equilibrium duration (recall that U − h is the log of duration) depends on the
factors that shift the warranted wage, those that shift the matching function,
and those that affect bargaining (some factors may be common to the different
z’s.)
The equilibrium flow h must be equal to job creation, so h = x where x is
determined by the warranted wage. This in turn determines the natural rate
of unemployment as the product of equilibrium duration and the equilibrium
flow.
Note how, in principle, we can learn about the sources of the shifts in the natural
rate by looking both at the Beveridge curve relation—which tells us about shifts
in z
m
—and at the Phillips curve—which tells us about shifts in z and z
b
.
Box 4. The Tax Wedge and Unemployment
Suppose that there are two types of taxes (Assume both are paid by workers
rather than by the firm, but, except in the presence of a binding minimum wage,
it does not matter whether these are paid by the worker or by the firm.)
48

•
A tax levied on all income (or consumption; the two are taken to be
the same here), be it unemployment benefits or labor income, τ
1
. (For
example, an income tax, or a VAT)
•
A tax levied on labor income only, τ
2
, with benefits (in present discounted
value) equal to λτ
2
. λ maybe equal to zero, if the tax is not associated
with any benefit to the worker. It may be may be close or equal to one
if it goes towards financing a retirement account.
If unemployed, the worker receives b − τ
1
− f (u), f (.) > 0, f
′
(.) > 0, where b is
unemployment benefits, and f (u) captures the private cost of being unemployed,
which is assumed to be increasing in the unemployment rate. If employed, the
worker receives w − τ
1
− τ
2
+ λτ
2
. His surplus from working for the firm is
therefore:
V
w
≡ w − b + f (u) − (1 − λ)τ
2
If the firm employs the worker, the firm receives y − w, where y is the produc-
tivity of the worker. If it does not, it receives nothing. Thus the firm’s surplus
from employing the worker is:
V
f
≡ y − w
The total surplus from the match is given by:
V = y − b + f (u) − (1 − λ)τ
2
If we assume that workers receive a share β of the surplus, so V
w
= βV , the
wage (and the cost of labor to the firm) is given by:
w = βy + (1 − β)(b − f (u)) + τ
2
(1 − λ)(1 − β)
So
dCost/dτ
1
= 0
dCost/dτ
2
= (1 − λ)(1 − β)
This makes clear that the frequent practice of simply adding all the social
contributions together, plus the VAT and/or the income tax to get a “tax
wedge” does not make sense. For each tax, we need to know whether it is levied
on labor income and other benefits, or just on labor income. For each tax, we
also need to know the relevant value of λ. In the case of social security for
example, some redistribution is typically at work, so λ depends on the wage
49

level.
Box 5. The Labor Share
Assume that the production function has constant returns to scale, and Harrod
neutral technological progress, so:
y = f (k, an)
where y, k, n, and a are the levels of output, capital, employment, and technol-
ogy respectively.
Let ˜
n ≡ an and ˜
w ≡ w/a denote employment and the wage in efficiency units
(I shall drop “in efficiency units” in what follows). Then, assuming firms take
the wage as given, labor demand is given by:
˜
n
k
= g( ˜
w)
g
′
(.) ≤ 0
The ratio of employment to the capital stock is a decreasing function of the
wage. The share of labor is given in turn by:
s ≡
wn
y
=
˜
w˜
n
y
Now consider an exogenous increase in the wage ˜
w. Suppose that in the short
run, there is no scope for substitution between labor and capital, so g
′
= 0.
The ratio of labor to capital remains the same, and so does the ratio of labor
to output. Thus, ˜
w goes up, ˜
n/y does not change, and the labor share goes up.
What happens over time depends on the long run elasticity of substitution. If it
less than one, the labor share decreases from its initial peak, but remains higher
than before the increase in the wage; if it is equal to one, the share returns to
its initial value; if it is greater than one, the share returns to a lower value than
before the increase in the wage.
These dynamics can clearly explain why, after the increase in ˜
w, the labor share
went first up, and then down over time. But they do not easily explain why the
50

labor share decreased below its initial level. A permanent increase in ˜
w, and
a long-run elasticity of substitution greater than one would explain it; but as
we saw in the text, ˜
w decreased back to or below its original value from the
mid–1980s on.
Another element is therefore needed to explain the combination of a lower wage
and a lower share. One potential explanation is a decrease in labor hoarding.
Extend the equation for the demand for labor to be:
˜
n
k
= g( ˜
w, z)
g
′
z
> 0
Then, a decrease in z, due for example to the reduction of x–inefficiency, will
decrease labor demand, and decrease the labor share. This is the explanation
suggested in Blanchard (1998).
Suppose instead that firms are not wage takers, and that the marginal wage,
call it ˜
w
m
, differs from the (measured) average wage. The demand for labor is
therefore given by:
˜
n
k
= g( ˜
w
m
)
In this case, an increase in the marginal wage for a given average wage, will
lead to a decrease in employment, and thus to a decrease in the labor share.
One can think of a number of institutions which might lead to such an increase
in the marginal wage: for example, additional regulations, additional workers’
rights as the size of the firm increases. This is the line of explanation suggested
by Caballero and Hammour (1998).
51

Appendix. Unemployment rates, by country.
0
5
10
15
20
UNR
1970 1975 1980 1985 1990 1995 2000 2005
AUSTRIA
0
5
10
15
20
UNR
1970 1975 1980 1985 1990 1995 2000 2005
BELGIUM
0
5
10
15
20
UNR
1970 1975 1980 1985 1990 1995 2000 2005
GERMANY
0
5
10
15
20
UNR
1970 1975 1980 1985 1990 1995 2000 2005
DENMARK
0
5
10
15
20
UNR
1970 1975 1980 1985 1990 1995 2000 2005
SPAIN
0
5
10
15
20
UNR
1970 1975 1980 1985 1990 1995 2000 2005
FINLAND
0
5
10
15
20
UNR
1970 1975 1980 1985 1990 1995 2000 2005
FRANCE
0
5
10
15
20
UNR
1970 1975 1980 1985 1990 1995 2000 2005
UNITED KINGDOM
Fig A1. Unemployment rates, by country
Source: OECD
52

0
5
10
15
20
UNR
1970 1975 1980 1985 1990 1995 2000 2005
GREECE
0
5
10
15
20
UNR
1970 1975 1980 1985 1990 1995 2000 2005
IRELAND
0
5
10
15
20
UNR
1970 1975 1980 1985 1990 1995 2000 2005
ITALY
0
5
10
15
20
UNR
1970 1975 1980 1985 1990 1995 2000 2005
LUXEMBOURG
0
5
10
15
20
UNR
1970 1975 1980 1985 1990 1995 2000 2005
NETHERLANDS
0
5
10
15
20
UNR
1970 1975 1980 1985 1990 1995 2000 2005
PORTUGAL
0
5
10
15
20
UNR
1970 1975 1980 1985 1990 1995 2000 2005
SWEDEN
0
5
10
15
20
UNR
1970 1975 1980 1985 1990 1995 2000 2005
UNITED STATES
Fig A1. Unemployment rates, continued
Source: OECD
53

References
[1] George Akerlof, William Dickens, and George Perry. The macroeconomics
of low inflation. Brookings Papers on Economic Activity, 1:1–76, 1996.
[2] Dean Baker, Andrew Glyn, David Howell, and John Schmitt. Labor market
institutions and unemployment: A critical assessment of the cross-country
evidence. CEPA working paper 2002-17, 2002.
[3] Charles Bean. European unemployment; a survey. Journal of Economic
Literature, 32:573–619, June 1994.
[4] Charles Bean and Jacques Dreze. Europe’s Unemployment Problem. MIT
Press, Cambridge, 1990.
[5] Michele Belot and Jan van Ours. Unemployment and labor market institu-
tions; an empirical analysis. August 2001. WP 2001-50, CentER, Tilburg
University.
[6] Giuseppe Bertola and Richard Rogerson. Institutions and labor realloca-
tion. European Economic Review, 41(6):1147–1161, June 1997.
[7] Olivier Blanchard. Two tools for analyzing unemployment. Issues in Con-
temporary Economics, 2:102–127, 1990. Marc Nerlove editor, MacMillan
and International Economic Association.
[8] Olivier Blanchard. The medium run. Brookings Papers on Economic Ac-
tivity, 2:89–158, 1997.
[9] Olivier Blanchard. Revisiting European unemployment: Unemployment,
capital accumulation, and factor prices. May 1998. Geary Lecture, Dublin
1998 (also NBER working paper 6566).
[10] Olivier Blanchard. The Economics of Unemployment. Shocks, Institu-
tions, and Interactions.
2000.
Lionel Robbins Lectures (http://econ-
www.mit.edu /faculty/blanchar/papers.html).
[11] Olivier Blanchard, Daniel Cohen, and Cyril Nouveau. The evolution of
labor market institutions in France since 1950. September 2005.
[12] Olivier Blanchard and Peter Diamond. The Beveridge curve. Brookings
Papers on Economic Activity, 1:1–74, 1989.
[13] Olivier Blanchard, Rudiger Dornbusch, Jacques Dreze, Herbert Giersch,
Richard Layard, and Mario Monti. Employment and growth: A two-handed
approach. Center for European Policy Studies, June 1985.
[14] Olivier Blanchard and Jordi Gali. Real wage rigidities and the New Key-
nesian model. June 2005.
54

[15] Olivier Blanchard and Augustin Landier. The perverse effects of partial la-
bor market reform: Fixed duration contracts in France. Economic Journal,
112:F214–244, June 2002.
[16] Olivier Blanchard and Thomas Philippon. The decline of rents, and the
rise and fall of European unemployment. 2003. mimeo, MIT.
[17] Olivier Blanchard and Pedro Portugal. What hides behind an unemploy-
ment rate. Comparing Portuguese and U.S. unemployment. American Eco-
nomic Review, 91(1):187–207, March 2001.
[18] Olivier Blanchard and Lawrence Summers. Perspectives on high world real
interest rates. Brookings Papers on Economic Activity, 2:273–324, 1984.
[19] Olivier Blanchard and Lawrence Summers. Hysteresis and the European
unemployment problem. NBER Macroeconomics Annual, 1:15–78, 1986.
Stanley Fischer (editor) , MIT Press.
[20] Olivier Blanchard and Justin Wolfers. Shocks and institutions and the rise
of European unemployment. The aggregate evidence. Economic Journal,
110(1):1–33, March 2000.
[21] Olympia Bover, Pilar Garcia-Perea, and Pedro Portugal. A comparative
study of the Portuguese and Spanish labour markets. Economic Policy,
October 2000.
[22] W. Branson and J. Rotemberg. International adjustment with wage rigid-
ity. European Economic Review, 13(3):309–337, 1980.
[23] Michael Bruno and Jeffrey Sachs. The Economics of Worldwide Stagflation.
Basil Blackwell, Oxford, 1985.
[24] Ricardo Caballero and Mohamad Hammour. Jobless growth: Appropriabil-
ity, factor substitution and unemployment. Carnegie-Rochester Conference
Series on Public Policy, (48):51–94, 1998.
[25] Pierre Cahuc and Yann Algan. Civic attitudes and the design of labor mar-
ket institutions: Which countries can implement the danish Flexisecurity
model? September 2005. mimeo Universit´e Paris I, Paris.
[26] Pierre Cahuc and Andr´e Zylberberg. Le chomage: Fatalit´e ou N´ecessit´e?
Flammarion, Paris, 2004.
[27] Lars Calmfors and J. Driffill. Centralization of wage bargaining and macro-
economic performance. Economic Policy, 6:16–31, 1988.
[28] Guillermo Calvo. Staggered contracts in a utility-maximizing framework.
Journal of Monetary Economics, September 1983.
55

[29] Michel Camdessus. Le sursaut. Vers une nouvelle croissance pour la france.
September 2004. Documentation Francaise, Paris.
[30] David Card and Richard Freeman. What have two decades of British
economic reform delivered? 2004. Seeking a Premier League Economy”,
Richard Blundell, David Card and Richard Freeman (eds).
[31] David Coe and Dennis Snower. Policy complementarities: The case for
fundamental labor market reform. pages 1–35, March 1997. IMF Staff
Papers 44-1.
[32] Diego Comin and Thomas Philippon. The rise in firm-level volatility:
Causes and consequences. NBER Macro Annual, 20, 2005. forthcoming,
NBER and MIT Press.
[33] Francesco Daveri and Guido Tabellini. Unemployment, growth and taxa-
tion in industrial countries. Economic Policy, pages 47–104, April 2000.
[34] Steven Davis, John Haltiwanger, and Scott Schuh. Job Creation and Job
Destruction. MIT Press; Cambridge, Mass, 1996.
[35] Steven Davis, R. Jason Faberman, and John Haltiwanger. The flow ap-
proach to labor markets: New data sources, micro–macro links, and the
recent downturn. IZA discussion paper 1639, June 2005.
[36] Alain de Serres, Stefano Scarpetta, and Christine de la Maisonneuve. Sec-
toral shifts in Europe and the United States: How they affect aggregate
labor shares and the properties of the wage equations. OECD working
papers, (326), 2002. Economics Department, OECD.
[37] Peter Diamond. Wage determination and efficiency in search equilibrium.
Review of Economic Studies, 49:217–227, 1982.
[38] R. Duhautois. Evolution des flux d’emplois en france entre 1990 et 1996;
une etude empirique a partir du fichier des ‘benefices r´eels normaux. INSEE
G9915, September 1999.
[39] Peter Fredriksson and Bertil Holmlund. Improving incentives in unemploy-
ment insurance; A review of recent research. CESIfo working paper 922,
April.
[40] Richard Freeman. Labour market institutions without blinders: The debate
over flexibility and labour market performance. NBER working paper,
(11286), April 2005.
[41] Milton Friedman. The role of monetary policy. American Economic Re-
view, 58:1–21, March 1968.
56

[42] Robert Gordon. Alternative responses of policy to external supply shocks.
Brookings Papers on Economic Activity, 1:183–206, 1975.
[43] Nils Gottfries and Henrik Horn. Wage formation and unemployment per-
sistence. Economic Journal, 97:877–886, December 1987.
[44] Robert Gregory. Wages policy and unemployment in Australia. Economica,
1986. Supplement.
[45] Martin Hellwig and Manfred Neumann. Economic policy in Germany: Was
there a turnaround? Economic Policy, 5:105–140, 1987.
[46] Bertil Holmlund. The rise and fall of Swedish unemployment. CESIFO,
April 2003. working paper 918.
[47] Patrick Honohan and Brendan Walsh. Catching up with the leaders; The
Irish hare. Brookings Papers on Economic Activity, (1):1–57, 2002.
[48] Jennifer Hunt. The impact of the 1962 repatriates from Algeria of 1962
on the French labor market. Industrial and Labor Relations Review, April
1992.
[49] Richard Layard and G. Johnson. The natural rate of unemployment: Ex-
planation and policy. 1986. Handbook of Labor Economics, Volume II, O.
Ashenfelter and R. Layard eds, North Holland, 1986, 921-999.
[50] Richard Layard and Stephen Nickell. The labour market. The Performance
of the British Economy, 1987. Rudiger Dornbusch and Richard Layard
(editors), Clarendon Press, Oxford.
[51] Richard Layard, Stephen Nickell, and Richard Jackman. Unemployment;
Macroeconomic performance and the labour market. Oxford University
Press, 1991.
[52] Richard Layard, Stephen Nickell, and Richard Jackman. Unemployment;
Macroeconomic performance and the labour market. Oxford University
Press, 2005. second edition.
[53] Edward Lazear. Job security provisions and employment. Quarterly Jour-
nal of Economics, 105-3:699–726, 1990.
[54] Lars Ljungqvist and Thomas Sargent.
The European unemployment
dilemna. Journal of Political Economy, 106(3):514–550, 1998.
[55] Lars Ljungqvist and Thomas Sargent. Jobs and unemployment in macro-
economic theory; A turbulence laboratory. 2005. mimeo, NYU, August.
[56] John Martin and David Grubb. What works and for whom: A review
of OECD countries’ experience with active labor market policies. OECD
working paper, 2001.
57

[57] Franco Modigliani and Tomaso Padoa-Schioppa. La politica economica in
una economia con salari indicizzati al 100% piu. Moneta e Credito, 30:3–53,
First Quarter 1977.
[58] Dale Mortensen and Christopher Pissarides. Job creation and job destruc-
tion in the theory of unemployment. Review of Economic Studies, 61-
3(208):397–416, July 1994.
[59] Stephen Nickell. Unemployment and labor market rigidities: Europe versus
North America. Journal of Economic Perspectives, 11(3):55–74, Summer
1997.
[60] Stephen Nickell, Luca Nunziata, and Wolfgang Ochel. Unemployment in
the OECD since the 1960s: What do we know? Economic Journal, 115:1–
27, January 2005.
[61] Stephen Nickell, Luca Nunziata, Wolfgang Ochel, and Glenda Quintini.
The Beveridge curve, unemployment and wages in the OECD from the
1960s to the 1990s. July 2002. Working paper, LSE.
[62] Stephen Nickell and Jan van Ours. The Netherlands and the United King-
dom: a European unemployment miracle. Economic Policy, 30, April 2000.
[63] V. Nocke. Gross job creation and gross job destruction: An empirical study
with French data. 1994. Bonn University.
[64] Andrew Oswald. The missing piece of the unemployment puzzle? 1997.
Inaugural Lecture, Department of Economics, Warwick.
[65] Edmund Phelps. Inflation theory and unemployment policy. W.W. Norton;
New York, 1972.
[66] Edmund Phelps. Structural Slumps. The modern equilibrium theory of
unemployment, interest, and assets. Harvard University Press; Cambridge
MA, 1994.
[67] Christopher Pissarides. Short run equilibrium dynamics of unemployment,
vacancies, and real wages. American Economic Review, 1985:676–690,
1985.
[68] Christopher Pissarides. Equilibrium Unemployment Theory. Basil Black-
well; Oxford, 1990.
[69] Christopher Pissarides. Equilibrium Unemployment Theory. Second edi-
tion, MIT Press, 2000.
[70] John Taylor. Aggregate dynamics and staggered contracts. Journal of
Political Economy, 88(1):1–24, 1980.
[71] Niels Westergaard–Nielsen. Danish labour market policy: Is it worth it?
58

Center for Labour market and Social Reserch, working paper 01-10, No-
vember 2001.
[72] Conny Wunsch. Labour market policy in Germany: Iinstitutions, instru-
ments and reforms since unification. Discussion Paper, Universitat St
Gallen, March 2005.
59
Wyszukiwarka
Podobne podstrony:
An Examination of the Evolution of Army and Air Force
The Evolution of Viruses and Worms
Becker The quantity and quality of life and the evolution of world inequality
Shaman Saiva and Sufi A Study of the Evolution of Malay Magic by R O Winstedt
Aspects of the development of casting and froging techniques from the copper age of Eastern Central
MENDOZA LINE, THE Full of Light and Full of Fire CD (Misra) MSR37 , Non Exportable to UK, Europe an
On The Manipulation of Money and Credit
The Hound of?ath and Other Stories
The Repentance of Compassion and Enlightenment Path
Piórkowska K. Cohesion as the dimension of network and its determianants
1b The Literature of Discovery and Exploration
Buss The evolution of self esteem
Laszlo, Ervin The Convergence of Science and Spirituality (2005)
Childhood Trauma, the Neurobiology of Adaptation, and Use dependent of the Brain
annex vi ext of the Protocol of 1997 and Annex VI
więcej podobnych podstron