
ANSWERS TO EXERCISES AND REVIEW
QUESTIONS
PART THREE: PRELIMINARY ANALYSES
Before attempting these questions read through Chapters 6, 7, 8, 9 and 10 of the SPSS
Survival Manual.
Descriptive statistics
The first step in the analysis of any data file is to obtain descriptive statistics on each of your
variables. These can be used to check for out-of-range cases, to explore the distribution of the
scores, and to describe your sample in the Method section of a report.
3.1 Use the instructions in Chapter 6 and Chapter 7 of the SPSS Survival Manual to answer
the following questions concerning the variables included in the survey.sav data file.
(a) What is the mean age of the sample? What is the age range of the sample (minimum
and maximum values)?
p.51 The mean age of the sample is 37.44, with a range from 18 to 82.
Statistics
age
439
0
37.44
18
82
Valid
Missing
N
Mean
Minimum
Maximum
(b) What is the percentage of males and females in the sample? Did any of the sample fail to
indicate their gender?
p. 50 The sample consisted of 42.1% males, and 57.9% females. There was no missing data
for this variable.
sex
185
42.1
42.1
42.1
254
57.9
57.9
100.0
439
100.0
100.0
MALES
FEMALES
Total
Valid
Frequency
Percent
Valid Percent
Cumulative
Percent
(c) What percentage of the sample were smokers?
p. 50 Of the people that responded to this question 19.5% reported being a smoker.
smoker
85
19.4
19.5
19.5
351
80.0
80.5
100.0
436
99.3
100.0
3
.7
439
100.0
YES
NO
Total
Valid
System
Missing
Total
Frequency
Percent
Valid Percent
Cumulative
Percent
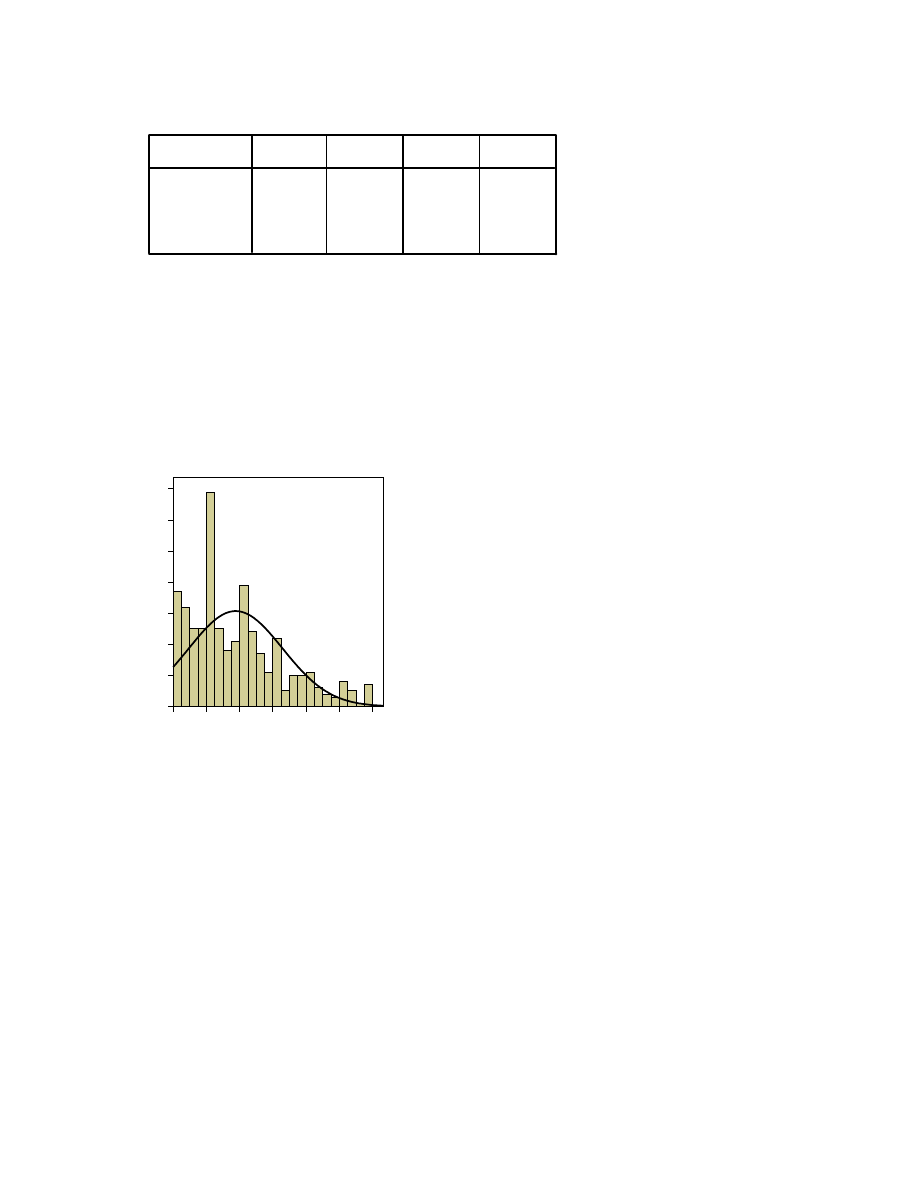
(d) Inspect the distribution of scores on the Total Negative Affect scale. How normal is the
distribution? Are there any cases that you would consider outliers?
The distribution of scores on the Total Negative Affect Scale is skewed, with many low scores
being recorded. There are no real outliers in the distribution
10
15
20
25
30
35
40
total negative affect
0
10
20
30
40
50
60
70
Frequency
Mean = 19.4
Std. Dev. = 7.072
N = 435
Histogram
Using graphs to describe and explore the data
3.2 Using the data file survey.sav, follow the instructions in Chapter 7 of the SPSS Survival
Manual to obtain the following graphs.
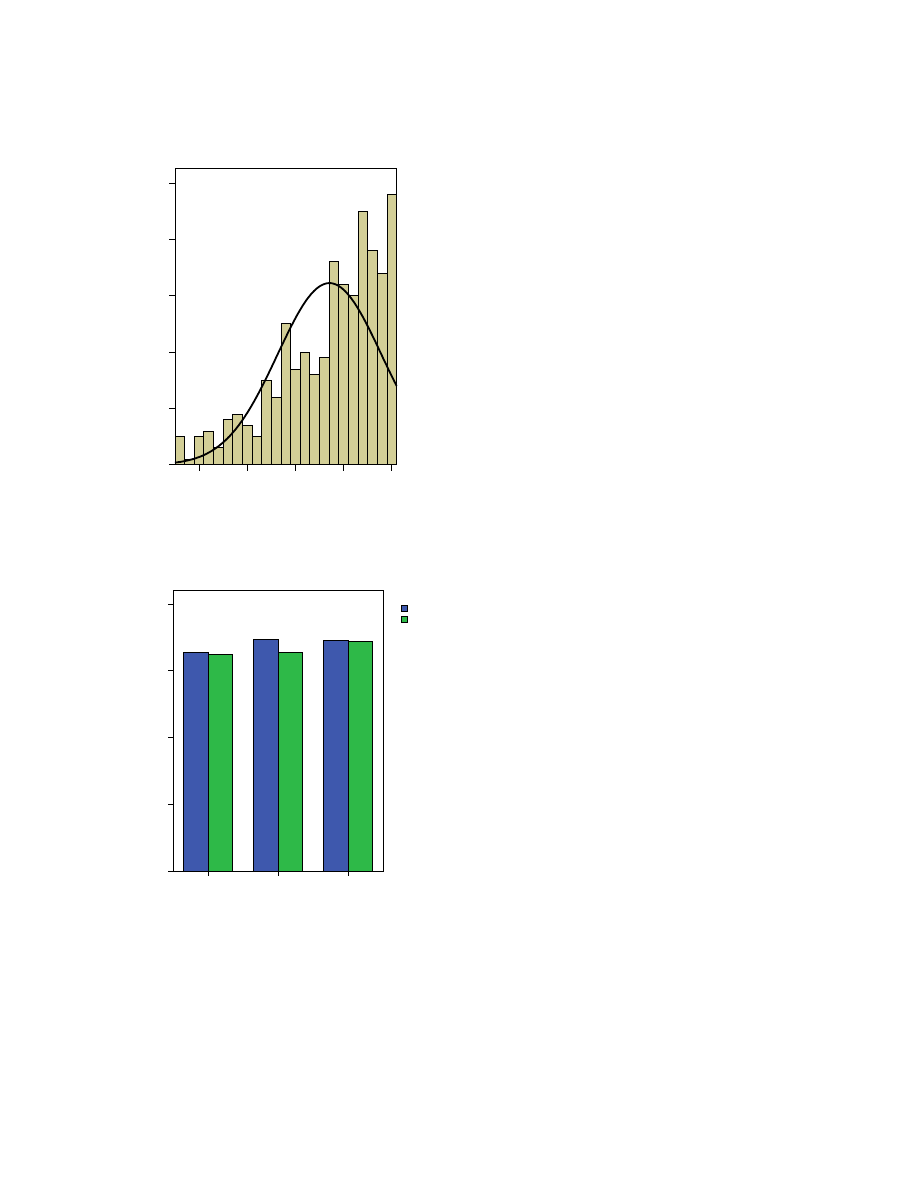
(a) histogram of scores on the Total Self-esteem scale (tslfest)
20
25
30
35
40
total self esteem
0
10
20
30
40
50
Fr
eq
ue
n
c
y
Mean = 33.53
Std. Dev. = 5.395
N = 436
(b) bar graph of scores on the Total Self-esteem scale (tslfest) for males and females (sex),
across the three age groups (agegp3)
18-29
30-44
45+
age 3 groups
0
10
20
30
40
Mean total self esteem
sex
MALES
FEMALES
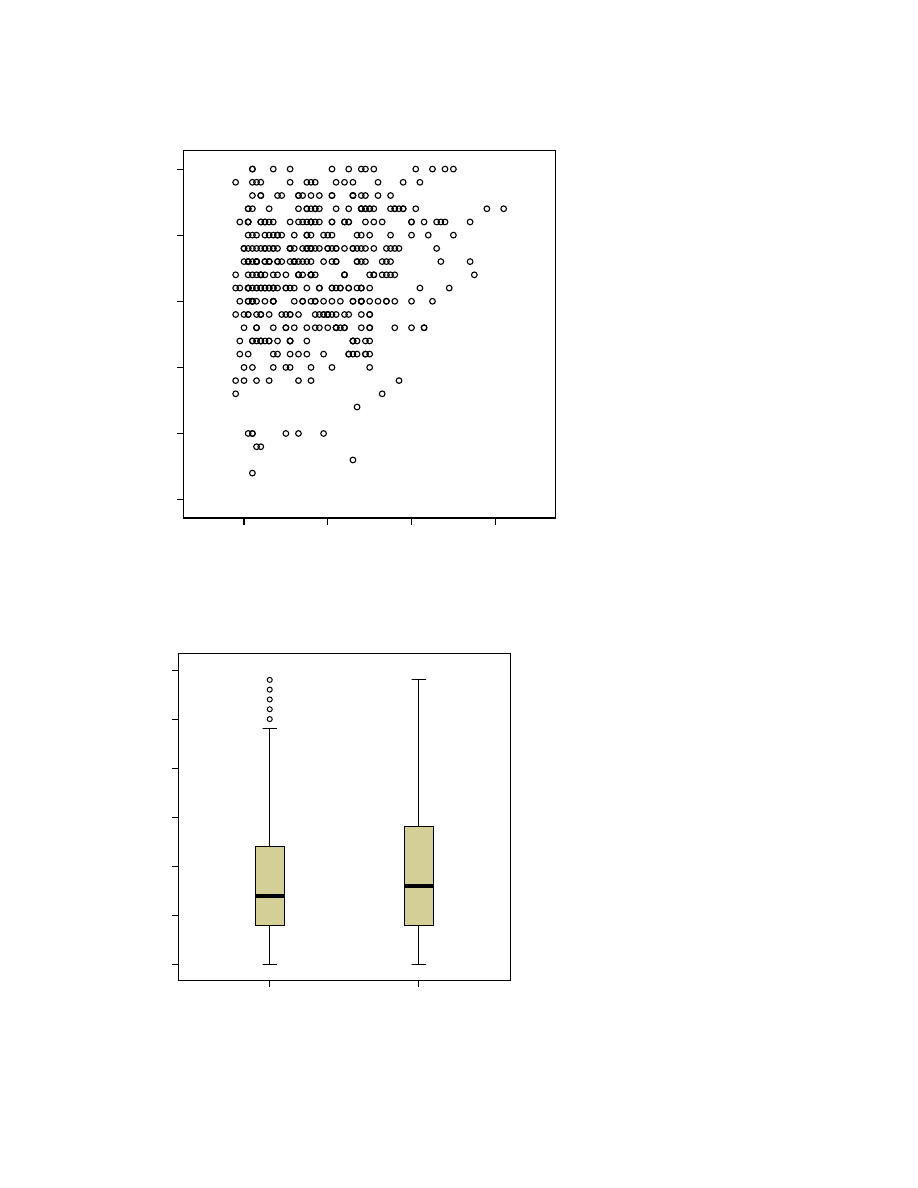
(c) scatterplot of scores on age and total scores on the Optimism scale (toptim)
20
40
60
80
age
5
10
15
20
25
30
to
ta
l o
p
timi
sm
(d) boxplot of scores on the Total Negative Affect scale (tnegaff) for males and females
MALES
FEMALES
sex
10
15
20
25
30
35
40
to
tal
n
e
ga
ti
ve af
fect
9
274
386
238
24
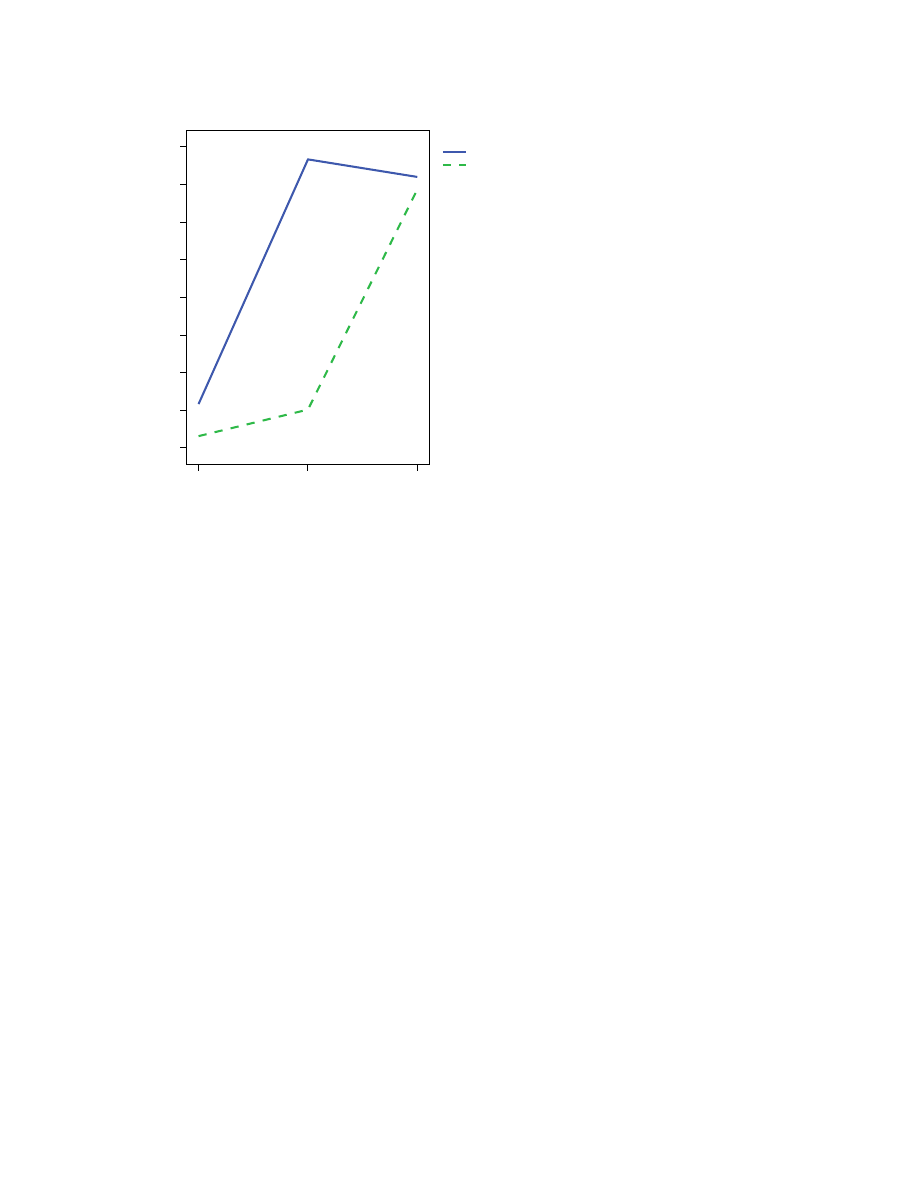
(e) line graph of the Total Self-esteem scale (tslfest) for males and females (sex), across the
three age groups (agegp3)
<= 29
30 - 44
45+
age in 3 groups
32.4
32.7
33
33.3
33.6
33.9
34.2
34.5
34.8
M
ean total s
elf estee
m
sex
MALES
FEMALES
Note: For display purposes I have modified the graph by changing the female line to a dashed
line.
Manipulating the data
This section includes a number of activities to help you review, and to apply, the material
covered in Chapter 8 of the SPSS Survival Manual. You should read through this chapter
before attempting these questions.
3.3 One of the things that many students initially find difficult is being able to identify when
items in a scale need to be ‘reversed’ before being added to give a total score. It is essential
that this is done correctly, otherwise the values obtained for the total scale do not mean
anything.
To give you some practice at this we will use the Perceived Control of Internal States scale
(Pallant, 2000). The scale is shown below.

Using the scale provided, decide how much you either agree or disagree with each statement. Next to each
statement, write the number that best indicates how you feel.
strongly
strongly
disagree
1
2 3 4 5 agree
1. ______
I don't have much control over my emotional reactions to stressful situations.
2. ______
When I'm in a bad mood I find it hard to snap myself out of it.
3. ______
My feelings are usually fairly stable.
4. ______
I can usually talk myself out of feeling bad.
5. ______
No matter what happens to me in my life I am confident of my ability to cope emotionally.
6. ______
I have a number of good techniques that will help me cope with any stressful situation.
7. ______
I find it hard to stop myself from thinking about my problems.
8. ______
If I start to worry about something I can usually distract myself and think about something
nicer.
9. ______
If I realize I am thinking silly thoughts I can usually stop myself.
10. ______
I am usually able to keep my thoughts under control.
11. ______
I imagine there will be many situations in the future where silly thoughts will get the better
of me.
12. ______
I have a number of techniques which I am confident will help me think clearly and
rationally in any situation I might find myself.
13. ______
Even when under pressure I can usually keep calm and relaxed.
14. ______
I have a number of techniques or tricks that I use to stay relaxed in stressful situations.
15. ______
When I'm anxious or uptight there does not seem to be much that I can do to help myself
relax.
16. ______
There is not much I can do to relax when I get uptight.
17. ______
I have a number of ways of relaxing that I am confident will help me cope.
18. ______
If my stress levels get too high I know there are things I can do to help myself.
Pallant, J. (2000). Development and evaluation of a scale to measure perceived control of internal states. Journal of
Personality Assessment, 75 (2), 308-337.
The aim of this exercise is to identify which items to reverse (not to actually carry out the
reversals on the items in the survey.sav data file as these have already been correctly
reversed).

(a) Identify which items in the scale would need to be reversed so that high total scores would
indicate high levels of perceived control.
Items 1, 2, 7, 11, 15, 16 need to be reversed.
As discussed in Chapter 8 of the SPSS Survival Manual the next step is to calculate total
scores by adding together the items that make up each scale. The following two exercises give
you some practice with this process.
3.4 Use the procedures covered in Chapter 8 to create (using Compute) the following new
total scale scores. Create new total subscale scores for the Perceived Control of Internal States
scale (this scale is shown above).
(a) To calculate the Emotion subscale, add items pc1 to pc6. Call this new variable pcemot.
(b) To calculate the Thoughts subscale, add items pc7 to pc12. Call this new variable pcthou.
(c) To calculate the Physical subscale, add items pc13 to pc18. Call this new variable pcphys.
Check the descriptive statistics (mean, standard deviation, minimum, maximum) for your new
subscales.
3.5 In this exercise a variable with eight different responses will be recoded into another
variable which has only two possible values. The variable you will be using is marital status.
The question in the questionnaire used to collect this information is shown below.
What is your marital status? (please tick whichever applies)
1. single
2. in a steady relationship
3. living with partner
4. married for first time
5. remarried
6. separated
7. divorced
8. widowed
Open the survey.sav data file.
(a) Run Frequencies on the variable marital status (marital) to find out how many people fall
into each of the categories.
marital status
105
23.9
23.9
23.9
37
8.4
8.4
32.3
37
8.4
8.4
40.8
189
43.1
43.1
83.8
30
6.8
6.8
90.7
10
2.3
2.3
92.9
24
5.5
5.5
98.4
7
1.6
1.6
100.0
439
100.0
100.0
SINGLE
STEADY RELATIONSHIP
LIVING WITH PARTNER
MARRIED FIRST TIME
REMARRIED
SEPARATED
DIVORCED
WIDOWED
Total
Valid
Frequency
Percent
Valid Percent
Cumulative
Percent

(b) Follow the instructions in Chapter 8 to create a new variable (relship) from the variable in
the data file (marital). The new variable will only have two values, indicating whether a
person is or is not in a relationship.
• In the first group include people who are not in a relationship (single, separated,
divorced, widowed). These will be coded 1.
• In the second group include people who are in a relationship (steady relationship,
living with partner, married for the first time, remarried). These will be coded 2.
(c) Run Frequencies on the new variable (relship) and compare this with the results of the
Frequencies on the original variable (marital). Are there the correct number of cases in each
of the new groups?
relship
146
33.3
33.3
33.3
293
66.7
66.7
100.0
439
100.0
100.0
1
2
Total
Valid
Frequency
Percent
Valid Percent
Cumulative
Percent
Checking the reliability of a scale
If you use scales or standardized measures in your research (this is common in psychological
research) it is important to assess the reliability (internal consistency) of the scores on the
scale in your sample. The following exercise gives you some practice in this process.
3.6 Follow the procedure in Chapter 9 of the SPSS Survival Manual to assess the reliability of
the following scales.
(a) Optimism scale (op1 to op6)
Reliability Statistics
.797
6
Cronbach's Alpha
N of Items
In this sample the Optimism Scale shows adequate internal consistency with a Cronbach
alpha value of .80 (rounded to 2 decimal places).
(b) Perceived Control of Internal States Scale (pc1 to pc18)
Reliability Statistics
.901
18
Cronbach's Alpha
N of Items
In this sample the Perceived Control of Internal States Scale shows good internal
consistency with a Cronbach alpha value of .90.

(c) Self-esteem scale (sest1 to sest10)
Reliability Statistics
.854
10
Cronbach's Alpha
N of Items
In this sample the Self esteem Scale shows good internal consistency with a Cronbach
alpha value of .85.
Choosing the right statistic
Many students find it difficult to identify which statistical technique to use to address their
research questions. Chapter 10 of the SPSS Survival Manual will help you with this process.
3.7 For each of the following research situations identify which statistical technique could be
used.
(a) Ann is interested in exploring the possibility of gender differences in levels of perceived
stress.
Independent samples t-test
(b) Ann would also like to explore the relationship between optimism and perceived stress.
She suspects that higher levels of optimism would be associated with lower levels of
perceived stress.
Correlation
(c) Bill is interested in exploring the effect of both sex and age group on self-esteem scores.
He is interested in the effect of each variable individually, and any interaction that may exist.
Two way ANOVA
(d) Celia would like to know which is a better predictor of negative affect: optimism or self-
esteem.
Multiple Regression
(e) If Celia were also concerned that age may be a confounding variable, how would she go
about controlling for this variable in the analyses?
Hierarchical multiple regression
(f) David is interested in the question: Are younger people (18-29yrs) more likely to be
smokers than older people (30-44yrs or 45+yrs)?
Chi-square test of independence
(g) Ellie conducts a study to find out if there is a significant change in depression levels
across three time periods (prior to an intervention, after the intervention and at a three-month
follow-up).
One way repeated measures ANOVA

3.8 Review each of the situations listed in Exercise 3.7 and consider what non-parametric
technique you would use if it was not appropriate to use a parametric test. (Hint: Not all will
have a non-parametric alternative.)
Parametric alternatives:
(a) Mann Whitney test
(b) Spearman Rank Order Correlation
(c) No non-parametric alternative
(d) No non-parametric alternative
(e) No non-parametric alternative
(f) Chi-square test for independence
(g) Friedman test
Wyszukiwarka
Podobne podstrony:
05 PRELIMINARY ANALYSES
Preliminary Analysis of the Botany, Zoology, and Mineralogy of the Voynich Manuscript
Marketer s Toolkit (05) Competitive Analysis Understand Your Opponents(Harvard Business School HBS
eim3 05 answer
eim2 05 answers
N American Literatyre analysis 8 05 2010 (Moby Dick)
Answer MKF 2002 05 06 Destroyer ORP Kujawiak
N American Literatyre analysis 8 05 2010 (Moby Dick)
N am lit analysis (Huck Finn) 22 05 2010
nef elem filetest 05 answerkey
EF3e int filetest 05 answerkey
podrecznik 2 18 03 05
regul praw stan wyjątk 05
GbpUsd analysis for July 06 Part 1
05 Badanie diagnostyczneid 5649 ppt
Podstawy zarządzania wykład rozdział 05
05 Odwzorowanie podstawowych obiektów rysunkowych
więcej podobnych podstron