
1
ANSWERS TO EXERCISES AND REVIEW
QUESTIONS
PART FOUR: STATISTICAL TECHNIQUES TO EXPLORE RELATIONSHIPS
AMONG VARIABLES
You should review the material in the introduction to Part Four and in Chapters 11, 12, 13, 14
and 15 of the SPSS Survival Manual before attempting these exercises.
Correlation
4.1 Using the data file survey.sav follow the instructions in Chapter 11 to explore the
relationship between the total mastery scale (measuring control) and life satisfaction (tlifesat).
Present the results in a brief report.
Correlations
1
.444**
.000
436
436
.444**
1
.000
436
436
Pearson Correlation
Sig. (2-tailed)
N
Pearson Correlation
Sig. (2-tailed)
N
tlifesat total life satisfaction
tmast total mastery
tlifesat total
life satisfaction
tmast total
mastery
Correlation is significant at the 0.01 level (2-tailed).
**.
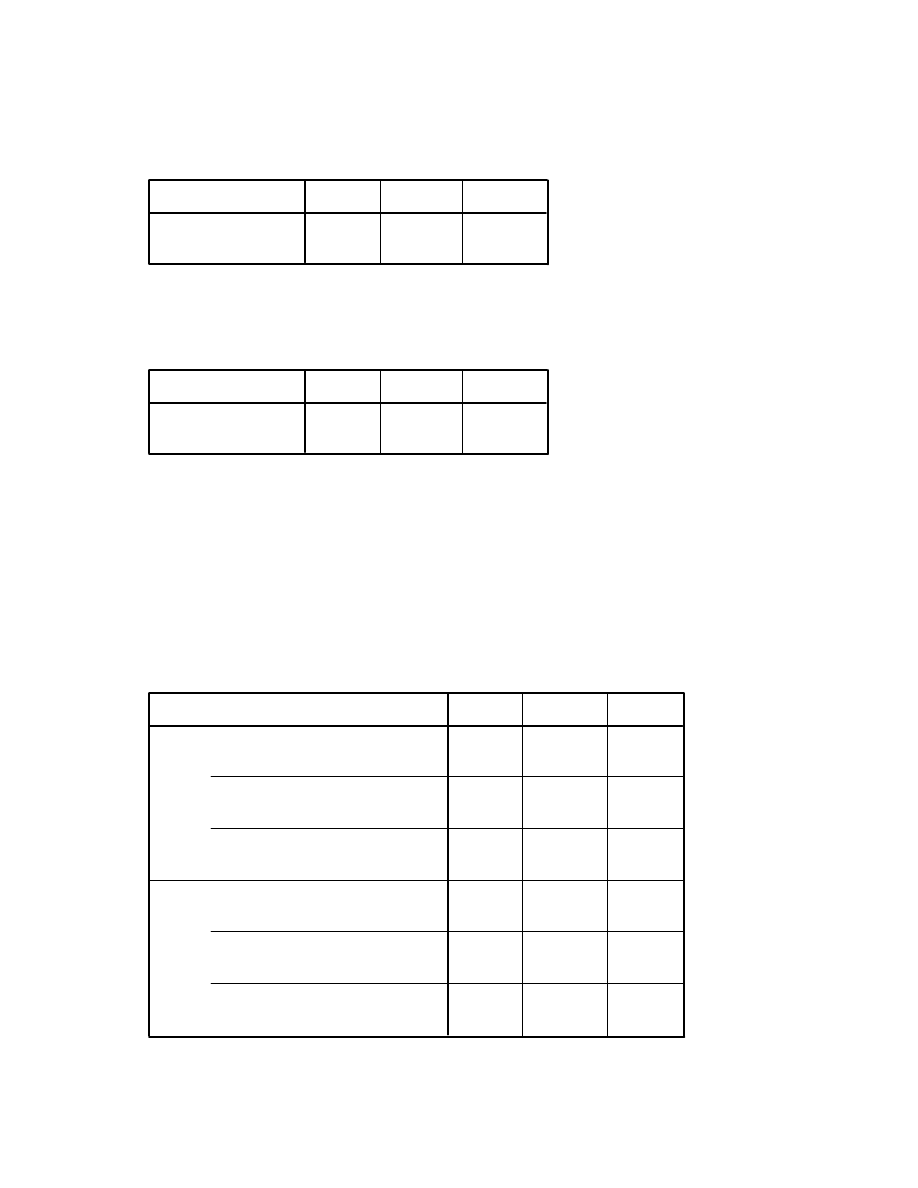
The relationship between mastery and life satisfaction was explored using Pearson’s product
moment correlation. There was a moderate positive correlation (r=.44, p<.0001) suggesting
that people who felt they had control over their lives had higher levels of life satisfaction.
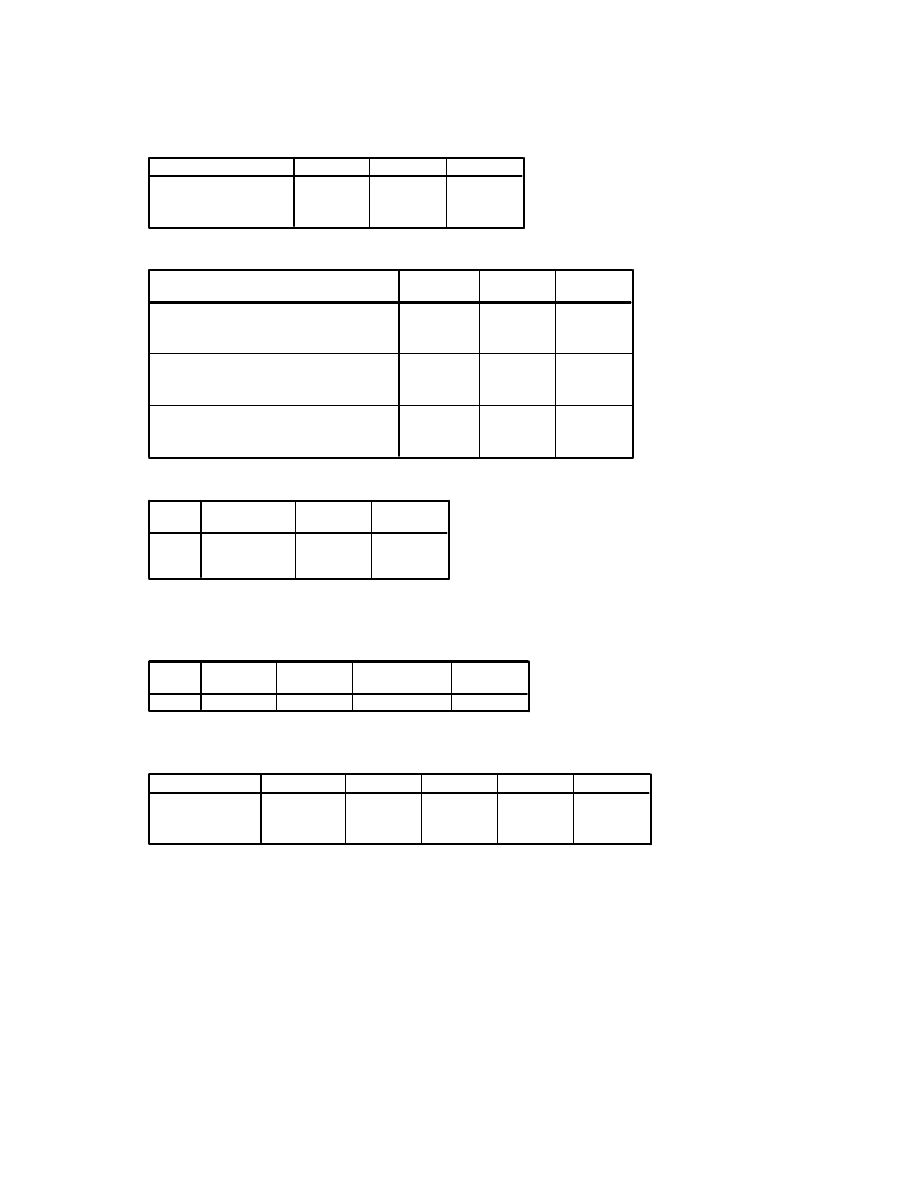
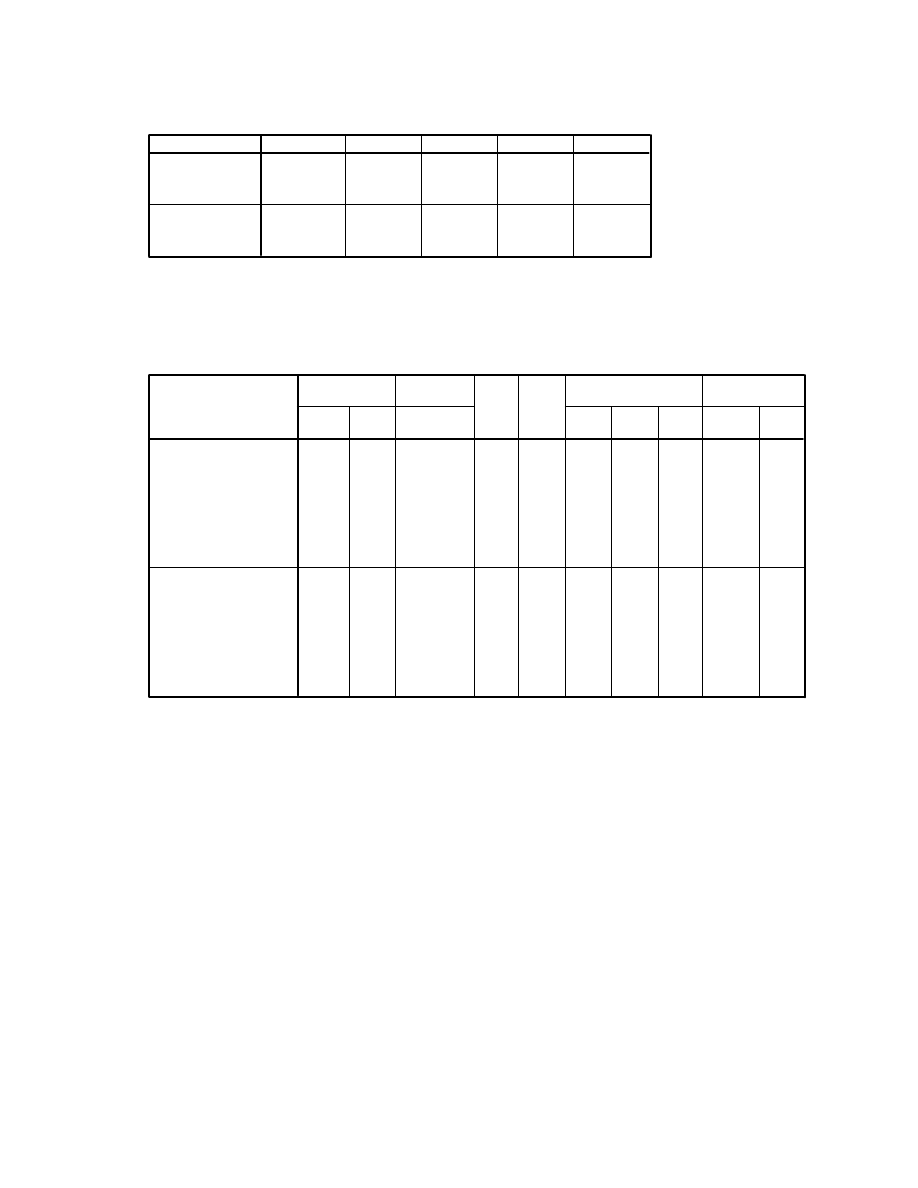
4.2 Use the instructions in Chapter 11 to generate a full correlation matrix to check the
intercorrelations among the following variables.
(a) age
(b) perceived stress (tpstress)
(c) positive affect (tposaff)
(d) negative affect (tnegaff)
(e) life satisfaction (tlifesat)

2
Correlations
1
-.127**
.069
-.171**
.059
.008
.150
.000
.222
439
433
436
435
436
-.127**
1
-.442**
.674**
-.494**
.008
.000
.000
.000
433
433
433
432
433
.069
-.442**
1
-.294**
.415**
.150
.000
.000
.000
436
433
436
435
436
-.171**
.674**
-.294**
1
-.316**
.000
.000
.000
.000
435
432
435
435
435
.059
-.494**
.415**
-.316**
1
.222
.000
.000
.000
436
433
436
435
436
Pearson Correlation
Sig. (2-tailed)
N
Pearson Correlation
Sig. (2-tailed)
N
Pearson Correlation
Sig. (2-tailed)
N
Pearson Correlation
Sig. (2-tailed)
N
Pearson Correlation
Sig. (2-tailed)
N
age
tpstress total
perceived stress
tposaff total
positive affect
tnegaff total
negative affect
tlifesat total life
satisfaction
age
tpstress total
perceived stress
tposaff total
positive affect
tnegaff total
negative affect
tlifesat total
life satisfaction
Correlation is significant at the 0.01 level (2-tailed).
**.
4.3 Gill, a researcher, is interested in exploring the impact of age on the experience of positive
affect (tposaff), negative affect (tnegaff) and perceived stress (tpstress).
(a) Follow the instructions in Chapter 11 of the SPSS Survival Manual to generate a
condensed correlation matrix which presents the correlations between age with positive affect,
negative affect and perceived stress.
Correlations
.069
-.171**
-.127**
.150
.000
.008
436
435
433
Pearson Correlation
Sig. (2-tailed)
N
age
tposaff total
positive affect
tnegaff total
negative affect
tpstress total
perceived stress
Correlation is significant at the 0.01 level (2-tailed).
**.
(b) Repeat the analysis in (a), but first split the sample by sex. Compare the pattern of
correlations for males and females. Remember to turn off the Split File option after you have
finished this analysis.
3
Correlations
sex sex = MALES
Correlations
a
.061
-.123
-.186*
.406
.095
.012
185
185
184
Pearson Correlation
Sig. (2-tailed)
N
age
tposaff total
positive affect
tnegaff total
negative affect
tpstress total
perceived stress
Correlation is significant at the 0.05 level (2-tailed).
*.
sex sex = MALES
a.
sex sex = FEMALES
Correlations
a
.073
-.208**
-.100
.246
.001
.115
251
250
249
Pearson Correlation
Sig. (2-tailed)
N
age
tposaff total
positive affect
tnegaff total
negative affect
tpstress total
perceived stress
Correlation is significant at the 0.01 level (2-tailed).
**.
sex sex = FEMALES
a.
Partial correlation
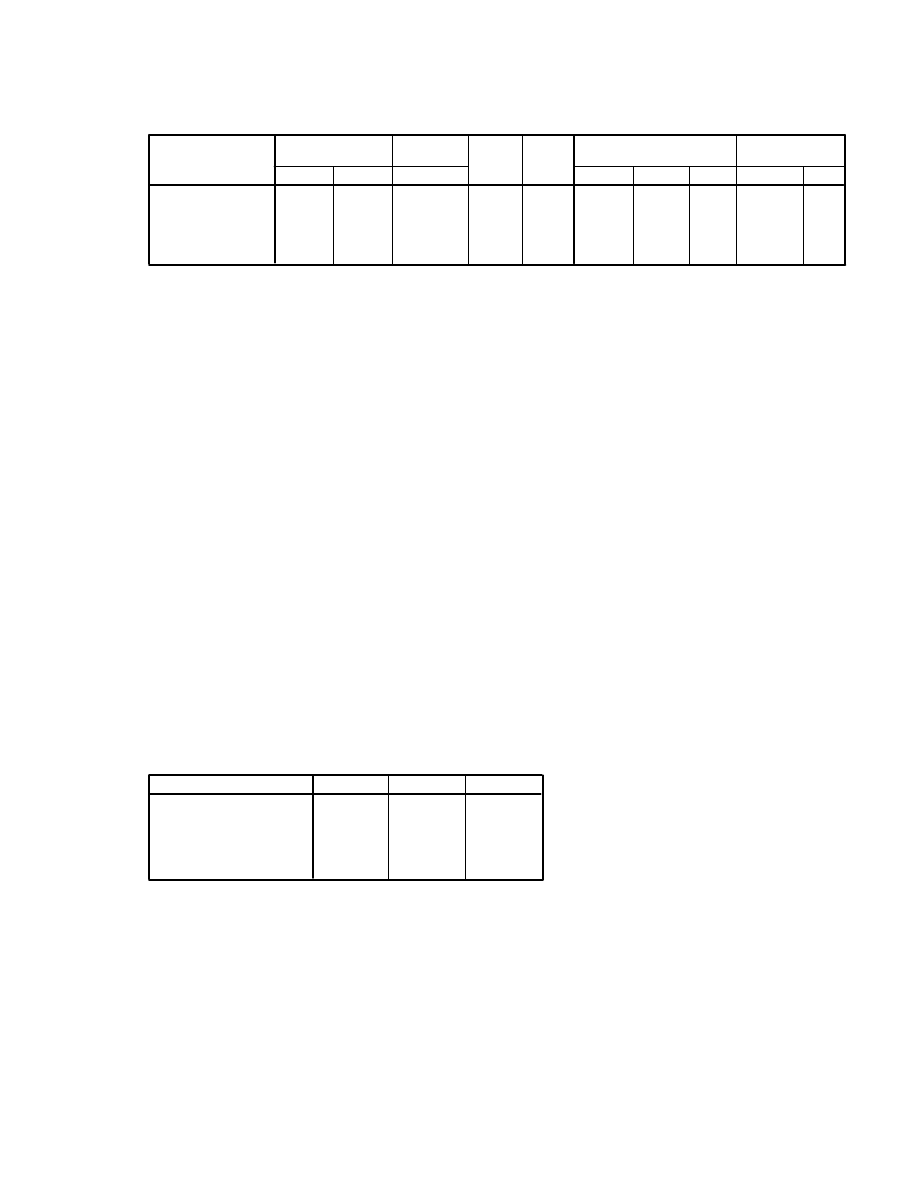
4.4 Follow the procedures detailed in Chapter 12 of the SPSS Survival Manual to calculate the
partial correlation between optimism (toptim) and perceived stress (tpstress) while controlling
for the effects of age. Compare the zero order correlations with the partial correlation
coefficients to see if controlling for age had any effect.
Correlations
1.000
-.469
.201
.
.000
.000
0
430
433
-.469
1.000
-.127
.000
.
.008
430
0
431
.201
-.127
1.000
.000
.008
.
433
431
0
1.000
-.456
.
.000
0
429
-.456
1.000
.000
.
429
0
Correlation
Significance (2-tailed)
df
Correlation
Significance (2-tailed)
df
Correlation
Significance (2-tailed)
df
Correlation
Significance (2-tailed)
df
Correlation
Significance (2-tailed)
df
Correlation
Significance (2-tailed)
df
toptim total optimism
tpstress total
perceived stress
age
toptim total optimism
tpstress total
perceived stress
age
Control
Variables
-none-
a
age
toptim total
optimism
tpstress total
perceived stress
age
Cells contain zero-order (Pearson) correlations.
a.

4
The zero order correlation (not controlling for age) is -.469 indicating a moderate negative
correlation between optimism and levels of perceived stress. The partial correlation
coefficient (controlling for the effects of age) is -.456, which is only slightly lower. This
indicates that the relationship between optimism and perceived stress is not influenced by
age.
Multiple regression
4.5 There are three main types of multiple regression analyses. What are they? When would
you use each approach?
Standard multiple regression
In standard multiple regression all the independent (or predictor) variables are entered into the
equation simultaneously. Each independent variable is evaluated in terms of its predictive
power, over and above that offered by all the other independent variables. This approach would
be used if you had a set of variables (e.g., various personality scales) and wanted to know how
much variance in a dependent variable (e.g., anxiety) they were able to explain as a group or
block. This approach would also tell you how much unique variance in the dependent variable
that each of the independent variables explained.
Hierarchical multiple regression
In hierarchical regression (also called sequential) the independent variables are entered into
the equation in the order specified by the researcher based on theoretical grounds. Variables or
sets of variables are entered in steps (or blocks), with each independent variable being assessed
in terms of what it adds to the prediction of the dependent variable, after the previous variables
are controlled for. For example, if you wanted to know how well optimism predicts life
satisfaction, after the effect of age is controlled for, you would enter age in Block 1 and then
Optimism in Block 2. Once all sets of variables are entered, the overall model is assessed in
terms of its ability to predict the dependent measure. The relative contribution of each block of
variables is also assessed.
Stepwise multiple regression
In stepwise regression the researcher provides SPSS with a list of independent variables and
then allows the program to select which variables it will enter, and in which order they go into
the equation, based on a set of statistical criteria. This would be used when you have a large
number of predictor variables, and no underlying theory concerning their possible predictive
power.
4.7 As part of the preliminary screening process it is recommended that you inspect the
Mahalanobis distances produced by SPSS. What do these tell you?
The Mahalanobis distances produced by SPSS can be used to detect the presence in your
datafile of multivariate outliers, people with a strange set of scores on your predictor
variables.
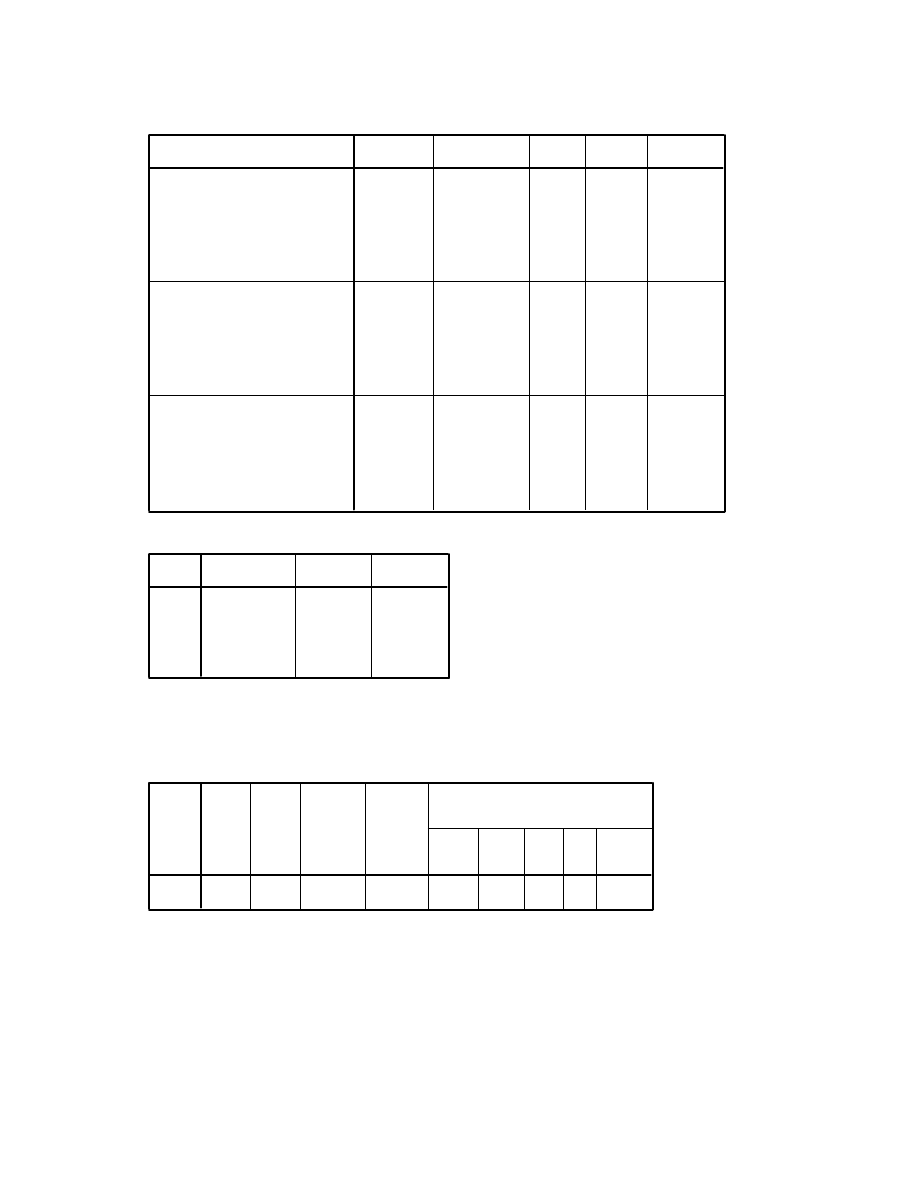
4.8 The example used in the SPSS Survival Manual to demonstrate the use of standard
multiple regression compares two control measures (PCOISS and Mastery) in terms of their
ability to predict perceived stress. Repeat this analysis, this time using life satisfaction
(tlifesat) as your dependent variable. Use the output to answer the following questions.
5
Regression
Descriptive Statistics
22.38
6.770
436
60.63
11.985
430
21.764
3.9696
436
tlifesat total life satisfaction
tpcoiss total PCOISS
tmast total mastery
Mean
Std. Deviation
N
Correlations
1.000
.373
.444
.373
1.000
.521
.444
.521
1.000
.
.000
.000
.000
.
.000
.000
.000
.
436
429
436
429
430
429
436
429
436
tlifesat total life satisfaction
tpcoiss total PCOISS
tmast total mastery
tlifesat total life satisfaction
tpcoiss total PCOISS
tmast total mastery
tlifesat total life satisfaction
tpcoiss total PCOISS
tmast total mastery
Pearson Correlation
Sig. (1-tailed)
N
tlifesat total
life satisfaction
tpcoiss total
PCOISS
tmast total
mastery
Variables Entered/Removed
b
tmast total
mastery, tpcoiss
total PCOISS
a
. Enter
Model
1
Variables Entered
Variables
Removed
Method
All requested variables entered.
a.
Dependent Variable: tlifesat total life satisfaction
b.
Model Summary
.474
a
.225
.221
5.975
Model
1
R
R Square
Adjusted R Square
Std. Error of
the Estimate
Predictors: (Constant), tmast total mastery, tpcoiss total PCOISS
a.
ANOVA
b
4407.034
2
2203.517
61.729
.000
a
15206.737
426
35.697
19613.771
428
Regression
Residual
Total
Model
1
Sum of Squares
df
Mean Square
F
Sig.
Predictors: (Constant), tmast total mastery, tpcoiss total PCOISS
a.
Dependent Variable: tlifesat total life satisfaction
b.
6
Coefficients
a
2.997
1.774
1.690
.092
.110
.028
.195
3.903
.000
.373
.186
.166
.729
1.372
.584
.085
.342
6.850
.000
.444
.315
.292
.729
1.372
(Constant)
tpcoiss total
PCOISS
tmast total
mastery
Model
1
B
Std. Error
Unstandardized
Coefficients
Beta
Standardized
Coefficients
t
Sig.
Zero-order
Partial
Part
Correlations
Tolerance
VIF
Collinearity
Statistics
Dependent Variable: tlifesat total life satisfaction
a.
(a) Overall, how much of the variance in life satisfaction is explained by these two variables?
The R squared value of .225 indicates that 22.5% of the variance in life satisfaction scores is
explained by the two predictor variables (tmast, tpcoiss).
(b) Which of the independent variables (tpcoiss, tmast) is the best predictor of life
satisfaction?
Comparison of the standardized coefficient values (beta) indicates that the tmast (beta=.342)
is a stronger predictor of life satisfaction than tpcoiss (beta=.195).
(c) Do both variables make a statistically significant contribution to the prediction of life
satisfaction?
The probability values (shown in the Sig. Column) are both less than .05, indicating that both
predictors make a significant contribution to the equation.
4.9 Follow the instructions in the SPSS Survival Manual to perform a hierarchical multiple
regression, this time using life satisfaction as the dependent variable.
Regression
Descriptive Statistics
22.38
6.770
436
5.30
2.042
433
37.44
13.202
439
21.764
3.9696
436
60.63
11.985
430
tlifesat total life satisfaction
tmarlow total social desirability
age
tmast total mastery
tpcoiss total PCOISS
Mean
Std. Deviation
N
7
Correlations
1.000
.108
.059
.444
.373
.108
1.000
.268
.154
.295
.059
.268
1.000
-.036
.248
.444
.154
-.036
1.000
.521
.373
.295
.248
.521
1.000
.
.012
.111
.000
.000
.012
.
.000
.001
.000
.111
.000
.
.226
.000
.000
.001
.226
.
.000
.000
.000
.000
.000
.
436
431
436
436
429
431
433
433
431
427
436
433
439
436
430
436
431
436
436
429
429
427
430
429
430
tlifesat total life
satisfaction
tmarlow total social
desirability
age
tmast total mastery
tpcoiss total PCOISS
tlifesat total life
satisfaction
tmarlow total social
desirability
age
tmast total mastery
tpcoiss total PCOISS
tlifesat total life
satisfaction
tmarlow total social
desirability
age
tmast total mastery
tpcoiss total PCOISS
Pearson
Correlation
Sig. (1-tailed)
N
tlifesat total
life satisfaction
tmarlow total
social desirability
age
tmast total
mastery
tpcoiss total
PCOISS
Variables Entered/Removed
b
age, tmarlow
total social
desirability
a
. Enter
tmast total
mastery, tpcoiss
total PCOISS
a
. Enter
Model
1
2
Variables Entered
Variables
Removed
Method
All requested variables entered.
a.
Dependent Variable: tlifesat total life satisfaction
b.
Model Summary
.113
a
.013
.008
6.742
.013
2.724
2
424
.067
.475
b
.225
.218
5.986
.213
57.911
2
422
.000
Model
1
2
R
R
Square
Adjusted R
Square
Std. Error
of the
Estimate
R
Square
Change
F
Change
df1
df2
Sig. F
Change
Change Statistics
Predictors: (Constant), age, tmarlow total social desirability
a.
Predictors: (Constant), age, tmarlow total social desirability, tmast total mastery, tpcoiss
total PCOISS
b.
8
ANOVA
c
247.684
2
123.842
2.724
.067
a
19274.435
424
45.459
19522.118
426
4398.524
4
1099.631
30.683
.000
b
15123.595
422
35.838
19522.118
426
Regression
Residual
Total
Regression
Residual
Total
Model
1
2
Sum of Squares
df
Mean Square
F
Sig.
Predictors: (Constant), age, tmarlow total social desirability
a.
Predictors: (Constant), age, tmarlow total social desirability, tmast total mastery, tpcoiss
total PCOISS
b.
Dependent Variable: tlifesat total life satisfaction
c.
Coefficients
a
20.011
1.163
17.204
.000
.331
.166
.100
1.994
.047
.108
.096
.096
.928
1.077
.016
.026
.032
.636
.525
.059
.031
.031
.928
1.077
2.652
1.917
1.384
.167
-.026
.152
-.008
-.170
.865
.108
-.008
-.007
.871
1.148
.014
.024
.027
.579
.563
.059
.028
.025
.860
1.163
.594
.087
.348
6.795
.000
.444
.314
.291
.699
1.432
.106
.030
.188
3.489
.001
.373
.167
.149
.635
1.574
(Constant)
tmarlow total
social desirability
age
tmast total
mastery
tpcoiss total
PCOISS
(Constant)
tmarlow total
social desirability
age
tmast total
mastery
tpcoiss total
PCOISS
Model
1
2
B
Std.
Error
Unstandardized
Coefficients
Beta
Standardized
Coefficients
t
Sig.
Zero-or
der
Partial
Part
Correlations
Tolerance
VIF
Collinearity
Statistics
Dependent Variable: tlifesat total life satisfaction
a.
9
Factor analysis
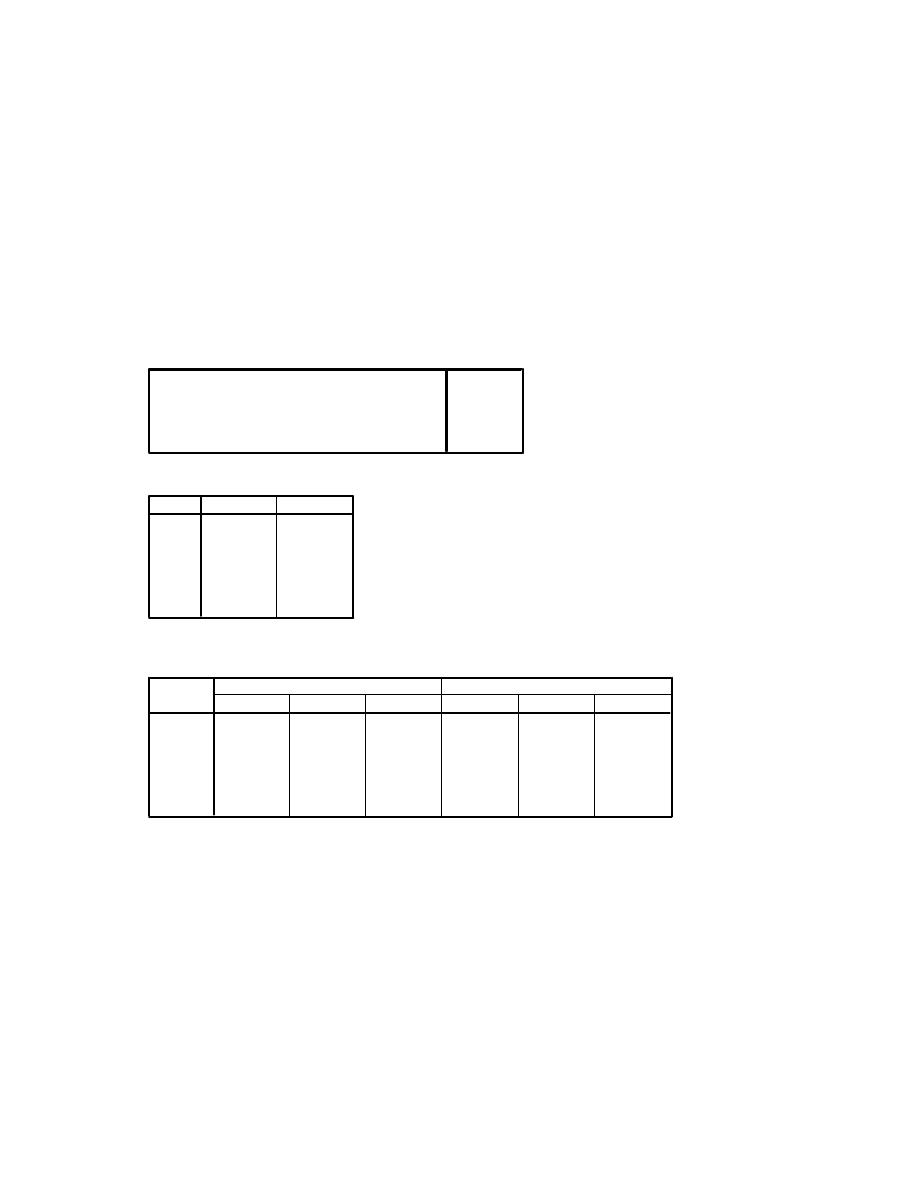
4.10 There is some controversy in the literature concerning the underlying factor structure of
one of the scales included in the questionnaire presented in the appendix of the SPSS Survival
Manual. The Optimism scale was originally designed as a one-dimension (factor) scale which
included some positively worded items and some negatively worded items. Recent studies
suggest that it may in fact consist of two factors representing optimism and pessimism.
Conduct a factor analysis using the instructions presented in Chapter 15 to explore the factor
structure of the optimism scale (op1 to op6).
KMO and Bartlett's Test
.808
720.478
15
.000
Kaiser-Meyer-Olkin Measure of Sampling Adequacy.
Approx. Chi-Square
df
Sig.
Bartlett's Test of Sphericity
Communalities
1.000
.357
1.000
.538
1.000
.424
1.000
.641
1.000
.537
1.000
.501
op1
op2
op3
op4
op5
op6
Initial
Extraction
Extraction Method: Principal Component Analysis.
Total Variance Explained
2.998
49.966
49.966
2.998
49.966
49.966
.867
14.458
64.424
.670
11.161
75.584
.634
10.573
86.157
.463
7.709
93.866
.368
6.134
100.000
Component
1
2
3
4
5
6
Total
% of Variance
Cumulative %
Total
% of Variance
Cumulative %
Initial Eigenvalues
Extraction Sums of Squared Loadings
Extraction Method: Principal Component Analysis.
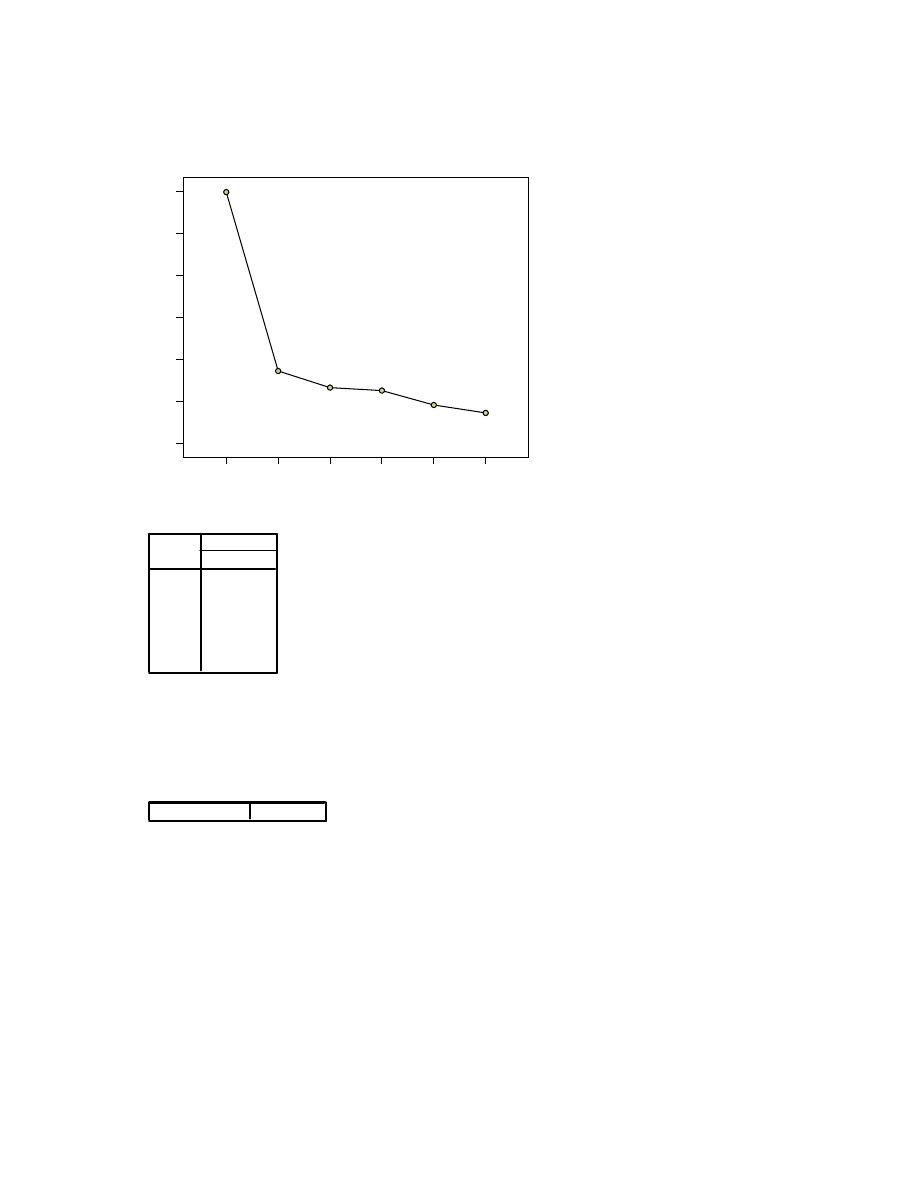
10
1
2
3
4
5
6
Component Number
0.0
0.5
1.0
1.5
2.0
2.5
3.0
Eigen
value
Scree Plot
Component Matrix
a
.801
.733
.733
.708
.651
.597
op4
op2
op5
op6
op3
op1
1
Component
Extraction Method: Principal Component Analysis.
1 components extracted.
a.
Rotated Component Matrix
a
Dummy category
Only one component was extracted.
The solution cannot be rotated.
a.
Wyszukiwarka
Podobne podstrony:
07 AI Techniques in Games
06 STATISTICAL TECHNIQUES
07 Rysunek techniczny elektryczny
o1 07 u metrologia techniczna 311[32]
07.10.12r. - Wykład -Taktyka i technika interwencji policyjnych i samoobrona, Sudia - Bezpieczeństwo
07 U podstaw cywiliacji technicznej
101 veterinary technician questions answered
zadania egzaminacyjne zaoczne 2006 07 (PTM), elektro, 1, Podstawy Techniki Mikroprocesorowej
Test pisemny dla zawodu technik hotelarstwa Egzamin potwierdzający kwalifikacje zawodowe cz II c
Technika biurowa, 07-tech, 2
00 Program nauki Technik elektronik 311 07
07 Stosowanie podstawowych technik wytwarzania części
eim2 07 answers
Informator techniczny Woodhead 07
Test pisemny dla zawodu technik hotelarstwa Egzamin potwierdzający kwalifikacje zawodowe czerwca 0
Mlody Technik 07 2010
BN 6738 07 1962 Beton hydrotechniczny Wymagania techniczne
więcej podobnych podstron