
PRZEGLĄD ELEKTROTECHNICZNY (Electrical Review), ISSN 0033-2097, R. 86 NR 12/2010 319
Jiefeng XIONG
1,2
,Bolin WANG
1
Hohai University (1), Nanjing University of Information Science and Technology (2)
Measuring power system harmonics and interharmonics by
envelope spectrum analysis
Abstract. An envelope spectrum analysis-based algorithm for harmonics and interharmonics estimation is proposed. First the envelope is extracted
with narrow band Hilbert transform. Then the spectrum of the envelope and the harmonic components are calculated with windowing and
interpolation method. Finally the interharmonic parameters are restored according to amplitude modulation equation. The proposed method has two
distinguish features, first, it is able to confirm if the calculated interharmonic components do exist, and second, it is not affected by the spectral
leakage caused from the harmonics. Several simulation examples are given to demonstrate the precision, effectiveness, and feasibility.
Abstract. Zaproponowano algorytm analizy widmowej umożliwiający określanie składowych harmonicznych. Najpierw wydzielana jest obwiednia
przy wykorzystaniu wąskopasmowej transformaty Hilberta. Następnie obliczane jest widomo obwiedni i składowych harmonicznych metodami
interpolacyjnymi. Wreszcie parametry interharmonicznych są odtwarzane na podstawie równania modulacji amplitudowej. Zaproponowana metoda
ma dwie istotne zalety – umożliwia obliczanie składowych interharmonicznych i nie jest obciążona wpływem przecieku od harmonicznych.
Zaprezentowano kilka przykładów symulacji potwierdzających skuteczność metody. (Pomiary harmonicznych i interharmonicznych w
systemach mocy metodą analizy spektralnej obwiedni).
Keywords: harmonic analysis, interharmonic, envelope extraction, discrete Fourier transforms, spectral leakage.
Słowa kluczowe: analiza widmowa, wydzielanie obwiedni, Dyskretna Transformata Fouriera.
Introduction
Accurate harmonic/interharmoincs analysis and
measurement in electrical power systems are of particular
importance, since a true and exact spectrum of a waveform
provides a clear understanding of the causes and effects of
waveform distortion.
The most popular and effective algorithm for harmonics
and interharmonics measurement is windowed discrete
Fourier transform (DFT). When interharmonics are present,
the direct application of the DFT with a constant sampling
rate may lead to inaccurate measurement results due to the
spectral leakage and picket fence effects[1-3]. These
effects strongly increase difficulties in measuring
interharmonics, which can even ‘create’ new interharmonic
components (fake interharmonics) in the spectrum that do
not exist at all[4].
Various methods have been proposed to overcome these
effects, especially the spectral leakage effect to obtain
better estimates of the power harmonics or interharmonics.
References [5-8] put forward methods based on windowing
and interpolation in the frequency domain, in which the
errors created by leakage are eliminated by windowing
technique, and the errors by picket effects are reduced by
the interpolation algorithm. A desynchronized processing
technique was employed for harmonic and interharmonic
analysis, in which harmonics are filtered out from the signal
to obtain better estimates of the interharmonics [9]. An
adaptive window width method based on correlation
calculation can be found in [10], and claimed suffering no
leakage effect. In [11], the time-domain averaging was used
for harmonic processing, and then a difference filter for the
improved detection of interharmonics was proposed.
Interharmonic-subgroups were recommend by the IEC
group to reduce the spectral leakage problem, which aims
at standardization, simplification and unification, more
details can be found in [12-13].
Anyway, it is well known that a through solution for the
problems due to the DFT spectral leakage is to select
window width as an exact multiple of all signal periods,
which is called the synchronization of the sampling
procedure. However synchronizing to interharmoics is
practically infeasible because their frequencies are usually
unpredictable or the necessary window width is too large.
Reference [14] uses wavelets for spectral estimation to
reduce the spectral leakage problem. Modern signal
processing technique based on advanced spectrum
estimation were also used for harmonic and interharmonic
analysis, which theoretically has an infinitely frequency
resolution, and their improvements can be found in [15-17].
Whereas, spectrum estimation methods operate effectively
only on the narrow-band signal in frequency domain which
has limited components. Moreover, the computational
burden may result sensibly increased when high accuracy
is required.
In this paper an envelope spectrum analysis-based
method is proposed for interharmonics estimation of
signals. The proposed method focuses on the point that the
envelope of the power system signal contains information
for interharmonic estimation. The method extracts the
envelope of the signal, calculates its spectrum, and then
restores the interharmonic parameters according to
amplitude modulation equation. It is shown that the effects
(or fake interharmonics), caused by the spectral leakage
from harmonics, can be avoided with the proposed method.
The new method benefits higher computing speed and
more stable than advanced spectrum estimation-based
method, and more accurate than traditional DFT-based
method.
The organization of this paper is as follows. The
relationship between interharmonics, voltage fluctuation and
voltage flicker are recalled in section II. The interharmonics
measurement method based on envelope spectrum
analysis is proposed in section III. Then, simulation results
to demonstrate the precision, feasibility and robustness of
the algorithm are presented in section IV. At last the
conclusions are given in section V.
Interharmonics, voltage fluctuation and voltage flicker
Interharmonics, voltage fluctuation and voltage flicker
have an inherent relationship. At steady state without any
disturbance, the voltage waveform in a power system is
sinusoidal with constant amplitude. When a voltage
waveform contains interharmonics (generated from the
operation of fluctuating loads), the peak and RMS
magnitudes of the waveform will fluctuate. This is because
the periods of the interharmonics components are not
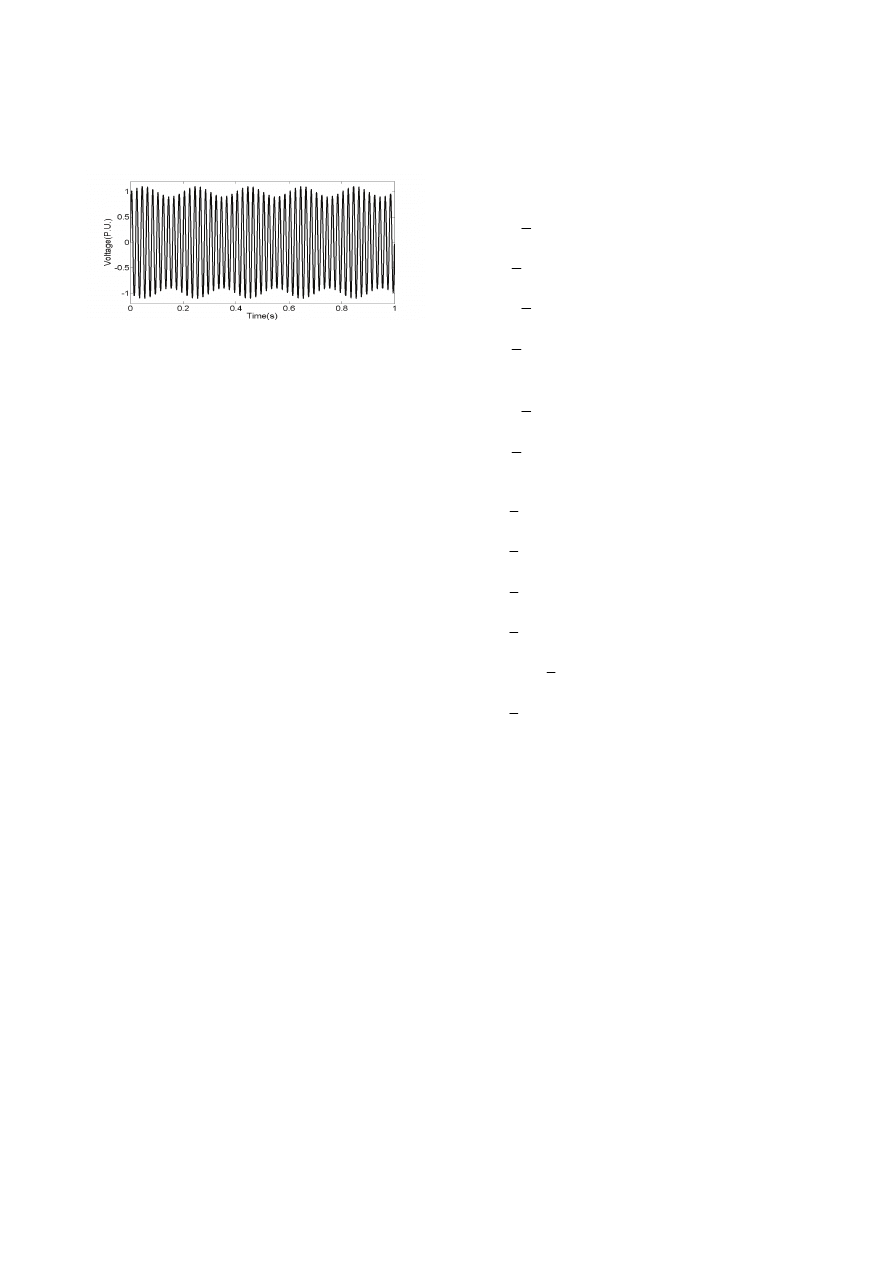
synchronous with the fundamental frequency cycle. Figure
1 shows the waveform of
320 PRZEGLĄD ELEKTROTECHNICZNY (Electrical Review), ISSN 0033-2097, R. 86 NR 12/2010
(1)
( ) sin 2 50
0.05sin 2 45
/ 2
0.05sin 2 55
/ 2
y t
t
t
t
It contains a fundamental component (50Hz) and two
interharmonics (45Hz and 55Hz), and its envelope appears
with a noticeable 5Hz fluctuation.
Fig. 1. Amplitude modulation voltage waveform caused by
interharmonics
If the fluctuation magnitude is sufficiently large and the
fluctuation frequency is in a range perceptible by human
eyes (0.5 to 30Hz), a light flicker will occur. Consequently, a
conclusion can be drawn that if there are interharmincs in
the signal, a voltage flicker or a modulation of the voltage
waveform will occur, and vice versa.
It should be mentioned that the summations of one or
more small interharmonics to fundmental frequency can
always be interpreted in terms of amplitude modulation and
phase modulation [18]. However, the most traditional
approach to study the voltage flicker (voltage fluctuation) is
based on amplitude modulation [19] and a voltage with an
amplitude modulation can be described as
(2)
1
1
1
( )
1
( )
sin 2
y t
d t A
f t
where d(t) is the ‘envelope’(modulating signal), A
1
, f
1
,and
Φ
1
are the fundamental amplitude, frequency, and phase of
the system individually.
Due to the load characteristics, d(t) can be cyclic, such
as operation of a reciprocation pump. And it also can be
stochastic, such as operating electric arc furnaces [20].
With no additional explanation, only periodic modulating
signal is considered in this paper, and d(t) can be
expressed as
(3)
1
( )
sin 2
L
l
l
l
d t
D
l
t
where D
l
and θ
l
are amplitude and phase of the lth
harmonic component of d(t), η is the fundamental frequency
of d(t). It should be noted that although the flicker model (2)
is still needs to be improved, many field measurement
results demonstrate its effectiveness in calculating voltage
flicker and identifying the interharmonic polluters [20-23].
When harmonics are considered, a more complex
model can be expressed as:
(4)
1
1
( )
1
( )
sin 2
M
m
m
m
y t
d t
A
m f t
If we substitute (3) into (4), this will yield
(5)
1
1
1
1
1
( )
sin 2
sin 2
sin 2
M
m
m
m
L
M
l
l
m
m
l
m
y t
A
m f t
D
l
t
A
m f t
1
1
1
1
1
1
sin 2
sin 2
sin 2
M
m
m
m
M
m
m
m
A
m f t
D
t
A
m f t
2
2
1
1
sin 4
sin 2
M
m
m
m
D
t
A
m f t
1
1
sin 2
sin 2
M
L
L
m
m
m
D
L
t
A
m f t
1
1
1 1
1
1
1
1 1
1
1
1
2 1
1
1
2
2 1
1
1
2
1
1
1
1
1
sin 2
1
cos 2
2
1
cos 2
2
1
cos 2
2
2
1
cos 2
2
2
1
cos 2
2
1
cos 2
2
M
m
m
m
L
L
L
L
L
A
m f t
D A
f
t
D A
f
t
D A
f
t
D A
f
t
D A
f
L t
D A
f
L t
1
1
1
1
1
1
2
1
2
2
1
2
1
1
1
cos2
2
1
cos2
2
1
cos2
2
2
1
cos2
2
2
1
cos2
2
1
cos2
2
M
M
M
M
M
M
M
M
L M
M
L
L M
M
L
D A
Mf
t
D A
Mf
t
D A
Mf
t
D A
Mf
t
D A
Mf
L t
D A
Mf
L t
From (5), it can be known that if η is not integral multiple
of f
1
, components with frequency (f
1
±η), (f
1
±2η),…, (f
1
±Lη),
(2f
1
±η), (2f
1
±2η),…(2f
1
±Lη),…(Mf
1
±η) (Mf
1
±2η), … (Mf
1
±Lη)
are all interharmonics. We can also find that the envelope
signal d(t) never changes the amplitude and phase of
harmonic components’, and it only ‘produces’
interharmonics. Note that if Lη< f
1
/2 is also satisfied, each
interharmoic component will appear once in (5), and great
simplification of interharmonic measurement can be
achieved.
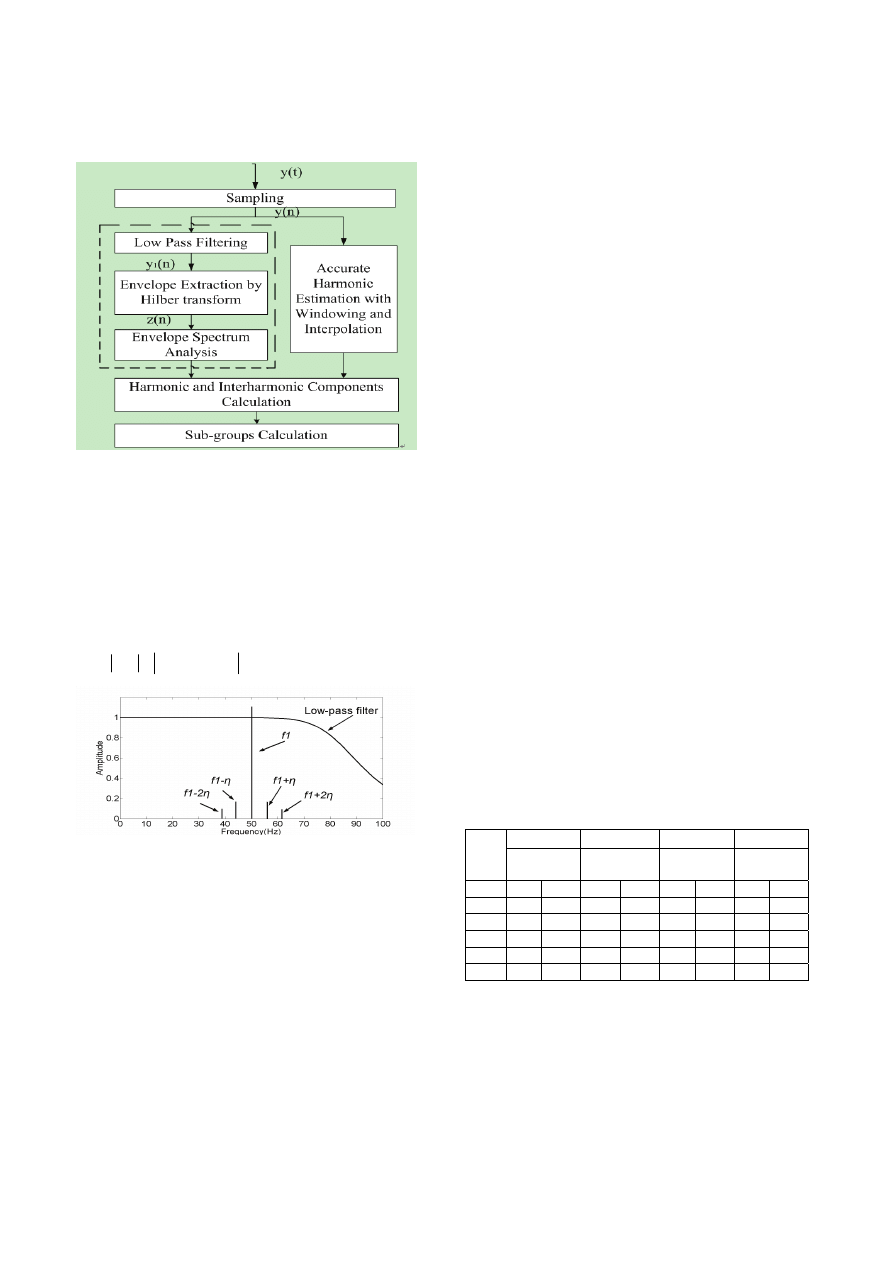
Envelope spectrum analysis-based method
Based on the above discussion, the new measurement
algorithm for power system harmonics and interharmonics
is completely presented with the help of the flowchart
(Figure 2) in this section. The phases of θ
l
and Φ
1
are
assumed to be zero, and this will simplify the calculations
without affecting the interpretation of the algorithm.
The signal y(t) is digitized with equally sampling space T
s
in the sampling block, thus the output of this block is
(6)
1
1
1
( )
1
sin 2
sin 2
L
M
l
s
m
s
l
m
y n
D
l
nT
A
m f nT
The low pass filtering block is composed of a sixth order
Butterworth low-pass filter with an 85Hz cut-off frequency.
The amplitude response of this filter is shown in Figure 3.
PRZEGLĄD ELEKTROTECHNICZNY (Electrical Review), ISSN 0033-2097, R. 86 NR 12/2010 321
This low-pass filter gives a strong attenuation at frequencies
higher than 85Hz. Consequently, the terms of (5) that
include frequencies of (2f
1
±η), (2f
1
±2η),…(2f
1
±Lη),…(Mf
1
±η)
(Mf
1
±2η), … (Mf
1
±Lη) are suppressed. The elimination in (5)
of all these components leads to the following expression:
Fig. 2. Flowchart of the envelope spectrum analysis-based method
(7)
1
1
1
1
( )
1
sin 2
sin 2
L
l
s
s
l
y n
D
l
nT
A
f nT
If Hilbert transform is applied to (7), it yields
(8)
1
1
1
1
ˆ ( )
1
sin 2
cos 2
L
l
s
s
l
y n
D
l
nT
A
f nT
The analytic signal constructed by (7) and (8) is
expressed as
(9)
1
1
ˆ
( )
( )
( )
z n
y n
jy n
And its amplitude takes the following form
(10)
1/ 2
2
2
1
1
1
1
ˆ
( )
( )
( )
1
sin 2
L
l
s
l
z n
y n
y n
A
D
l
nT
Fig. 3. Amplitude response of the low-pass filter
It is important to note that (10) only contains the dc
component and periodic envelope d(n). With DFT based
method, the spectrum of (10) can be obtained, and then the
spectrum of y(t) can be calculated according to (5) if the
parameters of harmonics have been obtained.
The following summarizes major steps of the solution for
harmonic and interharmonics measurement.
1. digitize the estimated signal y(t) with equally sampling
space for nearly S periods, note that window width
should cover at least one period of the envelope and
the synchronous error should be as little as possible.
2. calculate the spectrum of integral harmonics of y(n) with
DFT based algorithm, windowing and interpolation
techniques are recommended in order to improve the
measurement precision. In this paper, Hanning window
is selected because it is characterized by a relatively
narrow main lobe and fast-decaying side lobes.
3. extract modulating signal d(n) from y(n), this can be
accomplished by filter, Wavelet transform and Hilbert-
Huang Transaction, and the narrow band Hilbert
transform is employed in the paper.
4. calculate the spectrum of d(t) with DFT based algorithm
when d(t) is periodic, and Hanning window and
interpolation are recommended again to obtain better
results.
5. calculate the frequencies and amplitudes of each
interharmonic using (5).
6. calculate the harmonic and interharmonic sub-groups
according to IEC standards.
Simulation results
According to IEC standard, instrument precision for
interharmonic analysis is tested with the input signal which
contains fundamental component and only one
interharmonic component. It should be mentioned that, if
this interharmonic locates far from the fundamental
component in the spectrum, spectral leakage effect from the
fundamental component can always be negligible for
interharmonic measurement. Whereas, this tested signal is
quite different from the practical waveform in power system,
in which multiple harmonic and interharmonic components
always exist.
The proposed algorithm based on envelope spectrum
analysis extracts the envelope (modulating) signal,
calculates the spectrum of modulating signal, and then
interharmonic parameters can be restored according to (5).
In this way the effects (or fake interharmonics), caused by
the spectral leakage from harmonics, can be eliminated, it is
more accurate for interharmonic analysis than traditional
methods in the real world.
Four simulations are performed in Matlab6.5 to
demonstrate the effectiveness of the proposed algorithm.
The sampling frequency for all the experiments is 10KHz.
A) Waveforms with only Harmonics
Synchronization characteristics of both the proposed
method and the IEC technique are studied in this section.
The signal x(t)=220×√2sin(2πft)+220×√2sin(6πft) is
considered in the case, which consists of the fundamental
component and the 3rd harmonic. The ideal fundamental
frequency f is assumed to be 50 Hz and it is assumed to be
varying from 49.5Hz to 50.5Hz. The harmonic and
interharmonic subgroup evaluated with both the new
method and the IEC technique are given in Table 1.
Table 1. Absolute errors in calculating harmonic-subgroup and
interharmonic-subgroup
f(Hz)
Gsg,1(V)
Gisg,1(V)
Gsg,3(V)
Gisg,3(V)
True value
(220V)
True value
(0V)
True value
(35V)
True value
(0V)
IEC
NEW I E C NEW
IEC
NEW
IEC
NEW
50.00
0 0 0 0 0 0 0 0
50.05
0.11 0 1.73 0 0.20 0 1.13 0
50.50
2.61 0 17.57 0 2.36 0 9.16 0
49.95
0.06 0 1.71 0 0.15 0 1.13 0
49.5
1.85 0 16.00 0 2.30 0 8.99 0
With IEC technique, errors can always be observed on
the harmonic/interharmonic sub-groups estimation in the
case of loss of synchronization, and accurate results can
only be obtained under synchronous sampling(f=50Hz).
Special notice should be taken that, under asynchronous
sampling, Gisg,1 and Gisg,3 are ‘fake’ interharmonic
components caused by spectral leakage effect from the
harmonics.
Whereas, the proposed method based on demodulation
spectrum analysis is not affected by asynchronous
322 PRZEGLĄD ELEKTROTECHNICZNY (Electrical Review), ISSN 0033-2097, R. 86 NR 12/2010
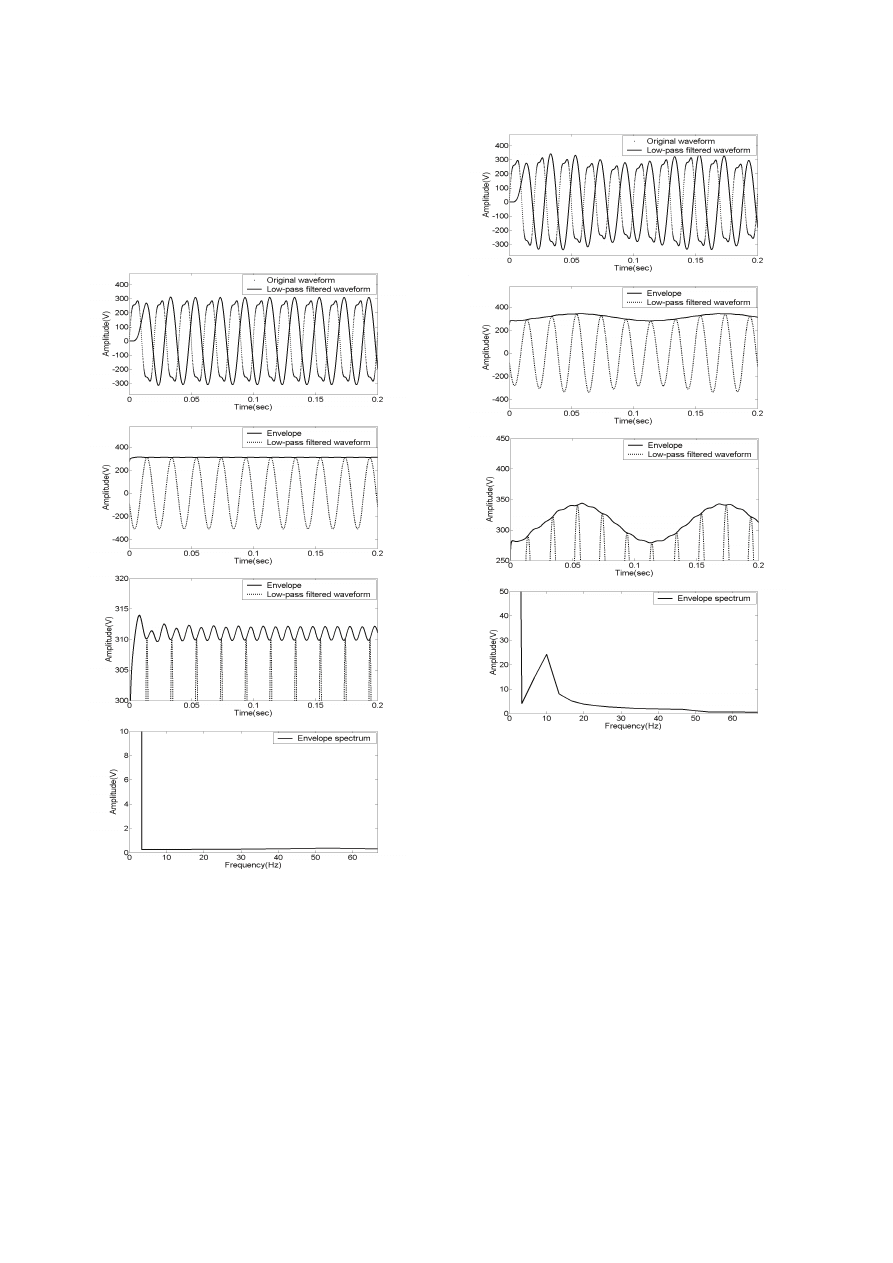
sampling, and so no fake interharmonics are found. For
simplicity, the calculation procedures with only f=50.5Hz is
shown in Figure 4. From figure 4.a, we can find that the
original waveform and low-pass filtered waveform are not
amplitude modulated due to containing no interharmoinc
component, thus the amplitude of the demodulated signal
(envelope) is almost constant as shown in figure 4.b. And
its detailed waveform is reported in figure 4.c. No frequency
component (0.5 to 30Hz) can be found in the spectrum of
the demodulated signal as shown in figure 4.d, which
demonstrates no interharmonic component existing in the
original signal.
(a)
(b)
(c)
(d)
Fig. 4. Calculation procedures of envelope spectrum analysis-
based method for x(t).(a) original waveform and low-pass filtered
waveform. (b)envelope of low-pass filtered waveform. (c) detailed
waveform of (b). (d) amplitude spectrum of demodulated signal.
As the harmonics components can be obtained
accurately with windowing and interpolation technique, the
new method leads to a considerable precision improvement
compared with IEC method.
B) Waveforms with harmonics and interharmonics
The aim of this case is to test the accuracy of the
proposed method compared with the IEC technique when
signal containing both harmonics and interharmonics, which
is expressed as x
1
(t)=[1+0.1×sin(2π×8.6t)] x(t). Figure 5
shows the calculation procedures in the case of f=50.5Hz
with the new method. It can be seen that the waveform is
modulated by a low frequency component (8.6Hz), and so a
nearly 10Hz component can be found in the spectrum of
demodulated signal. This is helpful to confirm the existence
of the interharmonic.
(a)
(b)
(c)
(d)
Fig. 5. Calculation procedures of envelope spectrum analysis-
based method for x1(t).(a) original waveform and low-pass filtered
waveform. (b)envelope of low-pass filtered waveform. (c) detailed
waveform of (b). (d) amplitude spectrum of demodulated signal.
With windowing and interpolation technique, modulation
frequency and amplitude are, respectively, equal to 8.59Hz
and 0.0999 and the parameters of harmonics and
interharmonics can be obtained according to (5), and then
the harmonic and interharmonic subgroups evaluated with
both the proposed method and the IEC technique are given
in Table 2. It is observed that the proposed method enjoys
much more accuracy than the IEC technique as expected.
C) Waveforms with multiple Harmonics and
Interharmonics
Practically, waveforms in the power system always
contain multiple harmonics and interharmonics
components. The case in this simulation is to test the
precision and stability of the new proposed method for
complex signals. The signal model expressed as (3) and (4)
is considered, in which M=21, A
m
=1/m(m is odd), A
m
=1/40
(
m is even), f=50.05Hz, Φ
m
=
0, L=1, D
l
=
0.1/l, η=8.6 Hz,
θ
l
=0。
PRZEGLĄD ELEKTROTECHNICZNY (Electrical Review), ISSN 0033-2097, R. 86 NR 12/2010 323
Table 2.
Absolute errors in calculating harmonic-subgroup and
interharmonic-subgroup
f(Hz)
Gsg,1(V)
Gisg,1(V)
Gsg,3(V)
Gisg,3(V)
True value
(220V)
True value
(11V)
True value
(35V)
True value
(1.75V)
IEC
NEW IEC NEW IEC NEW IEC NEW
50.00
2.68
-0.18
-1.32
-0.04
0.39
-0.03
-0.08
0.00
50.05
2.51
-0.17
-0.20
-0.04
0.17
-0.02
0.66
0.00
50.50
-0.52
-0.06
12.90
-0.04
-2.25
0.00
7.92
0.00
49.95
0.80
-0.17
-2.27
-0.04
0.56
-0.02
-0.31
0.00
49.5
-0.49
-0.06
0.63
-0.03
-1.62
0.00
6.18
0.00
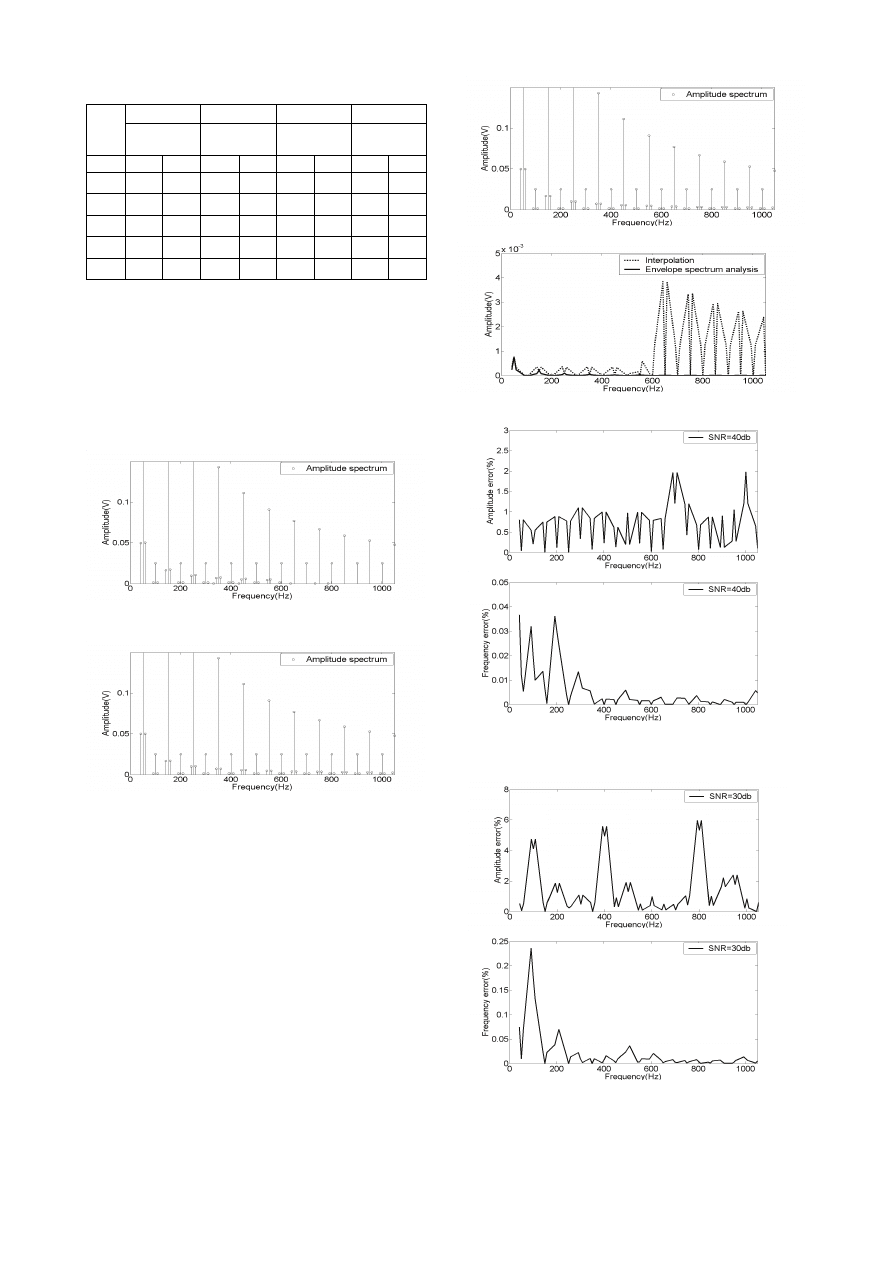
Figure 6 displays the amplitudes spectrums with Hanning
windowing and interpolation technique when the window
width is 0.4s, and the results for 0.6s are reported in figure
7. By comparing the results in these two figures, we can
find that the precision and stability of windowing and
interpolation technique are affected by the sampling window
width. Interharmoinics around high order harmonics can not
be estimated due to their relatively small amplitude in the
0.4s case.
Fig. 6. Amplitude spectrum with interpolation technique for 0.4s.
Fig. 7. Amplitude spectrum with interpolation technique for 0.6s.
Modulation frequency of 8.5907Hz and amplitude of
0.0999 can be obtained by the proposed method when the
window width is 0.4s. Then the interharmonic components
can be calculated according to (5), and the results are
shown in figure 8. Absolute error with these two methods for
0.4s are compared in figure 9, it can be clear seen that new
method leads to more accurate results.
D) Waveforms with added white Noise
Noise characteristics of the proposed algorithm are
studied in this section through simulation. The signal in the
previous simulation is corrupted with an added zero-mean
Gaussian white noise, and three cases are discussed in
which their SNR values are 20dB, 30dB and 40dB
individually based on the rms value of the signal. As the
results may change in each simulation, only one test results
for each case are reported in figure 10, figure 11, and figure
12. From the figures, we can find that the new method
exhibits desirable performance to the noise.
Fig. 8. Amplitude spectrum with proposed method for 0.4s.
Fig. 9. Absolute amplitude errors with interpolation and proposed
method for 0.4s.
(a)
(b)
Fig. 10. Performance of the proposed algorithm when the input
signal is corrupted with a white Gaussian noise of zero mean and
its SNR value is 40dB. (a) relative amplitude errors. (b) relative
frequency errors.
(a)
(b)
Fig. 11. Performance of the proposed algorithm when the input
signal is corrupted with a white Gaussian noise of zero mean and
its SNR value is 30dB. (a) relative amplitude errors. (b) relative
frequency errors.
324 PRZEGLĄD ELEKTROTECHNICZNY (Electrical Review), ISSN 0033-2097, R. 86 NR 12/2010
(a)
(b)
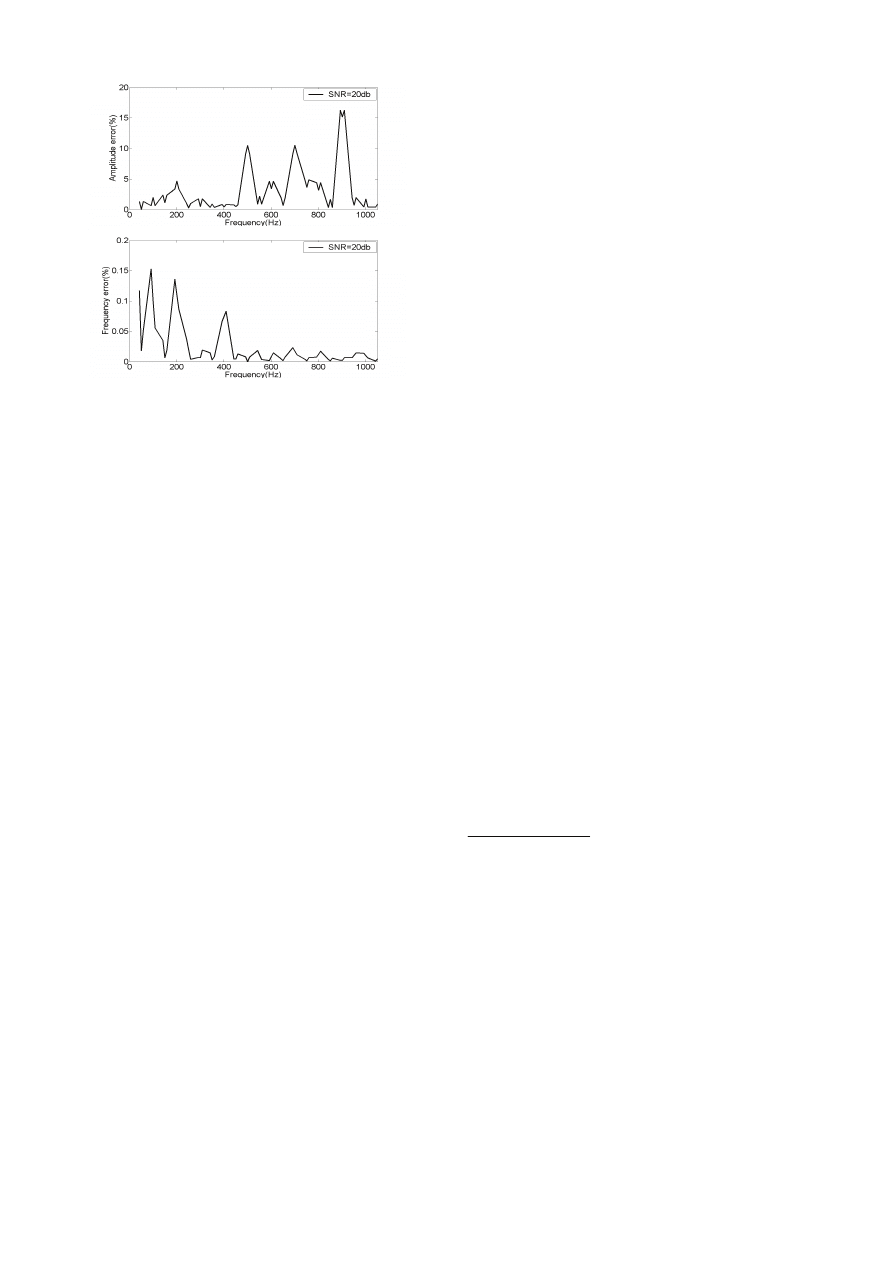
Fig. 12. Performance of the proposed algorithm when the input
signal is corrupted with a white Gaussian noise of zero mean and
its SNR value is 20dB. (a) relative amplitude errors. (b) relative
frequency errors
Conclusions
An envelope spectrum analysis-based algorithm for
interharmonics measurement is proposed in this paper. The
proposed method restores the interharmonic parameters
with the envelope and harmonic spectrum according to
amplitude modulation equation. The effects (or fake
interharmonics), caused by the spectral leakage from
harmonics, can be eliminated with the new method. In
addition, the new method exhibits desirable performance to
the noise. All of these features make the proposed
algorithm precise, effective and feasible.
REFERENCES
[1] Harris F.J., On the use of windows for harmonic analysis with
the discrete Fourier transform, Proceedings of the IEEE 66 (1)
(1978) 51–83.
[2] Nuttal A.H., Some windows with very good sidelobe behavior,
IEEE Trans. Acoustic, Speech, and Signal Processing., vol.
29, no. 1, pp. 84–91 , Apr 1981.
[3] Tseng F. I., Sarkar T. K., Weiner D. D., A novel window for
harmonic analysis, IEEE Trans. Acoustic, Speech, and Signal
Processing., vol. 29, no. 2, pp. 177-188, Apr 1981.
[4] Li C., Xu W., Tayjasanant T., Interharmonics: Basic concepts
and techniques for their detection and measurement, Elect.
Power Syst. Res., vol. 66, pp. 39–48, 2003.
[5] Jain H. Collins W. L., Davis D. C., High-accuracy analog
measurements via interpolated FFT, IEEE Transactions on.
Instrurn. Meus.,vol. 1M-28, pp. 113-122, June 1979.
[6] Grandke T., Interpolation algorithms for discrete Fourier
transforms of weighted signals, IEEE Trans. on Instrum.
Meas., vol. IM-32, pp.350-355, June 1983.
[7] Zhang F. S., Geng Z.X.,Yuan W, , The algorithm of
interpolating windowed FFT for farmonic analysis of electric
power system, IEEE Trans. Power Del., vol. 16, pp.160-164,
Apr 2001
[8] Hao Q. , Z. Rongxiang,C. Tong, “Interharmonics analysis
based on interpolating windowed FFT algorithm”, IEEE Trans.
Power Del., vol. 22, no. 2, pp. 1064-1069, Apr 2007.
[9] Gallo D., Langella R., Testa A.,Desynchronized processing
technique for harmonic and interharmonic analysis, IEEE
Trans. Power Del., vol. 19, no. 3, pp. 993-1001, Jul 2004.
[10] Zhu T. X., Exact Harmonics/Interharmonics Calculation Using
Adaptive Window Width, IEEE Trans. Power Del., vol. 22, no.
3, pp. 2279-2288, Oct 2007.
[11] Liu Z., Himmel J., Bong K.W.,Improved processing of
harmonics and interharmonics by time-domain averaging,
IEEE Trans. Power Del., vol. 20, no. 4, pp. 2370-2380, Oct
2005.
[12]
General Guide on Harmonics and Interharmonics
Measurements, for Power Supply Systems and Equipment
Connected Thereto, IEC Std. 61000-4-7,2002.
[13] Power Quality Measurements Methods , Testing and
Measurement Techniques, IEC Std. 61000-4-30,2002.
[14]
Keaochantranond T., Boonseng C., Harmonics and
interharmonics estimation using wavelet transform,
Transmission and Distribution Conference and Exhibition., pp.
6-10, 2002.
[15] Bracale A. , Caramia P. , Carpinelli G., Adaptive Prony
method for waveform distortion detection in power systems,
Electrical Power and Energy System, vol. 29, pp. 371-379,
2007.
[16] Bracale A., Carpinelli G., Leonowicz Z., Measurement of IEC
groups and subgroups using advanced spectrum estimation
methods, IEEE Trans. on Instrum. Meas., vol. 57, no. 1, pp.
672-681, Apr 2008.
[17] Lobos T., Leonowicz Z., and Rezmer J., High-resolution
spectrum estimationmethods for signal analysis in power
systems, IEEE Transactions on Instrum. Meas., vol. 55, no. 1,
pp. 219-225, Feb 2006.
[18] R. Langella and A. Testa. “Amplitude and phase modulation
effects of waveform distortion in power systems”. Electrical
Power quality and utilization, no.1, pp.25-32, 2007..
[19] Girgis A. A., Stephens J. W., E. B. Makram, Measurement and
Prediction of Voltage Flicker Magnitude and Frequency, IEEE
Trans. Power Del., vol. 10, no. 3, pp. 1600-1605,Jul 1995.
[20] Chang W. N., Wu C. J., Yen S. S., “A flexible voltage flicker
teaching facility for electrical power quality education”, IEEE
Trans. on Power System., vol. 13, no. 1, pp. 27-33, Feb 1998.
[21] Wu C. J., Fu T. H., “Effective voltage flicker calculation
algorithm using indirect demodulation method,” Proc. Inst.
Elect. Eng., Gen., Transm. Distrib., vol. 150, no. 4, pp. 493–
500, Jul. 2003.
[22] Axelberg P. G. V., Bllen M. H. J., An algorithm for determining
the direction to a flicker source, IEEE Trans. Power Del., vol.
21, no.2, pp. 755–760, Apr. 2006.
[23] Axelberg P. G. V., Bollen M. H. J., and Gu.I, Y. H., Trace of
Flicker Sources by Using the Quantity of Flicker Power , IEEE
Trans. Power Del., vol. 23, no.1, pp. 465–471, Jan. 2008.
Authors: Jiefeng Xiong,Hohai University, Nanjin 210098, China ,E-
mail: jiefengxiong@163.com; prof. Bolin Wang, Hohai University,
Nanjin 210098, China ,E-mail: phdwbl@163.com.
Wyszukiwarka
Podobne podstrony:
Transient stability simulation of power system including Wind generator by PSCAD EMTDC
Ship Power Systems and Design Part 3
[PhD 2003] Wind Power Modelling and Impact on Power System Dynamics
Central and autonomic nervous system interaction is altered by short term meditation
Alternative Energy Technologies, Solar and Wind Power Systems
Design Requirements For Medium Sized Wind Turbines For Remote And Hybrid Power Systems
Lucid Dreaming and Meditation by Wallace
Kundalini Is it Metal in the Meridians and Body by TM Molian (2011)
Jvc Power Supply Description And Trouble Shooting Procedure
Practical Optical System Layout And Use of Stock Lenses
A systematic review and meta analysis of the effect of an ankle foot orthosis on gait biomechanics a
Money Power System
Master Wonhyo An Overview of His Life and Teachings by Byeong Jo Jeong (2010)
Luhmann's Progeny Systems Theory and Literary Studies in the Post Wall Era
Embedded Systems Building and Programming Embedded Devices
O'Reilly Programming Embedded Systems in C and C
Labyrinth13 True Tales of Occult Crime and Conspiracy by Curt Rowlett 3rd edn (2013)
foc im and control by sliding mode
więcej podobnych podstron