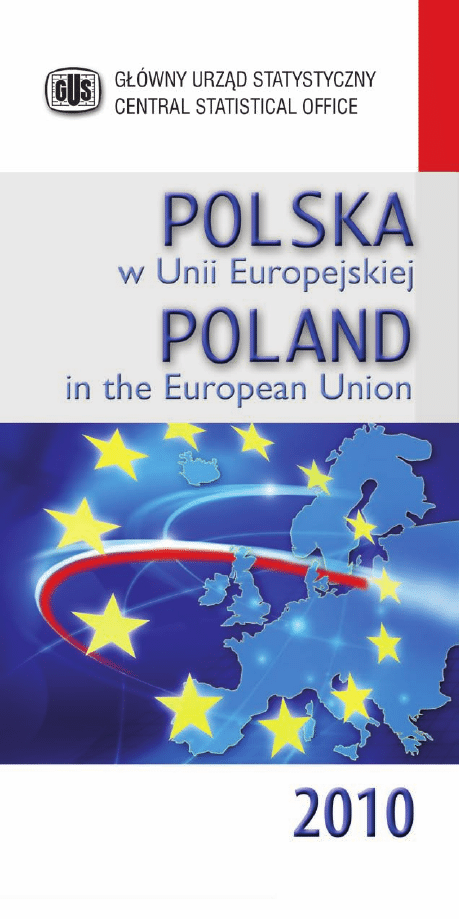
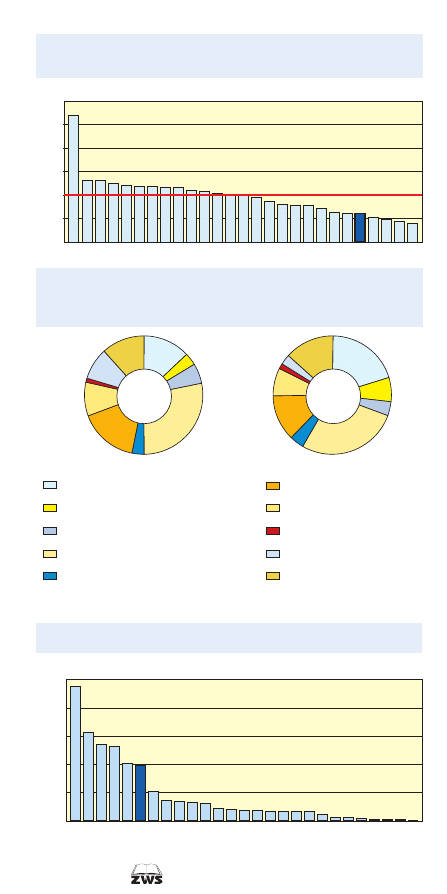
GĘSTOŚĆ ZALUDNIENIA W 2007 R.
POPULATION DENSITY IN 2007
FI
EE
LV
LT
PL
CZ
SK
AT
AT
LU
FR
ES
PT
UK
IE
DE
DK
BE
NL
SI
IT
GR
MT
CY
BG
RO
HU
SE
2
Ludność na 1 km
2
Inhabitants per km
250 – 1290 (4)
150 – 249 (3)
100 – 149 (8)
100 – 149 (8)
50 – 99 (8)
1 – 49 (4)
AT – Austria Austria
BE – Belgia Belgium
BG – Bułgaria Bulgaria
CY – Cypr Cyprus
CZ – Rep. Czeska Czech Rep.
DE – Niemcy Germany
DK – Dania Denmark
EE – Estonia Estonia
ES – Hiszpania Spain
FI – Finlandia Finland
FR – Francja France
GR – Grecja Greece
HU – Węgry Hungary
IE – Irlandia Ireland
IT – Włochy Italy
LT – Litwa Lithuania
LU – Luksemburg Luxemburg
LV – Łotwa Latvia
MT – Malta Malta
NL – Niderlandy Netherlands
PL – Polska Poland
PT – Portugalia Portugal
RO – Rumunia Romania
SE – Szwecja Sweden
SI – Słowenia Slovenia
SK –
Słowacja Slovakia
UK –
Wlk. Brytania United Kingdom

PODSTAWOWE DANE SPOŁECZNO-GOSPODARCZE W 2009 R.
GENERAL SOCIO-ECONOMIC DATA IN 2009
Kod
Powierzchnia
w tys. km
2
Total area
in thous. km
2
Ludność
w tys.
(średnio-
roczna)
Average
population
in thous.
Urodzenia
żywe
Live births
Zgony Deaths
Przyrost
naturalny
Natural
increase
Przeciętne
trwanie
życia
w 2008 r.
Life
expectancy
in 2008
Współ-
czynnik
obciążenia
demogra-
ficznego
b
w 2008 r.
Age
depend-
ency
ratio
b
in 2008
Wskaźnik
zatrud-
nienia
c
Employ-
ment rate
c
Współ-
czynnik
aktywności
zawodowej
c
Activity
rate
c
Zharmo-
nizowana
stopa
bezro-
bocia
Harmo-
nized
unem-
ployment
rate
Wyksz-
tałcenie
osób
młodych
d
w 2008 r.
Youth
education
attainment
level
d
in 2008
Młodzież
niekon-
tynuująca
nauki
e
w 2008 r.
Early
school
leavers
e
in 2008
Wskaźnik
zagro-
żenia
ubóstwem
f
w %
w 2008 r.
At risk
of poverty
rate
f
in %
in 2008
Nakłady
na działal-
ność
B+R
w % PKB
w 2008 r.
Gross
domestic
expend-
itures
on R&D
in %
of GDP
in 2008
Code
ogółem
total
w tym
niemowląt
a
of which
infant
deaths
a
na 1000 ludności per 1000 population
w % in %
w % ludności
w tej samej grupie
wiekowej
in % of population
of the same age group
EU
4 403,4
500 402
10,7
9,7
4,7
g
1,0
79,2
h
48,6
69,1
75,6
8,9
78,5
14,9
17
1,90
EU
AT
83,9
8 365
9,1
9,3
3,7
–0,1
80,6
48,1
74,7
78,2
4,8
84,5
10,1
12
2,67
AT
BE
30,5
10 789
11,7
9,6
3,4
2,0
79,9
h
51,4
67,1
72,7
7,9
82,2
12,0
15
1,92
BE
BG
111,0
7 585
10,7
14,2
8,6
–3,6
73,3
44,3
68,8
73,7
6,8
83,7
14,8
21
0,49
BG
CY
9,3
797
12,2
6,7
5,3
5,5
80,8
42,7
75,7
79,9
5,3
85,1
13,7
16
0,46
CY
CZ
78,9
10 487
11,3
10,2
2,8
1,0
77,3
40,4
70,9
75,8
6,7
91,6
5,6
9
1,47
CZ
DE
357,1
81 901
7,9
10,3
3,5
–2,3
80,2
50,8
74,8
81,0
7,5
74,1
11,8
15
2,63
DE
DK
43,1
5 520
11,4
9,9
4,0
1,4
78,8
51,6
77,8
82,4
6,0
71,0
11,5
12
2,72
DK
EE
45,3
1 340
11,8
12,0
5,0
–0,2
74,3
47,1
69,9
80,7
13,8
82,2
14,0
19
1,29
EE
ES
506,0
45 909
10,8
8,5
3,5
2,2
81,2
45,4
63,7
77,1
18,0
60,0
31,9
20
1,35
ES
FI
338,4
5 339
11,3
9,3
2,6
2,0
79,9
50,1
73,5
79,4
8,2
86,2
9,8
14
3,73
FI
FR
632,8
64 540
12,7
8,5
3,8
4,3
81,4
53,4
69,6
76,2
9,5
83,4
11,8
13
2,02
FR
GR
132,0
11 278
10,5
9,8
3,5
0,7
80,0
49,1
65,8
72,6
9,5
82,1
14,8
20
0,58
h
GR
HU
93,0
10 022
9,6
13,0
5,6
–3,4
74,2
45,3
60,5
67,1
10,0
83,6
11,7
12
1,00
HU
IE
69,8
4 453
16,8
6,6
3,1
h
10,2
79,9
45,9
66,7
75,3
11,9
87,7
11,3
16
1,43
IE
IT
301,3
60 216
9,5
9,8
3,7
–0,3
81,6
h
51,7
61,7
66,7
7,8
76,5
19,7
19
1,18
IT
LT
65,3
3 339
11,0
12,6
4,9
–1,6
72,0
45,3
67,2
77,8
13,7
89,1
7,4
20
0,80
LT
LU
2,6
498
11,3
7,3
1,8
4,0
80,7
47,4
70,4
74,0
5,4
72,8
13,4
13
1,62
LU
LV
64,6
2 255
9,6
13,3
6,7
–3,6
72,5
44,8
67,1
80,7
17,1
80,0
15,5
26
0,61
LV
MT
0,3
413
10,0
7,8
9,9
2,2
79,7
42,5
58,8
62,5
6,9
53,0
39,0
15
0,54
MT
NL
41,5
16 532
11,2
8,1
3,8
3,1
80,5
48,4
78,8
81,3
3,4
76,2
11,4
11
1,63
NL
PL
312,7
38 153
11,0
10,1
5,6
0,9
75,5
40,7
64,9
70,6
8,2
91,3
5,0
17
0,61
PL
PT
92,1
10 632
9,2
9,6
3,3
–0,5
79,4
46,2
71,2
78,9
9,6
54,3
35,4
18
1,51
PT
RO
238,4
21 480
10,4
12,0
11,0
–1,6
73,4
43,1
63,5
68,0
6,9
78,3
15,9
23
0,58
RO
SE
441,4
9 299
12,0
9,7
2,5
2,3
81,3
52,2
78,3
84,5
8,3
87,9
11,1
12
3,75
SE
SI
20,3
2 040
10,6
9,2
2,1
1,4
79,1
43,3
71,9
76,3
5,9
90,2
5,1
12
1,66
SI
SK
49,0
5 419
11,3
9,8
5,9
1,5
74,9
38,4
66,4
75,1
12,0
92,3
6,0
11
0,47
SK
UK
243,1
61 802
12,8
9,1
4,7
3,7
79,8
h
50,7
73,9
79,1
7,6
78,2
17,0
19
1,88
UK
a Na 1000 urodzeń żywych; 2008 r. b Ludność w wieku nieprodukcyjnym (0—14 lat oraz 65 lat i więcej) na 100 osób w wieku produkcyjnym (15—64 lata). c—e Dotyczy osób w wieku: c — 20—64 lata, d — 20—24 lata z wykształceniem co
najmniej zasadniczym zawodowym, e — 18—24 lata z wykształceniem podstawowym i/lub z gimnazjalnym, które nie kontynuują nauki i nie dokształcają się. f Z uwzględnieniem w dochodach transferów społecznych. g 2006 r. h 2007 r.
a
Per 1000 live births; 2008. b Population in non-working age (aged 0—14 and 65 and more) to 100 persons in working age (aged 15—64). c—e Concerns population aged: c — 20—64, d — 20—24, having comple-
ted at least vocational school, e — 18—24 having completed primary and/or lower secondary school and which does not participate in the education and training. f After social transfers. g 2006. h 2007.
0
0
20
20
40
40
60
60
80
80
100
100
%
%
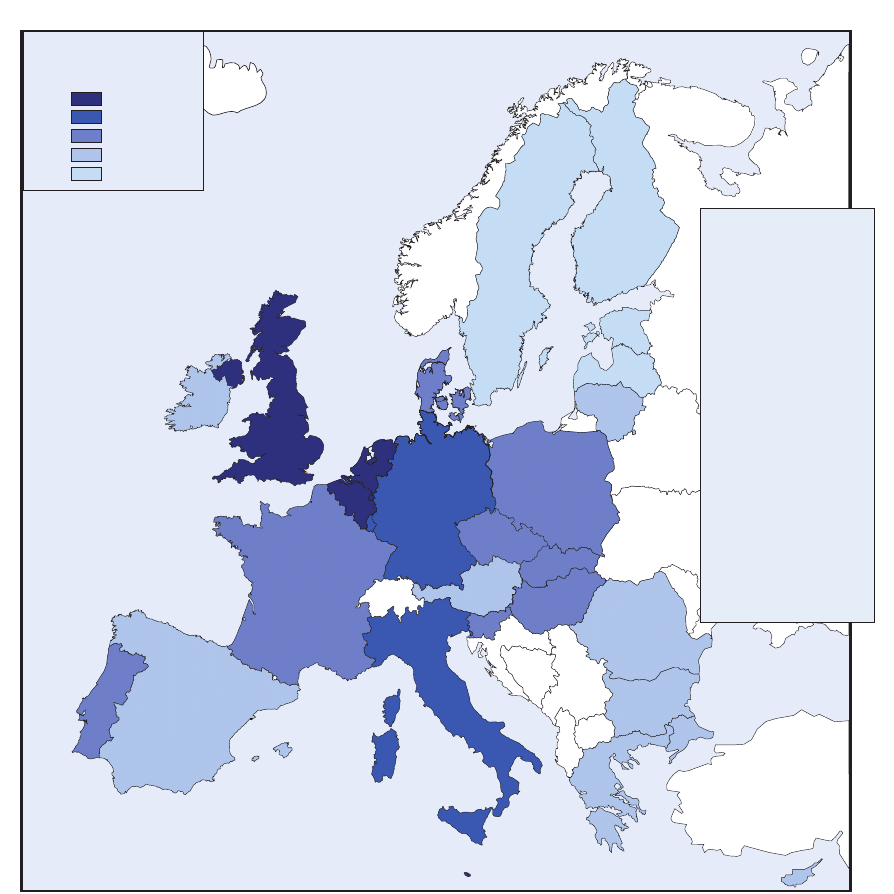
STRUKTURA LUDNOŚCI WEDŁUG WIEKU W 2009 R.
Stan w dniu 1I
STRUCTURE OF POPULATION BY AGE IN 2009
st
As of 1 January
a
STRUKTURA PRACUJĄCYCH WEDŁUG RODZAJÓW DZIAŁALNOŚCI W 2009 R.
a
STRUCTURE OF EMPLOYED PERSONS BY KINDS OF ACTIVITY IN 2009
CY
CY
0–14 lat years
Rolnictwo Agriculture
Przemysł i budownictwo Industry and construction
a 2008 r.
a Według ISCED’97 – poziomy 5 i 6.
b Rok akademicki 2006/07.
a According to ISCED’97 – 5 and 6 levels.
b The academic year 2006/07.
a Dane na podstawie BAEL. b 2008 r.
a Data on the LFS basis. b 2008.
15–24 lat years
25–64 lat years
65 lat i więcej years and more
FI
FI
FR
FR
GR
GR
IE
IE
a
UK
UK
LT
LT
NL
NL
LV
LV
AT
AT
SK
SK
Usługi Services
E
a
B BG
BG
SE
SE
ES
ES
DE
DE
BE
EE
EE
LU
b
LU
PT
PT
RO
RO
CZ
CZ
PL
PL
MT
MT
SI
SI
DK
DK
HU
HU
IT
IT
E
b
U
0
100
200
300
400
500
600
PT
SK
AT
BE
BG
CY
CZ
DE
DK
EE
ES
FI
FR
HU
IE
IT
LT
LU
LV
MT
NL
PL
RO
SE
SI
UK
GR
a
STUDENCI SZKÓŁ WYŻSZYCH NA 10 TYS. LUDNOŚCI W ROKU AKADEMICKIM
2007/08
STUDENTS OF HIGHER EDUCATION INSTITUTIONS PER 10 THOUS. POPULATION IN THE
ACADEMIC YEAR 2007/08
a
b
0
%
a
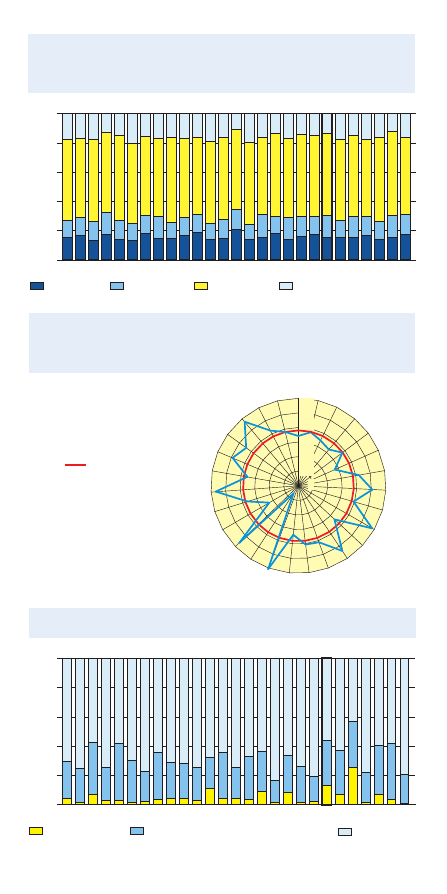
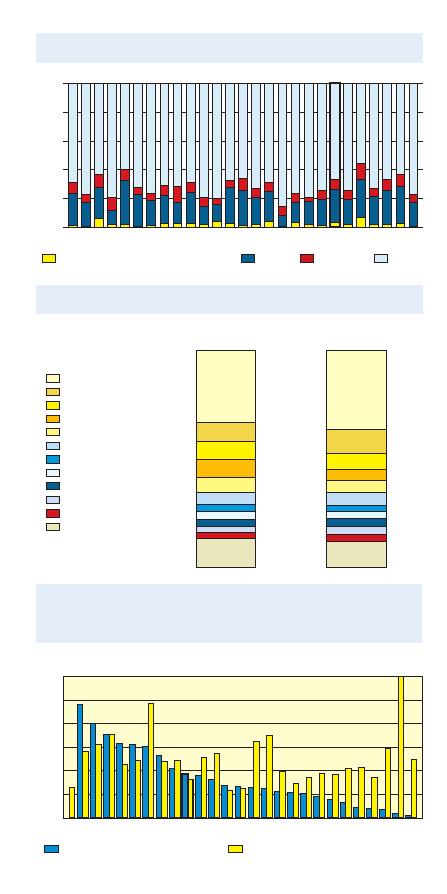
STOPA BEZROBOCIA OSÓB MŁODYCH W 2009 R.
a
YOUTH UNEMPLOYMENT RATE IN 2009
ZHARMONIZOWANY WSKAŹNIK CEN KONSUMPCYJNYCH W 2009 R.
HARMONIZED INDICES OF CONSUMER PRICES IN 2009
LUDNOŚĆ W WIEKU 30–34 LATA Z WYKSZTAŁCENIEM WYŻSZYM W % LUDNOŚCI
W TEJ SAMEJ GRUPIE WIEKOWEJ W 2009 R.
POPULATION AGED 30–34 WITH TERTIARY EDUCATION IN % OF THE POPULATION
OF THE SAME AGE GROUP IN 2009
CY
a Dotyczy osób w wieku 15–24 lata.
a Concerns persons aged 15–24.
FI
FR
GR
IE
UK LT NL
LV
AT
SK
BG
SE
ES
DE
BE
EE
LU
PT
RO
CZ
PL
MT
SI
DK
HU
IT
AT
BE
BG
CY
CZ
DE
DK
EE
ES
FI
FR
GR
HU
IE
IT
LT
LU
LV
MT
NL
PL
PT
RO
SE
SI
SK
UK
EU
2008=100
EU
EU 32,2%
40
0
10
20
30
10
20
30
40
50
AT
BE
BG
CY
CZ
DE
DK
EE
ES
FI
FR
GR
HU
IE
IT
LT
LU
LV
MT
NL
PL
PT
RO
SE
SI
SK
UK
98
100
102
104
106
0
a
EMISJA GAZÓW CIEPLARNIANYCH W 2008 R.
a
EMISSION OF GREENHOUSE GASES IN 2008
PRODUKT KRAJOWY BRUTTO NA 1 MIESZKAŃCA WEDŁUG PARYTETU SIŁY
NABYWCZEJ W 2009 R.
GROSS DOMESTIC PRODUCT AT PURCHASING POWER PARITY PER CAPITA IN 2009
CY
CY
FI
FI
FR
FR
GR
GR
IE
IE
UK
UK
LT
LT
NL
NL
LV
LV
AT
AT
SK
SK
BG
BG
SE
SE
ES
ES
DE
DE
BE
BE
EE
EE
LU
LU
PT
PT
RO
RO
CZ
CZ
PL
PL
MT
MT
SI
SI
DK
DK
HU
HU
IT
IT
EU =100
200
400
600
800
1000
0
50
100
150
200
250
300
Zdrowie
Health
Żywność i napoje bezalkoholowe
Food and non-alcoholic beverages
Transport i łączność
Transport and communications
Odzież i obuwie
Clothing and footwear
Inne towary i usługi
Miscellaneous goods and services
Rekreacja i kultura
Recreation and culture
Restauracje i hotele
Restaurants and hotels
Napoje alkoholowe, wyroby tytoniowe i narkotyki
Alcoholic beverages, tobacco and narcotics
Edukacja
Education
STRUKTURA SPOŻYCIA INDYWIDUALNEGO W SEKTORZE GOSPODARSTW
DOMOWYCH W 2008 R. (w %)
STRUCTURE OF INDIVIDUAL CONSUMPTION EXPENDITURE OF HOUSEHOLDS SECTOR
IN 2008 (in %)
EU
PL
O
O
a W ekwiwalencie C .
2
a In C equivalent.
2
12,9
3,4
5,4
28,3
16,1
11,4
9,2
1,1
8,7
3,5
20,2
6,6
4,1
27,9
12,4
13,3
7,6
1,2
2,8
3,9
a Łącznie z nośnikami energii i prowadzeniem gospodarstwa domowego.
a Including electricity, gas and other fuels as well as maintenance of the house.
a
Użytkowanie i wyposażenie mieszkania
a
Housing and furnishings
tys. t thous. t
PPS-EU=100
Zak³ad Wydawnictw Statystycznych
Warszawa

PODSTAWOWE DANE SPOŁECZNO-GOSPODARCZE W 2009 R. (dok.)
GENERAL SOCIO-ECONOMIC DATA IN 2009 (count.)
Kod
Produkt krajowy brutto Gross domestic product
Produkcja przemysłowa
a
Industrial production
a
Produkcja
w budow-
nictwie
a
Con-
struction
production
a
Energo-
chłonność
gospodarki
w kgoe/
/1000 euro
w 2007 r.
Energy
intensity
of the
economy
in kgoe/
/1000 euro
in 2007
Produkcja rolnicza
Agricultural output
Obroty handlu zagranicznego
Foreign trade turnover
Bilans
płatniczy
— saldo
rachunku
bieżącego
w % PKB
Balance
of pay-
ments —
net current
account
in %
of GDP
Code
ogółem
w mld euro
total
in bn euro
nakłady
brutto
na środki
trwałe
w % PKB
gross fixed
capital
formation
in %
of GDP
ogółem
total
w tym of which
ogółem
total
w tym
przetwór-
stwo prze-
mysłowe
of which
manu-
facturing
roślinna
crop
zwierzęca
animal
import
imports
eksport
exports
udział obrotów
z krajami UE w obrotach
ogółem w %
share of turnover
with the EU countries
in total turnover in %
spożycie
prywatne
private
final con-
sumption
nakłady
brutto
na środki
trwałe
gross fixed
capital
formation
ceny bieżące
current prices
ceny stałe constant prices
2008=100
UE/EU=100
ceny bieżące
current prices
w mld euro
in bn euro
import
imports
eksport
exports
EU 11 808,7
19,1
95,8
98,2
88,4
86,0
85,0
91,4
169,4
100,0
100,0
.
.
63,8
66,6
–1,1
EU
AT
277,1
20,7
96,5
100,4
91,9
88,1
86,8
98,1
140,7
1,5
2,1
102,8
98,7
78,0
71,8
3,6
b
AT
BE
337,3
21,3
97,0
98,2
95,3
86,1
84,4
93,3
198,8
1,7
2,8
252,3
265,2
71,1
75,9
0,5
BE
BG
33,9
24,8
95,0
93,7
73,1
82,6
77,6
85,7
1 016,3
1,1
0,9
16,7
11,8
60,3
64,4
–9,4
BG
CY
16,9
20,4
98,3
97,0
88,0
91,3
89,0
89,2
212,2
0,2
0,2
5,6
0,9
72,0
66,6
–8,3
CY
CZ
137,2
22,4
95,9
99,8
90,8
86,9
85,4
99,5
553,2
1,1
1,2
75,3
81,2
77,9
84,6
–1,1
CZ
DE
2 409,1
17,8
95,1
99,9
91,0
83,2
82,4
100,1
151,5
12,1
14,5
668,1
803,9
64,9
62,8
4,9
DE
DK
222,9
18,6
95,1
95,4
88,0
84,9
82,9
84,3
105,7
1,7
3,5
59,4
66,9
69,9
67,5
4,0
DK
EE
13,7
21,9
85,9
81,5
65,6
74,1
72,4
71,6
580,7
0,1
0,2
7,3
6,5
79,7
69,4
4,6
EE
ES
1 051,2
24,4
96,4
95,1
84,7
84,2
83,4
89,0
184,2
13,4
9,9
206,2
156,6
61,5
68,8
–5,4
ES
FI
171,0
19,8
92,2
97,9
86,6
78,8
76,7
86,7
229,2
0,9
1,5
43,3
44,9
64,9
55,6
1,3
FI
FR
1 907,1
20,6
97,4
100,6
92,9
88,0
87,1
94,5
165,4
20,2
17,0
396,1
341,6
68,8
61,8
–2,2
FR
GR
237,5
16,8
98,0
98,2
86,1
90,8
89,5
79,6
181,8
4,0
2,1
42,9
14,4
64,3
62,7
–11,2
GR
HU
93,1
20,0
93,7
92,5
93,5
82,7
82,0
95,7
400,8
1,8
1,6
56,0
60,0
68,8
78,9
0,2
HU
IE
163,5
15,6
92,9
92,8
70,3
95,9
96,2
63,6
103,1
0,8
2,5
44,6
82,1
65,3
61,5
–2,9
IE
IT
1 520,9
18,9
95,0
98,3
87,9
81,7
81,1
88,7
142,8
13,9
10,4
294,2
290,1
57,0
57,1
–3,2
IT
LT
26,6
17,0
85,2
83,2
60,9
85,4
84,5
51,5
432,5
0,6
0,5
13,1
11,8
58,8
64,3
3,8
LT
LU
37,8
17,4
96,6
99,4
85,1
84,2
82,9
101,1
158,5
0,1
0,1
17,5
14,9
71,7
87,3
5,6
LU
LV
18,5
21,5
82,0
76,0
62,7
84,2
82,4
65,1
306,6
0,2
0,2
6,9
5,5
74,9
67,3
9,4
LV
MT
5,7
14,2
98,5
101,3
81,2
88,0
87,6
98,0
198,2
0,0
0,1
2,6
1,5
68,9
42,4
–3,9
MT
NL
570,2
18,9
96,0
97,5
87,0
92,4
91,1
93,7
177,1
6,4
6,4
319,5
357,3
49,2
77,1
5,4
NL
PL
310,1
21,1
101,8
102,2
99,2
96,4
96,9
104,5
400,1
5,0
6,0
107,5
98,3
61,9
79,6
–1,6
PL
PT
167,6
19,5
97,4
99,0
88,1
91,5
89,8
93,4
196,9
2,2
1,9
50,1
31,1
78,0
74,9
–10,3
PT
RO
115,9
25,6
92,9
89,5
74,7
94,1
93,3
84,8
655,6
4,9
3,2
38,9
29,1
73,3
74,3
–4,5
RO
SE
292,7
17,9
94,9
99,2
84,0
82,1
80,7
96,5
156,5
1,0
1,6
85,4
94,0
68,1
58,5
7,3
SE
SI
34,9
24,0
92,2
98,6
78,4
82,5
81,2
79,1
253,3
0,3
0,4
19,0
18,8
70,8
69,3
–1,0
SI
SK
63,3
23,6
95,3
99,3
89,5
85,9
84,1
88,8
538,6
0,5
0,6
39,6
40,1
74,7
85,8
–3,2
SK
UK
1 566,7
14,9
95,1
96,8
85,1
89,6
89,6
88,8
115,5
4,3
8,7
344,9
252,3
52,7
55,0
–1,3
UK
a Dane wyrównane dniami roboczymi. b 2007 r.
a Working day adjusted data. b 2007.
0
tys. kgoe
thous. kgoe
%
POZYSKIWANIE ENERGII PIERWOTNEJ I ZUŻYCIE FINALNE ENERGETYCZNE
NA 1 MIESZKAŃCA W 2008 R.
TOTAL PRODUCTION OF PRIMARY ENERGY AND FINAL ENERGY CONSUMPTION
PER CAPITA IN 2008
STRUKTURA WARTOŚCI DODANEJ BRUTTO W 2009 R.
STRUCTURE OF GROSS VALUE ADDED IN 2009
CY
CY
FI
FI
FR
FR
GR
GR
IE
IT
IE
UK
UK
LT
LT
NL
NL
LV
LV
AT
AT
SK
SK
BG
BG
SE
SE
ES
ES
DE
DE
BE
BE
EE
EE
LU
LU
PT
RO
RO
CZ
CZ
PL
PL
MT
MT
SI
SI
DK
DK
HU
HU
PT
IT
2
3
1
4
5
8,7
6
0
80
60
40
20
100
Pozyskiwanie energii pierwotnej
Total production of primary energy
Zużycie finalne energetyczne
Final energy consumption
OBROTY HANDLU ZAGRANICZNEGO POLSKI Z KRAJAMI UE W 2009 R.
FOREIGN TRADE TURNOVER OF POLAND WITH THE EU COUNTRIES IN 2009
Rolnictwo, leśnictwo i łowiectwo oraz rybactwo
Agriculture, hunting, forestry and fishing
Przemysł
Industry
Budownictwo
Construction
Usługi
Services
Eksport
Exports
Import
Imports
36,2%
32,8%
8,6%
8,7%
8,0%
7,3%
5,3%
3,4%
3,4%
3,3%
2,9%
3,0%
13,3%
11,1%
4,8%
5,8%
5,9%
3,0%
3,0%
3,6%
3,7%
3,3%
12,2%
FR
UK
NL
SK
Pozostałe kraje UE
Other EU countries
BE
SE
ES
DE
CZ
HU
IT
7,4%
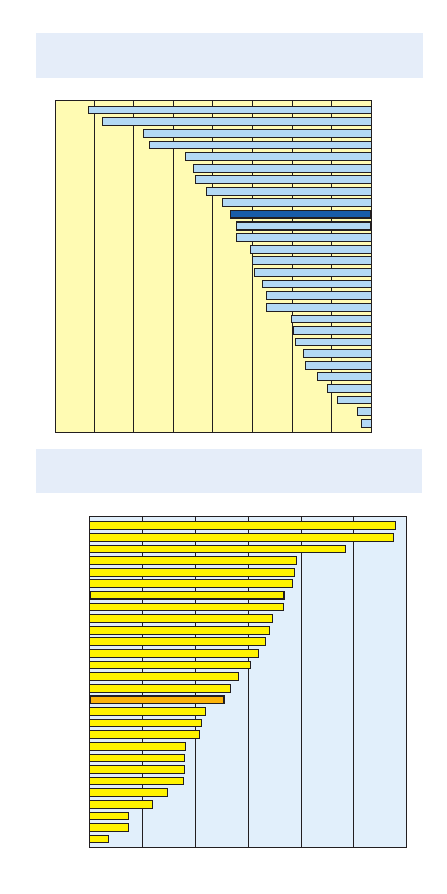
DŁUG SEKTORA INSTYTUCJI RZĄDOWYCH I SAMORZĄDOWYCH W RELACJI
DO PKB W 2009 R.
GENERAL GOVERNMENT SECTOR DEBT IN RELATION TO GDP IN 2009
DEFICYT SEKTORA INSTYTUCJI RZĄDOWYCH I SAMORZĄDOWYCH W RELACJI
DO PKB W 2009 R.
GENERAL GOVERNMENT SECTOR DEFICIT IN RELATION TO GDP IN 2009
CY
CY
FI
FI
FR
FR
GR
GR
IE
IE
UK
UK
LT
LT
NL
NL
LV
LV
AT
AT
SK
SK
EU
EU
BG
BG
SE
SE
ES
ES
DE
DE
BE
BE
EE
EE
Ź r ó d ł o: EUROSTAT (według stanu na dzień 30. 06. 2010 r.), GUS.
S o u r c e: EUROSTAT (as of 30 June 2010), CSO.
LU
LU
PT
PT
RO
RO
CZ
CZ
PL
PL
MT
MT
SI
SI
DK
DK
HU
HU
IT
IT
-16%
-14
-12
-10
-8
-6
-4
-2
0
0
20
40
60
80
100
120%
Document Outline
- unia2010_01
- unia2010_02
- unia2010_03
- unia2010_04
- unia2010_05
- unia2010_06
- unia2010_07
- unia2010_08
- unia2010_09
Wyszukiwarka
Podobne podstrony:
POLSKA W UE 2010
przyklad i sklad zespolow Etapy integracji w ramach WE i UE 2013, Polska w UE
3 Instytucje i organy UE 2010 2011(2), Wszystko i nic
Minim war utrzym zw gosp UE-1-2010-56-344
POLSKA UE
Polska w UE Bilans
Polska a UE
POLSKA W UE BILANS
Polska a UE
Rynek UE W 1 2010 W ST
polacy w strukturach UE 2010
POLSKA W UE 2008r
Program przedmiotu PlwUE WAiNS niest 23.02.2013. Sz.D, Polska w UE
Minim war utrzym zw gosp UE-1-2010-56-344-zmiana 1-2010-171-1157
Minim war utrzym zw gosp UE-1-2010-56-344-zmiana 2-2011-282-1652
więcej podobnych podstron