
RELATIONSHIP BETWEEN MICROSTRUCTURE
AND MECHANICAL PROPERTIES OF A 5% CR
HOT WORK TOOL STEEL
N. Mebarki, P. Lamesle, D. Delagnes, C. Levaillant
Ecole des Mines d’Albi Carmaux, Campus Jarlard, Route de Teillet,
81 013 Albi Cedex 09
France
F. Delmas
Centre d’Elaboration de Mat´eriaux et d’Etudes Structurales, CNRS, 29, rue Jeanne Marvig,
BP 4347, 31055 Toulouse Cedex 4,
France
Abstract
Usual mechanical properties of martensitic steels are strongly linked to their
complex microstructure obtained after heat treatment. Heat treatments are
generally performed in order to achieve a good hardness and/or tensile strength
with a sufficiently acceptable ductility. Nevertheless, microstructural param-
eters (connected with carbides and dislocations) giving suitable mechanical
properties at the initial state are never totally investigated. Our reference
grade is the well-known X38CrMoV5 (AISI H11) steel.
The main goal of this work deals with a quantitative identification of
relevant microstructural parameters ensuring a good mechanical strength of
these steels at working temperatures. Particularly, influences of the tempering
temperature and of the fatigue strain amplitude are discussed.
Keywords:
5% Cr martensitic steel, TEM observations, X-Ray Diffraction, X-Ray profile
analysis, microstructure, dislocations, carbides, fatigue, second tempering
737
738
6TH INTERNATIONAL TOOLING CONFERENCE
INTRODUCTION
Mechanical properties and particularly yield stress of tempered marten-
sitic steels for high temperature forming operations (such as pressure die
casting for light alloy injection, forging dies, mandrels, etc..) are strongly
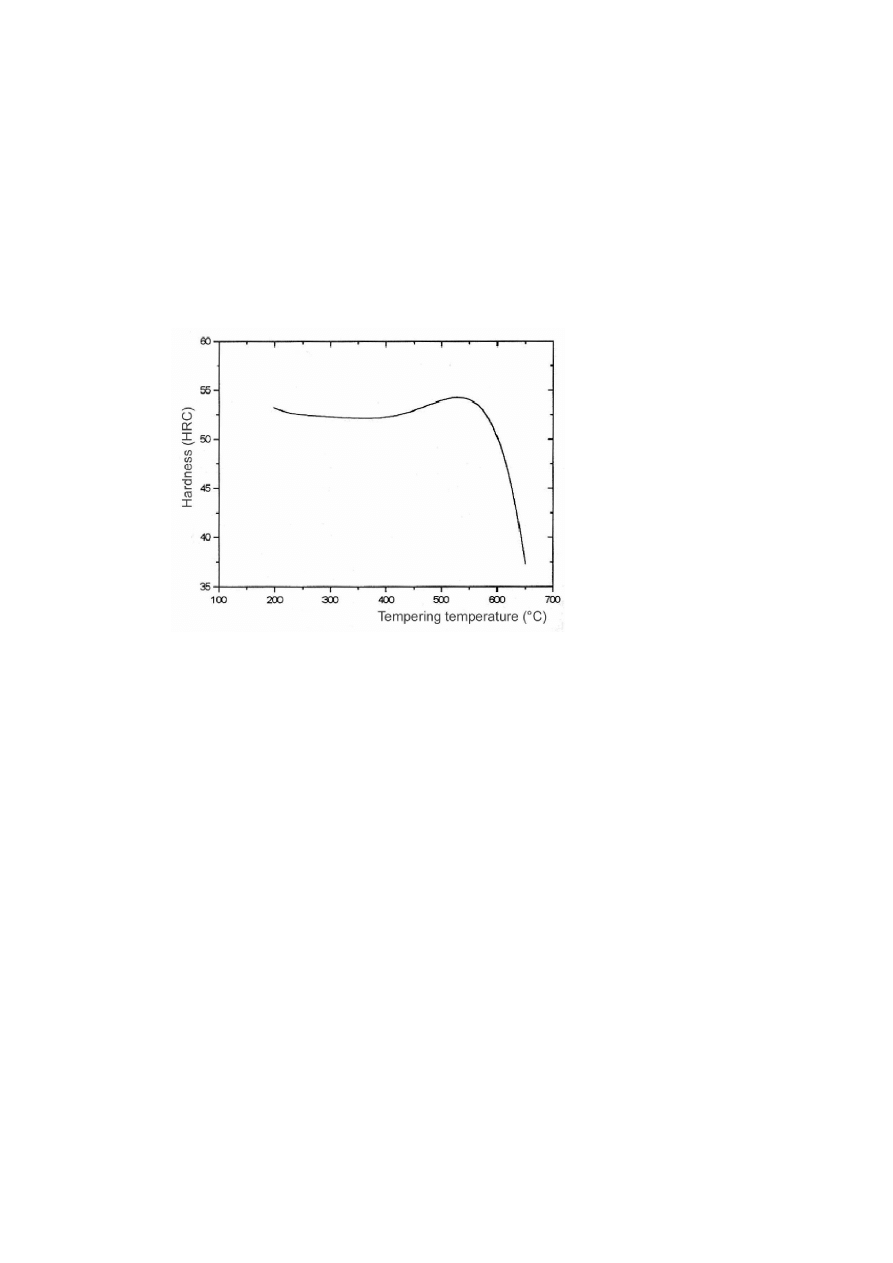
influenced by heat treatments and cyclic plasticity [1, 2]. For example,
Fig. 1 shows that hardness level may decrease from 52 HRC to 40 HRC for
a tempering temperature increasing from 580
◦
Cto 640
◦
C(typical second
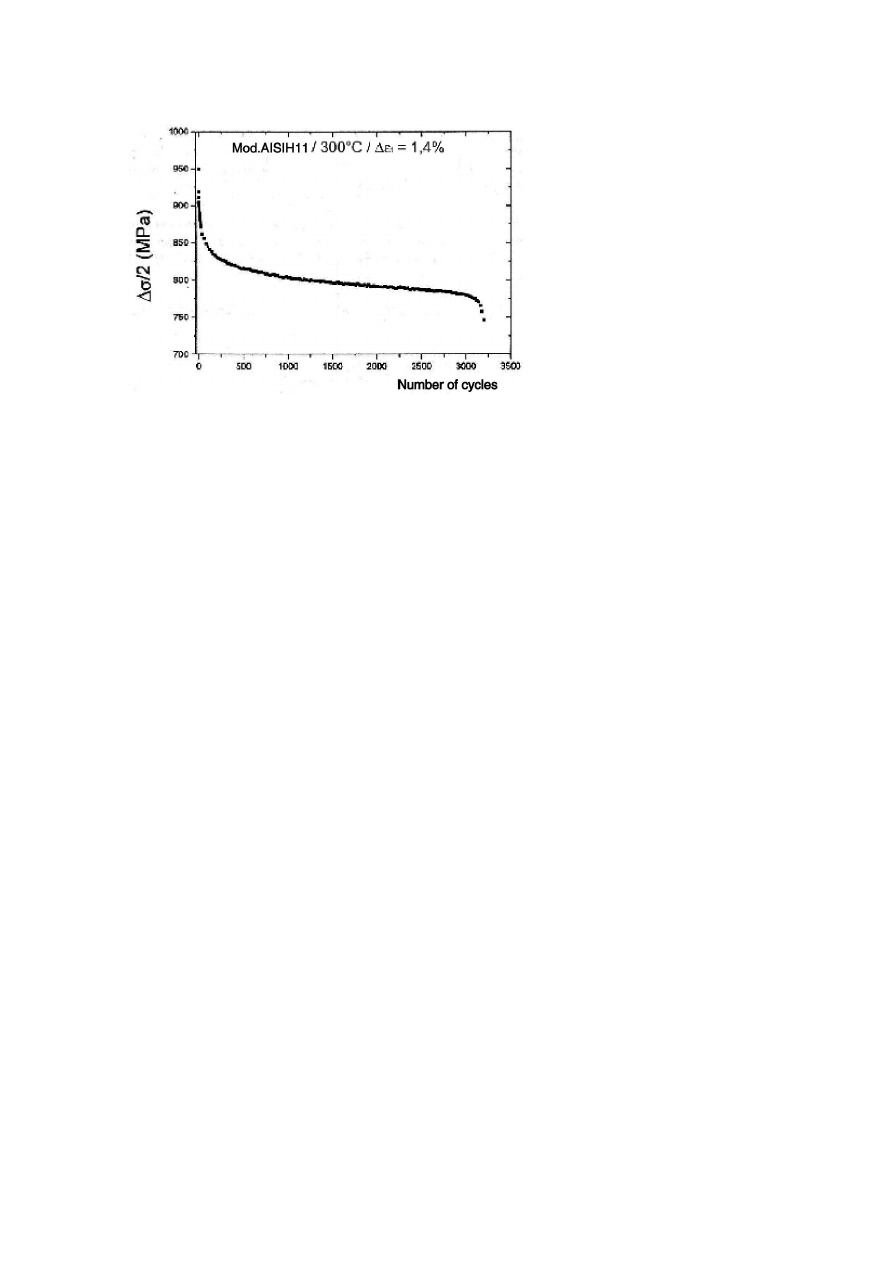
tempering temperature range). Figure 2 shows the strong softening effect
occurring during an isothermal fatigue test [1].
Figure 1.
Hardness versus tempering temperature for Mod. AISI H11 steel.
The most relevant microstructural elements in martensitic structure are
the thin laths (their width can be less than
0.1 µm, the dislocation density
generated during quenching, the fine carbide precipitation occurring during
tempering, prior austenitic grains and of course, the chemical composition
and the crystal structure of the martensitic matrix. Though some investi-
gations of martensitic steel cyclic softening were carried out [3, 4, 5, 6],
quantitative evaluations of relevant microstructural elements responsible for
the good mechanical strength and fatigue resistance at high temperatures
Relationship Between Microstructure and Mechanical Properties of a 5% Cr Hot...
739
Figure 2.
Fatigue behaviour occurring during an isothermal fatigue test.
are not so often performed and published. However, it would be essential
to estimate evolutions of these parameters with time, temperature and strain
amplitude in order to take into account the fatigue resistance and behaviour in
the definition of heat treatment conditions. The ultimate intention of such a
study, which consists in understanding the interactions between microstruc-
ture and properties, is to ensure a good prediction of the cyclic behaviour [7]
in order to optimise tool conceptions and to derive a new life model based
on microstructural considerations.
A first step would be to constitute a clear correlation between the yield
stress and the microstructure. Several mechanisms contribute to the yield
stress of tempered martensitic steels. Even if we can discuss a long time on
the validity of the simple additive decomposition of the yield stress, several
successful attempts have been performed on steels [8, 9], and the general
equation of the following form is often quoted [8].
σ
y
= σ
0
+ σ
ss
+ σ
p
+ σ
d
+ σ
sg
+ σ
t
+ σ
hp
(1)
where σ
0
is the friction stress, σ
ss
is the solid solution strengthening, σ
p
is
the precipitation strengthening, σ
d
is the dislocation strengthening, σ
sg
is the
strengthening due to subgrains, σ
t
is the crystallographic texture strengthen-
ing and σ
hp
is the contribution of the grain (prior Austenitic grain and lath)

740
6TH INTERNATIONAL TOOLING CONFERENCE
boundary strengthening. Nevertheless, probably due to the complex mi-
crostructure of tempered martensitic steels, clear quantitative contributions
of each mechanism are infrequently determined.
In a previous study [1], we have noticed that prior austenitic grain size and
martensitic lath size are not influenced by second tempering temperatures
(between 580
◦
Cand 640
◦
C) and a fatigue total strain amplitude (
∆ε
t
<
1%
and 200
◦
C<T <550
◦
C). Conversely, TEM observations show a clear evo-
lution in both cases of carbide sizes and dislocation densities. The present
investigation deals with the evolution of individual contribution to strength-
ening of dislocations and precipitates with tempering temperatures and fa-
tigue loading.
The steel investigated and the experimental programme are presented in
the next part. Results are presented and discussed in the third part. The final
discussion is devoted to the first determinations of the contribution of car-
bides and dislocations to mechanical strength for the tempering temperatures
investigated and to the microstructural interpretation of cyclic softening.
STEEL INVESTIGATED AND EXPERIMENTAL PROCE-
DURE
The composition of the modified AISI H11 grade investigated is shown
in Table 1. Heat treatment consists in austenitizing for one hour followed
by air cooling, first tempering at 550
◦
Cfor two hours, second tempering
for two hours between 550
◦
Cand 640
◦
Cdepending on desired hardness. A
nital etch reveals a tempered martensitic structure with heterogeneous lath
sizes. An electrolytic chromic acid etch reveals prior austenitic grain. The
average diameter is 14 µm for 50 grains measured.
Table 1.
Mod. AISI H11 chemical composition (weight % )
C
Si
Mn
Ni
Cr
Mo
V
Fe
Mod. AISI H11
0.361
0.35
0.36
0.06
5.06
1.25
0.49
bal.
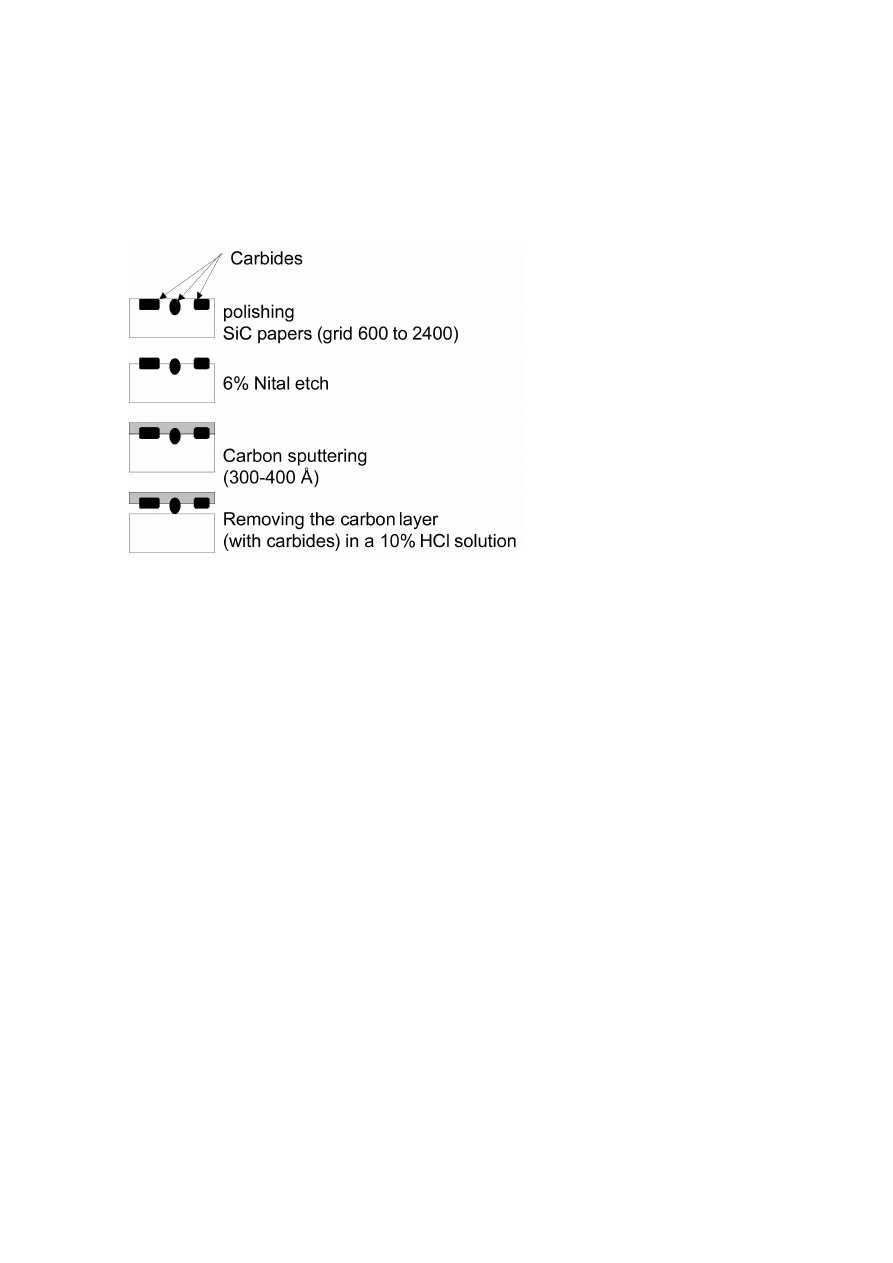
Microstructures were investigated by TEM. Observations were performed
on a JEOL 2010 and a Philips CM12 microscopes, the last one is equipped
with an Energy Dispersive X-ray analysis (EDX). Carbides were extracted
from the martensitic matrix using the replica technique (see Fig. 3). Diffrac-
Relationship Between Microstructure and Mechanical Properties of a 5% Cr Hot...
741
tion in the selected area mode (SAD) and EDX have been performed in
order to determine their chemical composition and crystal structure. Statis-
tics on carbide size were performed directly on TEM photos on nearly 300
carbides for each sample. Next, dislocations structure were studied on thin
foils prepared by classical electropolishing.
Figure 3.
Replica technique.
In order to evaluate carbides weight fraction, a technique of dissolution of
the martensitic matrix was used. Carbides were extracted by an electrolytic
method described in [10, 11]. Their crystal structure and chemical com-
position analyses (for each heat treatments) are performed using a Br¨ucker
D5000 diffractometer equipped with a Cu-Kα radiation and a graphite crys-
tal monochromator and scintillation counter.
X Ray diffraction experiments on the bulky material were also performed
with peak profiles measurements in order to evaluate dislocation densities by
using the modified Williamson-Hall plot and the modified Warren-Averbach
analysis [12, 13]. The diffraction peak profiles were measured in the E ¨otvos
University of Budapest by a special high resolution double-crystal diffrac-
tometer with negligible instrumental peak broadening [14].

742
6TH INTERNATIONAL TOOLING CONFERENCE
The Table 2 shows references and heat treatments of analysed samples.
Fatigue experiments conditions are described elsewhere [2].
Table 2.
Samples investigated
Ref.
Heat treatments
conditions and fatigue test
Thin foil
TEM
Carbides
extraction
/ TEM
Dissolution
carbide
weight
fraction
XRD on
carbide
powder
X Ray
profiles
analysis
A1
Annealed
X
X
X
A2
As quenched
X
X
X
X
A3
Tempered 550
◦
C
X
X
X
X
A4
Tempered
550
◦
C+ 580
◦
C
X
X
X
X
A5
Tempered
550
◦
C+ 600
◦
C
X
X
X
X
A6
Tempered
550
◦
C+ 620
◦
C
X
X
X
X
X
A7
Tempered
550
◦
C+ 640
◦
C
X
X
X
X
X
A8
A6 + ∆ε
t
= 1.5%
at 550
◦
C
X
X
A9
A6 + ∆ε
t
= 2%
at 550
◦
C
X
X
X
RESULTS AND DISCUSSION
THIN FOILS TEM OBSERVATIONS
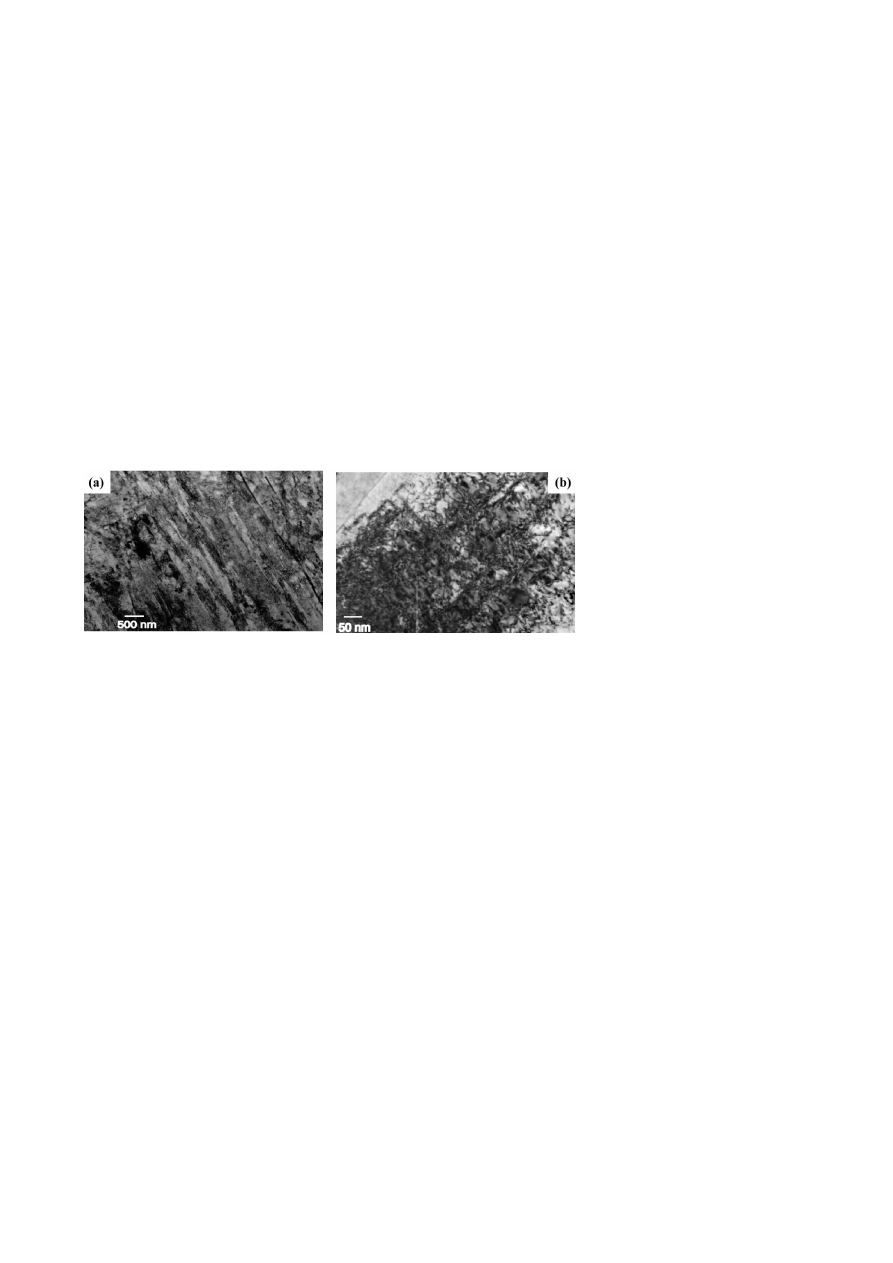
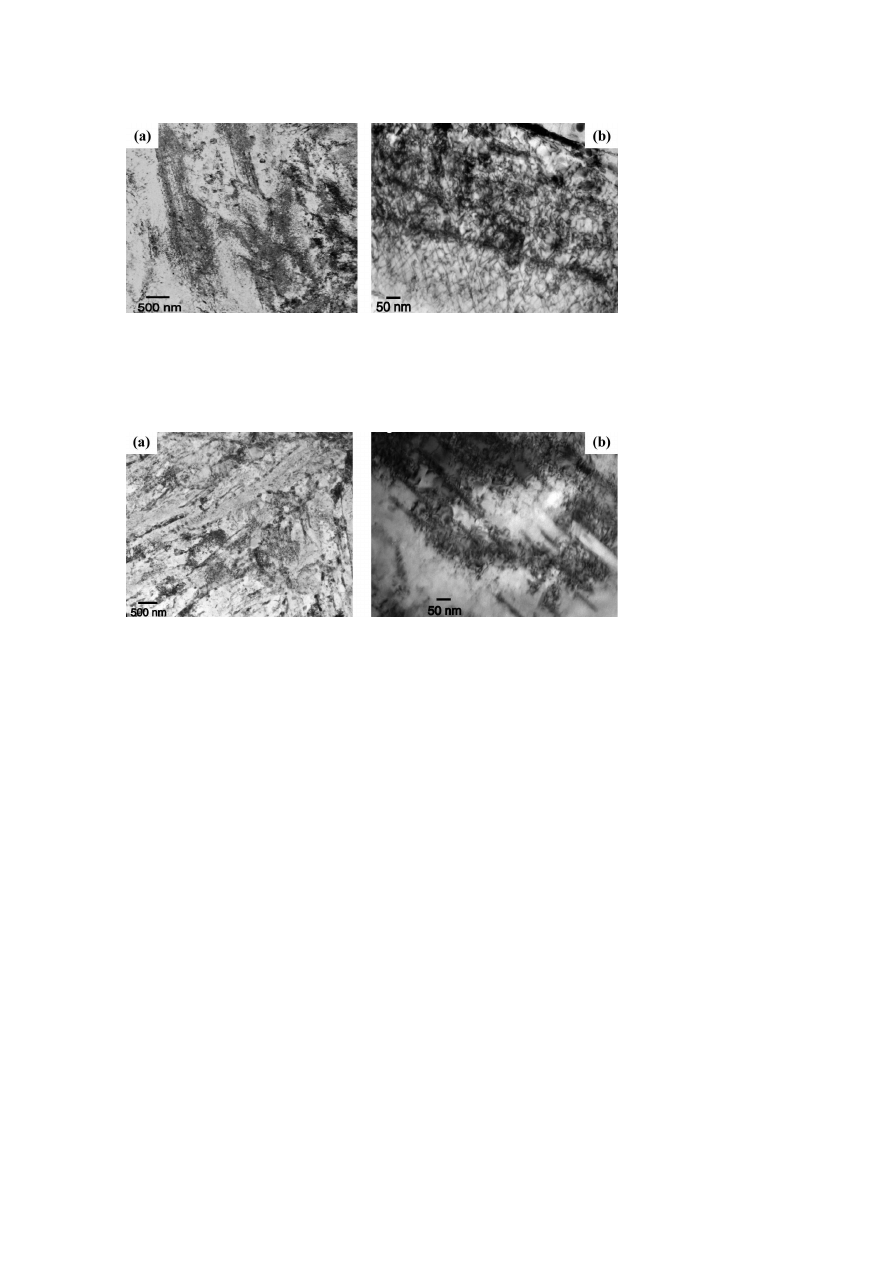
Bright field transmission electron photographs of samples A4, A6 and A7
are shown in Figs. 4 to 6. In Fig. 4 at low magnification, laths are generally
clearly separated by elongated iron carbides. In addition, the observations
of thin foils show a high density of intralath entangled dislocations even for
high tempering temperatures (see Fig. 6). Consequently, the identification
of the individual dislocations (Burgers vector and slip plane) and density
evaluation becomes very difficult using the classical TEM method. Prior to
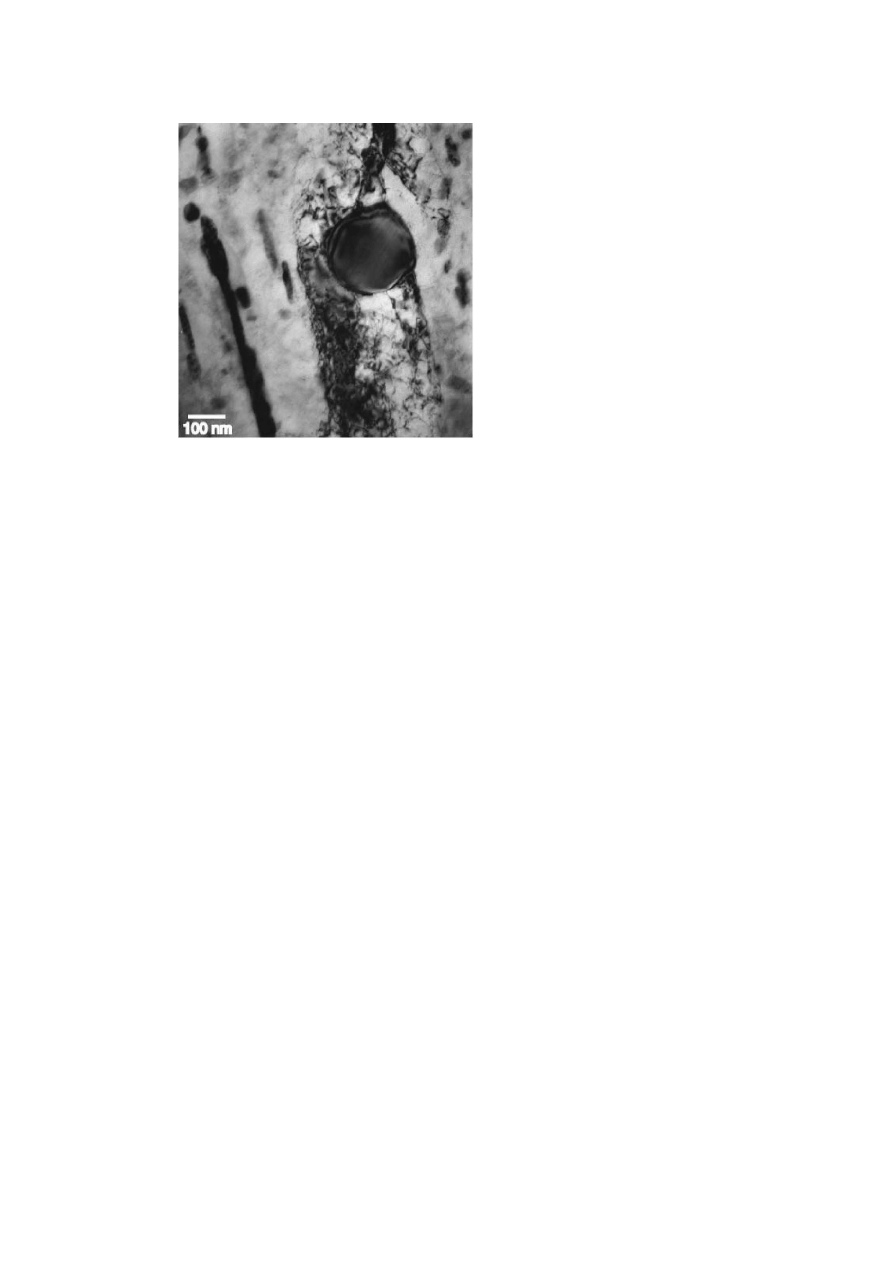
fatigue testing, dislocation distribution is quite homogeneous on the whole
even if, at a nanometric scale, a high density of dislocations was observed
near lath boundaries and around carbides (see Fig. 7). To compare dislo-
Relationship Between Microstructure and Mechanical Properties of a 5% Cr Hot...
743
cation structures obtained at different tempering temperatures qualitatively,
the observations were performed in the same crystallographic orientation
conditions ~
g
= [1¯
10 ]. Lath lightening is observed when second tempering
temperature increases. Therefore, recovery of the microstructure is stated by
a clear decrease of the dislocation density. This effect is strongly increased
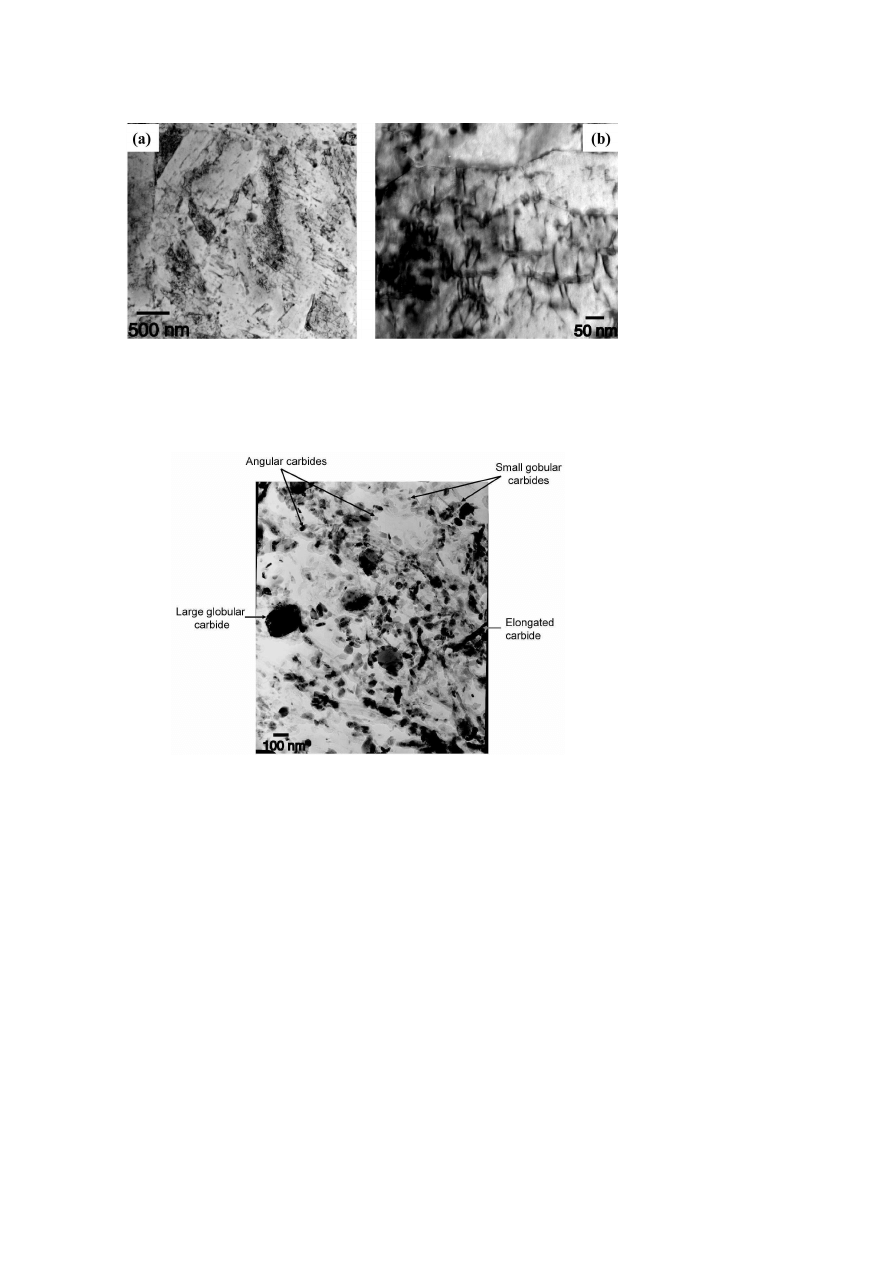
by the application of a cyclic strain (see Fig. 8)and a strong reduction of the
intralath dislocation density is observed after a fatigue test. As the disloca-
tion tangle is crushed during the fatigue test, such a configuration promotes
a free dislocation movement between lath boundaries or carbides. The free
slip distances are therefore probably increased by dislocation annihilation
stated by lath lightening. This decrease of dislocation density seems to be
one of the main mechanisms for cyclic softening. Nevertheless, dislocation
annihilation is strongly heterogeneous and seems to take place in the bigger
laths (breadth nearly > 0.3 µm). In addition, dislocation cell development
generally observed in tempered martensitic stainless steels after fatigue [5]
does not seem to take place in the 5% Cr steel even for the highest total strain
amplitude investigated.
Figure 4.
Bright field TEM micrographs of dislocation structure in tempered steel at
550
◦
C(2 hours) and 580
◦
C(2 hours) (sample A4). (a) Low magnification, (b) high magni-
fication : intralath dislocation structure ~
g
= [¯
110 ].
CARBIDES TEM OBSERVATIONS
Carbides extracted from the martensitic matrix were observed at TEM
(see Fig. 9). Crystal structure and chemical composition were analysed by
electronic diffraction and EDX. For all tempering conditions (samples A3
744
6TH INTERNATIONAL TOOLING CONFERENCE
Figure 5.
Bright field TEM micrographs of dislocation structure in tempered steel at
550
◦
C(2 hours) and 620
◦
C(2 hours) (sample A6). (a) Low magnification, (b) high magni-
fication : intralath dislocation structure ~
g
= [¯
110 ].
Figure 6.
Bright field TEM micrographs of dislocation structure in tempered steel at
550
◦
C(2 hours) and 640
◦
C(2 hours). (sample A7). (a) Low magnification, (b) high mag-
nification : intralath dislocation structure.
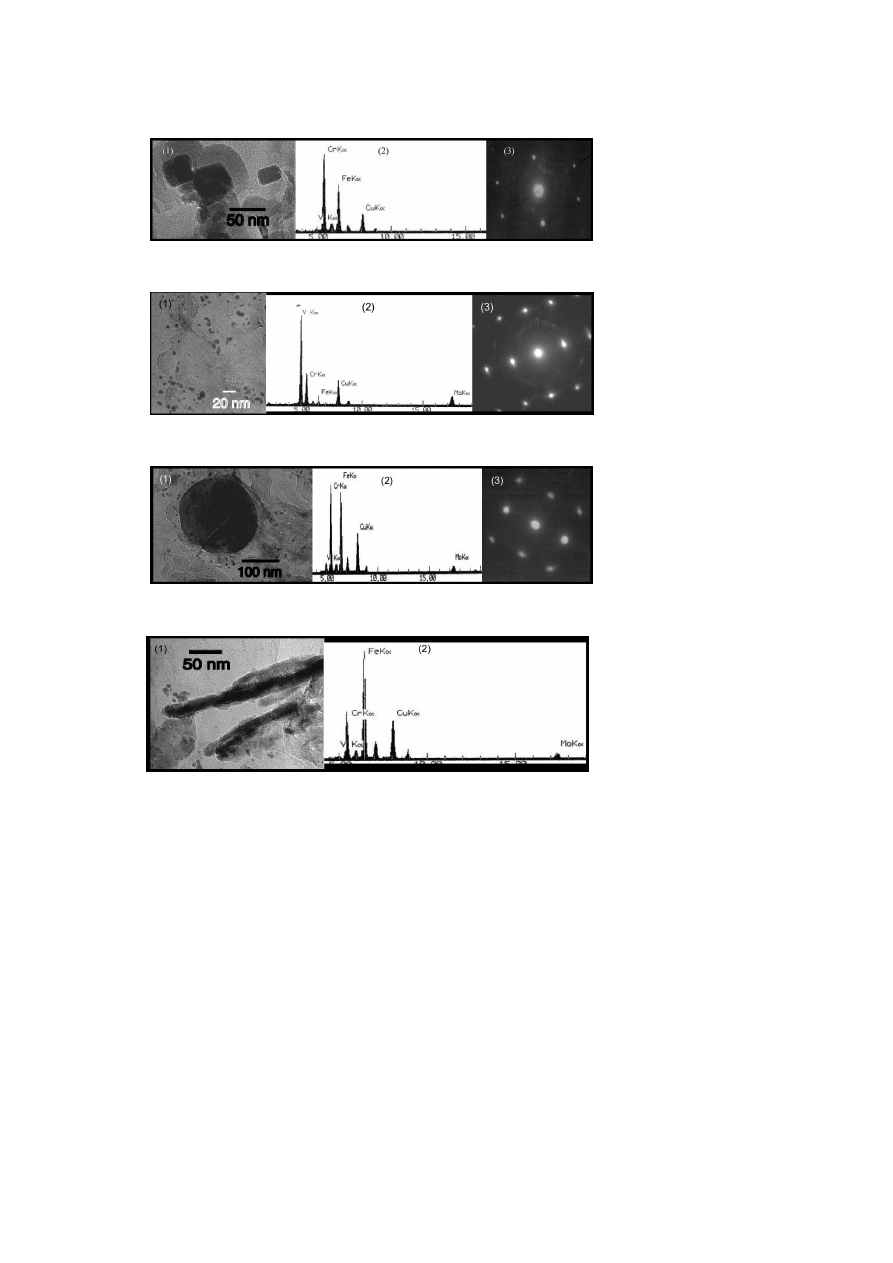
to A7), four types of carbides were found depending on their morphology
(see figures 10(a) – 10(d)):
1) Angular and elongated intralath carbide: M
7
C
3
Chromium iron carbide,
Hexagonal structure
Relationship Between Microstructure and Mechanical Properties of a 5% Cr Hot...
745
Figure 7.
Bright field TEM micrographs of dislocation structure in tempered steel at
550
◦
C(2 hours) and 640
◦
C(2 hours) (sample A7), pinning of dislocations on a large carbide.
2) Globular intralath carbide: MC vanadium carbide, Face Centred Cubic
(FCC) structure. Small size = secondary carbides, large size (100 nm –
300 nm) = carbides not dissolved during the austenitization
3) Globular intralath carbide: M
23
C
6
Chromium iron carbide, FCC struc-
ture, only important size (100 nm – 300 nm) = carbides not dissolve dur-
ing the austenitization
4) Elongated carbides situated at lath boundaries: M
3
C Iron chromium
carbide, Orthorhombic structure (determined by XRD)
Statistics on carbide size are shown in tables 3 and 4. Three different
populations were identified after tempering:
1) Small sized carbides MC and M
7
C
3
types with an average size near 6 nm.
This population is always found for all tempering conditions.
2) Middle sized carbides, mainly M
7
C
3
type, with an average size near 30–
40 nm. This population is found for tempering temperatures between
600
◦
Cand 640
◦
C.
746
6TH INTERNATIONAL TOOLING CONFERENCE
Figure 8.
Bright field TEM micrographs of the dislocation structure after a fatigue test at
550
◦
C(
∆ε
t
= 2%) (sample A9). (a) Low magnification, (b) high magnification : intralath
dislocation structure ~
g
= [¯
110 ].
Figure 9.
TEM micrograph of the extracted carbides from a tempered steel at 550
◦
C(2
hours) and 620
◦
C(2 hours) (sample A6).

Relationship Between Microstructure and Mechanical Properties of a 5% Cr Hot...
747
3) Scarce large M
23
C
6
and MC type carbides with an average size > 100 nm.
This population is found for all tempering conditions and also in the as
quenched sample (A2). These carbides are probably not dissolved during
the austenitization. As these carbides were so scarcely encountered (less
than 6/300), we did not take this population into account in the statistics.
Table 3.
Statistics on carbide size
Sample
Number
of
carbides
Average
size (nm)
Standard
deviation
Student law: 99%
confidence interval
on the average size
A3
293
6.42
2.97
5.97< m < 6.87
A4
291
6.14
4.10
5.52< m < 6.76
A5
259
6.97
2.32
6.60 < m < 7.34
A6
224
6.61
4.13
5.90 < m < 7.32
A7
188
5.81
2.95
5.26 < m < 6.36
A8
121
13.56
3.66
12.69 < m < 14.43
S
m
al
l
ca
rb
id
es
A9
78
15.19
3.20
14.23 < m < 16.15
A3
0
—
—
—
A4
0
—
—
—
A5
35
32.84
9.03
28.67 < m < 37.01
A6
76
34.38
11.8
30.79 < m < 37.96
A7
111
42.07
14.58
38.45 < m < 45.69
A8
179
33.03
10.14
31.08 < m < 34.98
M
id
d
le
ca
rb
id
es
A9
222
33.07
10.17
31.31 < m < 34.83
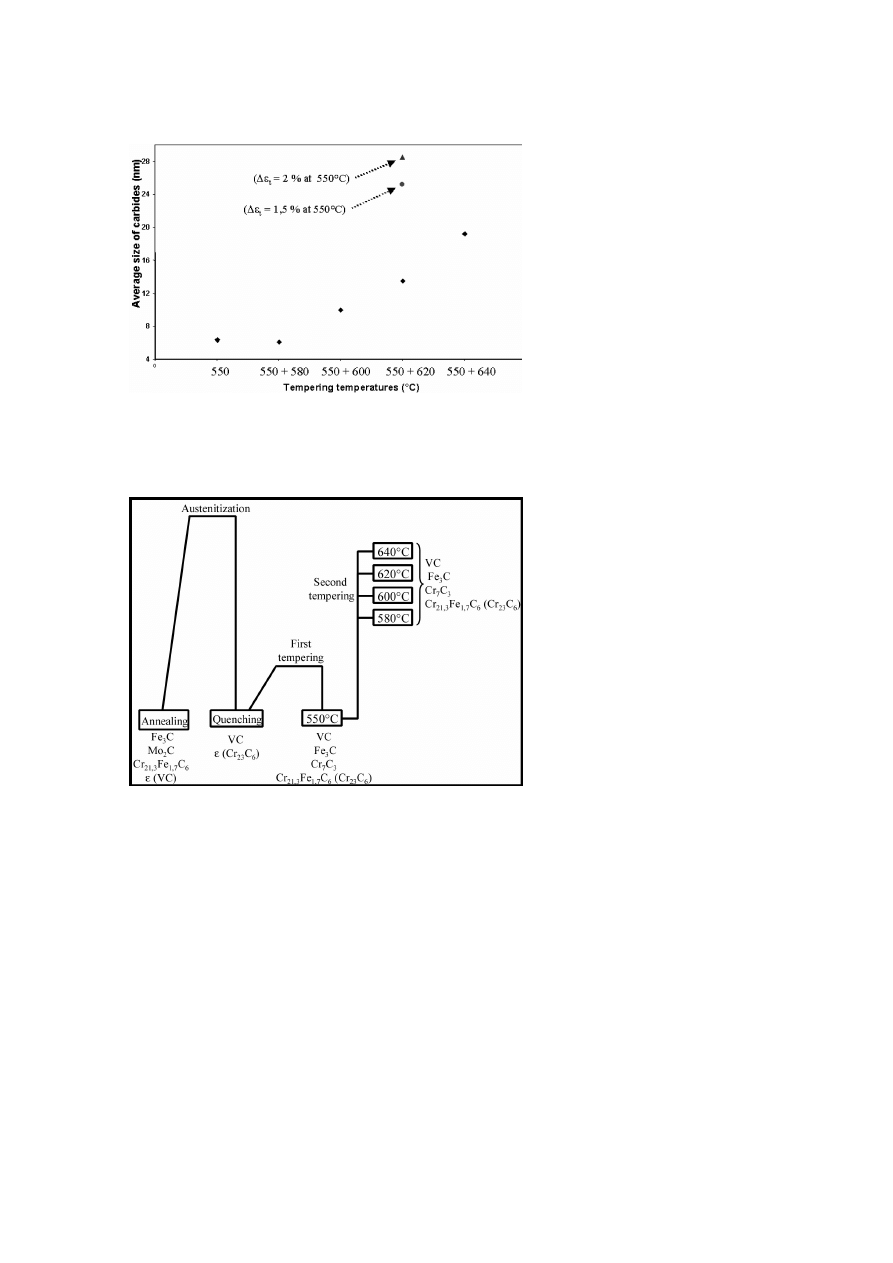
Evolution of average carbide size is shown in Fig. 11. Increase of the
average size is stated above 600
◦
Cwith the formation of the second popu-
lation. It is important to note that both populations have nearly a constant
average size for all the tempering conditions. The carbide growth is mainly
due to the increase of the amount of the second population carbides. After a
fatigue test at 550
◦
C, an increase of the average carbide size is observed (see
Fig. 11). As no coalescence of carbides was observed during a second tem-
pering at 580
◦
Cfor 2h (A3) compared to a single tempering at 550
◦
C(A2),
we can obviously conclude that this coalescence is induced by cyclic strain.

748
6TH INTERNATIONAL TOOLING CONFERENCE
Table 4.
See Fig. 11
Sample
Number of carbides
Average size (nm)
A3
293
6.42
A4
291
6.14
A5
294
10.05
A6
300
13.56
A7
299
19.27
A8
300
25.18
A9
300
28.48
Mechanisms of carbide growth during fatigue are still unclear and are now
investigated.
CARBIDES WEIGHT FRACTION
In order to get an estimation of the volume fraction of carbides; XRD
experiments on the bulk can be performed. Nevertheless, as major peaks
coming from carbides are generally situated near peaks coming from the
martensitic matrix, accurate calculations are difficult and time consuming.
Therefore, a technique of dissolution of the martensitic matrix was used in
order to assess carbide weight fractions and then carbide volume fractions
(see Tables 5 and 6). (* In each case, we assumed that all the carbon (C) or
all the alloying element (Cr, V) precipitates).
Table 5.
Theoretical maximal volume fraction of carbides
Carbides
M
3
C
M
7
C3
M
23
C
6
MC
Theoretical
maximal
volume fraction
∗
5.7% (C)
4.8% (C)
6.0%(Cr)
8.1% (V)
Carbides density
7.7
6.9
7.0
5.7
An increase of the weight fraction of carbides is observed for tempering
temperatures above the secondary hardening peak situated near 550
◦
C. So,
these results clearly show that formation of precipitates still occurs during

Relationship Between Microstructure and Mechanical Properties of a 5% Cr Hot...
749
Table 6.
Estimation of the volume fraction of carbides
Sample
A2
A3
A4
A5
A6
Weight
fraction
0.7%
3.4%
4.0%
5.5%
5.7%
Volume fraction
range
0.7%<f<1.0%
Average: 0.85%
3.5%<f<4.7%
Average: 4.1%
4.1%<f<5.5%
Average: 4.8%
5.6%<f<7.6%
Average: 6.6%
5.9%<f<7.9%
Average: 6.9%
the second tempering. The formation seems to saturate for second tempering
temperatures above 600
◦
C(results at 640
◦
Care not available at that time).
X RAY DIFFRACTION
CARBIDES X-RAY ANALYSIS
Analysis of the X-Ray diffraction of carbides extracted from the marten-
sitic matrix, confirm and complete the TEM results. Figure 12 shows the
evolution of the carbide composition according to the heat treatment. So, the
annealed steel contains Mo
2
C, Fe
3
C, M
23
C
6
(M = Fe and Cr) and a small
ratio of VC. After quenching, only the vanadium carbide (VC) and a small
quantity of M
23
C
6
which are probably not dissolved during the austenitisa-
tion were found.
After the first and the second tempering, the X-ray analysis confirm the
presence of Fe
3
C, Cr
7
C
3
, M
23
C
6
(M = Fe and Cr) and trace of VC. Only
the annealed steel contains molybdenum carbides.
PEAK PROFILE ANALYSIS
Two different methods of diffraction profile analysis (modified Williamson-
Hall and modified Warren-Averbach) are tested. The classical Williamson-
Hall plot of the Full Widths at Half Maximum (FWHM) values of the first six
reflections shows a strong strain anisotropy, as can be seen in Fig. 13. The
same values of the FWHM are plotted according to the modified Williamson-
Hall procedure [15] and the intersection at K
= 0 gives the coherently
scattering domain size (see Fig. 14).
Table 7 shows the evolution of the coherently scattering domain size
with the heat treatment. The increase of the second tempering temperature
logically enlarges the coherently scattering domain size and the same ef-

750
6TH INTERNATIONAL TOOLING CONFERENCE
fect is observed after fatigue test. These conclusions are still in agreement
with TEM observations. However, quantitative results can be obtained with
this technique. Moreover, diffraction profile analysis allows getting more
information on the microstructure of the steel like dislocation structure (
[12, 13, 14, 15, 16]). For example, the comparison between samples after
quenching (A2) and after tempering (A7) shows quantitatively the decrease
of dislocations density from
95 · 10
14
m
−2
(A2) to
10 · 10
14
m
−2
(A7).
Therefore, diffraction profile analysis seems to be the most interesting
way to obtain coherently scattering domain size and dislocation structure in
such complex microstructures.
Table 7.
Average size of coherently scattering domains versus heat treatment and fatigue
loading
A4
A6
A6 +
∆ε
t
= 1.8%
CDD (nm)
560
1070
1990
CONCLUSION
Transmission electron microscopy and X Ray diffraction are two com-
plementary ways of investigation giving considerable information on these
complex martensitic structures. Quantitative data on carbides and only qual-
itative knowledge on deformation mechanisms and structures of dislocations
are available by TEM. Conversely, relevant quantitative indirect information
can be obtained by XRD on both carbides and dislocation structures.
Results have shown that decrease of dislocations density and growth of
carbides are two mechanisms involved in the decrease of the yield stress
during a fatigue test and a second tempering. Nevertheless, possible mod-
ification of the contribution of the solid solution strengthening or potential
subgrains formation in highly deformed material has not been investigated.
These evaluations can constitute an interesting outlook to this work.
ACKNOWLEDGMENTS
Authors gratefully acknowledge the Aubert & Duval company for pro-
viding samples and financial support. We would like to thank Prof. T. ´
Ungar
from the E ¨otvos University of Budapest for providing X Ray experiments

Relationship Between Microstructure and Mechanical Properties of a 5% Cr Hot...
751
and peak profile analysis results and for so many precious advises. Special
thanks are also given to Mr A. Grellier and Mrs M .F. Gervais from the
Aubert & Duval company, Prof. A. Coujou and Dr A. Couret from the Cen-
tre d’Elaboration de Mat'ériaux et d’Etudes Structurales, CNRS in Toulouse
for fruitful discussions.
REFERENCES
[1] D. DELAGNES, in " Isothermal fatigue behaviour and lifetime of a 5%Cr hot work
tool steel around the LCF-HCF transition " (Ph.D. Thesis, Ecole Nationale Sup´erieure
des Mines de Paris, March 1998).
[2] D. DELAGNES, F. REZA¨I-ARIA, C. LEVAILLANT and A. GRELLIER, in Pro-
ceedings of the 5th International Conference on tool steels, Leoben, September 1999,
p.195.
[3] Z. HU and J. XIAO, in Proceedings of the 4th International Conference on Fatigue
and Fatigue Thresholds, Fatigue 90, Honolulu, 1990, p.469.
[4] K. KANAZAWA, K. YAMAGUCHI and K. KOBAYASHI, J. Mater. Sci. and Eng. 40
(1979) 89.
[5] J. B. VOGT, G. DEGALLAIX and J. FOCT, Fat. & Frac. of Eng. Mat. & Struc. 11
(1988) 435.
[6] H. CHAI and Q. FAN, in Proceedings of the 5th International Conference on Fatigue
and Fatigue Thresholds, Fatigue 93, Montreal, 1993, p.195.
[7] Z. ZHANG, D. DELAGNES and G. BERNHART, Int. Journal of Fatigue, article in
press, 2002.
[8] S. MAROPOULOS, J. D. H. PAUL and N. RIDLEY, J. Mater. Sci. and Tech. 9 (1993)
1014.
[9] L. A. NORSTR ¨
OM, J. Met. Sci. (1976) 429.
[10] C. KIM, V. BISS and W. F. HOSFORD, J. Met. Trans. A. 13A (1980) 1982
[11] F. KAYSER and M. COHEN, J. Met. Prog. 61 (1952) 79.
[12] T. UNG ´
AR and A. BORB ´
ELY, J. Appl. Phys. Lett. 69 (1996) 3173.
[13] T. UNG ´
AR, A. BORB ´
ELY, G. R. GOREN-MUGINSTEIN, S. BERGER and A. R.
ROSEN, Acta Met., NanoStructured Mat. 11 (1999) 103.
[14] J. GUBIZCA, J. SZ ´
EPV ¨
OLGYI, I. MOHAI, G. RIB ´
ARIK and T. UNG ´
AR, J. Mater.
Sci. 35 (2000) 3711.
[15] T. UNG ´
AR, I. DRAGOMIR, ´
A. R ´
EV ´
ESZ and A. BORB ´
ELY, J. Appl. Cryst., Vol.32,
(1999), p.992.
[16] T. UNG ´
AR, J. GUBICZA, G. RIB ´
ARIK and A.BORB ´
ELY, J. Appl. Cryst., Vol.34,
(2001), p.1
752
6TH INTERNATIONAL TOOLING CONFERENCE
(a) TEM micrograph of M
7
C
3
carbide (1), corresponding EDS spectra analysis (2), and
electron diffraction pattern (3).
(b) TEM micrograph of MC carbide (1), corresponding EDS spectra analysis (2), and electron
diffraction pattern (3).
(c) TEM micrograph of M
23
C
6
carbide (1), corresponding EDS spectra analysis (2), and
electron diffraction pattern (3).
(d) TEM micrograph of M
3
C carbide (1), corresponding EDS spectra analysis (2).
Figure 10.
Relationship Between Microstructure and Mechanical Properties of a 5% Cr Hot...
753
Figure 11.
Evolution of the average size of carbides with second tempering temperatures
and influence of cyclic plasticity.
Figure 12.
Precipitation sequence in a Mod. AISIH11 steel.
754
6TH INTERNATIONAL TOOLING CONFERENCE
Figure 13.
The FWHM in the classical Williamson-Hall plot applied on the A4 sample.
Figure 14.
The FWHM according to the modified Williamson-Hall plot applied on the A4
sample.
Wyszukiwarka
Podobne podstrony:
32 425 436 Ifluence of Vacuum HT on Microstructure and Mechanical Properties of HSS
Effect of heat treatment on microstructure and mechanical properties of cold rolled C Mn Si TRIP
Microstructure and mechanical properties of plasma sprayed H
Fibrillar Structure and Mechanical Properties of Collagen
2012 On the Relationship between Phonology and Phonetics
Tabaczyński relationship between history and archaeology
Prezelj, Istok Relationship between Security and Human Rights in Counter Terrorism A Case of Introd
relations between parents and children
Pitts, Relations between Rome and the German Kings
The Multiple Relations Between Creativity and Personality
Relationship Between Dissociative and Medically Unexplained Symptoms in Men and Women Reporting Chil
Evolutionary relationships between S cerevisiea and other fungal species
1929 A Relation Between Distance and Radial Velocity Among Extra Galactic Nebulae Hubble
Bearden Misc Moore Relationship between Efficiency and Coefficient of Performance (www cheniere o
37 509 524 Microstructure and Wear Resistance of HSS for Rolling Mill Rolls
Mechanical Properties of Native and Cross linked Type I Collagen Fibrils Yang
więcej podobnych podstron