
CWB-1/2007
1
Prof. Andrzej Małecki
Akademia Górniczo-Hutnicza w Krakowie, Wydział Inżynierii Materiałowej i Ceramiki
Globalne ocieplenie a emisja gazów cieplarnianych przez kraje
Unii Europejskiej
Czy Europa uratuje świat przed katastrofą?
Global warming and emission of greenhouse gases in the European
Union Countries
1. Introduction
When somebody asks the Google a question: “global warming”,
the answer will contain 22 million references. Certainly nobody is
able to look at all these pages, but their number show dramati-
cally the range of the problem, and may also show that the topic
is “fashionable”. However, if we assume that somebody (as the
author of this paper did) attempts to read a few thousand of these
pages, limiting this study only to the pages of “high confi dence”.
What image of climatic changes emerges from this survey ?
By the end of the 21st century the medium temperature on the Earth
will increase by 5.8
o
C. Or by 1.4
o
C. The level of seas and oceans
will increase by 88 cm. Or by 9 cm (1). The number of catastrophic
atmospheric phenomena, such as rainfalls, storms and hurricanes,
will increase dramatically. Or not (2, 3). The apocalypse arrives.
The ice caps of the Earth and mountain glaciers will melt (4). Fresh
water of ice of the Arctic Zone will disturb the Gulf Stream, one of
the most important factors shaping the climate in Europe, which
will cause that the next continental glacier will cover Scandinavia
and Central Europe. Or not. Malaria and other diseases (5) will
spread on the increasing number of lands. The deserts will occupy
30% of land surface. Or less. Hunger will arrive. According to dif-
1. Wprowadzenie
Jeżeli ktoś internetowej wyszukiwarce Google zada pytanie: „global
warming” to odpowiedź będzie zawierała odnośniki do blisko 22
milionów adresów. Oczywiście nikt nie jest w stanie zajrzeć na
wszystkie te strony, ale ich liczba świadczy dobitnie o skali zain-
teresowania problemem, a może także świadczy i o tym, że temat
jest modny. Załóżmy jednak, że ktoś (tak jak autor tego artykułu
na przestrzeni kilku lat) zadał sobie trud przejrzenia kilku tysięcy
takich stron, ograniczając się w tym przeglądzie wyłącznie do
stron „wysokiego zaufania”. Jaki obraz zmian klimatycznych i ich
konsekwencji wyłania się z tego przeglądu?
Do końca XXI wieku średnia temperatura Ziemi podniesie się
o 5,8°C. Albo o 1,4°C. Poziom mórz i oceanów wzrośnie o 88
cm. Albo o 9 cm (1). Wzrośnie gwałtownie liczba katastrofalnych
zjawisk atmosferycznych takich jak opady, sztormy i huragany. Albo
nie wzrośnie (2, 3). Nadchodzi Apokalipsa. Topnieją czapy lodowe
Ziemi i górskie lodowce (4). Słodkie wody z lodów Arktyki zakłócą
Prąd Zatokowy (Golfsztrom), jeden z najważniejszych czynników
kształtujących klimat w Europie, co spowoduje, że kolejny raz lą-
dolód pokryje Skandynawię i Europę Środkową. Albo nie pokryje.
Na coraz większych terenach zacznie szerzyć się malaria i inne
MIĘDZYNARODOWE CZASOPISMO NAUKOWE
POŚWIĘCONE ZAGADNIENIOM CHEMII
I TECHNOLOGII MATERIAŁÓW WIĄŻĄCYCH I BETONU
ROK XII/LXXIV
STYCZEŃ – LUTY 2007 r.
Nr 1
Organ Stowarzyszenia Producentów Cementu

2
CWB-1/2007
choroby (5). Pustynie zajmą około 30% powierzchni lądów. Albo
mniej. Nadejdzie głód. Według różnych ocen 25% ssaków i 12%
gatunków ptaków wyginie bezpowrotnie (6-8). Cały ten katastro-
fi czny scenariusz ma być wynikiem globalnego ocieplenia klimatu
przejawiającego się we wzroście średniej rocznej temperatury
atmosfery i powierzchni Ziemi, co obserwujemy od drugiej połowy
XVIII wieku (9-11). Dyskusja na ten temat trwa już od dziesięcioleci
i przybrała na sile w ostatnich 15-20 latach. Pojawiają się nowe
scenariusze, nowe opinie; dyskusje zwolenników i przeciwników
tych opinii i scenariuszy stają się coraz gorętsze (12, 13). Główny
spór idzie nawet nie o to czy globalne ocieplenie jest faktem, ale
o to jakie są przyczyny tego ocieplenia i postępującej zmiany
klimatu (14, 15).
Wątpliwości są ale jedno nie ulega wątpliwości - gwałtownie rośnie
liczba tych, którzy twierdzą, że zmiany klimatu są wynikiem dzia-
łalności człowieka i już pod koniec XXI wieku skutki tego nasza
cywilizacja boleśnie odczuje (16-19).
Na czym ta działalność polega? Przede wszystkim na rosnącej
emisji do atmosfery tzw. gazów cieplarnianych (GHG – Greenhou-
se Gas), z których za najważniejsze uważane są ditlenek węgla
CO
2
, metan CH
4
, tlenek diazotu N
2
O oraz chloro- i fl uoropochod-
ne węglowodorów takie jak CCl
3
F (CFC-11) i CCl
2
F
2
(CFC-12)
(20-22). Emisja ta jest wynikiem szeroko pojętej, rozwijającej się
działalności gospodarczej i konsumpcyjnej społeczeństw (23, 24),
związanej przede wszystkim ze spalaniem paliw kopalnych: węgla,
ropy naftowej (czy jej pochodnych) i gazu ziemnego, produkcją
żywności i przemysłem chemicznym. Szybki postęp cywilizacyjny,
zdaniem zwolenników poglądu o wpływie człowieka na klimat
Ziemi, doprowadził do wzrostu stężenia gazów cieplarnianych
w atmosferze, w stosunku do okresu przedindustrialnego (Tab.
1), co stało się przyczyną wzrostu średniej temperatury atmosfery
i powierzchni Ziemi w wyniku tzw. efektu cieplarnianego.
Nie wnikając w szczegóły, które każdy czytelnik może łatwo znaleźć
w niezliczonej ilości literatury, powiedzmy tylko w uproszczeniu, że
efekt ten odkryty w 1824 roku przez Josepha Fouriera i analizowa-
ny szczegółowo przez szwedzkiego chemika Svante Arrheniusa
polega na absorpcji podczerwonego promieniowania
docierającego ze Słońca przez cząsteczki gazów
cieplarnianych zawartych w atmosferze, które ulegają
tzw. wzbudzeniu (26, 27). Wzbudzone cząsteczki drogą
kolejnych absorpcji i emisji wymieniają energię z innymi
cząsteczkami nie będącymi w stanie wzbudzenia, co
prowadzi do „zatrzymywania” pewnej ilości energii
w atmosferze hamując jej odpływ w przestrzeń kos-
miczną. Gdyby atmosfera Ziemi nie zawierała gazów
cieplarnianych w ogóle, wtedy średnia temperatura
powierzchni Ziemi wynosiłaby ok. -30°C i nasza planeta
byłaby skuta wiecznym lodem (28).
Za najważniejszy gaz cieplarniany, który jednocześnie
produkowany jest w znaczących ilościach w wyniku
działalności człowieka (29), uważa się CO
2
(30-33).
Obecnie atmosfera zawiera około 750 Tg węgla (1 te-
ferent estimations 25% of mammals and 12% of bird species will
become extinct irreparably (6-8). This entire catastrophic scenario
is to be the result of global warming of climate which will manifest
in the increase of medium yearly temperature of atmosphere and
the Earth surface which we have been observing since the second
half of the 18
th
century (9-11). The discussion on this topic has
been lasting already for decades and has grown in strength in the
last 15-20 years. The new scenarios appear, new opinions; the
discussions of supporters and opponents of these opinions and
scenarios become more and more hotter (12, 13). The main dispute
is even not if the global warming is a fact, but what the reasons of
this warming and progressive change of climate are (14, 15).
There are doubts, but one is evident – a violent increase of the
number of people who claim that the climate changes are the result
of human activity and already by the end of 21
st
century the effects
of this activity will be painful for our civilization (16-19).
What does this activity consist in? First of all, in increasing the emis-
sions to the atmosphere. The so called greenhouse gas (GHG),
of which the most important are carbon dioxide CO
2
, methane
CH
4
, dinitrate oxide N
2
O and chlorinated, fl uorinated derivatives
of hydrocarbons, such as CCl
3
F (CFC-11) and CCl
2
F
2
(CFC-12)
(20-22). These emissions are the result of widely meant expanding
economic and consumption activities of human societies (23, 24),
linked fi rst of all with the combustion of fossil fuels: coal, crude
oil (and its derivates) and earth gas, with the production of food
as well as chemical industry. Rapid progress of civilization, ac-
cording to the opinion of supporters of the view about the human
infl uence on the Earth climate, resulted in the increase of green
house gas concentration in the atmosphere, in comparison with
the pre-industrial period (Table 1) which caused the increase of
medium temperature of atmosphere and the Earth surface as the
result of greenhouse effect. Not entering into details which every
reader can easily fi nd in innumerable amounts of literature, it can
be simply stated that this effect discovered in 1824 by Joseph
Fourier and analyzed in details by the Swedish chemist Svante
Arrhenius consists in absorption of infra-red radiation arriving
from the Sun by molecules of GHG contained in atmosphere,
Tablica 1 / Table 1
STĘŻENIE GAZÓW CIEPLARNIANYCH W ATMOSFERZE ZIEMI W CIĄGU OSTAT-
NICH 250 LAT (25)
GREENHOUSE GAS CONCENTRATION IN EARTH ATMOSPHERE DURING LAST
250 YEARS (25)
gaz cieplarniany
GHG
stężenie/concentration
% zmiany
% of change
1750
2003
CO
2
280 ppm
*)
376 ppm
34%
CH
4
0,71 ppm
1,79 ppm
152%
N
2
O
270 ppb
**)
319 ppb
18%
chlorofl uorowęglowodory
chlorofl uorohydrocarbons
0
880 ppt
-
*)
części na milion/parts per million
**)
części na miliard/parts per billion
CWB-1/2007
3
ragram (Tg) = 10
12
g) i każdy
miliard ton węgla wprowadzony
do atmosfery w postaci CO
2
po-
winien zwiększać zawartość CO
2
o około 0,5 ppm pod warunkiem,
że CO
2
nie jest absorbowany w
środowisku (34, 35). W istocie
przynajmniej 40-50% CO
2
wpro-
wadzonego do atmosfery ulega
absorpcji w wodach oceanicz-
nych (36, 37), a także jest po-
chłaniane w procesie fotosyntezy
(38). Trzeba jednak stwierdzić, że
problem oceny wielkości absorp-
cji CO
2
przez środowisko ciągle
budzi wiele kontrowersji (39-42).
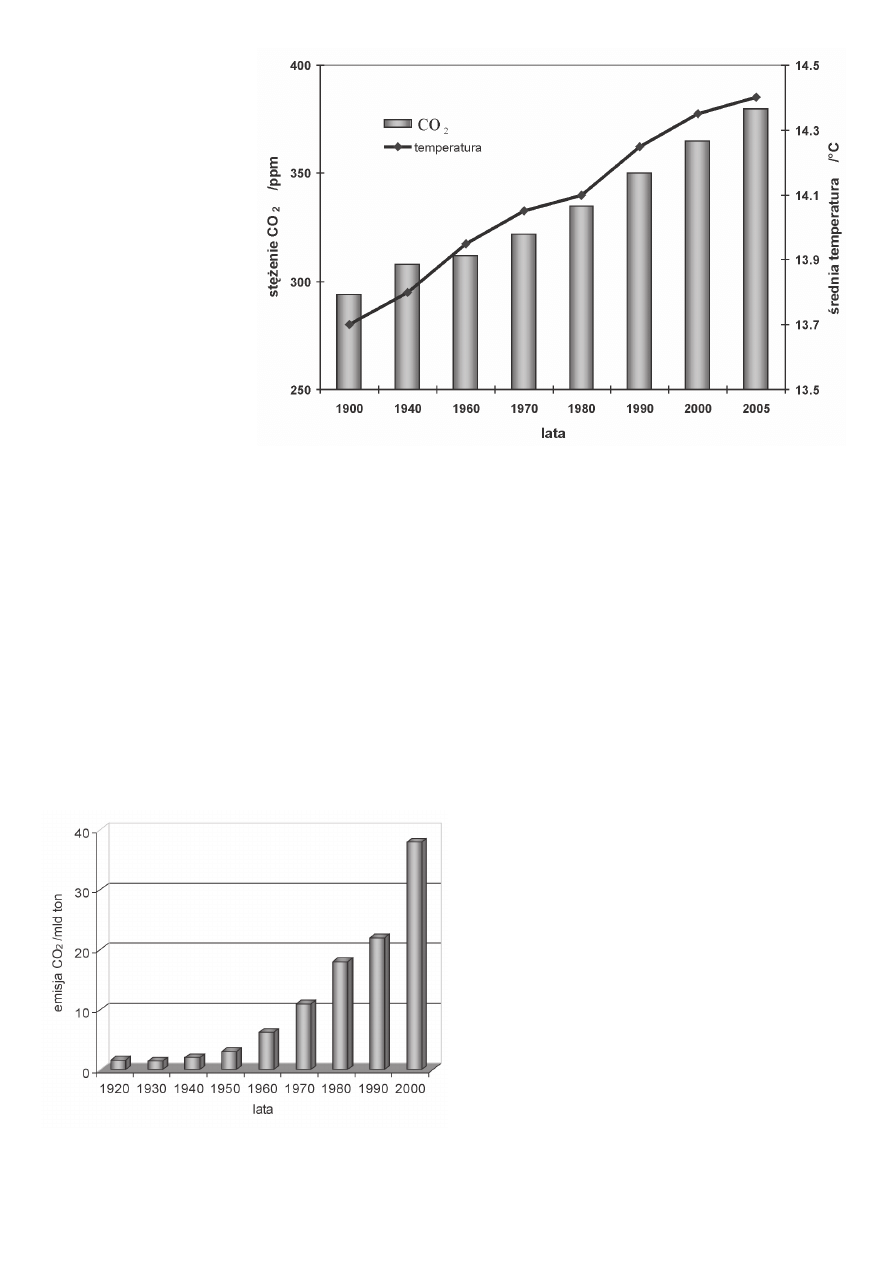
W ciągu XX wieku odnotowano
istnienie korelacji pomiędzy śred-
nią temperaturą Ziemi a zawar-
tością CO
2
w jej atmosferze co
ilustrują wykresy przedstawione
na rysunku 1 sporządzone na
podstawie danych zawartych
w publikacjach (43, 44).
Jeżeli dodatkowo zauważymy (rys. 2.), że w tym samym okresie
istotnie rosła całkowita emisja CO
2
do atmosfery, przede wszystkim
w wyniku spalania węgla i węglowodorów (as), to istnienie korelacji
w układzie: antropogeniczna produkcja CO
2
– średnia temperatura
Ziemi, stanie się właściwie oczywiste co skłania do wniosku, że to
działalność człowieka jest przyczyną wzrostu średniej temperatury
naszego globu.
Ten właśnie punkt widzenia zyskał sobie bardzo wielu zwolenni-
ków i w konsekwencji stał się punktem wyjścia do działań, których
celem ma być przynajmniej ograniczenie tego efektu i uniknięcie
w ten sposób katastrof, które nam grożą w wyniku nadchodzących
which underwent the so called activation (26, 27). The activated
molecules, by consecutive absorption and emission, exchange
energy with other, not activated, molecules and this fact leads to
“keeping” some quantity of energy in the atmosphere, restraining
its outfl ows in the space. If the Earth atmosphere did not contain
GHG at all, then the average temperature of Earth surface would
be about – 30
o
C and our planet would be frozen (28).
CO
2
is considered the most important GHG which is simultane-
ously produced in large quantities as a result of human activities
(29) (30-33). Currently, the atmosphere contains about 750 Tg of
carbon (1 teragram (Tg) = 10
12
g) and each billion ton of carbon
introduced to the atmosphere in the form of CO
2
should increase
the content of CO
2
of about 0.5 ppm under the condition that CO
2
is not absorbed in the environment (34, 35). In fact 40-50% CO
2
at
least introduced to the atmosphere is absorbed by the oceans (36,
37) and also in the process of photosynthesis (38). However, it must
be stated that the problem of evaluation of absorption quantity of
CO
2
by the environment continually arouses many controversies
(39-42). In the 20
th
century the correlation was found between the
average Earth temperature and CO
2
content in its atmosphere
which is illustrated by the diagrams shown in Fig. 1, elaborated
on the basis of the literature data (43, 44).
If, additionally, we notice (Fig. 2) that in the same period the total
emission of CO
2
to the atmosphere was increasing, mainly due to
the combustion of coal and hydrocarbons (45), then the correlation
in the system: anthropogenesic CO
2
production – average Earth
temperature as a matter of fact became obvious which contributes
to the conclusion that the human activity is the reason of the Earth
average temperature increase.
This is why this point of view gained so many supporters and, in
consequence, it became the starting point of the actions whose
Rys. 1. Korelacja pomiędzy zawartością CO
2
w atmosferze a średnią temperaturą Ziemi
Fig. 1. Correlation between CO
2
content in the atmosphere and average Earth temperature
Rys. 2. Całkowita emisja CO
2
do atmosfery w latach 1920-2000
Fig. 2. Total CO
2
emission to the atmosphere in the years 1920-2000

4
CWB-1/2007
zmian klimatycznych (46). Zaczęło od tego, że Światowa Orga-
nizacja Meteorologiczna (WMO) i Program Środowiska Narodów
Zjednoczonych (UNEP) powołały w 1988 roku tzw. Międzyrządowy
Panel ds. Klimatu. (IPCC – Intergovernmental Panel on Climate
Change) mający za zadanie bliższe rozpoznanie zależności ob-
serwowanych zmian klimatycznych od działalności człowieka (47).
W 1988 roku, po raz pierwszy w historii, Zgromadzenie Ogólne
ONZ zajęło się sprawą zmian klimatu, przyjmując (z inicjatywy
rządu Malty) rezolucję w sprawie Ochrony globalnego klimatu
dla obecnego i przyszłych pokoleń. W dwa lata później ukazał
się Pierwszy Raport IPCC, który potwierdził istnienie faktycznego
zagrożenia zmian klimatu i wezwał do opracowania globalnego
porozumienia zajmującego się tym problemem.
Utworzono Międzyrządowy Komitet Negocjacyjny, który przygoto-
wał Ramową Konwencję ONZ w sprawie Zmian Klimatu (UNFCCC)
(48, 49), którą Zgromadzenie Ogólne ONZ w grudniu 1990 uznało
za podstawę do rozpoczęcia procesu międzynarodowych nego-
cjacji w sprawie zmian klimatu.
9 maja 1992 rządy przyjęły Ramową Konwencję ONZ w sprawie
Zmian Klimatu (UNFCCC) (50). Na tak zwanym Szczycie Ziemi
w Rio de Janeiro (51), 4 czerwca 1992, Konwencję podpisały
154 państwa w tym Polska (52). Szybko zdano sobie sprawę, że
Konwencja nie zajęła się problemami zmian klimatu w sposób
zadawalający i rozpoczęto nową turę rozmów mających na celu
zaostrzenie i uszczegółowienie zobowiązań państw uprzemysło-
wionych. 11 grudnia 1997 - podczas trzeciej Konferencji Stron
Konwencji, jaka odbyła się w Kioto w Japonii przyjęty został tzw.
Protokół z Kioto (53-55). Protokół został podpisany przez 84 pań-
stwa (56), szereg państw nie zdecydowało się na to ze względu
na ogólnikowość zapisów i brak zasad działania mechanizmów
prowadzących do wypełniania zobowiązań. Protokółu nie podpisały
między innymi Stany Zjednoczone. Podpisanie protokółu ozna-
czało zobowiązanie do ograniczenia emisji gazów cieplarnianych
w latach 2008-2012 o około 5% w stosunku do roku bazowego
(zwykle 1990) (57). Polska podpisała Protokół z Kioto i ratyfi kowała
go 13 grudnia 2002 roku (58). Podczas kolejnych Konferencji Stron
dokonano uszczegółowienia szeregu zapisów określając zasady
działania Protokółu. Polska na mocy Protokołu z Kioto zobowiązała
się do redukcji emisji gazów cieplarnianych w pierwszym okresie
(lata 2008-2012) o 6% w stosunku do roku bazowego 1988 (59).
Polska była także zobowiązana do wykazania istotnego postępu
w redukcji emisji już do roku 2005 (60-61). Działania Polski były
wynikiem przyjętego programu ochrony klimatu w Europie Środ-
kowej i Wschodniej (62). W 2004 roku Polska została członkiem
Unii Europejskiej, która jak się okazało, postawiła sobie za zadanie
osiągnięcie pozycji światowego lidera na polu walki ze zmianami
klimatycznymi (63-65). Wiele szczegółów na ten temat czytelnik
znajdzie w trzech obszernych dokumentach (66-69). Na ostatnim
spotkaniu w Finlandii (listopad 2006) przywódcy państw Unii
ustalili, że w sprawie zmian klimatycznych Europa musi działać
w sposób jeszcze bardziej zdecydowany (70). W ramach działań
podjętych przez Unię opracowano tak zwany schemat handlu
emisjami (EU-ETS emissions trading scheme) (71, 72), który objął
goal should be at least limiting this effect and avoiding catastro-
phes, which are imminent for us as a result of forthcoming climatic
changes (46). It was started when the World Meteorological Organi-
zation and the United Nations Environmental Program appointed
in 1988 the so called Intergovernmental Panel on Climate Change
with its task a better diagnosis of relationships of observed climatic
changes on human activities (47). In 1988 for the fi rst time in history
the General Assembly of the U N dealt with the climate changes,
accepting (on the basis of the Malta Government initiative) a resolu-
tion to protect the global climate for the present and future genera-
tions. Two years later the First Report of IPCC appeared which
confi rmed the occurrence of a real danger of climate changes and
called for the elaboration of the global agreement which deal with
this problem. The Intergovernmental Committee for Negotiations
was established, which elaborated the Frame Convention of the
UN in the matter of climate change (UN FCCC) (48, 49) which the
General Assembly of the UN in December 1990 recognized as the
basis for the beginning of the process of international negotiations
in the matter of climate changes.
The frame convention of UN in the matter of climate change (UN
FCCC) (48, 49) was recognized by the General Assembly UN in
December 1990 as a basics for the beginning of the process of
international negotiations in the matter of climate changes.
On May 9
th
, 1992 the governments accepted the Frame Conven-
tion of UN in the matter of climate changes (UN FCCC) (50). At
the so called Earth Peak in Rio de Janeiro (51), June 4
th
1992 the
convention was signed by 154 countries including Poland (52). It
was quickly clear that the convention does not treat the problems
of climate changes in a satisfactory manner and a new round of
talks to tighten and to cover more details of obligations for the
developed countries has started. On December 11
th
, 1997 – at the
third Conference of Conventions Parties which took place in Kyoto,
Japan, the so called Kyoto Protocol was accepted (53-55). The
protocol was signed by 84 states (56), several states did not take
this decision because of general expressions and lack of principles
of working acting mechanisms leading to fulfi ll the obligations. The
USA, among others, did not sign the protocol. Signing the protocol
meant the obligation for the limitation of emission of greenhouse
gas in the years 2008 – 2012 by about 5% in comparison to the
basic year (usually 1990) (57). Poland signed the Kyoto Protocol
and ratifi ed it on December 13
th
, 2002 (58). During the consecutive
Parties Conferences several statements were clarifi ed defi ning the
principles of the Protocol action. Poland, under the Kyoto Protocol,
was obliged to reduce the greenhouse gas emission in the fi rst
period (the years 2008 – 2012) by 6% in comparison to the basic
year 1988 (59). Poland was also obliged to show a signifi cant
progress in the emission reduction already in the year 2005 (60,
61). Poland’s actions were the result of the accepted program of
climate protection in Central and Eastern Europe (62). In 2004
Poland became the member of the European Union which as ap-
peared, put itself the task to achieve the world’s leader position in
the struggle against climatic changes (63 – 65). Many details on
this topic can be found in three extensive documents (66 – 69).
During the last meeting in Finland (November 2006) the Union

CWB-1/2007
5
około 11400 instalacji przemysłowych odpowiedzialnych za połowę
całkowitej emisji CO
2
w krajach UE. W ramach tego schematu
określana jest dopuszczalna emisja CO
2
dla każdego kraju Unii,
która następnie jest rozdzielana pomiędzy poszczególne instala-
cje emitujące CO
2
na terenie danego kraju (73, 74). Potencjalne
nadwyżki dozwolonej emisji, które pojawią się w odniesieniu do
poszczególnych instalacji, mogą być sprzedawane i kupowane na
tak zwanym europejskim rynku węgla, co może stanowić swoistą
nagrodę dla tych, którzy mogą pochwalić się niższą emisją CO
2
niż przeciętna emisja dla nich oczekiwana. 8 marca 2005 roku
Komisja Europejska zaakceptowała polski plan rozdziału kwot
emisji CO
2
na 1166 instalacji zgłoszonych w wyniku czego Polska
ma zredukować emisję CO
2
o 141,3 miliona ton w latach 2005-
2007, co stanowi 16,5% mniej niż wartość początkowo deklaro-
wana (75). Wszystko to zapoczątkowało lawinę działań, których
skutków tak naprawdę nikt nie jest w stanie w pełni przewidzieć
(76). Kwoty emisji CO
2
przydzielone poszczególnym krajom
i instalacjom z jednej strony mogą przynieść pozytywne efekty
wynikające przykładowo z wymuszenia modernizacji technologii,
a jednocześnie mogą prowadzić do wzrostu kosztów produkcji
w różnych dziedzinach przemysłu lub jej ograniczenia (77-78).
Sytuacja ta w znacznym stopniu dotyczy producentów cementu
(79-80), gdyż przemysł ten wg różnych ocen odpowiada za 5-8%
światowej emisji CO
2
(81-84). Trzeba też przyznać, że przemysł
ten, szczególnie europejski, podjął duże wysiłki zmierzające do
ograniczenia emisji CO
2
(85-88).
Czas zatem aby spróbować odpowiedzieć na tytułowe pytanie:
Czy Europa uratuje świat przed katastrofą jaką niesie globalne
ocieplenie będące wynikiem działalności człowieka? Aby jednak
udzielić odpowiedzi na to pytanie trzeba najpierw postawić kilka
pytań dodatkowych. Powiedzmy jasno – pytań bardzo niepopular-
nych, narażających ich autora na atak lobby utworzonego przez
polityków, ekonomistów, dziennikarzy, tak zwanych ekologów,
„zielonych” i jeszcze kilku innych, którzy już znają odpowiedzi na
wszystkie pytania, które można jeszcze postawić na temat global-
nego ocieplenia (89-91). Mimo wszystko postawimy te pytania.
2. Pytania
Czy globalne ocieplenie klimatu jest faktem?
Czy obserwowany wzrost stężenia CO
2
w atmosferze istotnie
odpowiada za wzrost średniej temperatury Ziemi w ostatnich
150 latach?
Jeśli globalne ocieplenie klimatu rzeczywiście ma miejsce,
to czy jest ono wynikiem emisji antropogenicznych gazów
cieplarnianych, czy też możliwe są inne przyczyny ocieplania
klimatu?
Czy przewidywania modeli klimatycznych, na których bazują
prognozy IPCC są wiarygodne?
Dopiero gdy odpowiemy pozytywnie na powyższe pytania nadamy
realny sens wyjściowemu pytaniu:
Czy działania podjęte przez Unię Europejską wynikające z
1.
2.
3.
4.
5.
States Leaders decided that in the matter of climatic changes
Europe must still act in a more determined manner (70). Within the
action undertaken by the Union the scheme of emissions trading
was elaborated (EU – ETS emissions trading scheme) (71, 72),
which covered about 11400 industrial installations whose emission
is equal to the half of total CO
2
emission in EU countries. In this
scheme the permitted CO
2
emission is defi ned for each EU country
which is next distributed between individual installations emitting
CO
2
in a given country (73, 74). A potential surplus of the permitted
emission which will appear in individual installations, may be sold
and bought on the so called European coal market which can be
a peculiar award for the countries with the lower emission of CO
2
than the average expected. On March 8
th
, 2005 the European
Commission accepted the Polish schedule of distribution of the CO
2
emission for 1166 submitted installations and as a result Poland
should reduce the CO
2
emission in the years 2005 – 2007 which
is by 16,5% less than the value initially declared (75). All this initi-
ated an avalanche of actions the results of which nobody cannot
be foreseen (76). The amounts of the CO
2
emission allocated to
individual countries and installations on the one hand can bring
positive effects resulting, for example, in forcing the modernisation
and, simultaneously, can lead to the production cost increase in
different industry branches or its limiting (77, 78). This situation in
a signifi cant degree concerns cement producers (79, 80) because
this industry, according to different assessments, is responsible for
5 – 8% of the world CO
2
emission (81 – 84). One must also admit
that this industry, particularly in Europe, undertook great efforts
leading to the limiting of the CO
2
emission (85 – 88).
It is therefore time to try to answer the title question: will Europe
save the world from the catastrophe of global warming being the
result of human activities? In order to answer this question, it is
necessary to put some additional questions. Saying clearly – very
unpopular, risking the author to be attacked by the lobby formed
by politicians, economists, journalists, the so called ecologists,
“greens” and also some others who know answers to all questions
to be asked about global warning (89 – 91). Nevertheless, we will
ask these questions.
2. Questions
Is the global warning of climate a fact?
Is the observed CO
2
concentration increase in the atmosphere
responsible for the growth of the average Earth temperature
in the last 150 years?
If the global climate warning really occurs, then is it a result
of the anthropogenic greenhouse gas emission or are other
causes of climate warning also possible?
Are the expectations of climatic models, which are the basis
of the IPCC forecast credible?
Only when these questions are answered positively, the initial
question will get a real sense:
1.
2.
3.
4.

6
CWB-1/2007
protokółu z Kioto są w stanie uratować świat przed katastro-
falnym ociepleniem?
W przypadku negatywnej odpowiedzi na pytania 1-4, sens pytania
5 ulegnie zupełnej zmianie i właściwie trzeba będzie go zastąpić
pytaniem:
Czy właściwie w ogóle ma sens ograniczanie emisji CO
2
do
atmosfery?
3. Odpowiedzi
Ad 1.
Pytanie to w dzisiejszych czasach brzmi niemal jak herezja. Prze-
cież wszyscy wiedzą, że klimat się ociepla (10, 23, 92), wystarczy
spojrzeć dookoła; lipiec 2006 roku był w Polsce najcieplejszy od
277 lat (93). Wszyscy? (22, 94, 95). Pomiar średniej temperatury
Ziemi wcale nie jest taki prosty, a ocena wartości uzyskiwanych
wyników do dziś budzi wiele kontrowersji (96, 97). Nie brakuje wy-
ników dowodzących, że na przykład średnia roczna temperatura na
terenie USA w latach 1895-1997 nie zmieniała się, a średnia tem-
peratura dolnych warstw troposfery nawet malała (98). Europejscy
naukowcy potwierdzili, że zimą 2005 roku temperatury atmosfery
w Arktyce osiągnęły najniższe z kiedykolwiek zarejestrowanych
temperatur (99). Niektórzy uczeni jak T. Landscheidt z Instytutu
Badań Cyklicznej Aktywności Słońca dowodzi, że nadchodzi
kolejna tak zwana mała epoka lodowa (100). Jednak sceptyczny
punkt widzenia jest obecnie bardzo źle widziany (101). Podkreśla
się topnienie lodowców górskich i lodów Arktyki i Antarktyki (102,
103) oraz wynikający (między innymi) z tego wzrost poziomu mórz
i oceanów, który w ostatnim stuleciu wyniósł 10-25 cm (104), jest
absolutnym dowodem na ocieplenie klimatu (105, 106). Wzrost
temperatury oceanów o 1°C powoduje wzrost ich poziomu o około
75 cm tylko z powodu cieplnej rozszerzalności wody (107), co
zresztą stanowi przykład jakości obliczeń wykonywanych przez
tych, którzy koniecznie chcą udowodnić słuszność swoich prze-
widywań. Wyjaśnijmy, że taki wzrost poziomu wystąpiłby w przy-
padku, gdyby wody oceaniczne znajdowały się w „rurze” o stałej
średnicy, co oczywiście nie ma miejsca i w praktyce średnica tej
„rury” rośnie znacznie w wyniku zalewania nowych terenów. Bar-
dzo interesująco wyglądają stosunkowo nowe dane (2005 i 2006),
w których przytacza się listę lodowców, które powiększają swoją
powierzchnię (107) lub wskazuje, że grubość lodów Arktyki wcale
się nie zmniejsza a wręcz przeciwnie (109). Są dowody, że ponad
90% lodowców świata powiększa swoją grubość (110). Oczywiście
bez problemu znajdziemy też informacje o tym, że lody Arktyki top-
nieją z niespotykaną dotychczas szybkością (111). Nie będziemy
już dalej mnożyć wzajemnie sprzecznych informacji. Doprawdy,
trudno byłoby znaleźć dziedzinę z większą ilością przeciwstawnych
poglądów i argumentów. Co więc wiemy na pewno? Tylko to, że
nierzetelnie dobierając istniejące informacje można dowieść, że
zagraża nam globalne ocieplenie lub kolejna epoka lodowa. Jeśli
ktoś woli to można też dowieść, że wynikiem globalnego ocieple-
nia będzie epoka lodowa przynajmniej na półkuli północnej (112).
6.
Can the actions undertaken by the European Union, result-
ing from the Kyoto protocol, save the world from catastrophic
warning?
In the case of negative answers for the questions 1 – 4 the sense
of question 5 will be totally changed and it should be replaced by
the following question:
Is there any point in limiting the CO
2
emission to the atmos-
phere?
3. Answers
Ad. 1.
At present this question is almost a heresy. All do know that the
climate warms (10, 23, 92), it is enough to look around; July 2006
has been in Poland the hottest for 277 years (93). All? (22, 94, 95).
The measurement of the average Earth temperature is not simple at
all and the evaluation of the value of obtained results today evokes
many controversies (96, 97). There are enough results showing
that, for example, the average year temperature on the US territory
in the years 1895 – 1997 did not change and the average tem-
perature of lower layers of troposphere even decreased (98). The
European scientists confi rmed that in winter 2005 the atmosphere
temperature in the Arctic zone was the lowest of any time registered
temperatures (99). Some scientists, such as T. Landscheidt (100)
from the Institute of Research of Serial Sun Activity, prove, that the
next little ice epoch is approaching. However, a sceptic point of
view is currently very unwelcome (101). The melting of mountain
glaciers and ice of the Artic zone and Antarctic is stressed (102,
103) and the resulting (among others) increase of the level of seas
and oceans which in the last century was 10 – 25 cm (104). It is
an absolute evidence of climate warning (105, 106). The oceans
temperature increases by 1
o
C and it causes the increase of their
level by about 75 cm only because of thermal expansion of water
(107) which is an example of a calculation quality made by those
who absolutely want to prove the legitimacy of their expectations.
It must be explained that this level increase would take place in
the case when the ocean water will be in “pipe” with a constant
diameter which, of course, does not take place and, in practice, the
diameter of this “pipe” increases signifi cantly as a result of fl ood-
ing of new terrains. Very interesting are relatively new data (2005
and 2006) in which the list of glaciers is given which increase their
surface (108) or showing that the thickness of the Arctic Zone ices
does not decrease at all, but on the contrary (109). There are proofs
that over 90% of glaciers in the world increase their thickness (110).
Obviously, without any problem we will fi nd also the information
that the ice of the Arctic Zone is melting with unprecedented speed
(111). We will not farther multiply contradictory information. Truly,
it will be diffi cult to fi nd a discipline with a larger quantity of oppos-
ing views and arguments. Then what do we know for sure? Only
this, that selecting dishonestly the existing information it is pos-
sible to prove that the global warming or consecutive icing epoch
threaten us. If somebody prefers, it can be proved that as a result
5.
6.

CWB-1/2007
7
Jaka jest zatem odpowiedź na postawione pytanie nr 1? Przegląd
bardzo wielu informacji, jakiego dokonywał autor w okresie kilku
ostatnich lat, skłania do udzielenia mimo wszystko pozytywnej
odpowiedzi na to pytanie. Wygląda na to, że ocieplanie się klimatu
jest faktem, jeżeli rozpatrujemy to zjawisko w skali całego globu,
a nie lokalnie (113, 114).
Ad 2.
Korelacja zawartości CO
2
w atmosferze ze średnią temperaturą
Ziemi w ciągu ostatnich 150 lat wydaje się nie budzić żadnych wąt-
pliwości, że odpowiedź na pytanie nr 2 musi być pozytywna. Taka
odpowiedź rzeczywiście jest powszechnie udzielana, szczególnie
przez zwolenników wpływu człowieka na klimat Ziemi (115-117).
Nie zmienia to faktu, że nie brakuje także poważnych opinii nie po-
twierdzających tego powszechnego przekonania (118). Głównym
argumentem przeciwników zasadniczego wpływu CO
2
na średnią
temperaturę Ziemi jest argument dotyczący zawartości pary wodnej
w powietrzu. Para wodna jest najważniejszym gazem cieplarnia-
nym (119-121), w dodatku występującym w atmosferze w ilościach
poważnie przekraczających zawartości innych gazów cieplarnia-
nych. Zdaniem poważnych uczonych, jak na przykład fi zyk dr F.
Singer, specjalista od spraw atmosfery, były dyrektor Satelitarnej
Służby Pogodowej Stanów Zjednoczonych, atmosferyczna para
wodna odpowiada za 95% wkładu w efekt cieplarniany i o CO
2
właściwie nie ma się co martwić (122). Czytelnik nie musi się jednak
niepokoić, nic jeszcze nie zostało przesądzone i wielu kwestionuje
poprawność poprzednich zdań (123). Są jednak jeszcze inne ar-
gumenty, które poddają w wątpliwość ścisłość korelacji pomiędzy
zawartością CO
2
w atmosferze a średnią temperaturą Ziemi. Tych
argumentów dostarczają badania paleoklimatyczne. Zawartość
CO
2
w atmosferze Ziemi w okresie ubiegłych 600 milionów lat
zmieniała się bardzo znacznie osiągając w erze kambryjskiej (około
540 milionów lat temu) poziom 7000 ppm zaś w późnym ordowiku
(450 milionów lat temu) nadeszła epoka lodowa przy zawartości
CO
2
w atmosferze wynoszącej 4400 ppm (12 razy więcej niż
dzisiaj) (124). Generalnie rzecz biorąc, omawiana korelacja jest
słabo widoczna na tle dziejów Ziemi (125, 126). Pamiętajmy też, że
około 1 milion lat temu na terenie dzisiejszej Polski panował klimat
podzwrotnikowy, a 15 000 lat temu teren ten był pokryty lądolodem,
który wycofał się mniej więcej 3 000 lat później (127), raczej nie
z tego powodu, że działania ówczesnego człowieka doprowadziły
do nadmiernej emisji CO
2
. Warto też wspomnieć, że kwestionuje
się bardzo poważnie wyniki pomiarów stężenia atmosferycznego
CO
2
w minionych stuleciach na podstawie badań jego zawartości
w lodowcach co stanowi powszechną metodę oceny tego stężenia
(128). Zatem czy istnieje dyskutowana korelacja? A jeżeli jest tak,
że przyczyna tej korelacji jest całkiem inna niż założyliśmy? Przy-
jęliśmy pozytywną odpowiedź na pytanie nr 1, średnia temperatura
Ziemi rośnie, przyjmijmy na chwilę, że z innego powodu niż wzrost
zawartości CO
2
w atmosferze. W takim razie rośnie też średnia
temperatura oceanów, które są głównym czynnikiem buforującym
zawartość CO
2
w atmosferze (co do tego raczej nie ma wątpli-
wości (129)). Fizyczną konsekwencją tego zjawiska jest spadek
rozpuszczalności CO
2
w wodach oceanicznych – czyli wzrost
of global warming there will be the icing epoch at least on the north
hemisphere (112). What then is the answer to the question 1? The
survey of a large number of information done by the author in last
years induces a positive answer to this question. It seems that
the climate warning is a fact if we consider this phenomenon in the
scale of the whole globe, and not locally (113, 114).
Ad. 2
The correlation of the content of CO
2
in the atmosphere with the
average Earth temperature in the last 150 years seems not to
arouse any doubts that the answer to question 2 must be positive.
This answer is really generally given, particularly by the supporters
of human infl uence on the Earth climate (115 – 117). It does not
change the fact that there are also many important opinions which
do not confi rm this general belief (118). The main argument of the
opponents of the fundamental infl uence of CO
2
on the average
Earth temperature is the argument concerning the content of water
vapour in the air. Water vapour is the most important greenhouse
gas (119 – 121), additionally occurring in the atmosphere in the
quantity much more exceeding the content of other greenhouse
gases. In the opinion of eminent scientists as, for example,
a physicist F. Singer PhD, an expert of atmosphere problems, the
former director of the Satellite Service of Weather of the USA,
the atmospheric water vapour is responsible for 95% input in the
greenhouse effect and CO
2
actually is no matter to be worried about
(122). However, a reader does not have to worry, nothing is still set-
tled and many question the correctness of the previous sentences
(123). However, there are still other arguments which raise doubts
about the exactness of the correlation between the CO
2
content in
the atmosphere and the average Earth temperature. These argu-
ments are delivered by the paleoclimatic research. CO
2
content
in the Earth atmosphere, in the period of the past 600 millions
years, was changing very signifi cantly achieving in the Cambrian
era(about 540 million years ago) the level of 7000 ppm while in
the late Ordovician period (450 million years ago) the ice epoch
arrived when the content of CO
2
in atmosphere was 4400 ppm (12
times higher than today) (124). Generally speaking the discussed
correlation is weakly seen on the background of the Earth history
(125, 126). We must also remember, that about one million years
ago on the present Polish territory there was a subtropical climate
and 15000 years ago that territory was a continental glacier which
disappeared about 3000 years later (127), rather not because of
the actions of the people in those days. It is worth to mentioning,
that the results of measurements of CO
2
concentration in the at-
mosphere in the past centuries on the basis of examination of its
content in glaciers can be questioned, and this is a common method
of this concentration evaluation (128). So, does this discussed cor-
relation exist? And is the reason of this correlation totally different
than we assumed? We accepted the positive answer to question
1, the average Earth temperature is increasing and let us assume
for a moment that for a different reason than the increase of CO
2
content in the atmosphere. In that case the average temperature
of oceans increases also and they are the main factor buffering the
content of CO
2
in the atmosphere (about this there are rather no

8
CWB-1/2007
stężenia CO
2
w atmosferze (130). Dyskutowana korelacja staje
się więc oczywista, tylko to nie ona jest przyczyną wzrostu śred-
niej temperatury Ziemi, jest konsekwencją tego zjawiska. Nasza
odpowiedź na pytanie nr 2 będzie więc troszkę „dyplomatyczna”.
CO
2
jest jednak gazem cieplarnianym, zatem wzrost zawartości
CO
2
w atmosferze powinien prowadzić do wzrostu intensywności
efektu cieplarnianego, zupełnie niezależnie od źródła pochodzenia
CO
2
. Powiedzmy, że CO
2
co najmniej dodatkowo przyczynia się
do wzrostu temperatury naszego globu, który bierze się chwilowo
z nie do końca jasnych dla nas powodów.
Ad 3.
Czy emisja gazów cieplarnianych jaka jest wynikiem działalności
człowieka odpowiada za ocieplanie Ziemi? To chyba najtrudniej-
szy problem i poświęcono mu setki tysięcy różnych opracowań
(131-135). Zamiast tego podsumujemy aktualny stan dyskusji
(o ile jest to w ogóle możliwe). Wydaje się, że w chwili obecnej
przeważają zwolennicy poglądu, że działalność człowieka, w tym
przede wszystkim emisja CO
2
, która jest wynikiem procesów prze-
mysłowych, jest przyczyną obserwowanego ocieplenia klimatu.
Jest faktem, że ta przewaga doprowadziła do podjęcia szeregu
rzeczywistych działań, które mają zapobiec zmianom klimatycz-
nym. Ciekawe, że wśród zwolenników tej koncepcji najwięcej
jest tych, którzy z wykształcenia i zawodu nie są klimatologami
czy specjalistami od fi zyki atmosfery (136). Zwraca też uwagę
fakt, że decyzje dotyczące w istocie problemów rozstrzygalnych
naukowo, zaczynają być podejmowane w wyniku głosowania
w grupach ludzi, którzy, powiedzmy to otwarcie, nie mają żadnego
głębszego pojęcia w sprawach o których decydują. Oczywiście
w tych głosowaniach (powinniśmy w to wierzyć) opierają się oni
na zdaniu fachowców, jednak sposób doboru tych fachowców i ich
realny wpływ na decyzje budzi coraz większe obawy i wątpliwości
(137). Szczególnie od chwili, gdy walka ze zmianami klimatycznymi
zaczęła być, przynajmniej dla niektórych, sposobem zarabiania
na życie i biznesem. Stany Zjednoczone nie podpisały protokółu
z Kioto kierując się nie tylko względami ekonomicznymi, jak to
wskazują niektórzy, ale także niezależnymi opiniami naukowców.
W listopadzie 2006 roku powiało czymś nowym z dość nieoczeki-
wanej strony jaką jest ONZ. Przyznano, że dotychczasowe oceny
ekspertów ONZ (a więc IPCC) odnośnie wpływu działalności czło-
wieka na klimat były nieco przesadzone! (138). To już coś.
Bądźmy zatem nastawieni kompromisowo i przyjmijmy, że działal-
ność człowieka w jakimś jednak stopniu wpływa na klimat, chociaż
chyba nie jest to stopień tak katastrofalny jak to oczekują entuzjaści
raportów IPCC. Czy jest możliwe że klimat ociepla się wyraźnie
z innych powodów niż emisja antropogenicznych gazów cieplarnia-
nych? Oczywiście, że tak. Klimat w historii naszego globu zmieniał
się wielokrotnie w czasach, gdy rozwiniętej cywilizacji technicznej
na Ziemi jeszcze nie było. Jakie mogą być tego przyczyny? Jedną
z nich może być wzrost temperatury oceanów będący wynikiem
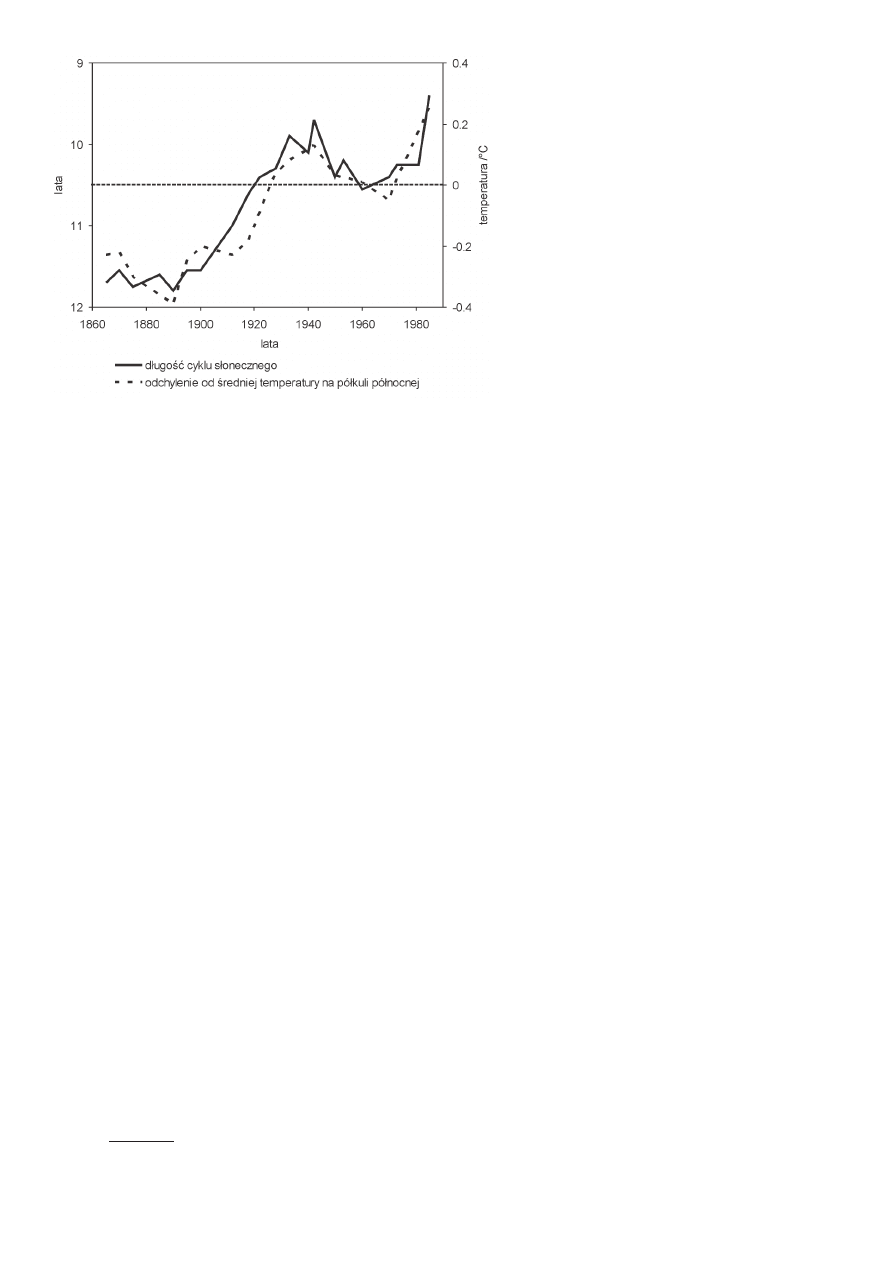
dennej aktywności wulkanicznej (139). Jest jednak czynnik daleko
poważniejszy; czynnik, który wywierał zawsze potężny wpływ na
klimat Ziemi. Tym czynnikiem jest aktywność Słońca (140-143).
Rys. 3 przedstawia korelacje odchyleń od średniej temperatury
doubts (129)). A physical consequence of this phenomenon is the
decrease of CO
2
solubility in oceanic water, that is the increase of
CO
2
content in the atmosphere (130). The discussed correlation
became thus obvious, but it is not a cause of the average Earth
temperature increase; it is a consequence of this phenomenon.
Our answer to question 2 will be thus a little “diplomatic”. However,
CO
2
is a greenhouse gas, therefore the increase of CO
2
content
in the atmosphere should lead to the increase of intensity of the
greenhouse effect, completely independently of CO
2
source. Let
us say that CO
2
,
at least additionally, contributes to
the increase
of temperature of our globe which results, from not totally clear
for us causes at the moment.
Ad. 3.
Is the emission of greenhouse gas, which is the result of human
activities is responsible for Earth warming? It is probably the most
diffi cult problem which was the topic of hundred thousands of dif-
ferent works (131 – 135). Instead of this, let us sum up the current
state of discussion (if it possible at all). It seems that at present
the supporters of the view that the human activities, principally
the CO
2
emission which is the result of industrial processes, are
the cause of climate warning, are prevailing. It is a fact that this
advantage was the reason of undertaking several real actions
which should prevent the climate changes. It is interesting that
among the supporters of this conception the majority are those
who are not educated as climatologists or experts of physics of
atmosphere (136). It is also interesting, that the decisions con-
cerning in fact the problems which should be decided scientifi cally
begin to be undertaken as a result of voting in groups of people,
let us say it openly, do not have any idea about the problems they
decide about. Of course, in these votings (we should believe in
this) they rely on the experts’ opinion, however the manner of
this selection of experts and their real infl uence on the decisions
contribute to bigger and bigger fears as well as doubts (137). Es-
pecially from the moment when the fi ght with the climate changes
became to be, at least for some, the method for life and business.
The United States did not sign the Kioto protocol, not only for
economic reasons, as somebody may claim, but also because
of independent scientifi c opinions. In November 2006 something
new appeared from rather an unexpected side, namely from the
UN. It was admitted that the assessments of the UN experts
(thus IPCC) so far about the human activity infl uence on climate
have been a little exaggerated (138)! It is something. Let us be
therefore compromise-minded and assume that human activities
to some degree infl uence the climate, although it is not such a
catastrophic degree as the enthusiasts of IPCC reports expect.
Is it possible that climate is warming distinctly from other reasons
than the emission of anthropogenic greenhouse gas? Certainly it
is. Climate in the history of our globe was changing many times
in the time when the developed technical civilization was not
present on the Earth. What can the reasons be? One of them can
be the increase of oceans’ temperature which was caused by the
bottom volcanic activity (139). However, there is a factor much
more important, the factor which had always a powerful infl uence
CWB-1/2007
9
Ziemi i długości tak zwanego 11 letniego cyklu słonecznego.
Odpowiedzieliśmy zatem na 3 pytanie przynajmniej na tyle, na ile
można udzielić rzeczywiście obiektywnej odpowiedzi. Wielu rzeczy
jeszcze nie znamy, ale to nie powód aby decyzje o obiektywnej
prawdzie podejmować przez głosowanie.
Ad 4.
Prognozowanie zmian klimatu opiera się na tak zwanych mode-
lach klimatycznych, które należą do najbardziej złożonych modeli
wymagających wielu parametrów startowych i charakteryzujących
się dodatkowo koniecznością prowadzenia wyjątkowo czaso-
chłonnych obliczeń numerycznych (145, 146). Klimat zależy od
bardzo wielu czynników, których działanie w dodatku jest często
ze sobą sprzężone. Czasem nieuwzględnienie wydawałoby się
mało znaczącego czynnika całkowicie niweczy końcowy efekt
przewidywań. Fizycy i matematycy zajmujący się problematyką
tak zwanego chaosu, wiedzą o tym bardzo dobrze. Dodajmy do
tego, że nie potrafi my jeszcze ocenić faktycznego wpływu na klimat
wielu czynników, z których istnienia przynajmniej zdajemy sobie
sprawę. Nic więc dziwnego, że uzyskiwane przy wykorzystaniu
tych modeli prognozy stanowią przedmiot sporów (eq-er). Nawet
z samej Brukseli zaczynają napływać coraz bardziej krytyczne
głosy (149). Nie jest zadaniem tego artykułu szczegółowa polemika
ze zwolennikami i przeciwnikami konkretnych modeli i wynikają-
cych z nich przewidywań. Celem autora jest tylko próba oceny
argumentów w tej dyskusji, ich wagi i liczby, po to aby przynajmniej
ocenić statystyczną wartość prognoz stawianych na XXI wiek.
W końcu właśnie te prognozy legły u podstaw podjętych działań.
Jak ta ocena wygląda? Autor nie jest upoważniony do wydawania
ostatecznych ocen (jednak potrafi przynajmniej ewentualnym
krytykom udowodnić, że i oni nie są upoważnieni do wydawania
takich ocen), jednak mając spore doświadczenie w modelowa-
on the Earth climate. This factor is the sun activity (140
– 143). Figure 3 presents the correlation of deviations of
the average Earth temperature and the length of the so
called eleven year sun cycle.
Therefore we answered the third question at least as
much as it is possible to give a really objective answer.
We still do not know many things but it is not the reason
to make decisions about the objective truth by voting.
Ad. 4.
Climate forecasts are elaborated on the so called climate
models which belong to the most complicated ones with
many starting parameters and which are characterised
additionally by the necessity of conducting extremely
time – consuming numerical calculations (145, 146).
Climate depends on many factors which, additionally, are
frequently mutually coupled. Sometimes neglecting an
unimportant factor totally destroys the fi nal effect of the
forecast. For physicists and mathematicians working in
chaos issues is very well known. Additionally, we do not
know how to evaluate the actual infl uence on climate of
several factors the existence of which we are aware. It is
no wonder such forecasts are the object of disputes (147, 148).
Even from Brussels itself more and more critical voices come (149).
The detailed polemic with supporters and opponents of concrete
models and resulting from them expectations is not the goal of this
paper. The aim of the author is an attempt to evaluate the argu-
ments in this dispute, their scale and number to estimate evaluate
the statistical value of forecasts concerning the 21
st
century. Finally,
these forecasts were the grounds of undertaken activity. What does
this evaluation look like? The author is not authorized to give fi nal
opinions (but he can at least prove to the possible critics that also
they are not authorized to give such opinions). However, having
substantial experience in mathematical modelling, he can draw at-
tention on exceptionally weak points of the applied climatic models.
A basic weak point is constituted by serious diffi culties in taking
into considerations clouds and atmospheric aerosols in energetic
balance of the Earth (150, 151). The reader being interested of this
problem can easily fi nd in the Internet about half a million papers
on this topic and will become convinced that we do not know if
clouds and aerosols present in the atmosphere contribute to the
increase of the Earth temperature or to its cooling (152). The next
problem is a signifi cant incompatibility of resulting from model
forecasts concerning the southern hemisphere. In reality (although
we have not discussed this problem) the southern hemisphere
distinctly ignores global warming (153). It is considered that it
will be the reason of serious slowing of the rate of Earth warming
(154, 155). This is not foreseen in IPCC models. What will then our
answer be for question 4? It seems that the answer can be only
one: the forecasts resulting from these models are for sure with
signifi cant errors, even worse, it is diffi cult to evaluate objectively
these errors statistically. Unfortunately it is not possible to avoid a
suspicion which appears automatically after reading hundreds of
papers that applying fl exibility and uncertainty of existing models,
Rys. 3. Długość 11 letniego cyklu plam słonecznych (lewa skala) oraz odchylenia od
średniej wieloletniej temperatury Ziemi w latach 1865-1985 (16, 144)
Fig. 3. Length of eleventh years cycle of sun stain (left scale) and deviations of aver-
age perennial Earth temperature (16, 144)

10
CWB-1/2007
niu matematycznym, może zwrócić uwagę na wyjątkowo słabe
punkty stosowanych modeli klimatycznych. Podstawowym słabym
punktem są poważne trudności w uwzględnieniu zachmurzenia
i aerozoli atmosferycznych w bilansie energetycznym Ziemi (150-
151). Zainteresowany czytelnik łatwo znajdzie w Internecie około
pół miliona artykułów na ten temat i przekona się, nie wiemy czy
chmury i aerozole zawarte w atmosferze przyczyniają się do wzro-
stu temperatury Ziemi czy też do jej ochłodzenia (152). Kolejnym
problemem jest poważna niezgodność wynikających z przewidy-
wań modeli dotyczących południowej półkuli Ziemi. Rzeczywiście,
(chociaż nie dyskutowaliśmy tego problemu), południowa półkula
wyraźnie ignoruje globalne ocieplenie (153). Uważa się nawet,
że będzie to przyczyną poważnego zwolnienia tempa ocieplania
Ziemi (154, 155). Tego modele IPCC nie przewidują. Jaka więc
będzie nasza odpowiedź na pytanie nr 4? Wydaje się, że może
być ona tylko jedna: prognozy wynikające z tych modeli obarczone
są na pewno znacznym błędem, gorzej nawet, trudno jest obiek-
tywnie ocenić ten błąd statystycznie. Niestety nie sposób uniknąć
podejrzenia, które wręcz nasuwa się samo po przeczytaniu setek
pozycji literatury, że wykorzystując elastyczność i niepewność
istniejących modeli, każdy może uzyskać taki wynik, jaki jest mu
potrzebny na poparcie wyznawanej tezy. O obiektywnej prawdzie
kolejny raz rozstrzyga głosowanie. Jedno przynajmniej jest w tym
wszystkim pewne – ciągle wiemy za mało na to, abyśmy mogli
z całą pewnością odróżnić prognozy od wróżb.
Aby kontynuować rozważania przyjmijmy, że odpowiedzi na py-
tania 1 – 4 są pozytywne przy zachowaniu szeregu wątpliwości,
które istnieją i powinny być traktowane poważnie. Umożliwi nam
to przejście do pytania nr 5. Zobaczmy jaka będzie odpowiedź.
Ad 5.
Unia Europejska jak już wspomnieliśmy znalazła się (z własnej
woli) na samym froncie walki z globalnym ociepleniem, które jest
efektem działalności człowieka (zdaniem Unii). Liczba dokumentów
opracowanych przez Komisję Europejską w tej materii jest impo-
nująca. Zainteresowany czytelnik powinien zajrzeć na ofi cjalną
stronę internetową European Union @ United Nations (156) oraz
zapoznać się z ofi cjalnymi materiałami zawartymi na stronie (157).
Przydzielono limity emisji CO
2
, wprowadzono handel emisjami,
uznano, że podjęte wysiłki są jeszcze niewystarczające (158)
i postanowiono podjąć jeszcze ostrzejsze działania. Co z tego
wszystkiego wychodzi? Emisja CO
2
w krajach Unii w ciągu ostat-
nich 6 lat rośnie zamiast maleć (159). Ocena World Energy Outlook
wskazuje, że do 2030 roku całkowita emisja CO
2
na świecie będzie
rosnąć w wyniku rozwoju krajów, które nie podpisały lub nie musiały
podpisywać protokółu z Kioto (160, 161). W teorii państwa UE miały
rozdać fi rmom pozwolenia na emisję konkretnych ilości CO
2
. Firmy
zamierzające emitować większe ilości CO
2
niż dozwolone mogą
dokupywać na wolnym rynku dodatkowe ilości emisji. Do czego to
doprowadziło? Do tego, że państwa dały swoim fi rmom znacznie
większe przydziały niż było im to potrzebne. Efektem był poważny
spadek kursów dodatkowych przydziałów emisji (w listopadzie
2006 roku ich cena była 2,5 razy mniejsza niż w 2005 roku). Pań-
stwa UE zamierzają przyznać sobie również pokaźne limity emisji
everybody can obtain such a result which is necessary for him
to support the subscribed thesis. About the objective truth once
again decides voting. One is at least – certain in all this, all the
time our knowledge is too small to distinguish the forecasts from
predictions with full certainty.
To continue the considerations we admit that the answers to ques-
tions 1- 4 are positive with retaining several doubts which exist
and should be treated seriously. It gives us the possibility to pass
to question 5. Let us see what the answer will be.
Ad. 5.
As we have already mentioned, the European Union is situated
(of its own free will) at the very front of struggle with global warm-
ing which is the effect of human activities (according to EU). The
number of documents elaborated by The European Commission
on this matter is impressive. An interested reader should look at
the offi cial Internet site: European Union @ United Nations (156)
and become familiar with offi cial materials published there (157).
The emission CO
2
limits were allocated, the emission trade was
introduced, it was recognized that the undertaken efforts are still
insuffi cient (158) and it was decided to undertake stronger ac-
tions. What is coming of all this? CO
2
emission in EU countries
during the last 6 years is increasing instead of decreasing (159).
The opinion of the World Energy Outlook is shows, that till 2030
the total CO
2
emission in the world will grow as a result of the
countries development (which do not signed or were not obliged
to sign the Kyoto protocol) (160, 161). In theory the EU countries
should distribute permissions of concrete quantities of CO
2
emis-
sion to companies. The companies intending to increase the CO
2
emission than permitted can buy on the free market additional
permissions. Where does it lead? To the fact that the countries
gave their companies larger allocations than it was necessary.
The effect was the signifi cant decrease of price of additional emis-
sions’ allocation (in November 2006 their price was 2.5 times lower
than in 2005). The EU countries intend to grant themselves with
sizeable limits of CO
2
emission in the years 2008 – 2012 which
evokes a serious nervousness of the European Commission which
always believes that the system of emission trade will lead to the
intended goal (162). Certainly the member countries with great
resistance and delay pass on to the European Commission the
data concerning the real CO
2
emission by chosen installations. In
October 2006 Luxemburg was put before the European Tribunal
of Justice for repealing to deliver this information. Eight countries,
among others Poland and France, obtained serious warnings
(163). The Polish dreams about high profi ts of emissions trade will
not come true for sure. It is evidently seen that the countries are
afraid that the restriction of CO
2
emission may denote the limita-
tion of their development and increase of production costs. The
representatives of different industries, for example producers of
cement and automobiles (164) in assumption accepting the policy
of CO
2
emission reduction, submit, however, several remarks and
doubts about the EU policy (for example Memorandum of British
Cement Association (165)). Often and often in the European Union
documents signals appear that the goals of the EU resulting from
CWB-1/2007
11
CO
2
na lata 2008-2012 co wywołuje poważne zdenerwowanie
Komisji Europejskiej, która ciągle wierzy, że system handlu emi-
sjami doprowadzi do zamierzonego celu (162). Oczywiście kraje
członkowskie z dużym oporem i opóźnieniem przekazują do Ko-
misji Europejskiej dane dotyczące rzeczywistych emisji CO
2
przez
wybrane instalacje. W październiku 2006 roku Luxemburg został
postawiony przed Europejskim Trybunałem Sprawiedliwości za
uchylanie się od dostarczenia tych informacji. Osiem krajów, w tym
między innymi Polska i Francja otrzymały poważne ostrzeżenia
(163). Marzenia Polski o dużych zarobkach na handlu emisjami
na pewno się nie zrealizują. Ewidentnie widać, że kraje obawiają
się, że ograniczanie emisji CO
2
może oznaczać ograniczanie
ich rozwoju i wzrost kosztów produkcji. Przedstawiciele różnych
dziedzin przemysłu, na przykład producenci cementu czy samo-
chodów (164), w założeniu akceptujący politykę redukcji emisji
CO
2
, zgłaszają jednak szereg uwag i wątpliwości co do polityki
UE (np. Memorandum of British Cement Association (165)). Coraz
częściej w dokumentach Unii Europejskiej pojawiają się sygnały
o tym, że cele UE, wynikające z protokółu z Kioto mogą nie zostać
osiągnięte (166). Kto chce szczegółowo rozeznać się w sytuacji
musi przeczytać setki stron materiałów Komisji Europejskiej, które
można znaleźć w Internecie (167). Nowe badania wskazują, że
handel emisjami CO
2
przyczynia się do wzrostu globalnej emisji
tego gazu w wyniku przenoszenia produkcji do krajów rozwijają-
cych się, nie objętych proto-
kółem z Kioto oraz w wyniku
wzrostu zakupów produktów
energochłonnych właśnie
w tych krajach (168).
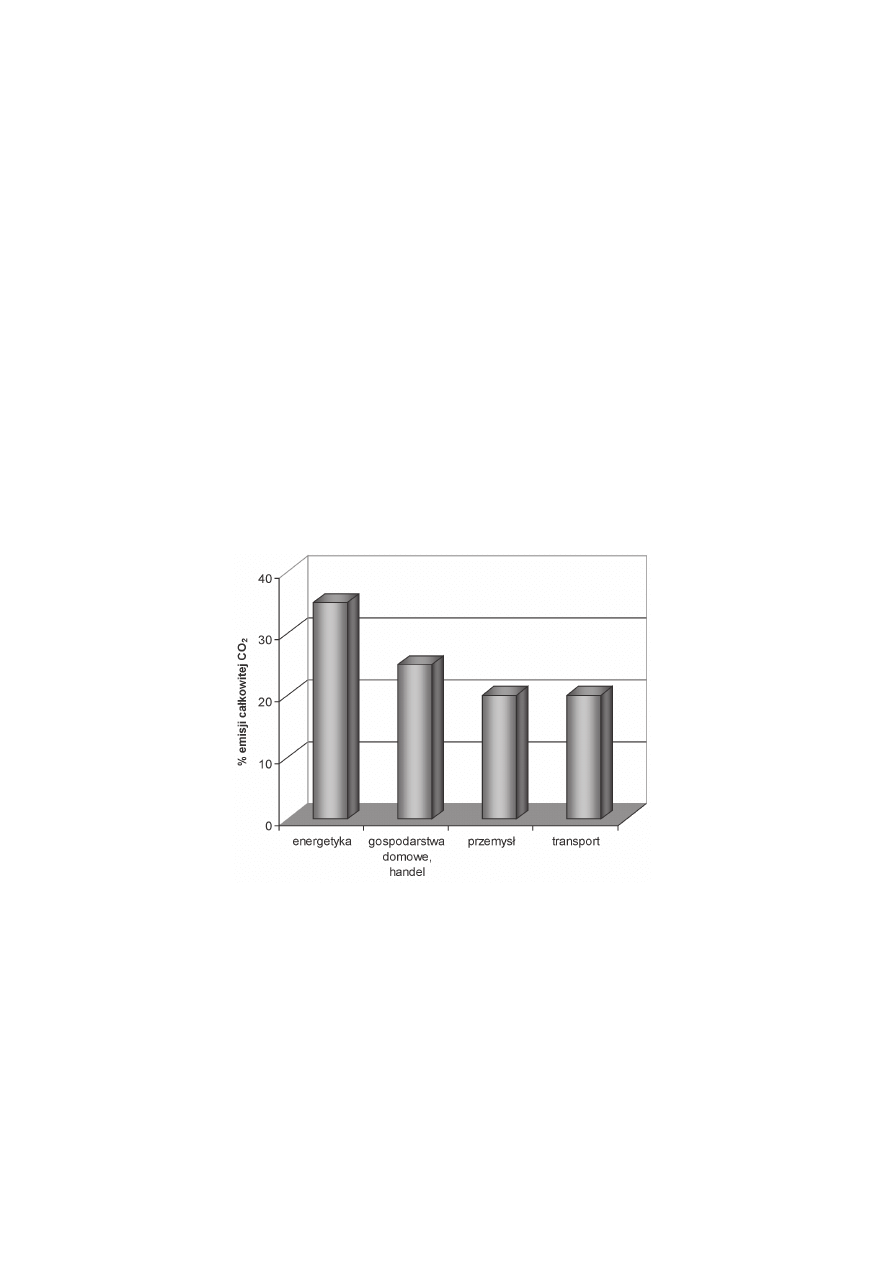
Załóżmy jednak, że plany
EU odnośnie do redukcji
emisji CO
2
zostaną pomyśl-
nie zrealizowane. Jakie będą
tego efekty? Na rysunku 4
przedstawiono przeciętne
udziały różnych obszarów
działalności ludzkiej w cał-
kowitej antropogenicznej
emisji CO
2
do atmosfery.
Odnotujmy, że działania
podjęte dotychczas przez
UE dotyczą energetyki
i przemysłu (problem trans-
portu stanowi przedmiot
osobnych uregulowań (170)), czyli obejmują one niewiele ponad
50% całkowitej emisji CO
2
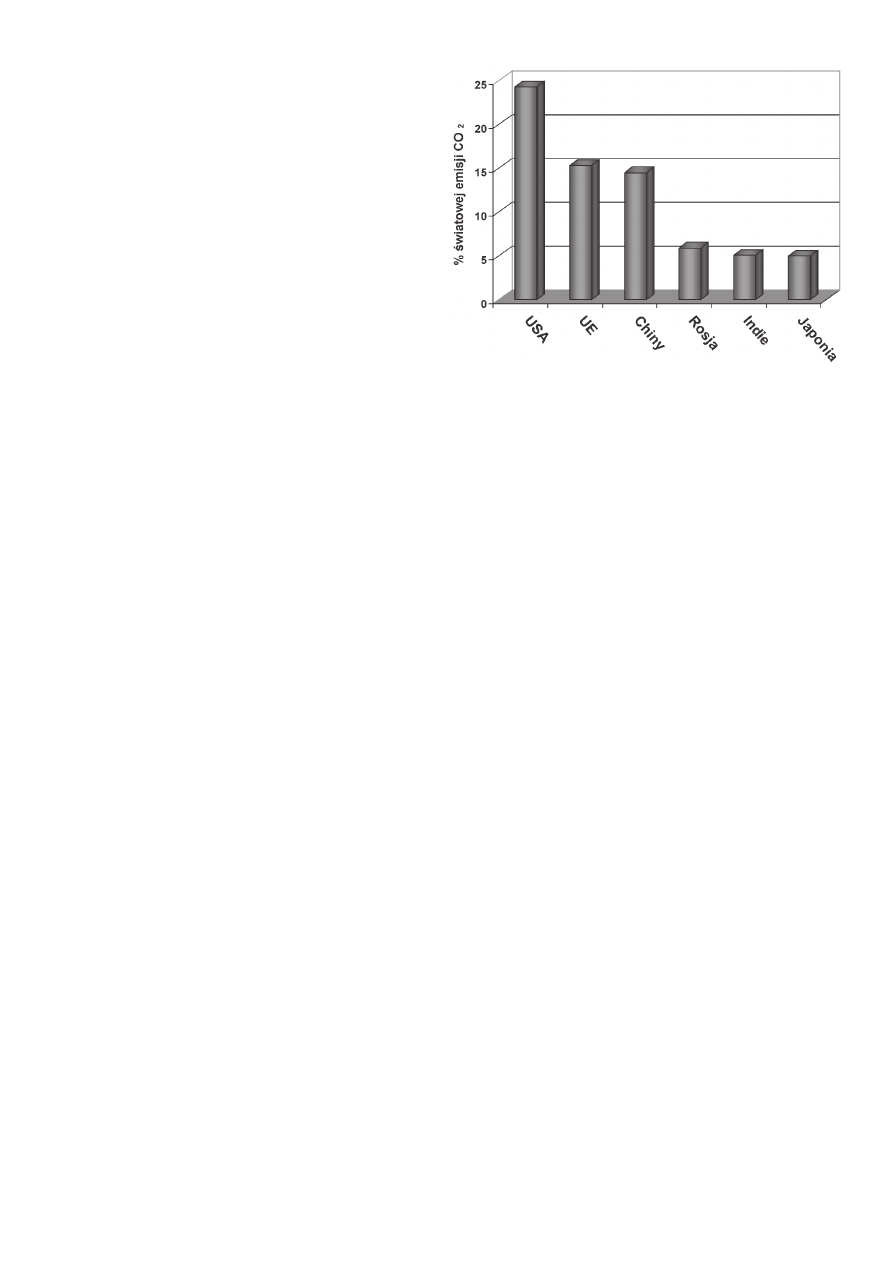
do atmosfery. Rysunek 5 ilustruje obec-
ny udział krajów UE w globalnej emisji antropogenicznego CO
2
.
Jak widać obecny udział krajów UE to około 15% i przewiduje się,
że około roku 2050 udział ten spadnie do najwyżej 8% (172). Warto
podkreślić, że taki spadek udziału krajów UE będzie przede wszyst-
kim wynikiem wzrostu emisji przez pozostałe kraje. Odnotujmy też,
że Stany Zjednoczone, Chiny i Indie nie uczestniczą w programach
wynikających z protokółu z Kioto i z późniejszych ustaleń. Uwzględ-
Kyoto protocol cannot be achieved (166). Who wants to recognize
the situation in detail, must read hundred of pages of the European
Commission materials which he can fi nd in the Internet (167). A
new research shows, that CO
2
emission trade contributes to the
increase of global emission of this gas as a result of transfer of
production to developing countries, not embraced by Kyoto protocol
and with the increasing market of energy consuming products just
in these countries (168).
However, let us that suppose the EU scheme concerning the
CO
2
emission reduction will be favourably implemented. What
will be the effect be? Figure 4. The average share of different
domains of human activities in total anthropogenic CO
2
emission
to atmosphere.
We can note that the actions undertaken till now by the EU con-
cern industry as a whole (transportation problem is the object of
separate regulations (170)), that is they embrace a little more
than 50% of total CO
2
emission to atmosphere. Figure 5 shows
the present share of the EU countries in global emission of an-
thropogenic CO
2
.
As it is shown, the present share of the EU countries is about
15% and it is predicted that approximately in 2050 this share will
decrease to 8% utmost (172). It is worth stressing, that this de-
crease of the EU share will
chiefl y result in the increase
of emission in the remaining
countries. Let us observe
that the United States of
America, China and India
do not participate in the
programs resulting from
Kyoto protocol and later de-
cisions. Taking into account
this information it can be
stated that the present EU
actions embrace about 7-
8% of global CO
2
emission
and in the near future this
share will fall to below 5%.
Because the share of CO
2
in the greenhouse effect is
estimated, according to dif-
ferent sources, on the level
of 9-26% (173) then the ac-
tions of the EU concerning the decrease of CO
2
emission concern
more or less 1% contribution to the alternative Earth warming.
Obviously, we do not intend to eliminate totally the CO
2
emission,
but limiting it to about 10% with relation to the emission in 1990,
therefore, in fact, the actions lead to the infl uence of about 0,1%
of the total effect of our globe warming. There are certainly merely
opinions, because nobody is able to carry out accurate calculations
at present and there are no models, which could foresee real ef-
fects of such a small infl uence. The so called climatic fl uctuation
makes its quantitative assessment completely impossible. Anyway,
Rys. 4. Udział różnych obszarów działalności człowieka w całkowitej emisji CO
2
(169)
Fig. 4. Share of different domains of human activity in total CO
2
emission (169)
12
CWB-1/2007
niając powyższe informacje widać, że obecne działania UE dotyczą
około 7-8% globalnej emisji CO
2
i w niedalekiej przyszłości wartość
ta spadnie poniżej 5%. Ponieważ udział CO
2
w efekcie cieplar-
nianym oceniany jest według różnych źródeł na poziomie 9-26%
(173), to działania krajów UE w zakresie ograniczeń emisji CO
2
dotyczą mniej więcej 1% wkładu do ewentualnego podgrzewania
Ziemi. Oczywiście nie zamierzamy całkowicie wyeliminować emisji
CO
2
tylko ograniczyć ją o około 10% w stosunku do emisji w roku
1990, zatem faktyczne działania prowadzą do wpływu na około
0,1% całkowitego efektu podgrzewania naszego globu. To oczy-
wiście zaledwie oceny, ponieważ dokładnych obliczeń nikt nie jest
w stanie obecnie przeprowadzić i nie istnieją żadne modele, które
mogłyby przewidywać rzeczywiste efekty tak małego wpływu. Tak
zwane fl uktuacje klimatyczne wręcz uniemożliwiają jego ilościową
ocenę. Tak czy inaczej, przeprowadzone z powodzeniem (co jest
wątpliwe) działania UE, przy założeniu słuszności przewidywań
modeli IPCC na najbliższe stulecie dają w efekcie obniżenie
spodziewanego wzrostu przeciętnej temperatury Ziemi o mniej
niż 0,005°C. Wszystko to za cenę 2,9 - 3,7 miliarda euro rocznie
do roku 2012 (174). Czy trudno ocenić jaki udział mają w tych
0,005°C producenci na przykład cementu, którzy odpowiadają za
5-7% całkowitej emisji CO
2
?
Mimo wszelkich wysiłków pojawiają się znaczące głosy, że średnia
temperatura Ziemi, już przy obecnej zawartości CO
2
w atmosferze
i tak będzie rosła (175). Wszystko też wskazuje, że emisja CO
2
w najbliższych kilkudziesięciu latach także będzie rosła. Wiele
argumentów przemawia też za tym, że żyjemy w kolejnym okresie
ocieplania się klimatu i nic nie możemy z tym zrobić w obliczu
potęgi czynników, które o tym decydują.
Jaka więc jest odpowiedź na pytanie nr 5? Zdaniem autora ta od-
powiedź jest negatywna. Niezależnie od tego, czy antropogeniczny
CO
2
wywiera bardziej czy mniej istotny wpływ na globalne ocieple-
nie, działania podjęte przez UE (przynajmniej działania planowane
do 2012 roku) nie są w stanie wywrzeć żadnego istotnego wpływu
na to co stanie się z naszym klimatem w XXI wieku. Za to działa-
nia te na pewno będą miały znaczenie w sensie ekonomicznym
i politycznym. Wielu zbije kapitał, wielu osiągnie szczyty kariery
politycznej. Taki czas i taka moda. Brak odpowiedzi na pytanie, czy
tych kilka miliardów euro rocznie, które wydamy na dość utopijne
działania, zainwestowane w krajach rozwijających się i biednych
nie przyniosłyby większego i lepszego efektu nawet z punktu
widzenia ograniczania emisji CO
2
w nadchodzącej przyszłości?
To zdumiewające, ale postanowiliśmy wydać poważne środki na
działania, które do postawionego celu nas nie doprowadzą, nawet
jeżeli cel ten jest szlachetny i słuszny.
Możemy przejść do pytania ostatniego, czy w ogóle powinniśmy
ograniczać emisję CO
2
, czy powinniśmy przejmować się tym prob-
lemem wobec tylu wątpliwości odnośnie celowości i efektywności
naszych działań? Na szczęście odpowiedź na to pytanie nie po-
winna budzić żadnych wątpliwości. Tak - powinniśmy ograniczać
emisję CO
2
do atmosfery i to wcale nie dlatego (a w każdym razie
nie tylko dlatego), że powoduje to ocieplenie klimatu. Emisja an-
tropogenicznego CO
2
do atmosfery oznacza przede wszystkim
the successful EU actions, (which is doubtful), under assumption
of legitimacy of IPCC models for the nearest centuries, give an
effect of lowering of the expected increase of the average Earth
temperature less than 0,005
o
C. All this for the price of 2,9-3,7 billion
€ per annum from 2012 (174). Is it diffi cult to evaluate the share
in this value of 0,005
o
C of producers, for example, of cement who
are responsible for about 5-7% of total CO
2
emission?
Despite of all efforts, important voices appear that the average
Earth temperature even in present CO
2
content in atmosphere
will increase anyhow (175). Everything also shows, that the CO
2
emission in nearest few dozen years will also increase. Many argu-
ments support also the view that we live in a consecutive period of
climate warming and we cannot do anything about this, facing the
power of factors which have the deciding infl uence.
What then is the answer to question 5? According to the author, this
answer is negative. Independently from this, if the anthropogenic
CO
2
has a more or less important infl uence on global warming, the
actions undertaken by the EU (at least actions planned till 2012)
are not able to exert an important infl uence on the climate changes
in the 21
st
century. In return, these actions will be important in
economic and political sense. Many will make a fortune, many will
reach the peaks of political career. It is this time and this fashion.
It is a lack of answer to the question if these some billion € per an-
num, which we will spend on these rather utopian actions, invested
in developing and poor countries, could not bring a greater and
better effect even from the point of view of the limitation of CO
2
emission in the approaching future. It is amazing, but we decided
to spend large amounts of money on actions which will not lead
us to the set goal, even if this goal is noble and correct.
We can pass to the last question. Should we limit the CO
2
emission
at all, should we take over this problem because of so many doubts
about the usefulness and effi ciency of our actions? Fortunately, the
answer to this question should not arouse doubts. Yes, we should
limit the CO
2
emission to atmosphere and not at all because of
these reasons (and in every case not only because), and because
Rys. 5. Udział największych producentów CO
2
w globalnej emisji (fo)
Fig. 5 Share of the biggest CO
2
producers in global emission (171)

CWB-1/2007
13
spalanie paliw kopalnych: węgla, ropy naftowej i jej pochodnych
oraz gazu ziemnego. Czy potrzebne jest uzasadnienie, że nasza
cywilizacja, na obecnym etapie rozwoju, nie może obejść się bez
tych surowców? Nie chodzi tylko o produkcję energii, ale o cały
przemysł chemiczny związany z przeróbką ropy naftowej i węgla
kamiennego. Bez węglowodorów i ich pochodnych (tworzywa
sztuczne) na obecnym etapie rozwoju nasza cywilizacja nie może
istnieć nawet kilka miesięcy. Tymczasem zasoby ropy naftowej już
w niezbyt odległej perspektywie zaczną się kończyć. Martwimy się
o to jaka będzie średnia temperatura Ziemi pod koniec bieżącego
stulecia, a może powinniśmy się martwić jaki będzie świat bez ropy
naftowej, który nieodwołalnie nas czeka jeszcze przed końcem
tego stulecia. Węgiel kopalny powinien zaspokoić nasze potrzeby
przez jeszcze 200-300 lat (chociaż nie jest to pewne, jeżeli będzie
on musiał „zastąpić” ropę naftową). Czy jesteśmy przygotowani na
świat bez ropy naftowej i węgli kopalnych? Nie jesteśmy – i dlatego
dajmy sobie czas i ograniczajmy zużycie paliw kopalnych by mieć
je na nieco dłużej. Oto rzeczywisty i jasny powód działania, które
w efekcie przyniesie także ograniczenie emisji CO
2
do atmosfery,
zanim sama Przyroda wymusi na nas to ograniczenie. Od czego
powinniśmy zacząć? Od działań o charakterze strategicznym,
których efekty są wymierne i znaczące, nie takie jak wskazana
redukcja ocieplenia klimatu o 0,005°C. Na takich działaniach
powinny zostać skoncentrowane środki, których nie powinno się
rozpraszać pomiędzy 12 000 instalacji emitujących CO
2
. Czy moż-
na wskazać takie działania? Ależ oczywiście! Głównym emitorem
CO
2
jest energetyka (w Polsce to ponad 50%, średnia w krajach
rozwiniętych wynosi około 35%). Do roku 2020 Polska chcąc
utrzymać swoje tempo rozwoju będzie musiała podwoić produkcję
energii elektrycznej. Zanim fantaści wmówią nam, że uzyskamy
to za pomocą pokrycia naszego kraju bateriami słonecznymi, wia-
trakami i uprawami wierzby energetycznej, wykorzystajmy realne
sposoby. Sposób taki istnieje i jest jak na dziś tylko jeden, a jest nim
energetyka jądrowa (176, 177). Energetyka jądrowa to oszczęd-
ność paliw kopalnych, to radykalne ograniczenie emisji CO
2
do
atmosfery. Kraje, które odżegnywały się od energetyki atomowej
coraz głośniej mówią o powrocie do niej. Powiedzmy to jasno, czy
się to komuś podoba czy też nie – nie mamy innego wyjścia. I to
droga, którą Europa powinna wskazywać także przy okazji walki
z globalnym ociepleniem, redukcją emisji CO
2
i oszczędnością
paliw kopalnych, by dać czas przyszłym pokoleniom.
Czas byśmy sobie uświadomili, że przed nami stają daleko poważ-
niejsze wyzwania i problemy niż globalne ocieplenie. Problemy,
których dziś nie umiemy rozwiązać.
Może jeszcze zdążymy....
Literatura / References
1. IPCC, Climate Change 2001: The Scientifi c Basis., ed. J.T. Houton.,
Cambridge Univ. Press 2001.
2. http://www.opinionjournal.com/extra/?id=110008220
3. Witze, 2006. Tempers fl are at hurricane meeting. Nature 441:11.
4. http://pubs.acs.org/hotartcl/cenear/951127/pg1.html
it causes climate warming. The emission of anthropogenic CO
2
to
atmosphere means principally the combustion of fossil fuels: coal,
crude oil and its derivatives or natural gas. Is the justifi cation neces-
sary, that for our civilisation, on the present stage of development,
these raw materials are inevitable? It is not only the problem of
energy production, but of the total chemical industry linked with
crude oil and hard coal processing. Without hydrocarbons and
their derivatives (plastics) our civilisation on the present stage of
development cannot exist even for some months. Meanwhile, crude
oil resources already in not a very distant perspective will begin
to fi nish. We worry about the average Earth temperature on the
end of present century, and maybe we should be worrying what
the world without crude oil will be, which irrevocably is awaiting us
already before this century. Hard coal should satisfy our needs for
another 200-300 years (however, it is not sure if it should replace
crude oil). Are we prepared for the world without crude oil and hard
coal? We are not – and therefore let us give the time and limit the
consumption of fossil fuels to have them for a little longer. It is
the real and clear reason of action, the effect of which will be the
limitation of CO
2
emission to atmosphere, before nature itself will
put on us this restriction. What should we begin from? From the
actions of strategic character, the effects of which are measurable
and serious, not such as an indicated reduction of climate warm-
ing of 0,005
o
C. These actions should not be distracted among
12 000 installations emitting CO
2
. Can we show such actions? Of
course yes! The main CO
2
emitter is energy industry (in Poland
50%, the average in the developed countries is about 35%). Till
2020 Poland, willing to maintain its rate of development, should
double the electric energy production. Before dreamers make us
believe that we can get this with the sun batteries, windmills and
cultivation of energetic willow, let us use real ways. Such a method
is at present only one – it is nuclear power engineering (176, 177).
Nuclear power engineering means economy of fossil fuels and
radical reduction of CO
2
emission to atmosphere. The countries
which abstained from nuclear power engineering, speak louder
and louder about the return to it. Let us say it clear, if it is pleasant
to somebody or not, we have no other solution. It is the way which
should be shown by Europe also in the opportunity of struggle with
global warming, reduction of CO
2
emission and economy of fossil
fuels, to give time for future generations.
It is time to make us aware that there are much more serious chal-
lenges and problems before us than global warming. Problems
which we do not know how to solve.
May be we will still manage to do this...

14
CWB-1/2007
5. http://www.cem.msu.edu/~cem181h/projects/98/global/gw&everydaylife.
html
6. http://ec.europa.eu/environment/climat/pdf/cc_factsheet_aug2005.pdf
7. http://www.policyalmanac.org/environment/global_warming.shtml
8. Z.W. Kundzewicz, Wiedza i Życie, nr 7 (2001).
9. http://www.lenntech.com/greenhouse-effect/global-warming-history.
htm
10. http://lwf.ncdc.noaa.gov/oa/climate/globalwarming.html
11. http://healthandenergy.com/climate_change.htm
12. http://www.brighton73.freeserve.co.uk/gw/globalwarmingfaq.htm
13. http://www.eco.freedom.org/el/20050602/gielow.shtml
14. J. D. Mahlman, Annu.Rev.Energy Environ. 23 (1998) 83-105.
15. http://www.lenntech.com/greenhouse-effect/global-warming-discussion.
htm
16. A. Małecki, Materiały Ceramiczne, 4 (2005) 148-155.
17. http://jpn.cec.eu.int/home/news_en_newsobj1585.php
18. http://oceanography.geol.ucsb.edu/Ocean_Materials/Mini_Studies/
Man_and_Climate_Change/Man_and_Climate_Change.html
19. http://www.huppi.com/kangaroo/L-globalwarming.htm
20. http://yosemite.epa.gov/oar/globalwarming.nsf/UniqueKeyLookup/
SHSU5BUM9T/$File/ghg_gwp.pdf
21. http://www.agu.org/eos_elec/99148e.html
22. http://www.brighton73.freeserve.co.uk/gw/causes.htm#natural
23. http://earthtrends.wri.org/pdf_library/data_tables/cli1_2005.pdf
24. http://cdiac.esd.ornl.gov/pns/current_ghg.html
25. http://www.physicalgeography.net/fundamentals/7h.html
26. http://en.wikipedia.org/wiki/Greenhouse_effect
27. http://www.ucar.edu/learn/1_3_1.htm
28. http://www.science.org.au/nova/016/016key.htm
29. http://arch.rivm.nl/env/int/ipcc/docs/css2002/ccs02-01.pdf
30. http://www.whole-systems.org/co2.html
31. http://www.lenntech.com/carbon-dioxide.htm
32. http://www.oism.org/pproject/review.pdf
33. http://www.aip.org/history/climate/co2.htm
34. http://members.aol.com/trajcom/private/carbon3.htm
35. http://www.answers.com/topic/carbon-dioxide-sink
36. http://science.hq.nasa.gov/oceans/system/carbon.html
37. http://www.agu.org/sci_soc/eissabine.html#greenhouse%20effect
38. http://www.angelfi re.com/fl 4/globalcooling/
39. http://www.john-daly.com/ahlbeck/ahlbeck.htm
40. http://www.ncpa.org/hotlines/global/pd11498f.html
41. http://www.pnas.org/cgi/content/full/94/16/8308
42. http://www.scienceblog.com/community/older/2004/6/20045329.
shtml
43. http://cdiac.ornl.gov/new/keel_page.html
44. http://earthtrends.wri.org/pdf_library/data_tables/cli5_2005.pdf
45. http://cdiac.ornl.gov/trends/emis/meth_reg.htm
46. A. Hołdys, „Rachunek za podgrzanie Ziemi”, Gazeta Wyborcza z
15.11.2006
47. http://www.ipcc.ch/
48. http://en.wikipedia.org/wiki/United_Nations_Framework_Convention_
on_Climate_Change
49. http://www.greenhouse.gov.au/international/unfccc.html
50. http://europa.eu/press_room/presspacks/climate/conveng.pdf
51. http://www.biomasa.org/edukacja/zmianyklimatyczne/swiat_wobec_
zmian/szczyt_ziemi
52. Dz.U. z 1996 r. nr 53, poz.238.
53. http://unfccc.int/resource/docs/convkp/kpeng.html
54. http://cop3.org/
55. http://www.pewclimate.org/what_s_being_done/in_the_world/kyoto_
enters_into_force/index.cfm
56. http://www.abc.com.pl/serwis/du/2005/1685.htm
57. http://www.lenntech.com/greenhouse-effect/Kyoto-emission-
reductions-overview.htm
58. Dz.U. z 2002 nr 144 poz. 1207.
59. http://europa.eu/rapid/pressReleasesAction.do?reference=IP/06/
format=HTML&aged=0&language=EN&guiLanguage=en
60. http://www.nfos.org.pl/aktual/TOR_UNFCCC.pdf
61. http://jpn.cec.eu.int/home/news_en_newsobj1585.php
62. http://www.ine-isd.org.pl/rozne/REC_raport_klimatyczny.pdf
63. http://europa.eu/rapid/pressReleasesAction.do?reference=MEMO/05/
format=HTML&aged=1&language=EN&guiLanguage=en
64. Directive 2003/ 87/EC of the European Parliament, Offi cial Journal of
the EuropeanUnion, 21.10.2003
65. http://ec.europa.eu/environment/climat/pdf/pres_actions_cc_montreal_
051205.ppt
66. http://ec.europa.eu/environment/climat/pdf/cc_factsheet_aug2005.
pdf
67. http://www.europa.eu.int/comm/environment/climat/pdf/comm_en_
050209.pdf
68. http://europa.eu/press_room/presspacks/climate/staff_work_paper_
sec_2005_180_3.pdf
69. http://www.dw-world.de/dw/article/0,,710267,00.html
70. J.M. Barosso, „Europa a klimat i energia”, Gazeta Wyborcza z
14.11.2006
71. http://www.euractiv.com/en/sustainability/climate-credibility-stake-warn-
economists/article-159565
72. http://www.euractiv.com/en/sustainability/climate-change-eu-emissions-
trading-scheme-eu-ets/article-133629
73. http://ec.europa.eu/environment/climat/pdf/highlights_ets_en.pdf
74. http://www.climnet.org/EUenergy/ET.html
75. http://europa.eu/rapid/pressReleasesAction.do?reference=IP/05/
format=HTML&aged=0&language=EN&guiLanguage=en
76. http://www2.uni-siegen.de/~vwliv/download/Pethig_UCF_presentation.
pdf
77. http://www.cei.org/pdfs/McKitrick.pdf
78. http://www.ieta.org/ieta/www/pages/index.php?IdSitePage=1254
79. http://minerals.usgs.gov/ds/2005/140/cement.pdf
80. http://gcisolutions.com/GCINOTES198.htm
81. http://www.gispri.or.jp/calculation/ghg/pdf/cement_protocol_v2-or.pdf
82. http://www.ecosmart.ca/enviro_statistics.cfm
83. http://www.co2cement.com/english/index.cfm
84. http://www.propubs.com/climate/climate.html
85. http://www.wbcsdcement.org/pdf/co2-protocol.pdf
86. CO2 Accounting and Reporting Standard for Cement Industry, World
Business Council for Sustainable Development, June 2005.
87. http://www.ameinfo.com/27256.html
88. http://www.wbcsd.org/DocRoot/oSQWu2tWbWX7giNJAmwb/fi nal_
report8.pdf
89. http://www.washingtonpost.com/wp-dyn/content/article/2005/06/28/
AR2005062801248.html
90. http://www.cato.org/speeches/sp-jt011698.html
91. http://www.lenntech.com/greenhouse-effect/global-warming-discussion.
htm
92. http://chemistry.beloit.edu/Warming/
93. http://wiadomosci.gazeta.pl/wiadomosci/1,53600,3507719.html
94. http://www.johnstonsarchive.net/environment/wrjp365g.html
95. http://www.sovereignty.net/p/clim/warming97.htm
96. http://science.nasa.gov/NEWHOME/headlines/essd5feb97_1.htm
97. http://www.nsc.org/EHC/climate/ccucla8.htm
98. http://www.oism.org/pproject/s33p36.htm#Message54
99. http://europa.eu/rapid/pressReleasesAction.do?reference=IP/05/

CWB-1/2007
15
format=HTML&aged=0&language=EN&guiLanguage=en
100. http://mitosyfraudes.8k.com/Calen/Landscheidt-1.html
101. http://www.theage.com.au/articles/2004/11/26/1101219743320.html
102. http://www.climatehotmap.org/antarctica.html
103. http://www.commondreams.org/headlines05/0123-01.htm
104. http://www.grida.no/climate/vital/19.htm
105. http://news.nationalgeographic.com/news/2004/04/0420_040420_
earthday_2.html
106. http://science.howstuffworks.com/global-warming4.htm
107. http://www.geocities.com/lclane2/sealevel.html
108. http://www.iceagenow.com/List_of_Expanding_Glaciers.htm
109. http://www.nature.com/news/2005/050516/full/050516-10.html
110. http://www.iceagenow.com/Antarctic_Ice_Cap_Growing_Thicker.
htm
111. http://www.ctv.ca/servlet/ArticleNews/story/CTVNews/20050928/
arctic_sea_ice_050928/20050928?hub=CTVNewsAt11
112. http://www.iceagenow.com/
113. http://www.ecobridge.org/content/g_evd.htm
114. http://www.environmentaldefense.org/documents/382_myths.htm
115. http://www.elmhurst.edu/~chm/vchembook/globalwarmA2.html
116. http://physicist.org/history/climate/co2.htm
117. http://www.seed.slb.com/en/scictr/watch/climate_change/causes_co2.
htm
118. http://isi-eh.usc.es/resumenes/122_41_abstract.pdf
119. http://www.espere.net/Unitedkingdom/water/uk_watervapour.html
120. http://lwf.ncdc.noaa.gov/oa/climate/gases.html
121. http://news.softpedia.com/news/A-New-Explanation-of-Global-
Warming-19650.shtml
122. http://www.clearlight.com/~mhieb/WVFossils/greenhouse_data.html
123. http://mustelid.blogspot.com/2005/01/water-vapour-is-not-dominant.
html
124. http://ff.org/centers/csspp/library/co2weekly/2005-08-18/dioxide.
htm
125. S. Stanley, Historia Ziemi, PWN Warszawa 2002.
126. http://www.clearlight.com/~mhieb/WVFossils/ice_ages.html
127. M. Rutkowski, Wiedza i Życie nr 10 (2001).
128. http://www.john-daly.com/zjiceco2.htm
129. http://www.pmel.noaa.gov/pubs/outstand/feel2331/feel2331.shtml
130. http://www.john-daly.com/guests.htm
131. http://www.nap.edu/html/climatechange/
132. Z. Jaworowski, Czy człowiek zmienia klimat, Wiedza i Życie, nr 5
(1998).
133. http://www.john-daly.com/press/index.htm
134. http://www.warwickhughes.com/priem/hpriem.htm
135. http://oceanography.geol.ucsb.edu/Ocean_Materials/Mini_Studies/
Man_and_Climate_Change/Man_and_Climate_Change.html
136. http://www.gfdl.noaa.gov/~gth/web_page/article/EG230083_letter.
pdf
137. http://www.answersingenesis.org/articles/am/v1/n2/human-caused-
global-warming
138. http://www.iceagenow.com/UN_Downgrades.htm
139. http://www.iceagenow.com/Ocean_Warming.htm
140. www.hs.uni-hamburg.de/cs13/day1/03_Solanki.ppt
141. http://www.john-daly.com/solar/solar.htm
142. http://www.fathersforlife.org/REA/warming4.htm
143. http://www.cseg.ca/recorder/pdf/2001/11Nov/01_Nov2001.pdf
144. F. Christensen, K. Lassen, Science, 254 (1991) 698-700.
145. http://en.wikipedia.org/wiki/Global_warming#Climate_models
146. http://www.giss.nasa.gov/edu/gwdebate/
147. http://www.cnsnews.com/ViewNation.asp?Page=/Nation/
archive/200205/NAT20020514b.html
148. http://www.john-daly.com/ipcc-co2/ipcc-co2.htm
149. http://www.brusselsjournal.com/node/1099
150. http://www.atmosphere.mpg.de/enid/Climate_in_brief/-_Clouds__
Aerosol_2t8.html
151. http://earthobservatory.nasa.gov/Library/Aerosols/
152. http://terra.nasa.gov/FactSheets/EnergyBalance/
153. http://motls.blogspot.com/2006/09/southern-hemisphere-ignores-
global.html
1 5 4 . h t t p : / / e a r t h o b s e r v a t o r y . n a s a . g o v / N e w s r o o m /
MediaAlerts/2006/2006120523852.html
155. http://www.eurekalert.org/pub_releases/2006-12/uoa-soc120406.
php
156. http://www.europa-eu-un.org
157. http://ec.europa.eu/environment/climat/home_en.htm
158. http://europa.eu/rapid/pressReleasesAction.do?reference=IP/06/
format=HTML&aged=0&language=EN&guiLanguage=en
159. http://www.eea.europa.eu/pressroom/newsreleases/GHG2006-en
160. http://www.iea.org/textbase/papers/2002/Weoc02.pdf
161. http://www.ens-newswire.com/ens/nov2006/2006-11-29-02.asp
162. K. Niklewicz,, „Unijne zakazy poszły z dymem”, Gazeta Wyborcza
z 14.11.2006.
163. http://europa.eu/rapid/pressReleasesAction.do?reference=IP/06/
1364&format=HTML&aged=0&language=EN&guiLanguage=en
164. http://www.euractiv.com/en/transport/carmakers-reject-eu-plan-co2-
emissions-law/article-159423
165. http://www.publications.parliament.uk/pa/ld200304/ldselect/
ldeucom/179/4050502.htm
166. http://ec.europa.eu/environment/integration/newsalert/pdf/42na1.
pdf
167. http://ec.europa.eu/community_law/eulaw/index_en.htm#infractions
168. http://news.bbc.co.uk/2/hi/science/nature/4542104.stm
169. http://www.earth-policy.org/Indicators/CO2/CO2_data.htm
170. http://ec.europa.eu/environment/climat/pdf/reducing_emissions_
energy_transport.pdf
171. http://en.wikipedia.org/wiki/List_of_countries_by_carbon_dioxide_
emissions
172. http://ec.europa.eu/environment/climat/pdf/comm_en_050209.pdf
173. http://en.wikipedia.org/wiki/Greenhouse_gas
174. http://europa.eu/rapid/pressReleasesAction.do?reference=MEMO/05/
84&format=HTML&aged=0&language=PL&guiLanguage=en
175. http://www.gcrio.org/OnLnDoc/pdf/nasa_predicts_warming.pdf
Wyszukiwarka
Podobne podstrony:
34 Ustawa z dnia 17 lipca 2009 o systemie zarządzania emisjami gazów cieplarnianych
emisja gazów cieplarnianych z transportu 08 r
POZNAJEMY KRAJE UNII EUROPEJSKIEJ
Kraje Unii Europejskiej
Nadciąga wielkie ochłodzenie, EFEKT CIEPLARNIANY - GLOBALNE OCIEPLENIE
Nadciąga wielkie ochłodzenie, EFEKT CIEPLARNIANY - GLOBALNE OCIEPLENIE
Wielkie kłamstwo, EFEKT CIEPLARNIANY - GLOBALNE OCIEPLENIE
Globalne ocieplenie - naukowy fakt czy komercyjny mit, EFEKT CIEPLARNIANY - GLOBALNE OCIEPLENIE
Rozmowa z klimatologiem, EFEKT CIEPLARNIANY - GLOBALNE OCIEPLENIE
Kłamstwo wymierzone w naszą cywilizację, EFEKT CIEPLARNIANY - GLOBALNE OCIEPLENIE
omówienie prezentacji prof. Jaworowskiego Klimatem rządzi słońce, EFEKT CIEPLARNIANY - GLOBALNE OCIE
Polityka, EFEKT CIEPLARNIANY - GLOBALNE OCIEPLENIE, Kontrowersyjna polityka UE
O tematach zastępczych, EFEKT CIEPLARNIANY - GLOBALNE OCIEPLENIE, Ekologia
Koniec zielonej energii tekst, EFEKT CIEPLARNIANY - GLOBALNE OCIEPLENIE, Ekologia
Zagrożenia, EFEKT CIEPLARNIANY - GLOBALNE OCIEPLENIE
Wulkany i mit globalnego ocieplenia, EFEKT CIEPLARNIANY - GLOBALNE OCIEPLENIE
Zmiany klimatu, EFEKT CIEPLARNIANY - GLOBALNE OCIEPLENIE
więcej podobnych podstron