
The Marketing Plan

This page intentionally left blank

William M. Luther
American Management Association
New York • Atlanta • Brussels • Chicago • Mexico City • San Francisco
Shanghai • Tokyo • Toronto • Washington, D.C.
Marketing
Plan
The
How to Prepare and Implement It
4TH EDITION

This publication is designed to provide accurate and authoritative infor -
mation in regard to the subject matter covered. It is sold with the under-
standing that the publisher is not engaged in rendering legal, accounting, or
other professional service. If legal advice or other expert assistance is required,
the services of a competent professional person should be sought.
Library of Congress Cataloging-in-Publication Data
Library of Congress Cataloging-in-Publication Data
Luther, William M.
The marketing plan : how to prepare and implement it /
William M. Luther.—4th ed.
p. cm.
Includes bibliographical references and index.
ISBN-13: 978-0-8144-1693-8
ISBN-10: 0-8144-1693-4
1. Marketing. I. Title.
HF5415.L83 2011
658.8'02—dc22
2010039115
© 2011 William M. Luther.
All rights reserved.
Printed in the United States of America.
This publication may not be reproduced, stored in a retrieval
system, or transmitted in whole or in part, in any form or by
any means, electronic, mechanical, photocopying, recording,
or otherwise, without the prior written permission of AMACOM,
a division of American Management Association,
1601 Broadway, New York, NY 10019.
Printing number
10 9 8 7 6 5 4 3 2 1
Bulk discounts available. For details visit:
www.amacombooks.org/go/specialsales
Or contact special sales:
Phone: 800-250-5308
E-mail: specialsls@amanet.org
View all the AMACOM titles at: www.amacombooks.org
Openmirrors.com

Complete your written marketing plan by the end of the book!
The Marketing Plan
4th Edition
How to Prepare and Implement It
with “what if” software on the AMACOM website

This page intentionally left blank

To my wonderful wife,
Betty

This page intentionally left blank

Acknowledgments xi
Introduction 1
Chapter 6: The Product/Service Plan 73
Calculating Your Marketing Communications
Budget 101
Chapter 10: The Sales Promotion Plan 139
Chapter 11: The Public Relations Plan 153
Chapter 12: The Sales Plan: Pricing 163
Chapter 13: The Sales Plan: Future Sales 175
Chapter 14: The Customer Service Plan 197
Contents
ix

Chapter 15: Maximizing High-Potential Accounts 203
Chapter 16: The Internet Plan 237
Chapter 17: The Research Plan 249
Chapter 18: Pulling the Plan Together 257
Appendix A: Marketing Plan Basics 263
Appendix B: Everything You Need to Know About Working
with an Advertising Agency 275
Marketing Plan “what if” software models
are available free of charge at:
www.amacombooks.org/go/MarketingPlan4
x
Contents
Openmirrors.com

This book has been improved immeasurably by the develop-
mental guidance of my wonderful editor, Ellen Kadin, who
helped me take the manuscript from a rough twenty-page pro-
posal and some software to this completed tome. Along the way,
the manuscript had valuable input from William Helms III,
Ellen’s editorial assistant and right-hand man, and Debbie Pos-
ner, the copyeditor-slash-martinet who wrestled with all the
particulars. This is a better book because of all of their efforts.
Thank you.
Thanks also to the associate editor, Mike Sivilli, and all the
hard-working people who got this book to the printer on time.
xi

This page intentionally left blank

1
The fourth edition of The Marketing Plan differs in a number of
ways from its predecessor, published ten years ago. It includes
ten more years of the experiences and knowledge gained from
helping companies write their marketing plans—in boom
economies and in bust. The book walks you through every part
of the plan, with detailed analysis of case histories. After re-
viewing each case, you can insert on the accompanying soft-
ware the data for your own company and complete your
marketing objectives and strategies. By the time you finish the
book, you can have a complete, written marketing plan for your
own business.
If you go to the AMACOM website, you can download my
computer marketing plan “what if” software models, free of
charge. These allow you to insert your own data into the files and
see the results for your business. The web address is www
.amacombooks.org/go/MarketingPlan4. For best results and
ease of use, you should download the software to either a CD or
your hard drive. Then you can go try different data until you get
the results you are seeking, such as the most effective positioning
of your business, your best target audience, most favorable

pricing, sufficient advertising and sales promotion weight, viable
public relations plans, and enviable customer service plans.
This edition can also better help you develop a popular Internet
site and enable you to become a strong player in the new world
of social media.
The software comes in three parts: case history “what if”
files; “what if” files with formulas for inserting your own
company data; and marketing plan (and other) worksheets
where you insert your objectives and strategies. Although the
book discusses each case history, at your leisure you should
bring up these files and alter some of the inserted data and
then look at the resulting outcomes. Practicing on the case
history files will enable you to see how the formulas work be-
fore you start inserting your company data into your own sec-
tion of the software.
The software is easy to use. You use a spreadsheet like Mi-
crosoft Excel for the “what if” files and a word processing pro-
gram like Microsoft Word for the marketing plan objectives and
strategies and other worksheets. The files that have a “C” in
front of the name are the case histories. The file names that do
not begin with a “C” before the name are the modules into
which you insert your own company data.
When these files are completed, you should print them out
and put them into a document called a “fact book.” This is sup-
porting data for your objectives and strategies and by inserting
the files in this different document, you keep your actual mar-
keting plan short and concise—so everyone will read and act
on it. Your fact book will probably number over a hundred
pages and your marketing plan should only consist of your ob-
jectives and strategies and therefore can be less than twenty
pages. The third part of the software, in the folder labeled
“Worksheets,” contains Word files into which you can insert
your objectives and strategies for each component of your
2
Introduction
marketing plan, along with other useful worksheets. If you
complete each module as you go through the book, your plan
will be written by the end of the last chapter.
The marketing plan belongs on the top of the desk of
everyone involved with marketing so it can constantly be mon-
itored; the fact book can go on their shelves. If you began to
miss an objective, you return to the fact book and make the
necessary changes to support your revised objectives and
strategies.
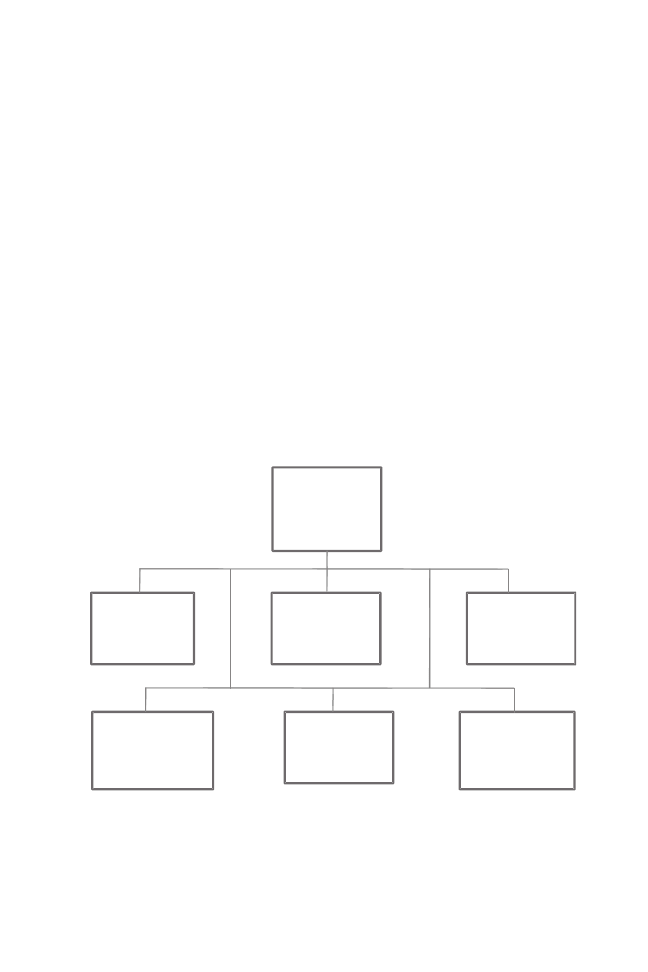
Before showing a list of all the files in the software you will
download, let’s examine the components of a marketing plan
as illustrated in Figure Introduction-1. Each of these plans is
discussed in the book.
Below is a list of the computer files as they pertain to the
components above and the chapter in which they are discussed.
Introduction 3
Figure Introduction-1
Components of a marketing plan.
Market A
Promotion
Plan
Internet
Plan
Research
Plan
Sales
Plan
Customer
Service
Plan
Product/
Service
Plan

Chapter 1
The Planning Process
No files
Chapter 2
Marketing Management
No files
Chapter 3
Market Analysis
Worksheet (your data)
Chapter 4
Customer Analysis
CCUST (case history)
CUST (your data)
Chapter 5
Brand Development
No files
Chapter 6
The Product/Service Plan
CEXCURVE (case history)
EXCURVE (your data)
Objectives and Strategies
(your data)
Chapter 7
Calculating Your Marketing Worksheets (your data)
Communications Budget
Chapter 8
Competitive Analysis
Worksheets (your data)
Chapter 9
The Advertising Plan
CRF (case history)
RF (your data)
Creative Strategy (your data)
Objectives and Strategies
(your data)
Chapter 10 The Sales Promotion Plan
CTRADE (case history)
TRADE (your data)
Objectives and Strategies
(your data)
Chapter 11 The Public Relations Plan
Objectives and Strategies
(your data)
Chapter 12 The Sales Plan: Pricing
CPRICE (case history)
PRICE (your data)
Chapter 13 The Sales Plan: Future Sales
CSALES (case history)
SALES (your data)
Objectives and Strategies
(your data)
Chapter 14 The Customer Service Plan
Objectives and Strategies
(your data)
Chapter 15 Maximizing High-Potential
Worksheets (your data)
Accounts
Chapter 16 The Internet Plan
Objectives and Strategies
(your data)
Chapter 17 The Research Plan
Objectives and Strategies
(your data)
Chapter 18 Pulling the Plan Together
Overall Objectives and Strategies
(your data)
4
Introduction

In the customer analysis section, you determine which
market segment is best, who is involved in the buying decision,
what is their ranking in importance, and what benefits each are
seeking from products or services in your industry. You then do
a report card on your product or service versus the competition
on your ability to deliver these benefits.
In the product/service plan section, you determine the
positioning of your business by using the experience curve to
test the various possibilities and the resulting effects on your
company. Choices include lower pricing (the Wal-Mart
model), value added (Cisco), heavy promotional weight
(Procter & Gamble), advanced sales techniques (IBM),
effective customer service (Disney), and superior manu -
facturing (Apple). Apple also excels in marketing, the most
recent example being Steve Jobs’s decision to provide free
cases for Apple’s new iPhone 4 to correct the malfunctioning
antenna.
In the advertising plan section, you determine the adver-
tising weight you need by using reach and frequency analysis.
Reach is the number of potential customers who have the op-
portunity to see and hear your message, and frequency is the
number of times they have that opportunity during a particular
time period. In the sales promotion plan, you analyze various
activities by comparing their respective costs against the value
of a sales presentation and resulting profit. In the public rela-
tions plan section, you determine which activities will give you
the greatest amount of free publicity.
In the pricing section of the sales plan, you learn that you
should not price to obtain the maximum amount of sales or the
greatest marginal income per unit, but rather, the greatest total
amount of marginal income. In the second chapter on the sales
plan (future sales), you calculate all the factors that determine
a sale and profit—including customer awareness, distribution,
Introduction 5

trial, repeat sales, units per purchase, price per purchase, costs,
profit, and market share.
In the customer service plan section, you determine how to
change this part of your business from being a department into
an attitude that permeates every aspect of the business, not just
the customer service desk.
In the Internet plan section, you are shown sources that
will help you develop the type of website you should have, im-
prove your keywords, and get listed on the search engines, as
well as enable you to take advantage of all the opportunities
available on social media. In the research plan section, bench-
mark studies, focus groups, and other types of research are
discussed, showing you how to keep monitoring your market-
ing plan.
Each of the “what if” files have several ranges and after you
load a file, their names will appear on the drop-down menu on
the left-hand side of the screen under the word “clipboard,” as
shown in Figure Introduction-2. If they do not appear at first, click
on the little down arrow about a third of the way down on the left-
hand column. When you click on one of the ranges, the computer
will take you to that part of the file. Note also that many of the files
also have some charts; these are listed along the bottom of the
spreadsheet, and need only be clicked on to appear. The ranges
for each of the files are reproduced inside the appropriate chap-
ter in the book. As you go through the book, you should open the
files referred to in each chapter. For example, in Chapter 4, Cus-
tomer Analysis, the files discussed are CCUST.xls for the case his-
tory and CUST.xls for your data.
As you go through the book, fill out the worksheets that ac-
company the chapters, as they are an integral part of—in fact,
they comprise—your final marketing plan.
6
Introduction

Figure Introduction-2
Examples of range names within a file.
Introduction 7

This page intentionally left blank

Someone (I’d love to give proper credit, but don’t know to
whom) described the anatomy of a business shown in Figure
1–1 below:
Figure 1–1
Anatomy of a business.
Brain
(marketing skills)
Spinal column
vertebras
(markets)
Spinal cord
(planning)
Muscles
Research
CS
Internet
P/S
Mktg. Com.
Sales
9
Openmirrors.com

10
The Marketing Plan
I’m hoping this book will add a few things upstairs and
strength your muscles.
A Strategic Plan Is Your First Order of Business
Any planning for a business should start with a strategic plan.
A strategic plan is a long-range plan, but not all long-range
plans are strategic. In strategic planning you start with an
analysis of the markets relative to what you are doing now and
you attempt to determine what you could be doing in the fu-
ture for maximum profitability.
First, of course, you must determine your market. A mar-
ket is a group of potential or current customers that have a
similar need or desire—or what you believe they will want or
need—and share a common group of competitors, distribu-
tion channels, and packaging.
You need only look out the window to see the markets
passing by. If Microsoft had been looking out the window, it
would have entered the search engine business years ago, long
before Google got so strong. Microsoft made a failed attempt
to purchase Yahoo! and is attempting to play catch-up by in-
troducing its own search engine, Bing. Not there yet: its recent
market share (summer 2010) of all U.S. search engines, ac-
cording to comScore, was only 13.6 percent versus Yahoo at
20.1 percent and Google at 61.6 percent.
Conversely, Cisco, the worldwide leader in networking, has
made four major acquisitions in 2009, including Norway’s
Tandberg, which is in the video conferencing market.
You should not confuse strategic planning with Six Sigma.
Six Sigma is a business management strategy that can help you
improve your bottom line. It seeks to improve the quality of
process outputs by identifying and removing the causes of de-
fects and variability in manufacturing and business processes.

That’s great, but Six Sigma should only be used after you decide
which way you are headed in the future. Your strategic plan-
ning process should lead you to determine where you can
make good money by increasing the value or cutting price in a
current or future strength area in which the competition is least
apt to follow.
My interpretation of the phrase “looking out the window” is
shown in Figure 1–2 below.
There are three “windows” you should be looking out of.
The first involves the present customer groups and I recom-
mend that it account for about half of your efforts. The second
involves adjacent markets, from which you hope to acquire
new customer groups. That is, you are innovating in a business
area adjacent to your core business. This should account for
about 30 percent of your efforts. The third thing you should be
looking for is entirely new markets, where you are expanding
outside of your core business. I recommend that this activity
account for about 20 percent of your resources.
Examples of the second strategy are MillerCoors LLC test-
ing the sale of $20.00 draft beer systems for consumers to
drink at home, PepsiCo purchasing independent soft drink
bottlers, and Oracle purchasing Sun Microsystems. Examples
of the third strategy are DuPont going from textiles to science-
based industries and the San Francisco Examiner going on
YouTube.
Unlike many other consultants, I believe that the strategic
Figure 1–2
Innovation.
Current
customers
Adjacent
markets
The Planning Process 11
Entirely new
markets

plan should not be developed by just the board of directors and
top management, but that managers and line personnel should
also be included. For example, when you analyze markets, you
should determine what the customers want, what are the ben-
efits that turn them on—and no one can do that better than
your marketing team. That is why the marketing plan, as well as
other business component plans, should be developed along-
side of the strategic plan.
According to Ted Mininni, president of Design Force, Inc.:
For brands to be truly resonant, new thinking must permeate
the entire company from top to bottom. Today’s successful
brands must:
• Be disruptive and creative. OXO has redesigned the
most mundane of objects like the measuring cup and
vegetable peeler in a whole new way to make it easier
for everyone, especially aging and handicapped peo-
ple, to easily execute household chores, creating strong
brand adherents.
• Generate excitement. The master at this, Apple, built
buzz around the imminent launch of its new, long-
awaited iPad . . . ambitiously stating the company is go-
ing to carve out a new product category—yet again!
• Entertain. Unilever’s Axe brand of grooming products
ingeniously aims at a young men’s market by focusing
on building a brand that ensures positive experiences
between them and young females in a modern version
of the Dating Game.
• Engage. Crayola continues to engage even today’s high-
tech kids. By moving away from its former branding as an
art supply company to a provider of childhood creativity,
the brand remains vibrant and relevant.
12
The Marketing Plan

The Planning Process 13
• Add convenience to consumers’ lives. Staples Easy but-
ton infers home offices and businesses will easily find the
products they need; enjoy expert service, advice, and
substantive help like computer repair service. Simple, di-
rect, effective branding. . . .
But here’s an important point: brands can’t simply launch
one exciting concept and then sit back. They have to con-
tinue to create excitement. If that sounds tough—not every
company can be like Apple right?—it may not be as hard as
it sounds. Creativity and innovation feeds on itself and
brands can borrow a page from companies that are far
smaller than Apple or Google.
For more information on how to develop your strategic
plan, go to my website (www.wml-marketing.com) and exam-
ine the software I have for sale.
Beyond the Strategic Plan
After the strategic plan comes the business plan. The strategic
plan should project the company five to ten years into the fu-
ture and the business plan executes the strategic plan in more
detail for the first two or three years. The business plan en-
compasses the entire business and includes information about
the various components of the business, including marketing.
The third level of plans are the individual plans for the var-
ious components, such as the marketing, sales, and pricing
plans, that are the greatest in detail and usually have a time pe-
riod of one year.
In examining your markets, you want to determine what
benefits your product/service can or will offer to the customer.
Figure 1–3 shows an ad for a law firm in New York with the
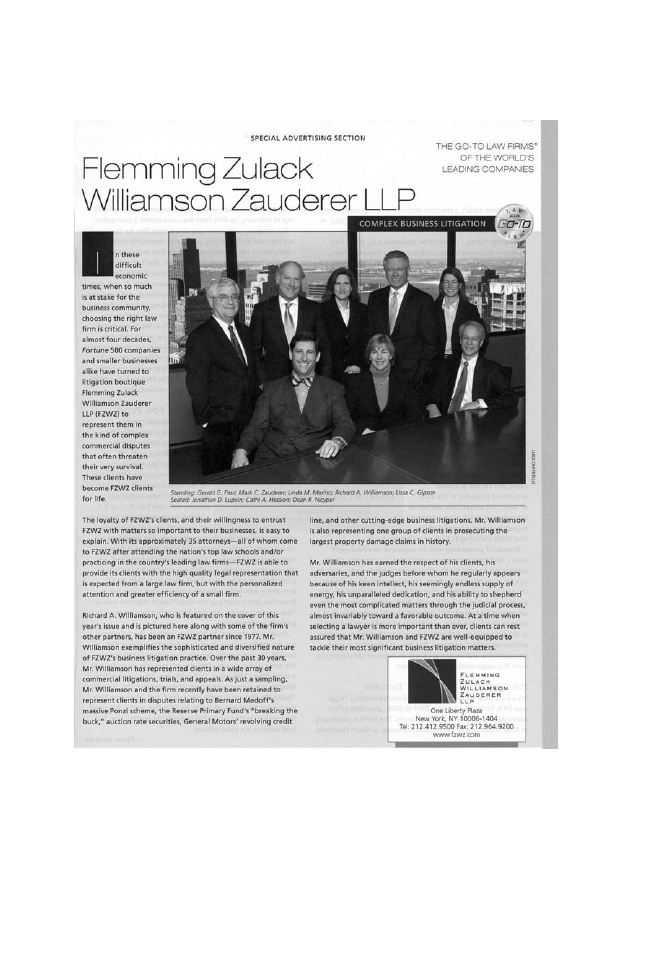
headline, “Flemming Zulack Williamson Zauderer LLP.” Now, if
the market is individuals looking for a law firm to hire, would
that headline turn them on?
I don’t think so.
Figure 1–3
Law firm.
14
The Marketing Plan

Figure 1–4 shows an ad for Mandarin Oriental, The Hotel
Group. It doesn’t really have a headline unless you are refer-
ring to the words, “He’s a fan.” In the small type below the pic-
ture it tells you that the name of the person sitting in the chair
Figure 1–4
Mandarin Oriental, The Hotel Group.
The Planning Process 15
is Dennis Hopper and provides a URL “to find out why [he’s]
a fan . . .”
Even if the celebrity shown were Roger Federer and Rafa
Nadal rolled into one, would this endorsement provide those
looking for a hotel a reason for staying at this one? If it doesn’t
find customers, it’s worthless.
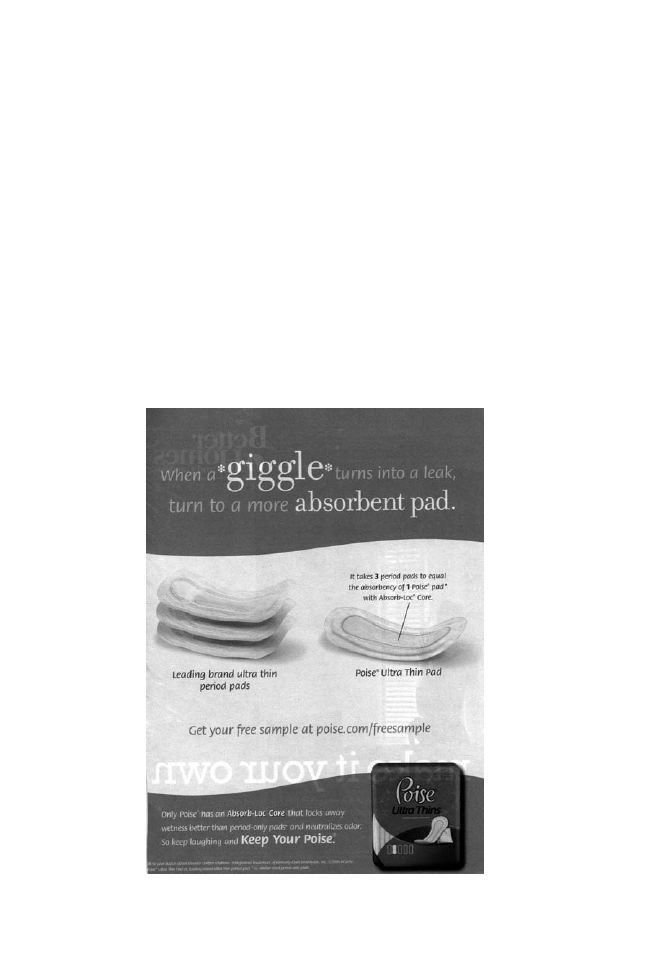
Now compare those two ads with the one shown in Figure
1–5 for Poise Ultra Thins. The headline reads, “When a giggle
turns into a leak, turn to a more absorbent pad.” If the market is
incontinent women, I believe they definitely would want to
know more about this product.
Figure 1–5
Poise Ultra Thins.
16
The Marketing Plan

The Planning Process 17
When it leaves the factory, it’s lipstick; when it’s opened by
the customer, it’s hope.
In marketing, you always want to lead with a benefit to the
customer, whether it’s an ad, sales call, brochure, or trade show.
You then support the benefit with the features of your prod-
uct/service. Fitness centers advertise that their service will
build body tone and help you lose weight. That may be true, but
those are features. The main reason individuals go to work out
is to look more attractive. That’s the benefit. Many company
brochures I see have a very attractive photograph of the cor-
porate headquarters on the cover. I could never figure out why,
because they are not trying to sell their building. If, for example,
you are a manufacturer of torsion bar springs for automobiles,
please don’t show your plant on the brochure cover. Don’t
even list the features of the product, such as greater storage of
energy per pound. Put that on the inside of the brochure to sup-
port the benefit. On the cover you want the benefit of less
weight and smaller space to increase mileage and provide more
room in the automobile. You want the reader to turn the cover
of the brochure, so give her a reason for going inside the
brochure. Chapter 4 will be devoted to analyzing the customer.
The Fact Book, Objectives and Strategies, and
Action Plans
The fact book may be the single most important “product” of
your work with this book. It is the fact book that drives your
marketing plan, just as the strategic plan drives which markets
you should be participating in. Most of the data you insert into
the various software modules we provide belong in your fact
book (you have downloaded them already, haven’t you?).
The objectives and strategies you write for each marketing
component, based on the data you insert into the fact book,

belong in your marketing plan. These are included as work-
sheets at the end of the appropriate chapters, and they are pro-
vided as Word files in the software package you have
downloaded, in a folder called “Worksheets.” As mentioned in
the Introduction, the fact book may number over a hundred
pages while the marketing plan should be no longer than
twenty. That way you can keep your marketing plan on the top
of your desk so you can monitor it weekly, with the fact book on
your shelf for easy access and confirmation of your marketing
plan. Many times when I was asked to review a company’s mar-
keting program, they would hand me a plan that numbered
over a hundred pages. They would have a couple of meetings
preparing the plan and then put it on the shelf until the follow-
ing year, with no one looking at it until then. I always told them
to be effective in marketing, they would have to change their
planning procedure.
In addition to your fact book and marketing plan, you
need action plans. Action plans provide the details of how you
are going to execute your strategies and achieve your objec-
tives. Action plans should be written and monitored by the in-
dividuals responsible for their execution. They, too, belong on
the top of the desk of those executing these details.
All of your objectives should be measurable. I have been
shown many plans that were just a bunch of generalities. A
complete waste of time. If you can’t measure your objectives,
don’t write them. For example, if you are using advertising, you
may want to insert an awareness level you hope to achieve in
your advertising plan objectives. Then you measure it and if
you are off target, you should change your plan. In your sales
plan, you may want to insert a closing level you hope to obtain.
Once again you measure it and if you are not making it, you
should make changes. You can write measurable objectives for
every part of your plan. You will need research to measure
18
The Marketing Plan

some of them and Chapter 17 will show you where to find what
you need.
The various components of the marketing plan will be dis-
cussed in detail in subsequent chapters. The product/service
plan defines your brand. You use your advertising plan to
build awareness, your direct mail plan to sell or produce leads,
and your trade show plan to demonstrate what you are selling.
The sales promotion plan should be used for incremental sales
and the public relations plan for free ads. The Internet plan can
give you instant distribution and the customer service plan can
help you with repeat sales. You use the sales plan to close the
sale and the research plan to monitor your activities. Appendix
A contains a marketing plan format for your perusal.
Note
1. Ted Mininni, President, Design Force, Inc. of Marlton, NJ,
www.designforceinc.com; www.brandchannel.com/brand_speak
.asp?bs_id=231.
The Planning Process 19

This page intentionally left blank

I was doing a consulting job with IBM in Canada and realized
that the advertising people did not confer with the sales team
and none of them talked to the sales promotion people. I ran
into the same situation with AT&T. The advertising people
worked by themselves and although I tried to get all members
of marketing working together, it didn’t work. I consequently
resigned from the consulting position.
To be effective in marketing, all members of the six mar-
keting departments must talk together and plan together.
Those six departments are:
1. Sales
2. Marketing communications
3. Customer service
4. Product or service development
5. Internet
6. Research
Without working together, how can you determine which
marketing tool is best against a particular member of the buy-
21
Openmirrors.com

ing decision in a particular market? Although people are ex-
posed to various media, you want to start with the ones they
use the most. If you are going after young people, you probably
will concentrate on the Internet and smartphones; for execu-
tives, maybe newspapers or business magazines; and for mom,
sales promotion might work best.
In my experience, the best organizational setup is a vice
president of marketing, a single individual with responsibility
for and authority over all marketing activities, including sales.
Notice that I didn’t say “vice president of sales and marketing.”
Companies that have a vice president of sales and marketing
usually treat sales as a separate entity. This leads to the situa-
tion where the sales team tells one story about the product or
service and the rest of marketing tells another. That’s not effec-
tive communications. Each person with common characteris-
tics who is involved in the buying decision should receive the
same message, whether it is from a newspaper ad, television
commercial, website, or sales presentation. That way all mes-
sages reinforce each other. That is why you need a creative
strategy, which is discussed in Chapter 9, The Advertising
Plan. The creative strategy states the message and it should be
used by all members of marketing.
Now, some companies that are effective in marketing, like
Procter & Gamble, use the title “brand manager” rather than
“vice president of marketing.” The brand manager is responsible
for the profit on the brand, but only has the authority on market
communications, consisting of advertising, sales promotion,
and public relations. That means through sheer personality and
persuasion, she has to coordinate all the other marketing activ-
ities, such as sales, research, customer service, product/service
plan, and the Internet. I was invited to lecture at one marketing
class at Duke University graduate school of business and after
talking for a while and answering questions, I mentioned that
22
The Marketing Plan

probably none of them would be hired as a brand manager at
Procter & Gamble. The whole class looked puzzled and I
thought the class professor was going to have a heart attack. I
explained by telling them that P&G does not normally hire in-
dividuals that have a marketing degree because they want to
teach them marketing themselves and they only select those
that have the personality to make the system work. That is why
brand management works at P&G and usually fails at other
companies.
Having the Right Advertising Agency
Adverting agencies can make or break your promotional ef-
forts. Too often, I don’t remember the name of the company or
brand five minutes later. Too often I don’t understand an ad,
and I find that too many are trying too hard to be funny,
whether or not the brand lends itself to humor. What you, as a
marketing manager, want is an agency that is run by a person
with account management experience. That way you have a
better chance of having soundness in their work. I have worked
for agencies that were led by a creative person and sometimes
they do good work. But let me give you an example of what can
happen.
We were showing a television commercial to a client. I was
an account executive and had previously told my boss that I
thought it was off target. After we showed the commercial to
the client, the client asked me what I thought about it. Before I
could answer, my boss spoke up and said he thought it was very
effective. The client than turned to me again and asked my
thoughts. I said it was poor creative. The client agreed, got up,
and walked out. After he left my boss told me I had just cost the
agency $50,000, which was the cost of the filming, and that I
was fired. We were stationed in Atlanta and the home office of
Marketing Management 23

the agency was in New York City. I flew up in the morning and
went to see the CEO of the agency to explain the situation.
Luckily he agreed with me, I was rehired and my boss was fired.
The problem with this type of scenario is twofold: first, in a cre-
ative-dominated agency there is not usually someone as dumb
as I to stick up for the client and second, the agency’s CEO
might not be as clear-sighted as this one was.
In an agency that is managed by a person with account
management experience, individual account executives usu-
ally have the authority to reject creative material done by the
creative department. The account executive is the prime con-
tact with the client, is familiar with the client’s business, and
helps the client write the marketing plan. The creative depart-
ment consists of copywriters and art directors who develop the
creative upon direction from the account executive. In a cre-
ative-dominated agency, the account executive usually cannot
reject creative material before it is shown to the client. That can
lead to the goofy commercials that don’t sell anything. There-
fore, you want an advertising agency in which the account ex-
ecutive can reject creative before it is shown to you.
You also want an account executive who can help you write
your marketing plan. When I was an account executive, the first
client assigned to me was P&G. As I mentioned before, P&G
has their own way of doing things and it took me five attempts
before they approved of the plan I wrote. Needless to say, I
learned a lot in a short period of time. A good account execu-
tive knows more about writing the plan than anyone at the
company. I always wrote the plan on my accounts, including
the introduction of Fresca and Canada Dry.
You also want to check out the media department of an
advertising agency. Usually when individuals join an agency
they are put in the media department and if they do well, are
promoted to the account group or some other department.
24
The Marketing Plan

You do not want these inexperienced people handling your
media buys. If they assign you an experienced pro, then fine. If
not, you should check out the media buying service compa-
nies, where the employees have been making media decisions
for years.
In closing this chapter I want to repeat the hockey analogy I
used in the previous edition of this book. You should buy a
hockey stick for everyone involved in marketing, including your
advertising agency and media buying group if you have one. The
puck is your brand, the ice is the market, and the opposing team
is your competition. Your objective is to get your puck into the
opponent’s net. You keep passing the puck back and forth, from
sales, to advertising, to sales promotion, to the outside agency, to
customer service, working your way down the ice. If one player
gets in trouble, he passes the puck to another, back and forth, un-
til it finally goes into the net.
Appendix B contains a comprehensive outline of your re-
lationship with an advertising agency.
Now go buy the hockey sticks.
Marketing Management 25

This page intentionally left blank

27
You have a wonderful idea. A better way to do something. You
spend several months perfecting the concept, and then you do
your launch. Sales are slow at the beginning, but after a few
years, they pick up. However, you realize that you are still not
making much of a profit. What’s the problem? It could be one
or more of several market factors that determine whether you
can make money in a specific market—regardless of the supe-
riority of your operation. There are two questions you must ask
yourself at the very beginning of the process:
1. Am I going into the right market?
2. Do I have the resources to become a market leader?
This chapter concerns an important element of that “right
market” question: market profit potential. If you have what you
believe is a brilliant new business concept and are going to de-
vote your life to it for several years, you want to be sure you are
going into a market that will reward you well if you finish near
or at the top. That reward could be money or, if you are a non-
profit organization, it could be doing the most good.

Market profit potential refers to the conditions in a market
that allow a business to make money if it can beat the compe-
tition. For example, a market that could be considered ideal rel-
ative to profit potential has the following characteristics:
?
Large enough for you to obtain a good return, but not so
large that you could not obtain a 30–50 percent market
share.
?
The growth rate is between 5 and 25 percent per year.
?
The stage of life cycle is either introductory or early growth.
?
There are few competitors and they are passive.
?
There are no adequate functional substitutions for the
product or service, and the customers perceive the item as
having high value to their business or personal life.
?
Research and development (R&D), design engineering,
manufacturing, operations, and marketing costs are rela-
tively low.
?
The market is not capital intensive and can be segmented.
?
The market is not seasonal or cyclical.
?
There is no regulatory exposure.
You will probably never find a market as ideal as the above
description, but the closer you come, the greater will be your
opportunity to make money. To assist you in a critique of your
own proposed market, each of the desirable market character-
istics is discussed in this chapter to help you determine
whether your venture is really worth the effort.
The following characteristics determine the profit potential
in a market:
1. Market size
2. Market growth
3. Competitive strength
28
The Marketing Plan

4. Stage of market life cycle
5. Price sensitivity
• Functional substitution
• Perceived value
6. Market cost structure
• R&D costs
• Design engineering costs
• Manufacturing and operations costs
• Capital intensity
• Marketing costs
7. Market physical structure
• Segmentation
• Seasonality
• Cyclicality
• Regulatory exposure
You might want to keep a score card as you critique your
market against the positive or negative effects of these factors,
using Worksheet 3–1. You can photocopy it, or download
it from the software and print yourself a copy. (Have you
downloaded the software from www.amacombooks.org/go/
MarketingPlan4 yet and put it on your hard drive? If not, what
are you waiting for?) Guidelines will be given at the end of the
discussion of each factor about how you can use a scale of 1
to 10 (10 being the most favorable) to rate your market. How-
ever, any system that uses some type of pluses and minuses
will suffice. At the end of this chapter you will be shown how
to compile the ratings of each factor into a composite or over-
all rating of the market.
This use of numbers or the assignment of values to market
characteristics is not an attempt to turn planning into a science
like chemistry or physics. Market planning will never be a sci-
ence because the relationship between cause and effect is not
Market Analysis 29

always the same in the business world. The purpose of this ex-
ercise is to make you think through each variable, one at a time
so you don’t miss any major ones, and to help you to estimate
the effect of each on your business. Hopefully, you will judge
most of them correctly, but there probably will be some you
misread. This uncertainty is what makes planning difficult. It is
also the reason why planning is crucial. To be successful, you
Worksheet 3–1
Evaluating the profit potential of a market
Factor
Status of Market
Value
1. Market size
______________
______________
2. Market growth
______________
______________
3. Competition
Number
______________
______________
Activity
______________
______________
4. Life cycle
______________
______________
5. Price sensitivity
Functional substitution
______________
______________
Perceived value
______________
______________
6. Cost structure
R&D
______________
Design engineering
______________
Manufacturing/operations
______________
Marketing
______________
G&A
______________
Cost structure total
______________
______________
7. Physical structure
Segmentation
______________
______________
Seasonality
______________
______________
Cyclicality
______________
______________
Regulatory exposure
______________
______________
Total market value ( ____________ ÷ 12 = ) ____________
30
The Marketing Plan

Market Analysis 31
have to tie down as many variables as you can and keep scruti-
nizing the remaining ones. Otherwise, you are going down a
blind alley.
Some of you will not be able to do any scoring as you go
through the chapter because you don’t know the status of
these factors in your market. This may mean you will have to
conduct research to obtain the raw data needed in the calcula-
tions. Or you may be able to score some factors for your market,
but not others. In this case, just remember to divide your final re-
sults by the number of factors you actually scored. You may also
want to read the whole book before beginning this exercise, so
that you are familiar with the terminology and ramifications of
the various market and business characteristics.
Market Size
Normally you have to become number one or two in share of
total sales or revenues in your market or segment of the market
to become profitable. If you estimate that the total size of the
market in which you will be competing is $1,000,000, for ex-
ample, and your sales estimate is $400,000, your share objec-
tive is 40 percent. If the market is much bigger, for example,
$10,000,000, your share would only be 4 percent. In this situa-
tion, unless you withdrew to a smaller segment of the market,
your presence would be so small that it would be difficult to be-
come profitable.
Usually you need a share of between 30 and 50 percent to be
number one or two in your market, unless you are in a frag-
mented market. (A fragmented market is one consisting of
many companies, all with relatively small shares, such as restau-
rants and barber shops. It is clearly difficult to make money in
fragmented markets, and we discuss this in some detail later in
the section on competitive strength.)

As a normal market shakes out, or matures, there will be a
leader with approximately a 40–50 percent share. The number-
two player will have a share about two-thirds of the leader or a
25–35 percent share. The number-three player will have a
share about two-thirds of the number-two player or a 15–25
percent share. Experience indicates that it is tough to make sig-
nificant money if you are number three or lower on the totem
pole.
According to the Strategic Planning Institute (pimson
line.com) in Cambridge, Massachusetts, there is a very high cor-
relation between market share and return on investment (ROI).
ROI is the rate of return on your investment. Based on the Insti-
tute’s analysis of their computer database of over 2,000 busi-
nesses, in most cases the higher the share, the higher the ROI.
The main reason for this correlation is the experience curve,
which also is discussed in the section on competitive strength.
To score the market size characteristic, you could take
your estimated share objective and multiply it by 2 and then
multiply the answer by 10. For example, if your goal is 35 per-
cent, you multiply this percent by 2, giving you 70 percent,
which is .70, then multiply .70 by 10 and you get 7 on a scale of
1 to 10. That’s a good score. (Or, if you don’t like all this math-
ematics, you could score this favorable situation with a plus
sign.) However, you have to be sure your share objective is ob-
tainable. For example, if your share objective is 35 percent and
you estimate the total size of the market at $2,000,000, the vol-
ume of your sales would have to be $700,000. Maybe this vol-
ume level is unattainable for you. If it is, you would have to
lower your share objective, bearing in mind what was previ-
ously said about the unprofitability of being third or lower in
share. This would also lower the rating of how favorable the
characteristic of market size is for you.
Conversely, $700,000 in sales may be too low an estimate of
32
The Marketing Plan

the popularity of your product or service. You could increase
your share objective to 50 percent. (Going for more than half of
the market is usually not profitable. You possibly could obtain
a share above 50 percent, but the expenditures to get there usu-
ally can be invested more effectively in a different strategy.) A
50 percent share of $2,000,000 would give you revenues of
$1,000,000—and a score of 10 (using the method above). Fan-
tastic! However, is this enough to offset your costs? If not, you
are probably going into a market that is too small. In this case,
you may want to reexamine your whole concept.
Market Growth
Normally, you want to be in a growth market because it permits
you to gain share even though the competition may be in-
creasing in sales. For example, the market could be growing at
the rate of 10 percent, but you are increasing your sales rev-
enue at 15 percent. That means you are gaining share. At the
same time, competition could be increasing their sales at the
rate of 5 percent and be very happy, even though they are los-
ing share. If they continue to let you gain share on them, you
could eventually become so strong they could no longer com-
pete. That was the story with American automobile manufac-
turers and their Japanese counterparts, although some of the
American companies are now fighting their way back. It is also
true with Hewlett-Packard and Dell, with Hewlett-Packard
gaining share worldwide because Dell put out some defective
products.
However, if you enter a market with little or no growth, the
only way you can gain share is take business away from compe-
tition. Your competitors may not know when they are losing
share, but they sure know when they are losing sales. This gets
them very annoyed and they’ll come back and try to hit you over
Market Analysis 33

the head. Hard. After being pounded by Wal-Mart and Target,
Sears has been fighting to rebound under the leadership of its
chairman, Edward Lampert, who added Kmart to the mix and
made many other store changes, but success so far has been
elusive. One former executive now refers to the company as a
hedge fund rather than a retailer, saying that management has
diverted funds from maintenance and improvement of stores to
nonretail financial investments.
Many people refer to Lambert as another Warren Buffett. He
says he is not interested in total retail sales, just profit. Kmart has
been profitable for the last three quarters and is sitting on $3 bil-
lion in cash. He has introduced four upmarket clothing lines
and beefed up the electronics department. His plan for Sears is
to leave malls and build big box standalone stores. Sears’ profit
is tied to appliances and with housing down, sales have been
weak. He did sell the $28 billion credit card line to obtain more
investment income.
J.C. Penney has also been struggling with only $251 million
profit in the last fiscal year, although they introduced the highly
popular Ambrielle lingerie label and American Living brand by
Ralph Lauren. The problem for Sears, Kmart, and J.C. Penney is
Wal-Mart and Target. They lead with the discount store strategy
and are now so big that it’s difficult for any other retailer to
compete.
If you are entering a new market, you want to maximize
share as fast as your company can prudently handle the in-
crease in sales. You want to lock out competition by lowering
your costs through the use of the experience curve. Drive your
costs down as fast as possible; it then becomes difficult for
competition to enter.
Attaching a numerical value to market growth cannot al-
ways be linear because extremely high growth could be a neg-
ative to many companies. You may not want to be in a market
34
The Marketing Plan

experiencing a high growth rate because of the huge negative
cash flow you will experience. Therefore, I suggest that you as-
sign the “ideal market growth rate” for your company a value of
10 and score your market accordingly. In this case, growth rates
both above and below the ideal would have lower scores. For
example, if your ideal is a 30 percent growth, one market grow-
ing at the rate of 15 percent and another growing at the rate of
45 percent would both receive a score of 5 or some type of mark
between a plus and a minus.
Competitive Strength
This is one of the most important factors that determines
whether you will enjoy profitability, and surprisingly, one that
many entrepreneurs don’t even take into account. Actually, it’s
the competition rather than the customer that determines your
revenues, market share, and profit. If you get into a market with
weak or passive competitors, your opportunity is practically un-
limited. You will have to scratch every inch of the way, though,
if you run into an Anheuser-Busch (Budweiser, Michelob,
Busch), Procter & Gamble (Charmin, Crest, Ivory), Merck (phar-
maceuticals), or Cisco (computer networking).
However, don’t be afraid of size alone. Witness IBM. Al-
though one of the largest corporations in the world, it suffered
tremendous setbacks in its personal computer business, which
operated on such low margins that it was sold. However, in the
long run it may have been smart because they are now con-
centrating on the high-margin consulting business.
Competitors with large market shares are the most dan-
gerous to you when they take advantage of what is known as
“the experience curve.” The experience curve reflects the fact
that you can cut your unit costs the same percentage rate
every time you double your output. You accomplish this cost
Market Analysis 35

savings through the use of the learning curve, economies of
scale, and throwing your weight around. The learning curve is
based on the premise that as workers keep doing a task over
and over again, they can do it faster and more accurately.
Economies of scale are available when you increase the size or
number of your plants or stores. If you built a plant twice as big
as your current one, it probably won’t cost twice as much to
build or run. If you have to allocate your advertising over three
stores, it will cost you more per store than if you could allocate
the cost over twenty stores. Throwing your weight around
refers to such activities as badgering your suppliers for lower
costs because of the volume you buy from them and threaten-
ing the channels of distribution into handling your product or
service and no others.
If a market is on an 85 percent experience curve, it means
every time volume is doubled, costs will be 85 percent of what
they were previously. Some industries, such as computer chips,
have very steep experience curves. If a market enjoys a 50 per-
cent experience curve rate, it means every time you double
your volume, you cut your costs in half. You should estimate
the experience rate that does or will exist in the market you are
entering. If a competitor is much bigger than you, they have
doubled their volume many times and, consequently, should
have lower costs.
In Chapter 6, The Product/Service Plan, you will be shown
not only how to estimate the experience curve rate for your
market and competition but also how to take advantage of it to
beat your competitors.
In general, a market with few competitors is usually pre-
ferred over one with many, even though it means they will have
large shares. A market with few competitors, such as the oil in-
dustry, is easier to read than one with many, such as the
restaurant business, which is referred to as fragmented. It is
36
The Marketing Plan

nearly impossible for any single restaurant to read the market.
Here’s why: Whenever you are contemplating the execu-
tion of a strategy, you should always ask yourself, “Will compe-
tition follow?” If your answer is “I believe so,” most likely the
strategy will do you more harm than good. If you decide to cut
your price and competition matches you, where are you?
Worse off. If you double your marketing budget, and competi-
tion does the same, where are you? Worse off.
If you enter a market with just a few competitors rather
than twenty or thirty, it is much easier to estimate how they will
react to your strategies. In this situation, with a little homework,
you could obtain a good fix on their business philosophy.
If you introduce a new product or service, will they imme-
diately double their R&D to get into the market as soon as pos-
sible with a comparable item? Or are they relatively complacent
with their current share? What will they do if you start to really
make a splash? Will they still hold back? How long? Obviously,
you would prefer your competition to contain a couple of Dic-
taphones or Sears rather than Costco and Apple.
In summary, you would like just a few competitors who are
fat and happy. If you want to put a numerical rating on the
competitive situation in your market, you should break it into
two parts:
1. Number of competitors
2. Their anticipated aggressiveness
Regarding the number, having no competitors should rate a 10.
If you have one, give it a 9, if two, give it an 8, etc. As for aggres-
siveness, you’ll have to use your own judgment. If you believe
they will match anything you do, or if they are far down the ex-
perience curve and pushing it like crazy, give it a 0. If you be-
lieve they won’t pay much attention to you for a few years, give
Market Analysis 37

it a 5. If they look like General Motors, give it a 10. Although
now they are getting better, during the past several years, GM
was asleep at the switch. They did not go into small car devel-
opment when gas was plentiful, and when the first gas crunch
came in 1972, people switched to small cars, leaving GM out in
the cold.
Stage of the Market Life Cycle
The market life cycle, which is based on the actions of your tar-
get audience, is divided into six stages:
1. Introductory or embryonic
2. Early growth
3. Late growth
4. Early maturity
5. Late maturity
6. Decline
The introductory stage refers to a brand-new market, such as
3-D television sets. Early growth refers to the early stages of a
market that is really booming, like social media and iTunes. Late
growth is when the market is still experiencing growth, but not
quite as fast as early growth; for example, computer software and
standard cell phones. Early maturity refers to the period when
the market has slowed down, and all products or services are be-
ginning to be perceived by the customer as being basically alike.
Department stores are examples. Late maturity is when the
market starts to shrink in size (or has shrunk), such as newspa-
pers and CDs. Decline refers to the ending stages of the market
for products such as vacuum tubes and fluorescent lights. There
is no set period of time for any of the stages. The cardiopul-
38
The Marketing Plan

monary pacemaker was in the introductory stage for thirty-five
years. Computer hardware had been in growth for over forty
years. The hula hoop went through all six stages in one year—
twice. A market can generally be in one stage while a segment of
the same market is in a different stage.
Personal computers in the United States are in late growth,
but personal computer work stations that permit the use of ad-
vanced software such as computer-aided design (CAD) and
computer-aided manufacturing (CAM) are probably in middle
growth. Market stages can also be different depending on geo-
graphical location. Soft drinks are in maturity in the United
States and Western Europe, but in growth in Eastern Europe,
Russia, and Asia.
Entering the market during the introductory stage—that is,
your product or service is the first or one of just a few in a new
market—offers you the best long-term profit potential. You
have few or no competitors and you have the opportunity to
become strong before others realize you have a good thing and
try to muscle into your market. Companies that start new mar-
kets usually end up being the market leader. However, you have
to excel in R&D and have the financial resources to hang in
there until you start making a satisfactory return, which nor-
mally is not until the later part of early growth.
Some companies, like IBM, wait until early growth to enter
a market. By so doing, they save on R&D costs and are in a po-
sition to copy or improve on the best technology existing in the
market. It also keeps them out of markets that never make it to
the growth stage. The negatives of this strategy are that they
have to play catch-up and they have to excel in manufacturing
and operations and marketing. In the early 1980s, Japanese
companies were not strong in R&D, but they excelled in man-
ufacturing. They would take American technology, like the
Market Analysis 39

electronic transistor, and adapt it to a product like radios, cre-
ating a new product. Today, not only are they preeminent in
manufacturing but in R&D as well.
If you are entering in early growth, you will need the ex-
pertise to build your sales force and maximize your distribution
coverage. You will want to create awareness of your product or
service first, and then go for customer loyalty. You want to con-
vince customers that they should purchase your product or ser-
vice regardless of competitive activity. This is referred to as
“building a franchise,” and usually the best marketing tool to use
is advertising. Consequently, total dollars spent on advertising
by all participants in a market is the highest during the early
growth stage.
If you are considering entering a market in late growth or
early maturity, you can’t hit competition straight on because
they are too strong. (If you have developed a product or service
that is clearly superior to theirs, you are not hitting them
straight on; you are starting a new market.) You have to find a
segment or niche in the market that competition has over-
looked or that is currently too small for them to get excited
about. The Japanese got their start in the automobile market by
manufacturing small cars, a segment many U.S. companies
were not interested in because it delivered smaller profits. The
U.S. car manufacturers also correctly thought the American
public wasn’t interested in small cars. Then the oil shortage
created higher gasoline prices, and the public demanded
smaller, more economical cars. The Japanese were sitting there
with the supply.
You can open a small service business such as a bank,
photocopy center, or retail clothing store in markets that are
in late growth or early maturity, and have the opportunity to
become successful. However, you will have to offer the cus-
40
The Marketing Plan

tomer something they can’t get from your bigger competitors,
such as better service. The problem is the more successful
you become the greater the danger of competition stepping in
on your turf. If you plan on your business growing, the critical
factor is whether the bigger competitors can match what you
do to attract your customers. If you start selling a product
such as a VCR in a market in late growth or early maturity, you
have to recognize that you will be operating from a cost dis-
advantage. In order to make money, you will have to convince
the customer that there are good reasons to pay more for your
product.
Entering a market that is in late maturity or decline means
that you will be operating against a shrinking customer base and
you will be up against competitors that will sell their product or
service with little or no profit just to stay in business. This is a
market that you want to stay away from, except in some unusual
circumstances. One example of an unusual circumstance is the
vacuum tube business. There are only two or three companies
left, and they are getting a good financial return because they
bought their competitor’s most efficient plants for a fraction of
what they were worth and closed down their own plants, which
were obsolete.
If you want to attach a numerical score to a market based
on the stage of the life cycle, you could use the following:
Stage
Numerical Value
Introductory
10
Early growth
8
Late growth
6
Early maturity
4
Late maturity
2
Decline 0
Market Analysis 41

Price Sensitivity
A market may be very sensitive to price increases or decreases,
very insensitive, or somewhere in between. In a market that is
very sensitive to price, a price increase of 10 percent would re-
sult in a decrease in volume greater than 10 percent. Con-
versely, a price cut of 10 percent would result in an increase in
volume exceeding 10 percent. In an insensitive market, a 10
percent price cut results in a volume increase of less than 10
percent, and, conversely, a 10 percent price increase causes a
volume decrease of less than 10 percent. Most entrepreneurs
want a market that is relatively insensitive to price because,
obviously, it offers a greater profit potential.
There are two major factors that can make a market rela-
tively insensitive to price. One factor is that the buyer perceives
the market to have products or services with no viable func-
tional substitute. Medicine and waste management are good ex-
amples of this; there are no satisfactory substitutes for the
products and services in these markets. When you are ill, you
have to see a doctor. If the law states you have to dispose of your
waste in a certain manner, you will do so, or get fined or go to
jail. Unfortunately, this situation is not true for most markets,
like restaurants, air travel, snow blowers, and artificial logs. You
can eat at home or travel by car; you can shovel your own walk
and cut down your own tree.
The other factor influencing price sensitivity is the per-
ceived value of the products or services offered in the market.
Logically, you don’t really need alcohol, perfume, and de-
signer jeans, but you think you do. In purchasing, perception is
fact. It’s not what’s offered that counts; it’s what you believe it
offers. Therefore, if you believe exotic perfume will make you
more popular, the price is secondary. How strong is the per-
ceived value of garbage cans? You may need garbage cans
42
The Marketing Plan

more than perfume, but the customer will pay a 100 percent
markup on the perfume and then shop five stores for the
cheapest garbage can. To put a grade on price sensitivity in
your proposed market, estimate or critique each of the two fac-
tors above, add the scores, and divide by two. Markets with no
adequate substitute would receive a 10 and products/services
with a high perceived value a 10 also. Where there are many
substitutes, or the products/services don’t have a high per-
ceived value, the market would receive 0.
Market Cost Structure
The cost of doing business in some markets is considerably
higher than in others. Many markets demand high R&D ex-
penditures; others incur high engineering, manufacturing, or
operations cost; there are those with high marketing expendi-
tures; and several have more than one of the above negatives.
The perfect market for you would be one where all of the
above factors are below average in costs as a percent of sales.
A market that requires high R&D and subsequent new prod-
uct or service introductions will hurt your profitability short
term, and it will hurt long term if you have a low market share.
One of my clients, a West Coast frozen soup manufacturer, dis-
covered that they had been losing money for years by selling
their soup to airlines. The airlines insisted on a constant stream
of new types of soup. The manufacturer had never treated this
group of customers as an individual market; when they pulled a
separate profit and loss statement, they realized that it was an
unprofitable venture.
Although having high R&D costs and needing constant in-
novation is a negative situation, you could build a successful
company by using R&D to develop new products and services
for new markets. This is the story of 3M. 3M, best known to the
Market Analysis 43

general public as the manufacturer of Scotch Tape and Post-it
notes, introduces more new products each year for new mar-
kets than any other company in the world, and its success rate
is at least equal to the best. The key to success is whether your
R&D expenses will result in new revenues. If you are in a mar-
ket where your new product/service just replaces an existing
product or service, then R&D will account for a large percent-
age of costs and have a negative effect on your bottom line.
Ideally, you also want to stay away from markets with high
manufacturing or operations costs. These markets usually re-
quire extensive capital investments, which means you need ex-
tremely high profits to earn a decent ROI. If your investment is
$300,000, you need $60,000 in profit to earn 20 percent on your
money; if your investment is only $150,000, a $60,000 profit
would result in a 40 percent return.
Markets requiring large monetary investments are referred
to as “capital intensive.” Capital-intensive industries deliver low
ROI unless the large investments produce an increase in pro-
ductivity, which has positive effect on ROI.
If possible, stay away from markets that demand large in-
vestments, which, in addition to plant and equipment, could in-
clude excessive amounts of slow-paying accounts receivable
and large inventory, long and expensive leases, and extensive
supervisory personnel. It is true that large investments act as an
entrance barrier to keep other competitors from coming in; on
the other hand, they may not want to even if they could.
Although markets with high marketing costs are not consid-
ered capital intensive, markets with this characteristic can have
a severe negative impact on profit potential. Marketing costs in-
clude selling, promotion, distribution, packaging, customer re-
lations, and market research. When you combine high capital
intensity and high marketing costs, you are really asking for
rough sledding. If you don’t obtain a major share of the market
44
The Marketing Plan

Market Analysis 45
fast, you probably won’t make it. Witness the airline business,
which requires large investments for planes and gates and also
has large advertising budgets.
Most markets for industrial products, which are usually cap-
ital intensive, typically do not require extensive marketing budg-
ets. Therefore, if you are considering introducing an industrial
product and you believe extensive marketing will be needed, it
should raise a red flag. If you are considering a product or ser-
vice for a consumer market, the reverse is true. Usually the mar-
keting commitment is large, but the cost for producing the
product or service is low. Some of you would probably faint if
you knew the actual cost of producing some of the products you
buy, like toothpaste, soap, beer, and pills for your headache and
upset stomach.
Service markets normally have relatively higher costs for
producing the service than consumer product markets be-
cause more labor is involved, but some enjoy high gross mar-
gins (revenues minus the cost of producing the service).
Banks are a prime example of this: It doesn’t cost a bank
much to borrow money at 4 percent and then loan it to you at
6 percent interest. That enables them to allocate large sums to
marketing. The only reason banks have gotten into trouble re-
cently is that they became greedy and failed to realize that the
value of real estate could not continually increase. In addi-
tion, they have done such a poor job of spending their mar-
keting dollars that the number one reason for selecting a bank
is still its location.
Prescription drug manufacturers have both low manufac-
turing and low marketing expenses, but they claim justification
for their expansive operating margins (revenues minus manu-
facturing, marketing, and administration expense) due to
their high R&D costs. A prescription that you purchase for
$100 probably cost $1.00 to manufacture. However, that drug

probably took ten to twenty years to develop and receive Fed-
eral Drug Administration (FDA) approval.
In summary, what you want is a market that has relatively
low costs, as a percent of sales, in the four major costs centers:
R&D, design engineering, manufacturing/operations, and mar-
keting. If one cost center is above average, then, ideally, the other
three should be below average. If you get yourself into a market
where these costs are low, and through good management you
are able to keep your own costs below the market average, your
reward will be much greater than if you start off in a market
where these factors leave little room to maneuver. If your market
demands high marketing costs, you might develop more bang
for your buck, but it will still be difficult to drastically lower the
expenditure as a percent of sales.
If you want to assign a numerical score to these cost centers
or factors, Figure 3–1 shows approximate ranges. General and
administrative (G&A) expenses have been added so the sum
equals total operating expenses, and they have been kept at an
arbitrary 5 percent of sales for simplicity.
Add the percentages and calculate your estimate of your
market’s operating profit. If you approach 10 percent, which is
46
The Marketing Plan
Figure 3–1
Approximate ranges of various costs as a percent of sales and
resulting operating profit.
Cost Factor
Costs as a Percent of Sales
Favorable
Average
Negative
R&D
1–5%
5–10%
>10%
Design Engineering
1–5%
5–10%
>10%
Mfg/Operations
1–50%
50–80%
>80%
Marketing
1–20%
20–40%
>40%
G&A
5%
5%
5%
Total
<85%
85–95%
>95%
Operating Profit
>15%
5–15%
<5%

the average for the country, give this market cost structure fac-
tor a value of 5 (a plus). Any number over 15 percent deserves
a 10 (a double plus). Any negative number equates to 0 (a mi-
nus). Score numbers in between accordingly. If the score is 3 or
less, you should reconsider your concept.
Because the above represents an average of all markets, the
ranges and assigned values are a matter of judgment and
should only be used as a guide. To score your own market, as-
sign percentages for each of the factors based on your critique
of the market—or based on your estimate if this is a new mar-
ket.
Remember, however, that this is only an estimate of market
operating income, and does not necessary mean that you will
match it. What you are looking for are markets that have the op-
portunity of making a good return. If you have greater re-
sources than the competition, you probably can exceed the
market average. But if you don’t, or competition is more ag-
gressive than you, your operating margin probably will be
much lower.
Market Physical Structure
Four factors are included in this definition of market physical
structure. They are:
1. Availability of segmentation
2. Seasonality
3. Cyclicality
4. Regulatory exposure
Two other factors that could have been described as phys-
ical characteristics are size and growth, but they were treated
earlier in this chapter as separate entities.
Market Analysis 47

48
The Marketing Plan
What you are looking for are markets that have the potential
for segmentation and have no seasonality, cyclicality, or regula-
tory exposure. In 1969 Philip Morris purchased Miller Brewing,
and the strategic plan they developed for the brand called for
market leadership in ten years. They almost made it. From
sixth place and a 4 percent market share, they were number two
with an 18 percent share eight years later and closing in on the
market leader, Anheuser-Busch, which was first with a 21 per-
cent share. Then, in 1974, August Busch III obtained control of
the family business from his father, and he took the company
from a 21 percent share to over 40 percent in less than ten years
by successful execution of the segmentation strategy. In the
early seventies, the primary brand for Anheuser-Busch was
Budweiser. Today they have Budweiser Light, Michelob, Mich-
elob Light, Busch, Budweiser Dry, and a host of other brands.
Some markets that have not been successfully segmented
are gasoline, airlines, food retailing, and banking. This is be-
cause either the market does not allow segmentation or the
players have been unsuccessful in executing the strategy. Gaso-
line, airlines, and food retailing are probably examples of the
former, and banking is an example of the latter. The question
for you to ask is: “Can the market be segmented successfully?”
You enter the market with one product or service and obtain a
20 percent market share. You then introduce a second line.
Your original line goes down to a 15 percent share, but your
new line adds a 10 percent share. Now you have 25 percent
share versus your original 20 percent. And so on.
A seasonal market means that some months during the
year your revenues will be much lower than others. Examples
are ice cream, greeting cards, skiing, flowers, and toys. If you
have to carry high fixed costs throughout the year, this type of
situation can be a big negative. In the skiing market of the east-
ern states, excellent snow conditions during the Christmas hol-

idays and spring school break are essential; without them the
best you can do for the year is break even.
If you do get involved with a seasonal market, you can flat-
ten the revenue curve of your company by adding another
business that is countercyclical, like summer activities at your
ski resort. However, it has proven financially unsound to try to
flatten the curve of a seasonal business. You will sell more ice
cream in the winter if you increase your marketing expendi-
tures during this time and decrease it during the high-volume
summer months, but based on case histories of many seasonal
businesses, you will make less money for the year. Normally, to
maximize profit in a seasonal business, you want to promote
the hardest during the high-volume months.
A cyclical market is one in which you enjoy a few years of
high volume and then a few years of low volume. Examples are
paper and forest products, metals and mining, construction,
and aerospace. Once again, the critical factor in this type of
market is control of fixed costs. In the paper business, when
good times come, the companies expand their capacity by
building new plants. When the downturn follows, they are left
with excess capacity and suffer severe financial conditions.
They have been doing this for the last fifty years. You would
think they would learn from the past.
Like seasonality and cyclicality, you want to stay away
from markets with high regulatory exposure unless you can
handle these restrictive conditions effectively. Examples of
markets with high regulatory exposure are pharmaceuticals,
biotechnology, medical supplies, oil exploration, mining, and
pollution control. You may say “Merck (pharmaceuticals) has
made tons of money,” and “I wish I had bought stock in Waste
Management (pollution control).” It is true that these two com-
panies are winners, but for every Merck and Waste Manage-
ment, there are hundreds of companies that failed. Examples
Market Analysis 49

include companies that had a superior drug, a revolutionary
gene technology, a machine that facilitated better medical di-
agnostics, a seismograph that located oil, and an environmen-
tally protective means to discard waste. Their major problem
was that they could not hold out long enough to obtain federal
or state approval.
A Connecticut company offers an ultra-high-frequency jet
ventilating machine for use in respiratory care that has proven
advantages over existing mechanical ventilators. It took years to
perfect the technology. Then empirical confirmation was ob-
tained by using the machine on animals. After this successful
step, the company now has to convince doctors in many differ-
ent hospitals to use the machine on their patients. All this ac-
tivity before approval by the FDA and before any revenues
whatsoever. The company has already gone through many
stages of refinancing, and it appears that they possibly can no
longer make it on their own.
If you want to put a numerical value on your market using
these four factors concerning the market physical structure,
use your judgment to score each one on a scale of 0 to 10, add
them up, and divide by 4. For segmentation, if your market is
easy to segment, like beer, give it a 10; if it appears difficult, like
airlines, it warrants a 0. For seasonality, if revenues are basi-
cally equal during the twelve months, score 10; if more than 80
percent comes within a single quarter, it deserves a 0, and if 80
percent comes within six months, score it with a 5. For cycli-
cality, if sales are level through the years, excluding normal
growth or decline, score 10; if volume drops more than 25 per-
cent for one or more years and then regains its previous level,
post a 0. For regulatory exposure, if the market requires no
governmental approval, give it a 10; if it is similar to the drug
industries, give it a 0.
50
The Marketing Plan
Openmirrors.com

Market Analysis 51
Total Market
I pulled together a composite chart (see Figure 3–2) of how to
score the individual factors that we looked at above.
We have analyzed a hypothetical market in Figure 3–3, using
the numbers from our composite in Figure 3–2, and assigned
Figure 3–2
Various conditions of market characteristics and how they affect market
profit potential.
Factor
Effect on Profit Potential
Positive Neutral
Negative
Market size
30–50% share
20–30% share
< 20%
Market growth
20–30%
10–20%
< 10%
Competition
Number
0–2
3–5
>5
Activity
Passive
Average
Aggressive
Life cycle
Intro/Early growth
Late growth
Late maturity
Price sensitivity
Functional substitution
None
Somewhat
Several
Perceived value
High
Average
Low
Cost structure
R&D
1–5%
5–10%
> 10%
Design engineering
< 5%
5–10%
> 10%
Mfg/operations
1–50%
50–80%
> 80%
Marketing
1–20%
20–40%
> 40%
G&A
5%
5%
5%
Total
< 85%
85–95%
> 95%
Physical structure
Segmentation
High
Average
Low
Seasonality
None
80% during 80%
during
6 months
3 months
Cyclicality
None
Up to 15%
> 15%
Regulatory exposure
None
Few
Many

52
The Marketing Plan
values as follows: a number falling in the positive column will
be given a value between 8 and 10, in the neutral between 3
and 7, and in the negative between 0 and 3.
Let’s see what we have here. Figure 3–3 represents an ex-
ample of a market with average profit potential. It is in late
growth, growing at the rate of only 10 percent, and has seven
competitors still active, but with only average aggressiveness.
The products/services have only average values on functional
substitution and perceived value, which is common for a mar-
Figure 3–3
Evaluating a hypothetical market on its profit potential.
Factor
Status of Market
Value
1. Market size
25% share
5
2. Market growth
10%
3
3. Competition
number
7
0
Activity average
5
4. Life cycle
Late growth
6
5. Price sensitivity
Functional substitution
Somewhat
5
Perceived value
Average
5
6. Cost structure
R&D
1%
Design engineering
0%
Manufacturing/operations
45%
Marketing
35%
G&A
5%
Total
86%
7
7. Physical structure
Segmentation
High
10
Seasonality
None
10
Cyclicality
10%
5
Regulatory exposure
None
10
Total Market Value (71 divided by 12)
5.9

Market Analysis 53
ket in late growth. The market operating income level of 14 per-
cent is good, but with only a 25 percent share objective, the en-
trepreneur probably wouldn’t enjoy this high a margin. The
physical structure scores well, but with all the above negatives,
the value for the market is only 5.9. Possibly, the entrepreneur
should have entered the market earlier in the life cycle when
there was faster growth, fewer competitors, and a greater op-
portunity to obtain a larger market share.
So, what is the upshot of all this work? How should you in-
terpret the market value score of 5.9 that we generated in Fig-
ure 3–3? Should you proceed? Kill the project? The chart
below is a useful tool:
Total Market Value
Comments
8 to 10
Indicates extremely high opportunity to make
money if you can obtain the necessary
resources.
6 to 8
Indicates a fair to good profit potential. You
probably won’t become a millionaire, but you
should be able to pay the bills and then some.
4 to 6
Be careful. You probably shouldn’t proceed
unless you have unusual reasons for doing so.
0 to 4
Forget it!
Now see what you can do with the analysis you made of
your own market potential using Worksheet 3–1. If you actually
filled in numbers as you worked your way through the chapter,
check it against Figure 3–2 and modify what needs correcting.
Then add it up (again?), divide by the number of factors you
were able to analyze, and see if it’s a go.
If you gave up on filling it in as you went along, now might
be a good time to go back and see what you can do with all
this information.

This page intentionally left blank

Many retailers no longer stock the same merchandise in all of
their stores because they have realized that markets in different
locations have different wants and needs. Macy’s department
stores recently discovered that women in Phoenix and Salt
Lake City did not care for off-the-shoulder dresses. It has been
said that New York has a very strong preference for black iPod
models while out west consumers prefer the silver models. If
you send the same sales message to the president of a firm as
you do with their line personnel, most likely one or the other
will not be interested; presidents are looking for different fea-
tures and benefits than other members of their company. If you
are treating all segments of your markets the same, you may be
making a mistake.
Different market segments usually have different profit po-
tential. I am also a commercial real estate broker and I only seek
listings for raw land exceeding 30–40 acres. I believe it doesn’t
take any more effort or time to sell 40 acres as it does 1–5 and
when I close on a sale, my income is in the high five figures.
Usually the first step in analyzing the customer is seg-
menting the market. You could go after just one segment that
55

you believe offers the greatest profit potential, as I do in real es-
tate. If you go after the entire market, then you should plan for
what I call obtaining “equal share of the high potential.” You
should segment your market by listing the various companies
or customers by their profit potential in descending order and
then opposite their names insert your share of their business. If
you are like several companies that have hired me as a con-
sultant, you may have a larger share of those companies with
lower profit potential. For example, your market share could be
20 percent, but you are getting 30–40 percent from the smaller
potential companies and only 5–10 percent from the larger. If
this is true, you should detail in your plan how you can get 20
percent from the large potential. If you achieve this goal, your
profit will increase dramatically. Chapter 15, Maximizing High-
Potential Accounts, discusses this concept in detail. Figure
4–1 shows the first case history from the computer software
(CCUST.xls), which is one segmentation of the market. This hy-
pothetical company sells computer software.
Final reminder to download the software from www
.amacombooks.org/go/MarketingPlan4. The book is revving
up, and you’ll want to take advantage of what the software has
to offer.
Looking at the upper-left quadrant of Figure 4–1, you will
notice that the greatest profit potential for this company is con-
sumer product companies with sales over $250,000,000; in the
bottom-right quadrant, we see that new product sales ac-
counting for 10 percent or more of total sales offers them the
best profit potential. These two matrices become a description
of their main target. The remaining two segmentation matrixes
show that there is not a great variance in the type of consumer
products or size of company. Now, as mentioned before, each
of the companies in these preferred segments should be listed
56
The Marketing Plan

Figure 4–1
Customer segmentation analysis (CCUST; range name: Segmentation).
Range Name : Segmentation
Estimated
Estimated
Type of Business
Potential (%)
(%)
|
Size of Company
Potential (%)
(%)
(%)
Industrial
$100,000,000
21% |
$1MM - $5MM
$20,000,000
4%
Business to Business
$75,000,000
16% |
$5MM - $25MM
$30,000,000
6%
Consumer Product
$250,000,000
53% |
$25MM - $100MM
$50,000,000
11%
Services
$50,000,000
11% |
$100MM - $250MM
$75,000,000
16%
|
$250MM - $1,000MM
$175,000,000
37%
Total
$475,000,000
100% |
Over $1,000MM
$125,000,000
26%
|
|
Total
$475,000,000
100%
Type of Industry:
Estimated
New Products:
Estimated
Consumer Businesses
Potential (%)
(%)
|
% of Sales
Potential (%)
Paper Product
$12,500,000
13% |
> 1%
$10,000,000
2%
Beer & Wine
$10,000,000
10% |
1% - 2%
$15,000,000
3%
Soft Drinks
$10,000,000
10% |
2% - 5%
$35,000,000
7%
Alcohol
$20,000,000
21% |
5% - 10%
$65,000,000
14%
Soap
$18,000,000
19% |
10% - 25%
$125,000,000
26%
Pharmaceutical
$25,000,000
26% |
Over 25%
$225,000,000
47%
|
Total
$95,500,000
100% |
Total
$475,000,000
100%

relative to profit potential in descending order and the com-
pany’s market share listed opposite each one.
Now you should bring up downloaded Excel file CUST.xls,
a facsimile of which is shown in Figure 4–2, and insert your
own data for one or more markets. (Only insert data in the blue
“active” cells; the others contain formulas and should not be
touched.) You can change the headings of the various seg-
ments if you want. After you have selected the segments you
should be in, then list each company or customer relative to
profit potential in descending order and then opposite each
company, insert your certain market share.
Yes, pretty daunting. Perhaps you want to tackle this after
you have read the chapter all the way through (or perhaps after
you have read the book all the way through).
After you have selected the most favorable segments, the
next step is to determine the individuals involved in the buy-
ing decision. You may have a situation where there is only one
buyer, but there are usually several people involved in the
buying decision. A few companies I have worked with were
presenting to line personnel for equipment used by line and
were not making any headway. After completing some re-
search, they discovered that as many as five other layers of the
company were involved in the buying decision. Remember,
when you call on a customer, he or she usually will not tell
you that others can kill the sale.
Figure 4–3 presents the second part of the case history file
and shows some job descriptions involved in this hypothetical
purchase process.
Notice that in the Excel file we provided for you to work in,
CUST.xls (see Figure 4–4), you have space to insert those who
influence the purchase, those who actually make the pur-
chase, and those who use what is purchased in your business.
This doesn’t mean you should be spending marketing dollars
58
The Marketing Plan

Figure 4–2
Your segmentation analysis (CUST; range name: Segmentation).
Customer Segmentation Analysis
Range Name: Segmentation
Type of Business
Est Potential ($)
Percent
‚
Size of Company
Est Potential ($)
Percent
------------------------------
$0
0%
‚
------------------------------
$0
0%
------------------------------
$0
0%
‚
------------------------------
$0
0%
------------------------------
$0
0%
‚
------------------------------
$0
0%
------------------------------
$0
0%
‚
------------------------------
$0
0%
‚
------------------------------
$0
0%
Total
$0
0%
‚
------------------------------
$0
0%
‚
‚
Total
$0
0%
-------------------------------------------------------------------------
-------
----------
-------
------------------------------------------
-------------------
---------
Type of Industry
Est Potential ($)
Percent
‚
New Products - % of Sales
------------------------------
$0
0%
‚
------------------------------
$0
0%
------------------------------
$0
0%
‚
------------------------------
$0
0%
------------------------------
$0
0%
‚
------------------------------
$0
0%
------------------------------
$0
0%
‚
------------------------------
$0
0%
------------------------------
$0
0%
‚
------------------------------
$0
0%
------------------------------
$0
0%
‚
------------------------------
$0
0%
‚
Total
$0
0%
‚
Total
$0
0%

Figure 4–4
Your purchase process (CUST; range name: PurchaseProcess).
Range Name: PurchaseProcess
----------------------------
----------------------------
Influencers
‚
-------------------------
‚
‚
------------------------
‚
‚
-------------------------
‚
‚
------------------------
‚
‚
-------------------------
‚
‚
------------------------
‚
----------------------------
----------------------------
Purchasers
----------------------------
‚
------------------------
‚
‚
------------------------
‚
‚
------------------------
‚
----------------------------
Users
----------------------------
‚
------------------------
‚
‚
------------------------
‚
‚
------------------------
‚
----------------------------
60
The Marketing Plan
Figure 4–3
Purchase process (CCUST; range name: PurchaseProcess).
Range Name: PurchaseProcess
Influencers
Marketing consultants
Current owners
Advertising agencies
Research assoc.
Press
VP marketing
Purchasers
Purchasing agent
Users
Brand/mktg mgr
Research mgr
Sales mgr

on all these individuals equally. The main reason for this exercise
is so you can rank them in importance in the next step, because
you want to spend your dollars against those you rank at the top.
So go to your Excel file and insert the individuals involved
in your purchase process in the file shown next.
Now the next step probably requires research and exami-
nation. The task is to rank the individuals you have identified in
order of importance or impact on the purchase. This can be
tricky. Some cereal manufacturers thought mom came first un-
til they realized it was the kids. Birth control manufacturers
thought the doctors prescribed what they thought was best.
Wrong again. It took a female marketer to tell them that women
were the ones that made the decision. Likewise, many auto-
mobile dealers lost sales when dealing with female customers
because they didn’t think they would make a decision without
their partner or husband.
Now the order in which you rank the decision makers will
not be the same for all companies, but with experimentation
you will see that those that are ranked at or near the top stay at
the top and those at the bottom stay at the bottom. Figure 4–5,
the third part of file Ccust, shows how we have ranked those
whom we identified.
Figure 4–5
Purchase process priority (CCUST; range name: PurchPriority).
Range Name: PurchPriority
1. Brand/marketing manager
2. VP marketing
3. Research manager
4. Advertising agencies
5. Marketing consultants
6. Current owners
7. Sales manager
8. Research associations
9. Press
10. Purchasing agent
Customer Analysis 61

Notice for this hypothetical company purchasing our soft-
ware there are ten individuals or job descriptions involved in
the purchase process. When allocating marketing dollars for
this company, you would first budget for the brand/marketing
manager, then the VP of marketing, and keep going until you
run out of money. As you will see later, in Chapter 9, The Ad-
vertising Plan, the messages or sales presentation should be
different for each one.
Figure 4–6 shows the Excel file into which you can insert
your own data. It is the third matrix presented in Cust.xls.
You want to determine what turns on each of these individ-
uals in the purchase process. Remember, you are looking for the
benefit of the product/service, not the feature (see Figure 4-7).
You don’t buy a Cadillac or Lexus because of its gas mileage, ap-
pearance, or driv ability. You buy it because when you own one,
everybody thinks you are big shot. Temple University professor
Bryant Simon states that the reason Starbucks is successful is be-
cause of the lifestyle we buy with the $3 cup of joe. He continues,
“Starbucks became a Wall Street favorite by making its customers
feel environmentally aware, upwardly mobile, connected and
62
The Marketing Plan
Figure 4–6
Your purchase process priority (CUST; range name: PurchPriority).
Range Name: PurchPriority
1. -----------------------------------------------------------
2. -----------------------------------------------------------
3. -----------------------------------------------------------
4. -----------------------------------------------------------
5. -----------------------------------------------------------
6. -----------------------------------------------------------
7. -----------------------------------------------------------
8. -----------------------------------------------------------
9. -----------------------------------------------------------
10. -----------------------------------------------------------

cool by welcoming us, by name, into their clean, urban-chic
stores, and pumping hip music.”
In this particular case, the brand manager is number one in
the purchase process priority and the feature/benefit most im-
portant to her is the fact that the software allows her to project
(“It will help me to know what comes next”). When talking to the
VP of marketing, who is number two in the purchase process,
the most significant benefit of this software will be reliability (“I
won’t make any mistakes”). Look at each of the cells carefully.
Now it is time for you to put in your own benefits/features
in CUST.xls, and prioritize them for each of the individuals you
need to influence (see Figure 4-8). First, you need to come up
with various benefits for your product or service you believe
the individuals in the purchase process are most interested
in—and then you must rank them for each job title or customer
classification.
The final step in this series is determining how well the
benefits/features are delivered. Once again this will take some
Figure 4–7
Benefits/features sought (CCUST; range name: BenSought).
Benefits/Features Sought
Range Name: BenSought
Benefits/Features
Brand
VP
Research
Advertising
Mktg.
Sought
Manager
Mktg
Manager
Agency
Consultants
Reliability: I won't make any
mistakes.
5
1
1
1
2
Ease of use: Boss will think
4
6
4
6
3
I am smart.
Time: I will not have to
2
5
6
2
6
work late.
Cost: I'll have money left over for
my pet projects.
6
2
3
5
5
Projectability: It will help me
know what comes next.
1
3
2
3
1
Competitive knowledge:
3
4
5
4
4
I love jabbing them.
Customer Analysis 63

research, like a benchmark study (see Chapter 17, The Re-
search Plan). The question is how well is your product/service
delivering on the features/benefits desired by the people in
your purchase process versus the competition. Let’s take a look
at our hypothetical company.
In the scoring used here, a double plus means a competi-
tive edge, and that they alone deliver this feature. A single plus
means the company delivers on the feature, but so do others. A
zero means they do not deliver, but it is not considered a big
negative, and a minus means they do not deliver and it is con-
sidered a negative.
When you look at the chart in Figure 4–9, you see five
choices facing a prospective buyer to whom you are trying to
sell your tracking software. “Model” stands for your new soft-
ware and “STM” is a competitive product. Test marketing is of
course the most reliable way to get information about a prod-
uct, and will allow you to make good projections, but is diffi-
cult, time-consuming, and expensive. “No test” means “do
nothing at all” (and as you can see, this is a first-class ticket on
the cheap-quick-and-easy train: double pluses there). And we
64
The Marketing Plan
Figure 4–8
Your benefits/features sought (CUST; range name BenSought).
Benefits/Features Sought
Range Name: BenSought
______________________
___________
___________
___________
___________
___________
‚
Features/Benefits
‚
---------
‚
---------
‚
---------
‚
---------
‚
---------
‚
‚ ______________________
‚ ___________
‚ ___________
‚ ___________
‚ ___________
‚ ___________
‚
‚
----------------
‚
----
‚
----
‚
----
‚
----
‚
----
‚
‚ ______________________
‚ ___________
‚ ___________
‚ ___________
‚ ___________
‚ ___________
‚
‚
----------------
‚
----
‚
----
‚
----
‚
----
‚
----
‚
‚ ______________________
‚ ___________
‚ ___________
‚ ___________
‚ ___________
‚ ___________
‚
‚
----------------
‚
----
‚
----
‚
----
‚
----
‚
----
‚
‚ ______________________
‚ ___________
‚ ___________
‚ ___________
‚ ___________
‚ ___________
‚
‚
----------------
‚
----
‚
----
‚
----
‚
----
‚
----
‚
‚ ______________________
‚ ___________
‚ ___________
‚ ___________
‚ ___________
‚ ___________
‚
‚
----------------
‚
----
‚
----
‚
----
‚
----
‚
----
‚
‚ ______________________
‚ ___________
‚ ___________
‚ ___________
‚ ___________
‚ ___________
‚
‚
----------------
‚
----
‚
----
‚
----
‚
----
‚
----
‚
‚ ______________________
‚ ___________
‚ ___________
‚ ___________
‚ ___________
‚ ___________
‚

all know about panels (better than nothing, but . . .). These then
are the options facing the individuals on how to monitor their
data, and how they rate them.
Our hypothetical company has a problem. Projectability,
which is the number-one feature desired by the person at the
top of the purchase process, the brand manager, only rates a
zero. Reliability, sought by the number-two person in the buy-
ing decision, the VP of marketing, gets a plus, which is better
than a zero, but does not give the company a competitive edge
on this factor. Now take a look at your own company. Using the
information that you developed for Figure 4–8, complete Figure
4–10 as best you can. You will almost surely need new research
to complete the task.
Customer Analysis 65
Figure 4–9
Benefits/features delivered (CCUST; range name: BenDelivered)
Benefits/Features Delivered
Range Name: BenDelivered
Benefits/Features
Model
Test Mktg
No Test
STM
Panels
Reliability
+
++
-
+
+
Ease of use
+
-
++
0
0
Time
+
-
++
0
-
Cost
+
-
++
+
+
Projectability
0
++
-
+
0
Competitive knowledge
+
-
++
+
0

Note
1. Luciana Chavez, “Professor gives Starbucks a roasting,” News
and Observer, December 27, 2009; www.newsobserver.com/2009/
12/27/254709/professor-gives-starbucks-a-roasting.html.
66
The Marketing Plan
Figure 4–10
Your benefits/features delivered (CUST; range name:
BenDelivered).
Benefits/Features Delivered
Range Name: BenDelivered
___________
___________
___________
___________
___________
--------
‚
--------
‚
--------
‚
--------
‚
--------
‚
___________
‚ ___________
‚ ___________
‚ ___________
‚ ____________
‚
----
‚
----
‚
----
‚
----
‚
----
‚
___________
‚ ___________
‚ ___________
‚ ___________
‚ ___________
‚
----
‚
----
‚
----
‚
----
‚
----
‚
___________
‚ ___________
‚ ___________
‚ ___________
‚ ___________
‚
----
‚
----
‚
----
‚
----
‚
----
‚
___________
‚ ___________
‚ ___________
‚ ___________
‚ ___________
‚
----
‚
----
‚
----
‚
----
‚
----
‚
___________
‚ ___________
‚ ___________
‚ ___________
‚ ___________
‚
----
‚
----
‚
----
‚
----
‚
----
‚
___________
‚ ___________
‚ ___________
‚ ___________
‚ ___________
‚
----
‚
----
‚
----
‚
----
‚
----
‚
___________
‚ ___________
‚ ___________
‚ ___________
‚ ____________
‚

Don’t flavor your brand plain vanilla. An effective brand has a
likable or admired personality. It has added perfume. Likable
ones could include McDonald’s, Budweiser, and Blooming-
dale’s. Kids love McDonald’s with its premiums, especially the
toys, and drag their parents with them. Bud is so likable it has
the largest beer market share in the world. When women go
into Bloomingdale’s in New York City they go star-crazy. Ad-
mired brands could include Apple, Cisco, Intel, and Neiman
Marcus. If Steve Jobs ever wore a business suit, the company
that makes those sexy products would lose its luster. Cisco and
Intel are “out-chipping” their competitors. And who besides
Neiman Marcus would have the gall to offer $250,000 Christ-
mas presents?
Brands that could use some help might include Sears, Toy-
ota, AT&T Internet service, and health insurers. Sears has really
gone downhill in recent years. It doesn’t have a personality
anymore. Toyota used to be flying high, but it now comes out
that they knew of the problems with uncontrolled acceleration
more than two years ago. If you want to keep your goodwill
67

when you incur a problem, you want to tell the world as soon as
possible, the way Johnson & Johnson did years ago when some
bottles of Tylenol had been tampered with. I lost my Internet
connection with AT&T and it took five hours and six technical
support technicians to bring me back online. I need not make
any comments about the health insurers.
You want to be unique, like the FedEx selling line, “When
you absolutely, positively need it overnight,” although it ap-
pears that they have stupidly stopped using the phrase. I had a
home builder client who had twenty-five homes he wanted to
sell during the next twelve months with a relatively small ad-
vertising budget. I did some research and found that most
other builders usually ran full-page newspaper ads, with a few
scheduling a two-page spread. I proposed a three-page spread
with the front page showing a couple drinking coffee and hold-
ing up an invitation card that read, “The Homes for Elegant Liv-
ing.” When you turned the page, an illustration of the most
attractive home was spread across the two pages, which was
about twenty-two inches wide. At first the client thought I was
nuts, because the ad would take up 90 percent of his entire
budget. He finally agreed to let me run with it. I also had all
salesmen wear white dinner jackets. The Sunday his ad ran, his
subdivision was so mobbed I had to call the police to come out
and handle the traffic. All of the homes were sold in ninety
days—and we never had to run another ad.
You want to keep it simple. It is said that, after listening to a
two-hour sermon, the First Lady asked her husband, President
Coolidge, what the sermon was about. He replied, “Sin.” She
was a little shocked, but then asked what the pastor said about
it. The president is said to have replied, in his usual taciturn
manner, “He was against it.” Years ago Hawaiian Punch ran a
ten-second television commercial that made them number
one in sales. It consisted of two cartoon characters in Hawaiian
68
The Marketing Plan

shirts, with one holding a bottle of the product. He asks the
other if he would like a Hawaiian punch and when the man
said yes, he leaned over and punched him in the nose.
There is a separate chapter on pricing in this book (Chap-
ter 12, The Sales Plan: Pricing), but the main thing to remember
is base your price on value, not on costs. DuPont developed a
new resin for drainpipes that kept the pipe from leaking. The
costs associated with using the resin were negligible, but
DuPont increased the cost of the pipe 400 percent, because that
was the value.
Base your development against the target audience, as dis-
cussed in Chapter 4, Customer Analysis, and don’t forget the
20/80 guideline: approximately 20 percent of the market should
account for 80 percent of your profitable sales. And when you
have a winning personality, stay with it. Rosser Reeves, when he
was president of the advertising agency Ted Bates, was on his
yacht with a client who reminded Bates that he had been run-
ning the same campaign for him for the last ten years and asked
Reeves how many employees he had. Reeves answered, “Two
thousand.” “Then,” asked the client, “what are they doing for
me?” Reeves’s answer: “Those two thousand people are keeping
your people from changing that campaign.”
So, what is your brand’s personality? If you are not sure, you
should first obtain a statement of position, which details what
your current and potential customers have to say about your
company. You will probably need a benchmark research study
(see Chapter 17, The Research Plan) to obtain the answers. Af-
ter you complete this study, you can prepare your positioning
statement.
Your positioning statement is your company’s personality.
It is how you want to be perceived by your target audience. It is
usually written by marketing people, but it should reflect your
entire operation. Everything you do should be compatible with
Brand Development 69

70
The Marketing Plan
it. Following is a positioning statement that could have been
written by Bloomingdale’s in New York City.
You may want to take a stab at writing your own now, but
based on how you complete the remaining sections of this
book, your initial draft may be altered. For example, in the next
chapter you will determine what type of mousetrap you want
your company to be and that will influence your positioning
statement.
You can photocopy this worksheet or print out a copy of the
positioning statement worksheet from your downloaded folder
of Word worksheets.
Worksheet 5–1
Positioning statement
1. Who: _________________________________________________________
______________________________________________________________
2. What: _________________________________________________________
______________________________________________________________
3. For whom: _____________________________________________________
______________________________________________________________
Figure 5–1
Possible positioning statement for Bloomingdale’s.
Positioning Statement
1. Who: Bloomingdale’s, NYC
2. What: Fashion-focused department store
3. For whom: Trend-conscious, upper-middle-class women
4. What need: Looking for high-end products
5. Competition: Other department stores
6. What’s different: Unique merchandising in a theatrical setting
7. So?: It makes shopping entertaining

4. What need: ____________________________________________________
______________________________________________________________
5. Against whom: _________________________________________________
______________________________________________________________
6. What’s different: ________________________________________________
______________________________________________________________
7. So?: __________________________________________________________
______________________________________________________________
To execute your new or revised brand personality, you
may have to increase your marketing budget and one of the
best times to do so is when the economy is not doing so well.
There have been many research studies that indicate that those
companies that increase their marketing pressure during bad
times are usually the ones that come out on top when the econ-
omy improves. And you may want to think beyond the current
marketing tools you are using.
You do not have to be a large company to develop a favor-
able brand personality. A corporate jet refueler offers low fuel
prices and fast service. It also has two women dressed in short
white skirts and sleeveless T-shirts waving bright orange flags to
direct pilots to its facility. But the real attraction for their cus-
tomers is what’s in the brown paper bag the women slip to the
pilots once they pulled in to fill up—Kansas City strip steaks. Pi-
lots say their bosses like the fuel price, but they stop there for
the steaks.
Brand Development 71

This page intentionally left blank

73
You have a choice of four different types of mousetraps to catch
your customers. They are:
1. A better mousetrap
2. A disappearing-mouse mousetrap
3. A 36-inch mousetrap
4. A cheaper mousetrap
A better mousetrap is of higher quality than the competi-
tion. Examples are Haagen Dazs ice cream, Godiva chocolates,
and Cross pens. A disappearing-mouse mousetrap is where
you don’t have to see the dead mouse. You can now buy
mousetraps where the mouse goes into a box, like a little hotel,
and can’t get back out in the morning. Then you throw out the
hotel. This type of mousetrap is not any more effective than the
old kind, but is preferred because you don’t see the dead
mouse. The definition of a disappearing-mouse mousetrap is a
product or service that is actually not superior to competition,
but is believed to be so, due to effective marketing. Examples
are Marriott Hotels, Budweiser, and British Airways.

You beer drinkers who don’t like the taste of Bud and want
to argue with me about classifying Budweiser as a disappear-
ing-mouse mousetrap, you have to remember they have the
largest market share of any beer.
A 36-inch mousetrap is a niche player. Examples are Has-
selblad cameras, Montessori schools, and Panera Bread. A
cheaper mouse trap is self-explanatory. Examples are Wal-
Mart, Days Inn, and Target.
To become one of these four types of mousetraps takes
money. For example, if you want to be a better mousetrap, you
have to improve your business operation, either your manu-
facturing process, customer service, or some other aspect. At
Marriott, customer service is an attitude, not a department.
“Marriott is the most reliable of brands,” says Bjorn Hanson, an
industry analysis who now teaches at New York University’s
Tisch Center for Hospitality, Tourism, and Sports Management.
“There is a saying in the industry that Marriott puts heads in
beds.”
To become a disappearing-mouse mousetrap, you have to
become more effective in marketing. Who doesn’t love those
Budweiser Clydesdales? To be a successful niche player, you
have to have high quality and a large market share. Digital cam-
eras have replaced film, but the Hasselblad is the camera that
they took to the moon. Mention Panera Bread and fans are as
likely to praise the free Wi-Fi as they are to gush about the Asi-
ago cheese bagels. And that, execs at the $2.6 billion restaurant
chain say, is the point. While its competitors scale back on up-
scale ingredients, trim portion sizes, and create value menus,
Panera is selling fresh food and warm bread at full price and
encouraging customers to linger. That recipe is succeeding.
Responding to competition, Starbucks is now starting to of-
fer free Wi-Fi in their stores.
To be a cheaper mousetrap, you have to increase your pro-
74
The Marketing Plan

The Product/Service Plan 75
ductivity so you will be the best in operational efficiency.
Wal-Mart has more screens at their home base than the three
television networks combined. They show every step of their
distribution process around the world.
Because more expenditures are needed to execute any of
these strategies, a good system to use is the experience curve to
determine whether the costs are justifiable. The experience
curve concept was initially labeled the learning curve. During
World War II, an Air Force general recognized that as we kept
assembling more and more B-17 bombers, the workforce was
able to assemble each one in less time. As labor spent more
time on the job, they became more adept at what they were
doing, adapted better processes, became more specialized,
and so on. The result was increased productivity. This concept
is considered just common sense today, but back then it was
revolutionary.
In subsequent years, management realized that savings
due to increased productivity were possible from many areas
besides labor. There were economies of scale. If a 10-million-
ton oil refinery cost $10 million to build and took 5,000 em-
ployees to operate, a 20-million-ton refinery does not cost $20
million to build and take 10,000 employees to operate. Rather,
approximately $15 million and 7,500 employees. As companies
bought larger amounts from their suppliers, they could demand
lower prices and better terms. Marketing costs could also be
lowered. It doesn’t cost ten times as much to advertise ten stores
in a city as it does for one.
The sum of all these savings is referred to as “the experi-
ence curve” and the concept is that in industries where these
savings are applicable and you take advantage of them, your
costs will decrease approximately the same percent each time
you double your volume. If your costs in real dollars after you
double your volume are 85 percent of previous figures, then

you are on an 85 percent experience curve. Notice that it’s
based on doubling of volume, not on time. Therefore, you can
use the experience curve to check the feasibility of adapting
one of the above strategies.
Calculating the Experience Curve
To begin, you should determine what experience curve rate
you are currently on based on past costs versus today’s costs.
Let’s look at the first case history, in CEXCURVE.xls, concerning
a hypothetical company called Strategic Business Unit (SBU).
The experience curve for this company, SBU, is 89.01 per-
cent. Their operation has three components. There is one
component A per unit, two components B, and one compo-
nent C, which is supplied by an outside supplier. The experi-
ence curve for component A is 84.34 percent, 87.36 percent for
component B, 81.90 percent for component C, and 89.01 per-
cent in total. (Yes, the total experience curve is calculated in-
dependently, from the total costs themselves; it is not an
average—weighted or otherwise—of the first three curves.)
Let’s examine in detail how the computer model performs.
Component A costs $50 in 2002 and $30 in 2009. The experi-
ence curve concept is that costs are decreased at the same
percentage rate each time cumulative volume is doubled.
First-year volume (2002) for SBU X (our new product’s name)
was 1,000 units. There is one component A per unit so first-year
volume on component A was also 1,000. First-year volume is
the base on which all subsequent doubling is calculated. In
2003, volume on component A was 2,100 and the computer
model recognizes that the first doubling in volume occurs
(from 1,000 the first year to 2,100 cumulative by the end of the
second year). The second doubling will occur when cumulative
volume hits 4,000 and this happens in 2005. The third doubling
76
The Marketing Plan

will be 8,000 and this level is reached in 2008. The question to
the computer model is: at what experience curve rate are costs
being reduced if a component’s cost is reduced from $50 to
$30 during a period of three doublings? The answer is 84.34
percent, as shown in the exhibit directly under the column
“# units” for component A. If you want to verify the computer
model’s math, multiply $50 by 84.34 percent and you will get
$42.17. This should be the cost of component A after the first
doubling, which occurs in 2003. Verify this cost on the exhibit.
The cost after the second doubling (2005) should be $42.17
times 84.34 percent or $35.57, and the third doubling (2008),
$35.57 times 84.34 percent or $30. Isn’t math gratifying?
The computer model does the same calculations for com-
ponent B, component C, and the sum of components A, B, and
C or total cost of SBU X. For component B, two units are used for
each unit of SBU X, so the first doubling occurs at 4,000 (first-
year volume of 2,000 times 2) rather than the 2,000 level for
component A (first-year volume of 1,000 times 2). However,
even though each doubling is achieved at higher levels (first:
4,000; second: 8,000; third: 16,000; and so on) than for compo-
nent A, because two units are used per unit of SBU X, compo-
nent B reaches each doubling at the same time as component A.
This is not true for component C. First-year volume is 1,000
because one component is used per SBU X unit. However, the
company that supplies this component to the company had pro-
duced 4,000 for use with other products before 2002. Therefore,
the first-year volume is listed at 5,000 and the first doubling does
not occur until 10,000 units. This level is not reached until 2006
(10,105 cumulative volume). Although the experience curve
rate or cost reduction for each doubling is greater for component
C (81.90 percent) than for A (84.34 percent) or B (87.36 percent),
only one doubling is obtained during the period 2002 to 2009,
and the cost is only reduced from $105 to $86 ($105 times 81.90
The Product/Service Plan 77

percent). The combined experience curve rate for SBU X is
89.01 percent and total cost of goods is reduced from $329 to
$232 during these eight years (2002 to 2009).
This experience curve rate for the components can now be
used for future costs projections. SBU can estimate that when
they reach the fourth doubling (16,000), the cost for component
A should be approximately $25.30 ($30 times 84.34 percent); fifth
doubling, $21.34 ($25.30 times 84.34 percent); and so on.
When you use this part of the model EXCURVE.xls for
your own SBUs, you may find that you have experienced no
cost reductions, even after adjusting the numbers for inflation.
This would probably mean that either the experience curve
concept does not exist in your particular market or it does but
you are not taking advantage of it. In some industries it’s diffi-
cult, if not impossible, to experience savings from economies of
scale, although the number of industries appears to be small.
An example would be most restaurants because they tend to be
labor-intensive and have high staff turnover. On the other
hand, the economies could be there in your particular industry,
but you have failed to realize it. Maybe you are not demanding
lower costs from your suppliers due to your increased volume
nor are you aggressively promoting your firm to top prospective
new employees. Maybe you have not organized your company
to profit from economies of scale in manufacturing, operations,
advertising, distribution, sales promotion, etc.
From your books or accountant, insert your own data in the
Excel file EXCURVE.xls. Only insert your data where you see
the blue zeros or lines. All black zeros are formulas.
After you insert your numbers, the experience curve rate
will be calculated automatically. If you have more components
than shown above, just copy and paste. If you are a service
company, you can change the word “component” to “service
offered,” “customer service,” etc.
78
The Marketing Plan

For comparison purposes, you can project yourself into the
future doing what you are doing now and then compare these
numbers with those of the various strategies you want to con-
sider. The case history of our hypothetical SBU, we postulate
that it is growing at the rate of 10 percent per year (see Figures
6–1 and 6-2). The projection of how this will play out in suc-
ceeding years is shown in Figure 6–3.
Now we will take a look at their complete operation, as
seen in Figure 6–4. It includes the total costs, pricing, market
share, and profits for our SBU.
Calculating Discounted Cash Flow
Our third and final file for the status quo shows the discounted
cash flow of this plan (see Figure 6–5). Discounted cash flow is
probably the single most important number that will come out
of this chapter.
This is not a bad plan. If the SBU just continues doing what
they have in the past, their discounted cash flow is 15 percent.
Discounted cash flow is your return on your investment over
time. When you complete these same three files for your com-
pany and you obtain a similar rate of return, you may not want
to make any changes. Of course, if you obtain a lower rate of re-
turn, most likely you should consider changes.
I believe discounted cash flow is the most meaningful
measurement of success. Profit is something made up by ac-
countants. Try buying something at the grocery store with that
figure. Besides, it doesn’t take into account committed re-
sources or time. Return on investment (ROI) adds resources to
the equation, but does not consider time, and once again, it’s
an accounting term. However, cash flow is that green stuff in
your pocket and that’s what really counts. Adding time to cash
flow gives you discounted cash flow or the rate of return on
The Product/Service Plan 79
(text continues on page 84)

Figure 6–1
Past cost of goods experience—SBU (CEXCURVE; range name: SBUpastcosts).
Past Cost of Goods Experience—SBU
SBU
X
2002-2009
Range Name : SBUpastcosts
(Units are in Hundreds)
Component C
| Component A
| Component B
| Outside supplier
|
Growth
# Units
|
# per unit
1
|
# per unit
2
|
# per unit
1
|
Total
Year
Rate
Prod.
Cum Vol
|
# Units
Cost
Doubled |
# Units
Cost
Doubled |
# Units
Cost
Doubled |
Cost
Doubled
2002
1,000
1,000
|
1,000
$50.00
0
|
2,000
$87.00
0
|
5,000
$105.00
0
|
$329.00
0
2003
10%
1,100
2,100
|
2,100
$42.17
1
|
4,200
$76.00
1
|
6,100
$105.00
0
|
$299.17
1
2004
10%
1,210
3,310
|
3,310
$42.17
1
|
6,620
$76.00
1
|
7,310
$105.00
0
|
$299.17
1
2005
10%
1,331
4,641
|
4,641
$35.57
2
|
9,282
$66.39
2
|
8,641
$105.00
0
|
$273.36
2
2006
10%
1,464
6,105
|
6,105
$35.57
2
|
12,210
$66.39
2
|
10,105
$86.00
1
|
$254.36
2
2007
10%
1,611
7,716
|
7,716
$35.57
2
|
15,431
$66.39
2
|
11,716
$86.00
1
|
$254.36
2
2008
10%
1,772
9,487
|
9,487
$30.00
3
|
18,974
$58.00
3
|
13,487
$86.00
1
|
$232.00
3
2009
10%
1,949
11,436
|
11,436
$30.00
3
|
22,872
$58.00
3
|
15,436
$86.00
1
|
$232.00
3
Exp. Rate
Exp. Rate
Exp. Rate
Exp. Rate
84.34%
87.36%
81.90%
89.01%
6,620

Figure 6–2
Your past cost of goods experience—SBU (EXCURVE, range name: SBUpastcosts).
Past Cost of Goods Experience—SBU
SBUX
________
Range Name: SBUpastcosts
(Units are in Hundreds)
Component C
‚
Component A
‚Component B
‚
Outside supplier
‚
Growth
# Units
‚ # per unit
0
‚
# per unit
0
‚ # per unit
0
‚
Total
Year
Rate
Prod.
Cum Vol ‚
# Units
Cost
Doubled
‚
# Units
Cost
Doubled
‚
# Units
Cost
Doubled ‚
Cost
Doubled
___
0
0
‚
0
$0.00
0
‚
0
$0.00
0
‚
0
$0.00
0
‚
$0.00
0
___
0
0
0
‚
0
$0.00
0
‚
0
$0.00
0
‚
0
$0.00
0
‚
$0.00
0
___
0
0
0
‚
0
$0.00
0
‚
0
$0.00
0
‚
0
$0.00
0
‚
$0.00
0
___
0
0
0
‚
0
$0.00
0
‚
0
$0.00
0
‚
0
$0.00
0
‚
$0.00
0
___
0
0
0
‚
0
$0.00
0
‚
0
$0.00
0
‚
0
$0.00
0
‚
$0.00
0
___
0
0
0
‚
0
$0.00
0
‚
0
$0.00
0
‚
0
$0.00
0
‚
$0.00
0
___
0
0
0
‚
0
$0.00
0
‚
0
$0.00
0
‚
0
$0.00
0
‚
$0.00
0
___
0
0
0
‚
0
$0.00
0
‚
0
$0.00
0
‚
0
$0.00
0
‚
$0.00
0
Exp. Rate
Exp. Rate
Exp. Rate
Exp. Rate
0.00%
0.00%
0.00%
0.00%

Figure 6–3
Estimated cost of goods experience—status quo (CEXCURVE; range name: Growthstatusquo).
Range Name : Growthstatusquo
Estimated Future Cost of Goods Experience—Status Quo
2010-2019
Component C
|
Component A
|
Component B
|
Outside supplier
|
|
# per unit
1
|
# per unit
2
|
# per unit
1
|
Growth
# Units
|
Exp. Curve
0.00%
|
Exp. Curve
|
Exp. Curve
0.00%
|
Total
Year
Rate
Produced
Cum Vol
|
Units
Cost
Doubled|
Units
Doubled|
Units
Cost
Doubl.
|
Cost
Doubled
11,436
|
11,436
$30.00
3
|
22,872
3
|
15,436
$86.00
1
|
$232.00
3
2010
10%
2,144
13,579
|
13,579
$30.00
3
|
27,159
3
|
17,579
$86.00
1
|
$232.00
3
2011
10%
2,358
15,937
|
15,937
$30.00
3
|
31,875
3
|
19,937
$86.00
1
|
$232.00
3
2012
10%
2,594
18,531
|
18,531
$25.30
4
|
37,062
4
|
22,531
$70.44
2
|
$197.08
4
2013
10%
2,853
21,384
|
21,384
$25.30
4
|
42,769
4
|
25,384
$70.44
2
|
$197.08
4
2014
10%
3,138
24,523
|
24,523
$25.30
4
|
49,045
4
|
28,523
$70.44
2
|
$197.08
4
2015
10%
3,452
27,975
|
27,975
$25.30
4
|
55,950
4
|
31,975
$70.44
2
|
$197.08
4
2016
10%
3,797
31,772
|
31,772
$25.30
4
|
63,545
4
|
35,772
$70.44
2
|
$197.08
4
2017
10%
4,177
35,950
|
35,950
$21.34
5
|
71,899
5
|
39,950
$70.44
2
|
$180.30
5
2018
10%
4,595
40,545
|
40,545
$21.34
5
|
81,089
5
|
44,545
$57.69
3
|
$167.56
5
2019
10%
5,054
45,599
|
45,599
$21.34
5
|
91,198
0.00%
Cost
$58.00
$58.00
$58.00
$50.67
$50.67
$50.67
$50.67
$50.67
$44.26
$44.26
$44.26
5
|
49,599
$57.69
3
|
$167.56
5
Exp. Rate
Exp. Rate
Exp. Rate
Exp. Rate
84.34%
87.36%
81.90%
87.38%

Figure 6–4
Status quo strategy (CEXCURVE; range name: SBUstatusquo).
SBU
X
Plan
G
Total Costs, Pricing, Share, and Profit—SBU
(Units & Operating Income in Hundreds)
Range Name: SBUstatusquo
Growth
# Units
Cost of
CS/
Value
Mfg./
Total
Sales
Oper.
Ind.
Year
Rate
Prod.
Goods
Sales
Prom.
Dist.
Added
Eng.
G/A
Costs
Price
Profit
Growth
Share
2002
1,000
$329
$50
$20
$5
$0
$0
$20
$424
$400
($24,000)
10%
25%
2003
10%
1,100
$299
$50
$20
$5
$0
$0
$20
$394
$400
$6,408
10%
25%
2004
10%
1,210
$299
$50
$20
$5
$0
$0
$20
$394
$400
$7,049
10%
25%
2005
10%
1,331
$273
$50
$20
$5
$0
$0
$20
$368
$400
$42,118
10%
25%
2006
10%
1,464
$254
$50
$20
$5
$0
$0
$20
$349
$400
$74,148
10%
25%
2007
10%
1,611
$254
$50
$20
$5
$0
$0
$20
$349
$400
$81,563
10%
25%
2008
10%
1,772
$232
$50
$20
$5
$0
$0
$20
$327
$400
$129,324
10%
25%
2009
10%
1,949
$232
$50
$20
$5
$0
$0
$20
$327
$400
$142,256
10%
25%
2010
10%
2,144
$232
$50
$20
$5
$0
$0
$20
$327
$400
$156,482
10%
25%
2011
10%
2,358
$232
$50
$20
$5
$0
$0
$20
$327
$400
$172,130
10%
25%
2012
10%
2,594
$197
$50
$20
$5
$0
$0
$20
$292
$400
$279,926
10%
25%
2013
10%
2,853
$197
$50
$20
$5
$0
$0
$20
$292
$400
$307,919
10%
25%
2014
10%
3,138
$197
$50
$20
$5
$0
$0
$20
$292
$400
$338,710
10%
25%
2015
10%
3,452
$197
$50
$20
$5
$0
$0
$20
$292
$400
$372,582
10%
25%
2016
10%
3,797
$197
$50
$20
$5
$0
$0
$20
$292
$400
$409,840
10%
25%
2017
10%
4,177
$180
$50
$20
$5
$0
$0
$20
$275
$400
$520,886
10%
25%
2018
10%
4,595
$168
$50
$20
$5
$0
$0
$20
$263
$400
$631,542
10%
25%
2019
10%
5,054
$168
$50
$20
$5
$0
$0
$20
$263
$400
$694,696
10%
25%
Total Profit
$4,343,579
Status
Quo Strategy

your resources invested over a given period of time. Calculating
discounted cash flow on various plans also allows you to com-
pare apples and oranges. If plan A is to raise apples with an ini-
tial investment of $100,000 and estimated DCF of 20 percent
over five years, everything else being equal, it’s better than plan
B, which is to raise oranges with an initial investment of
$75,000 and estimated DCF of 10 percent over the same period
of time.
Figures 6-6, 6-7, and 6-8 are facsimiles of the three files we
have just discussed into which you will put your data to com-
pute your status quo.
Remember, only insert data where you see blue zeros. To
calculate your discounted cash flow factor, keep putting per-
cent numbers under the wording “Discount Factor” until the
number below is the smallest you can obtain. For example, on
Figure 6–5 the discount factor (last column on the right) is 15
percent and the number below that is 34,007. (Note that this
number does not represent dollars; it is just a number, and
your goal, for various arcane mathematical reasons, is to
84
The Marketing Plan
Figure 6–5
Discounted cash flow: status quo (CEXCURVE; range name: DCFstatusquo).
Discounted Cash Flow: Status Quo
Range Name: DCFstatusquo
Discount
Operating
Add Back
Initial
Total Cash
Factor
Year
Profit
Deprec.
Cost
Flow
15.00%
$2,000,000
($2,000,000)
($34,007)
2010
$156,482
$66,667
$223,149
2011
$172,130
$66,667
$238,797
2012
$279,926
$66,667
$346,593
2013
$307,919
$66,667
$374,586
2014
$338,710
$66,667
$405,377
2015
$372,582
$66,667
$439,249
2016
$409,840
$66,667
$476,507
2017
$520,886
$66,667
$587,553
2018
$631,542
$66,667
$698,209
2019
$694,696
$66,667
$761,363

Figure 6–6 Your estimated future cost of goods experience—status quo (EXCURVE; range name: Growthstatusquo).
Range name: Growthstatusquo
Estimated Future Cost of Goods Experience—Status Quo
___________
Component C
‚
Component A
‚
Component B
‚
Outside supplier
‚
‚ # per unit
0
‚
# per unit
0
‚ # per unit
0
‚
Growth
# Units
‚ Exp. Curve
0.00%
‚
Exp. Curve
0.00%
‚ Exp. Curve
0.00%
‚
Total
Year
Rate
Produced
Cum Vol
‚
Units
Cost
Doubled
‚
Units
Cost
Doubled ‚
Units
Cost
Doubled
‚
Cost
Doubled
0
‚
0
$0.00
0
‚
0
$0.00
0
‚
0
$0.00
0
‚
$0.00
0
____
0%
0
0
‚
0
$0.00
0
‚
0
$0.00
0
‚
0
$0.00
0
‚
$0.00
0
____
0%
0
0
‚
0
$0.00
0
‚
0
$0.00
0
‚
0
$0.00
0
‚
$0.00
0
____
0%
0
0
‚
0
$0.00
0
‚
0
$0.00
0
‚
0
$0.00
0
‚
$0.00
0
____
0%
0
0
‚
0
$0.00
0
‚
0
$0.00
0
‚
0
$0.00
0
‚
$0.00
0
____
0%
0
0
‚
0
$0.00
0
‚
0
$0.00
0
‚
0
$0.00
0
‚
$0.00
0
____
0%
0
0
‚
0
$0.00
0
‚
0
$0.00
0
‚
0
$0.00
0
‚
$0.00
0
____
0%
0
0
‚
0
$0.00
0
‚
0
$0.00
0
‚
0
$0.00
0
‚
$0.00
0
____
0%
0
0
‚
0
$0.00
0
‚
0
$0.00
0
‚
0
$0.00
0
‚
$0.00
0
____
0%
0
0
‚
0
$0.00
0
‚
0
$0.00
0
‚
0
$0.00
0
‚
$0.00
0
____
0%
0
0
‚
0
$0.00
0
‚
0
$0.00
0
‚
0
$0.00
0
‚
$0.00
0
Exp. Rate
Exp. Rate
Exp. Rate
Exp. Rate
0.00%
0.00%
0.00%
0.00%

Figure 6–7
Your status quo strategy (EXCURVE; range name: SBUstatusquo).
SBU
___
Total Costs, Pricing, Share, and Profit—SBU
Plan
___
(Units & Operating Income in Hundreds)
Range Name: SBUstatusquo
Growth
# Units
Cost of
CS/
Value
Mfg./
Total
Sales
Oper.
Ind.
Year
Rate
Prod.
Goods
Sales
Prom.
Dist.
Added
Eng.
G/A
Costs
Price
Profit
Growth
Share
___
0
$0
$0
$0
$0
$0
$0
$0
$0
$0
$0
$0
0%
___
0%
0
$0
$0
$0
$0
$0
$0
$0
$0
$0
$0
$0
0%
___
0%
0
$0
$0
$0
$0
$0
$0
$0
$0
$0
$0
$0
0%
___
0%
0
$0
$0
$0
$0
$0
$0
$0
$0
$0
$0
$0
0%
___
0%
0
$0
$0
$0
$0
$0
$0
$0
$0
$0
$0
$0
0%
___
0%
0
$0
$0
$0
$0
$0
$0
$0
$0
$0
$0
$0
0%
___
0%
0
$0
$0
$0
$0
$0
$0
$0
$0
$0
$0
$0
0%
___
0%
0
$0
$0
$0
$0
$0
$0
$0
$0
$0
$0
$0
0%
____
0%
0
$0
$0
$0
$0
$0
$0
$0
$0
$0
$0
$0
0%
____
0%
0
$0
$0
$0
$0
$0
$0
$0
$0
$0
$0
$0
0%
____
0%
0
$0
$0
$0
$0
$0
$0
$0
$0
$0
$0
$0
0%
____
0%
0
$0
$0
$0
$0
$0
$0
$0
$0
$0
$0
$0
0%
____
0%
0
$0
$0
$0
$0
$0
$0
$0
$0
$0
$0
$0
0%
____
0%
0
$0
$0
$0
$0
$0
$0
$0
$0
$0
$0
$0
0%
____
0%
0
$0
$0
$0
$0
$0
$0
$0
$0
$0
$0
$0
0%
____
0%
0
$0
$0
$0
$0
$0
$0
$0
$0
$0
$0
$0
0%
____
0%
0
$0
$0
$0
$0
$0
$0
$0
$0
$0
$0
$0
0%
____
0%
0
$0
$0
$0
$0
$0
$0
$0
$0
$0
$0
$0
0%
Total Profit
$0
Status Quo Strategy

minimize it.) If you insert 16 percent instead of 15 percent,
the number below becomes
⫺123,940. If you insert 14 per-
cent, the number becomes 62,352. Therefore, 15 percent is
correct.
The computer model has files for six different experience
curve strategies and a composite that adds all the strategies
you complete into one. They are pricing (growthpricing),
sales (growthsales), promotion (growthpromotion), vertical in-
tegration (growthvalueadded), manufacturing/engineering
(growthmfgeng), customer service/distribution (growthcsdist)
and the composite (growthcomposite).
Following are the case history files for the pricing strategy.
Calculating a Pricing Strategy
Let’s assume one of your markets is sensitive to price; you are in
a position to absorb a loss for a few years; and you don’t believe
your competitors can or will match a price cut on your part.
Let’s further assume that if you lower your price from $400 to
$270 for two years and then to $235 for another three years, you
The Product/Service Plan 87
Figure 6–8
Your discounted cash flow: status quo (EXCURVE; range name:
DCFstatusquo).
Discounted Cash Flow: Status Quo
Range Name: DCFstatusquo
Discount
Operating
Add Back
Initial
Total Cash
Factor
Year
Profit
Deprec.
Cost
Flow
0.00%
$0
$0
____
____
____
____
____
____
____
____
____
____
$0
$0
$0
$0
$0
$0
$0
$0
$0
$0
$0
$0
$0
$0
$0
$0
$0
$0
$0
$0
$0
$0
$0
$0
$0
$0
$0
$0
$0
$0
$0

could increase your annual growth rate from 10 percent to 30
percent. Probably by the end of this five-year plan your com-
petitors would be forced out of the market, at which time you
would increase your price to $410. (Probably excessive num-
bers, but the theory is the same.)
Based on these assumptions, you can use the Excel file to
determine what would be the DCF for this price-cutting strategy.
As you can see in Figure 6–9, we inserted the above-mentioned
growth rate (30 percent) in the growth rate column. The com-
puter then calculates, based on the experience curve rate (de-
termined back in Figure 6–1, what your costs of goods would
be in subsequent years. As Figure 6–9 shows, costs for our hy-
pothetical SBU would be driven from $232 in 2009 to $142.59
in 2019.
Because we are considering a price-cutting strategy here,
we will keep all other costs the same as in the past on a per unit
basis. For example, as shown in Figure 6–10, SBU has been
spending $50 per unit on sales activity and plans to keep it at
this level. Next we have inserted a sales price and estimated in-
dustry growth rate. This enables the computer to calculate
SBUs operating profit and market share. As we see in Figure
6–10, market share increases from 25 percent to 58 percent.
We can now check on the financial soundness of this strat-
egy. We go to Discounted Cash Flow: Price (range name: DCF-
price) (see Figure 6–11), and insert the investment needed to
execute this plan for the status quo plan, which is $2,000,000. In
a pricing strategy such as this one, total investment and operat-
ing profit, rather than just incremental investment and operat-
ing profit resulting from the new strategy, is used in calculating
DCF. This is because a price cut affects the previous base of
business as well as any new business. For the other types of
strategies only incremental investment and operating profit
will be used on calculating DCF. Then we inserted non-cash
88
The Marketing Plan

Figure 6–9
Estimated cost of goods experience—SBU pricing (CEXCURVE; range name: Growthpricing).
Estimated Future Cost of Goods Experience—SBU Pricing
Range name: Growthpricing
2010-2019
Component C
|
Component A
|
Component B
|
Outside supplier
|
| # per unit
1
| # per unit
2
| # per unit
1
|
Growth
# Units
| Exp. Curve
84.34%
| Exp. Curve
87.36%
| Exp. Curve
81.90%
|
Total
Year
Rate
Produced
Cum Vol
|
Units
Cost
Doubled |
Units
Cost
Doubled |
Units
Cost
Doubled |
Cost
Doubled
11,436
|
11,436
$30.00
3
|
22,872
$58.00
3
|
15,436
$86.00
1
|
$232.00
3
2010
30%
2,533
13,969
|
13,969
$30.00
3
|
27,938
$58.00
3
|
17,969
$86.00
1
|
$232.00
3
2011
30%
3,293
17,263
|
17,263
$25.30
4
|
34,525
$50.67
4
|
21,263
$70.44
2
|
$197.08
4
2012
30%
4,281
21,544
|
21,544
$25.30
4
|
43,088
$50.67
4
|
25,544
$70.44
2
|
$197.08
4
2013
30%
5,566
27,110
|
27,110
$25.30
4
|
54,219
$50.67
4
|
31,110
$70.44
2
|
$197.08
4
2014
30%
7,235
34,345
|
34,345
$21.34
5
|
68,690
$44.26
5
|
38,345
$70.44
2
|
$180.30
5
2015
10%
7,959
42,304
|
42,304
$21.34
5
|
84,608
$44.26
5
|
46,304
$57.69
3
|
$167.56
5
2016
10%
8,755
51,059
|
51,059
$21.34
5
|
102,118
$44.26
5
|
55,059
$57.69
3
|
$167.56
5
2017
10%
9,630
60,689
|
60,689
$21.34
5
|
121,379
$44.26
5
|
64,689
$57.69
3
|
$167.56
5
2018
10%
10,593
71,283
|
71,283
$18.00
6
|
142,566
$38.67
6
|
75,283
$57.69
3
|
$153.03
6
2019
10%
11,653
82,936
|
82,936
$18.00
6
|
165,871
$38.67
6
|
86,936
$47.25
4
|
$142.59
6
Exp. Rate
Exp. Rate
Exp. Rate
Exp. Rate
84.34%
87.36%
81.90%
86.99%

Figure 6–10
Pricing strategy (CEXCURVE; range name: SBUpricing).
SBU
X
Pricing
Plan
A
Exhibit 8
Total Costs, Pricing, Share and Profit—SBU
SBU Pricing
(Units & Operating Income in Hundreds)
Range Name: SBUpricing
Cost of
Goods
Sales
Prom.
CS/
Dist.
Value
Added
Mfg./
Eng.
G/A
Total
Costs
Sales
Price
Oper.
Profit
Ind.
Growth
Share
# Units
Prod.
Growth
Rate
Year
2002
1,000
$329
$50
$20
$5
$0
$0
$20
$424
$400
($24,000)
10%
25%
2003
10%
1,100
$299
$50
$20
$5
$0
$0
$20
$394
$400
$6,408
10%
25%
2004
10%
1,210
$299
$50
$20
$5
$0
$0
$20
$394
$400
$7,049
10%
25%
2005
10%
1,331
$273
$50
$20
$5
$0
$0
$20
$368
$400
$42,118
10%
25%
2006
10%
1,464
$254
$50
$20
$5
$0
$0
$20
$349
$400
$74,148
10%
25%
2007
10%
1,611
$254
$50
$20
$5
$0
$0
$20
$349
$400
$81,563
10%
25%
2008
10%
1,772
$232
$50
$20
$5
$0
$0
$20
$327
$400
$129,324
10%
25%
2009
10%
1,949
$232
$50
$20
$5
$0
$0
$20
$327
$400
$142,256
10%
25%
2010
30%
2,533
$232
$50
$20
$5
$0
$0
$20
$327
$270
($144,400)
10%
30%
2011
30%
3,293
$197
$50
$20
$5
$0
$0
$20
$292
$270
($72,705)
10%
35%
2012
30%
4,281
$197
$50
$20
$5
$0
$0
$20
$292
$235
($244,363)
10%
41%
2013
30%
5,566
$197
$50
$20
$5
$0
$0
$20
$292
$235
($317,672)
10%
49%
2014
30%
7,235
$180
$50
$20
$5
$0
$0
$20
$275
$235
($291,618)
10%
58%
2015
10%
7,959
$168
$50
$20
$5
$0
$0
$20
$263
$410
$1,173,490
10%
58%
2016
10%
8,755
$168
$50
$20
$5
$0
$0
$20
$263
$410
$1,290,838
10%
58%
2017
10%
9,630
$168
$50
$20
$5
$0
$0
$20
$263
$410
$1,419,922
10%
58%
2018
10%
10,593
$153
$50
$20
$5
$0
$0
$20
$248
$410
$1,715,864
10%
58%
2019
10%
11,653
$143
$50
$20
$5
$0
$0
$20
$238
$410
$2,009,100
10%
58%
T otal Profit
$6,997,324
Openmirrors.com

expenditures, in this case depreciation, and the computer cal-
culates the DCF for the plan. In the case history, it is 16 percent.
The discounted cash flow rate is only 16 percent for this pric-
ing strategy, just one point above the status quo of 15 percent.
Unless you made a mistake in your calculations or want to
make some changes in the strategy, this activity does not make
financial sense. That is the value of these files. You keep trying
different strategies until you obtain a good financial return.
You may have noticed that no tax was taken out of operat-
ing income. To calculate true DCF, you should go to EX-
CURVE.xls (range name DCFprice) and fill in your data as we
have done in Figure 6–11. Because there is such a wide varia-
tion on how tax is calculated for various companies, this has
not been included in the model.
What If . . . ?
Following are five additional strategies that you can experiment
with by asking yourself what if I did this or that. You are looking
The Product/Service Plan 91
Figure 6–11 Discounted cash flow: Price (CEXCURVE; range name: DCFprice).
Range Name: DCFPrice
Discounted Cash Flow: Price
Discount
Operating
Add Back
Initial
Total Cash
Factor
Year
Profit
Deprec.
Cost
Flow
16.00%
$2,000,000
($2,000,000)
($48,972)
2007
($144,400)
$66,677
($77,723)
2008
($72,705)
$66,677
($6,028)
2009
($244,363)
$66,677
($177,686)
2010
($317,672)
$66,677
($250,995)
2011
($291,618)
$66,677
($224,941)
2012
$1,173,490
$66,677
$1,240,167
2013
$1,290,838
$66,677
$1,357,515
2014
$1,419,922
$66,677
$1,486,599
2015
$1,715,864
$66,677
$1,782,541
2016
$2,009,100
$66,677
$2,075,777

92
The Marketing Plan
for the one that gives you your best discounted case flow. The
strategies are value added, promotion, sales, customer ser-
vice/distribution and manufacturing/engineering. You should
look at the case histories first on Cexcurve.xls and then go to
Excurve.xls and fill in your data.
Value Added
The primary reason for vertical integration is to increase value
added because the higher the value added, everything else be-
ing equal, the higher the ROI.
There are two ways to vertically integrate: backward (“up-
stream”) and forward (“downstream”). If you are a paper man-
ufacturer, an example of upstream integration is the growing of
trees and of downstream, the purchase or development of retail
stores that sell your paper. The major factor to consider in in-
tegration is margins (operating profit before taxes expressed as
a percent of total sales or revenues). You normally want to go in
the direction of the highest margins and they usually in-
crease as you move closer to the end user of your product or
service. If you integrate upstream, the product or service is
normally more of a commodity and therefore price is a major
factor and margins are small. Conversely, if you market your
products to the retail trade, such as Reynolds Metals (Reynolds
Wrap and a host of other consumer products), you can enjoy
margins as high as 30 to 40 percent. However, you have to
understand the business. DuPont decided to sell the core of
their business—nylon and textiles—and became a “science
company.” I cannot find an explanation for the switch, but it
has not gone very well for them. They moved from a market
they knew and were strong in to a market they don’t know
that well and are not strong in. They were profitable the last

The Product/Service Plan 93
two quarters, but their stock price is lower than it was seven
years ago.
Recently, companies have become more prone to go ver-
tical. Oracle Corporation bought Sun Microsystems to trans-
form the company into a maker of software, computers, and
computer components. Pepsi is buying distributors because
they want more control over distribution. Boeing purchased
Vought Aircraft Industries to add control over manufacturing
and Apple bought P.A. Semi for their customized micro-
processors.
Value added is the percent of the selling price that you add
to cover your own activity. If you buy raw materials for $200
and fabricate them into a machine that you sell for $1,000, your
value added is 80 percent. Therefore, the more you integrate,
the higher your value added.
Now, returning to our case study of SBU X, it is estimated
that by executing a vertical integration strategy and a slight re-
duction in price based on resulting cost savings, annual sales
growth can be increased from the current 10 percent to 13 per-
cent for five years and then back to 10 percent for the next five
years. This is shown in the CEXCURVE.xls file “Estimated Fu-
ture Cost of Goods Experience—Value Added” (range name:
Growthvalueadded). This increased sales volume would lower
costs of goods from $232 to $167.56 by 2019.
In the CEXCURVE, “Value Added Strategy” (range name:
SBUvalueadded), the anticipated cost savings of $10 per unit
for the years 2010 to 2013 and $15 for 2014 to 2019 are shown.
Price has been decreased from $400 to $390 beginning in
2010 and to $385 in 2014. The financials for this strategy are
shown in the Excel file “Discounted Cash Flow: Value Added”
(range name: DCFvalueadded). The incremental DCF rate is
27 percent.

Promotion Strategy
Nobody does it better than Procter & Gamble. Although they
usually launch with a superior product, it is the power of their
advertising and sales promotion that makes them either one or
two in market share in most of their markets. However, once
again, you have to know what you are doing. Texas Instru-
ments, a technology-driven company, tried three times to
crack consumer markets (hand-held calculators, watches, and
personal computers for the home) and failed miserably each
time. After announcing they were getting out of consumer
marketing, their stock increased $50 the next day.
Returning to our case study of SBU X, it is estimated that by
executing a heavy promotion strategy, annual sales growth can
be increased from the current 10 percent to 14 percent for five
years and then back to 10 percent for the next five years. This is
shown in the CEXCURVE file “Estimated Future Cost of Goods
Experience—Promotion” (range name: Growthpromotion).
This increased sales volume would lower costs of goods from
$232 to $167.56 by 2019.
In the CEXCURVE file “Promotion Strategy” (range name:
SBUpromotion), promotion expenditures per unit have been
increased from the current $20 to $50 for the period 2010 to
2014 and dropped back to $20 for the period 2015 to 2019. The
resulting share increase is from the current 25 percent to 30
percent in 2019.
This is one of the strategies behind the introduction of Fresca,
the Coca-Cola Company soft drink. Fresca was the first success-
ful non-sugar soft drink. Sugar accounts for over 50 percent of in-
gredient costs in a soft drink and consequently the Coca-Cola
Company could afford a much higher per unit advertising ex-
penditure on Fresca. The drink was very successful until the com-
pany had to change the formula due to the ban on cyclamates.
94
The Marketing Plan

The Product/Service Plan 95
The financials for this strategy are shown in the Excel file
“Discounted Cash Flow: Promotion” (range name: DCFpromo-
tion). The incremental DCF rate is only 15 percent.
Sales Strategy
Maybe emphasis on sales is the direction to go, like IBM (con-
sulting). Sales activity can be inserted into the Excel file. The
range names are in the upper right-hand corner of the charts
(growthsales, SBUsales, and DCFsales). In the case history, a
growth rate increase from the current 10 percent to 16 percent is
projected for five years. Sales expense has been increased from
$50 to $100 per unit. Projected share increase is from 25 percent
to 33 percent and the resulting incremental DCF is 12 percent.
Customer Service /Distribution Strategy
Disney, British Airways, and Marriott know the power of cus-
tomer service. Fed Ex and Wal-Mart know the power of unique
distribution.
This section is covered in the Excel file (range names:
growthcsdist, SBUcsdist, and DCFcsdist) as well. In the case
history, increased growth rate is projected from the current 10
percent to 13 percent for five years. Customer service/distribu-
tion costs are increased from $5 to $18 per unit. Share increases
from 25 percent to 29 percent, and the DCF for this execution is
estimated at 24 percent.
Manufacturing/Engineering Strategy
Here comes the better mousetrap; the best strategy of all if
you can pull it off. Use the following ranges for your attempt
to find a better mousetrap (range names: growthmfgeng,

96
The Marketing Plan
SBUmfgeng, and DCFmfgeng). For SBU X, it is estimated that
they will achieve the best DCF with an investment of $350,000
(too bad it isn’t quite that simple). Growth rate increases to 14
percent and share to 29 percent. They are even able to reduce
their manufacturing costs $12 per unit. The incremental DCF is
33 percent.
If you are considering developing a new product or service,
these files will help you determine your project goals and with
research, you can maintain close contact with your customers
as the following company, a medical-device manufacturer,
did. This company created a matrix to identify and weigh the
importance of various features to different customer segments.
It then tested trade-offs between product and things like price
with various medical specialists who used the product in sim-
ulated clinical settings. That allowed the team to fine-tune the
product well before launch for medical testing.
Composite of Above Strategies
On the composite range names, all the previous strategies ex-
cept for the pricing strategy are added together and we get the
final results (range names: growthcomposite, SBUcomposite,
and DCFcomposite). There’s no need to add anything to
growthcomposite because all its data is picked up from other
ranges. On SBUcomposite, everything is picked up except the
new sales price, the industry growth, and the beginning
share. On DCFcomposite, one only has to insert the right
DCF rate.
In the case history, the total growth rate is 30 percent for
five years and then levels off at 10 percent for the remaining
five. Cost of goods goes down from $232 in 2009 to $142.50 in
2019. Total costs, even with all this new activity, goes from
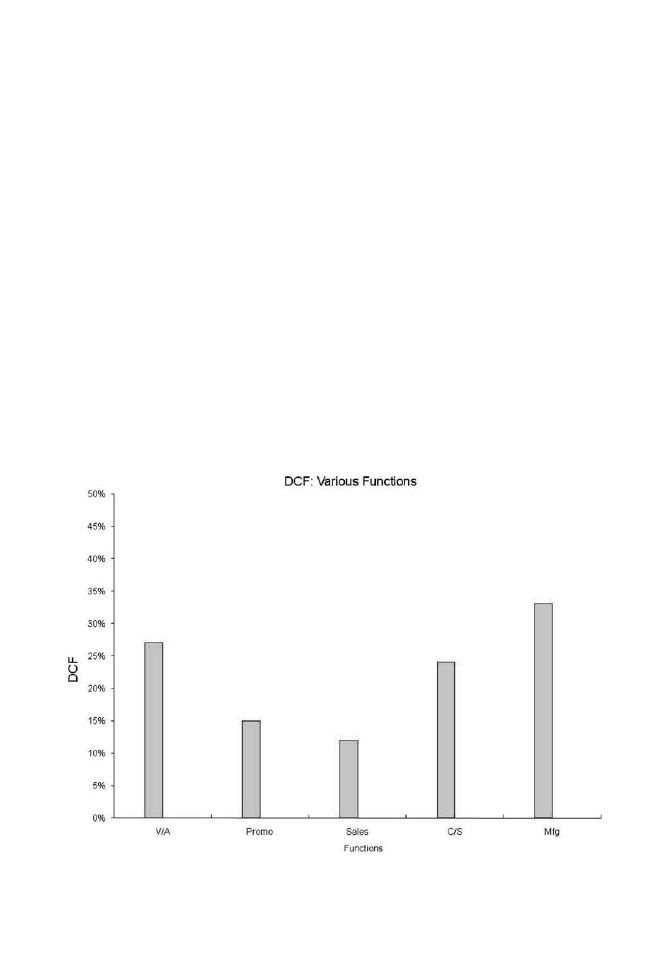
$424 in 2002 to just $213 in 2019. Market share increases to 58
percent (you own the market) and the incremental DCF is 30
percent.
The discounted cash flow of each strategy can be charted
with Excel’s charting function as seen in Figure 6–12. This is
one of seven charts on the various strategies available on the
CEXCURVE file.
For at least some of you, using the experience curve can
give you great savings. For example, the computer chip indus-
try is on a very high experience curve rate cost reduction, prob-
ably in the neighborhood of 50 percent. That means that every
time you double your volume, your costs are 50 percent lower.
Today you can hold in the palm of your hand a computer chip
The Product/Service Plan 97
Figure 6–12 Discounted cash flow by strategy (CEXCURVE; chart name:
DCFfunctions).

that has more power than a computer manufactured forty
years ago that was so large it would have filled six to ten bed-
rooms. If the American automobile industry had pushed the
experience curve similar to the computer industry, a Cadillac
today would cost $50 and be able to drive around the world on
one tank of gas.
The discounted cash flow rate for these various strategies
has nothing to do with the feasibility or possible effectiveness
that they would have in your market. They are just case histo-
ries showing how to calculate the results.
Following is a worksheet for your product/service plan.
You can photocopy this one, or print out a copy from the
Worksheets folder you downloaded. (Okay, one last time:
www.amacombook.org/go/MarketingPlan4.) You can change
my categories if appropriate, and you should probably not put
in volume and share until after you go through the upcoming
sales plan chapters (Chapters 12 and 13). By “type of mouse-
trap,” I mean which of the four approaches discussed above is
going to be your thrust.
Worksheet 6–1
Product/service plan: Objectives and strategies
Objectives
1. Type of mousetrap: _____________________________________________
______________________________________________________________
2. Volume/share: _________________________________________________
______________________________________________________________
3. Models/services: ________________________________________________
______________________________________________________________
4. New products/services: __________________________________________
______________________________________________________________
98
The Marketing Plan

Strategies
1. ______________________________________________________________
______________________________________________________________
2. ______________________________________________________________
______________________________________________________________
3. ______________________________________________________________
______________________________________________________________
4. ______________________________________________________________
______________________________________________________________
Notes
1. Marc Gunther, “Marriott Gets a Wake-Up Call,” Fortune,
2. Kate Rockwood, “Rising Dough, Why Panera Bread Is on a
Roll,” Fast Company, October 2009; http://www.fastcompany
.com/magazine/139/rising-dough.html.
3. Mike Gordon, Chris Musso, Eric Rebentisch, and Nisheeth
Gupta, “The Path to Developing Successful New Products,” Wall
Street Journal, November 30, 2009; http://online.wsj.com/article/
NA_WSJ_PUB:SB10001424052970203440104574400593760720388
.html#articleTabs%3Darticle.
The Product/Service Plan 99

This page intentionally left blank

101
Some consultants or authors recommend that in certain in-
dustries, you dedicate a particular percent of sales for your
marketing communications budget. I believe this is bad ad-
vice; you should not be spending the same amount as your
competitors. In those markets that you are pushing, you
should be spending more and in those markets where you are
harvesting, you should be spending less. For example, your
budget should be tied to your plans relative to market share ob-
jective, number of new products or services, market growth,
plant or facility utilization, amount of sales transaction, im-
portance to customer, premium or discounted pricing, relative
quality, depth of line, and a standard versus custom brand.
Following are some formulas that you can use to factor in
these components to calculate your budget. First, in Work-
sheet 7–1, you calculate your participant market factor, which
is based on your total sales. Then you adjust this factor,
based on the market objectives mentioned above, in Work-
sheets 7–2 through 7–11 to calculate your budget, as shown
on Worksheet 7–12.

For example, Worksheet 7–2 factors in your market share
objective. If your objective is less than 10 percent, you reduce
your marketing communications budget (developed in the
very first worksheet) to only 40 percent. If it is between 10 and
16.9 percent, you reduce it to only 70 percent. If it is between 17
and 24.9 percent, you reduce it to only 80 percent. However, if
it you are going for a market share between 25 and 39.9 per-
cent, you increase it by 1.20 percent and if over 40 percent, you
double it.
You make these adjustments based on your various objec-
tives on Worksheets 7–3 to 7–11 and insert the resulting budget
figures on Worksheet 7–12. You add them up and then divide
by the number of charts you used—and that is your marketing
communications budget.
Worksheet 7–1
Participant’s market factor
This worksheet enables you to calculate your participant market factor, the
“base” budget number that you will use on all of the subsequent worksheets.
Line 1 is the name of your company; line 2 your products or services; line 3
your current sales or a new sales target arrived at from the previous chapter
as well as other chapters in the book.
1. Participant’s market: _____________________________________________
2. Product/service for this market: ___________________________________
3. Estimate of total sales for participant: _______________________________
4. Divide line 3 by 750. This is your participant market factor: $ ____________
You may want to plug this amount into each of the following worksheets where
indicated now, before continuing with this chapter.
102
The Marketing Plan

Worksheet 7–2
Factoring in your market share objective
This worksheet helps you calculate your budget if it were based solely on your
market share objective.
1. Market share objective: ______________________________% __________
2. Choose a multiplication factor based on your market share objective: ______
Objective Multiplication
Factor
0–9.9%
.40
10–16.9%
.70
17–24.9%
.80
25–39.9%
1.20
40% and over
2.00
3. Participant’s market factor (from Worksheet 7–1): _____________________
4. Multiply line 2 by line 3: __________________________________________
Enter the budget amount from line 4 on line A in Worksheet 7–12.
Worksheet 7–3
Introducing a new product/service
Use this worksheet to calculate your budget as if it were based solely on new
product/service considerations.
1. Total estimated sales of new product/service in market: ________________
2. Company sales in new product/service market: _______________________
3. New product/service sales as a percent of total company sales: ________%
Share
Multiplication Factor
24.9% or less
.70
25%–39.9%
.80
40%–59.9%
1.40
60% and over
1.50
4. Choose a multiplication factor based on your percent of total: __________
5. Participant’s market factor (from Worksheet 7–1): _____________________
6. Multiply line 4 by line 5: __________________________________________
Enter the amount from line 6 on line B in Worksheet 7–12.
Calculating Your Marketing Communications Budget 103

Worksheet 7–4
Market growth
This worksheet will allow you to calculate your budget based on the estimated
growth of your market.
1. Estimated total sales in market: ____________________________________
2. Estimated sales next year: ________________________________________
3. Percentage increase: ___________________________________________%
Market growth
Multiplication Factor
No growth (less than 1%)
.80
Slow growth (1%–4.9%)
.90
Moderate growth (5%–11.9%)
1.20
Rapid growth (12% or more)
1.30
4. Choose your multiplication factor based on the rate of growth: __________
5. Participant’s market factor (from Worksheet 7–1): _____________________
6. Multiply line 4 by line 5: __________________________________________
Enter the amount from line 6 on line C in Worksheet 7–12.
Worksheet 7–5
Plant utilization
This worksheet allows you to calculate your budget based on plant utilization.
1. Estimated plant utilization capacity: ______________________________%
2. Choose a multiplication factor based on the figures below: _____________
Capacity utilization
Multiplication Factor
Under 65.9%
1.25
65%–84.9%
1.10
85% and over
.80
3. Participant’s market factor (from Worksheet 7–1): _____________________
4. Multiply line 2 by line 3: __________________________________________
Enter the amount from line 4 on line D in Worksheet 7–12.
104
The Marketing Plan

Worksheet 7–6
Amount of typical sales transaction
Use this worksheet to calculate the budget based on the amount of a typical
sales transaction.
1. Amount of typical sales transaction: $ ______________________________
2. Choose a multiplication factor based on the figures below: _____________
Typical sales transaction
Multiplication Factor
Under $100
1.70
$100–999
1.30
$1,000–9,999
1.20
$10,000–99,999
1.00
Over $100,000
.90
3. Participant’s market factor (from Worksheet 7–1): _____________________
4. Multiply line 2 by line 3: __________________________________________
Enter the amount from line 4 on line E of Worksheet 7–12.
Worksheet 7–7
Importance to customer
Use this worksheet to calculate your marketing communications budget based
on the importance or your product/service to the customer.
1. Percent of customer’s total purchases: ____________________________%
2. Choose your multiplication factor based on the chart below: ____________
Percent of total purchases
Multiplication Factor
< 1%
1.35
1%–4.9% 1.00
5%–24.9%
.90
> 25%
.80
3. Participant’s market factor (from Worksheet 7–1): _____________________
4. Multiply line 2 by line 3: __________________________________________
Enter the amount from line 4 on line F of Worksheet 7–12.
Calculating Your Marketing Communications Budget 105

Worksheet 7–8
Premium or discounted pricing
This worksheet enables you to calculate your budget based on the type of
pricing (premium or discounted pricing) you use.
1. Ranking of your price versus competition
Low (discount) ________ Average ________ High (premium) ________
2. Choose a multiplication factor based on the price of your product/
service: ________
Price of product/service
Multiplication Factor
Low or discounted
1.00
Average price
.80
High or premium
1.30
3. Participant’s market factor (from Worksheet 7–1): _____________________
4. Multiply line 2 by line 3: __________________________________________
Enter the amount from line 4 on line G of Worksheet 7–12.
Worksheet 7–9
Relative quality
Use this worksheet to calculate your marketing communications budget based
on the relative quality of your product or service.
1. Relative quality versus competition
Lower ________ Average ________ Higher ________
2. Choose a multiplication factor based on your ranking in the chart below: ____
Quality ranking
Multiplication Factor
Lower quality
.85
Average quality
1.00
Higher quality
1.35
3. Participant’s market factor (from Worksheet 7–1): _____________________
4. Multiply line 2 by line 3: __________________________________________
Enter the amount from line 4 on line H of Worksheet 7–12.
106
The Marketing Plan

Worksheet 7–10
Depth of line
Use this worksheet to calculate the marketing communications budget based
on the depth of line of your product or service.
1. Depth of line versus competition
Narrow ________ Equal ________ Broader ________
2. Choose your multiplication factor from the chart below: _______________
Depth of line
Multiplication Factor
Narrower
.90
Equal
1.00
Broader
1.30
3. Participant’s market factor (from Worksheet 7–1): _____________________
4. Multiply line 2 by line 3: __________________________________________
Enter the amount from line 4 on line I of Worksheet 7–12.
Worksheet 7–11
Standard versus custom product/service
This worksheet enables you to calculate the impact of having a standard or a
custom product or service.
1. Is your product/service standard or custom: _________________________
2. Choose the appropriate multiplication factor from the chart below: ______
Type of product/service
Multiplication Factor
Standard
1.10
Custom
.80
3. Participant’s market factor (from Worksheet 7–1): _____________________
4. Multiply line 2 by line 3: __________________________________________
Enter the amount from line 4 on line J of Worksheet 7–12.
Calculating Your Marketing Communications Budget 107

Worksheet 7–12 below should be all filled in now that you
have reached the end of the chapter (unless you decided that a
particular variable was not relevant to your particular product
or service and so left that row blank). You should be easily able
to add all the budgets and find the average.
Worksheet 7–12
Recap
1. Fill in amounts from the earlier worksheets:
A. Market share
$ ______________
B. New product/service
$ ______________
C. Market growth
$ ______________
D. Capacity utilization
$ ______________
E. Amount of sales transaction
$ ______________
F. Importance to customer
$ ______________
G. Premium or discounted
$ ______________
H. Relative quality
$ ______________
I. Depth of line
$ ______________
J. Standard or custom
$ ______________
2. Total
$ ______________
3. Divide your total in line 2 by the number of worksheets you used ( ______ )
to find the recommended advertising budget: $ ______________
Sales promotion should be about the same amount, and your public relations
budget about a third of your advertising budget.
The amount on line 3 of Worksheet 7–12 is the recom-
mended advertising budget, although you should compare
this amount with the reach and frequency worksheet in Chap-
ter 9, The Advertising Plan.
Source for the worksheets, with some adjustments, is PIMS
and Cahners Publishing.
108
The Marketing Plan

109
To be effective in marketing, you need to be competitive with
your product or service, promotion, distribution, customer
service, technology—just about anything you can think of.
Even mighty Microsoft is failing with their mobile phone soft-
ware, which is considered by many to have a boring interface
and sluggish response time. In this chapter we offer a series of
worksheets that will allow you to compare your company to the
competition along many parameters. You are asked to score
yourself on a scale of 1 to 10 in each of the worksheets below
against your three major competitors.
You will not have “hard data” to make many of these as-
sessments, but the better you know your industry and your
competition, the more useful this competitive analysis will be.
Some of the data can be obtained through research on your
part (see Chapter 17, The Research Plan), and for some, you
will just “wing it.” Give it your best shot.
Where you find yourself weak, you need a plan to make
yourself stronger. Where you excel, if it is considered a vital fac-
tor in the buying decision, these factors should be your basic
thrust in your promotions.

You can make photocopies of these worksheets, or print
them out from your downloaded Worksheets folder.
Worksheet 8–1
Product/service
SBU
#1 Comp.
#2 Comp.
#3 Comp.
Quality
___
___
___
___
Differentiation
___
___
___
___
Depth of line
___
___
___
___
Packaging
___
___
___
___
Relative price
___
___
___
___
Preference level
___
___
___
___
Trial rate
___
___
___
___
Repurchase rate
___
___
___
___
Compatibility
___
___
___
___
Ease of use
___
___
___
___
Quality is usually considered a vital factor, and is the reason
for the success of Marriott Hotels, Coach, and Apple. Differenti-
ation is also critical, otherwise why would customers buy your
product or use your service instead of the competition’s, unless
you are relying on discounted pricing. Depth of line, which is the
number of products or services you offer, is also important for
maximum profit, and is a big part of the strategy of Coca-Cola
and McDonald’s. If you don’t know your trial rate and your re-
purchase rate, you should be able to get that information from a
benchmark research study or perhaps from other departments
in your organization. It’s important information to have, and will
come up again in Chapter 13, The Sales Plan: Future Sales.
Worksheet 8–2 asks you to rate yourself on manufacturing.
Although manufacturing is not part of marketing, you
need the right resources on which to build a marketing plan
for a product. Value added, which is a vertical or horizontal
110
The Marketing Plan

integration strategy such as Cisco’s expansion into other mar-
kets, and pushing the experience curve (as Japanese industries
are so well known for doing) can lower your cost of goods and
leave more for marketing.
Worksheet 8–3 asks you to look at how well you stack up
against your competition in terms of promotion.
Worksheet 8–3
Promotion
SBU
#1 Comp.
#2 Comp.
#3 Comp.
Advertising expenditures
___
___
___
___
Sales promotion expenditures
___
___
___
___
Sales support expenditures
___
___
___
___
Public relations expenditures
___
___
___
___
Creativity
___
___
___
___
Brand/company
awareness level
___
___
___
___
Brand/company
“would consider” level
___
___
___
___
Competitive Analysis 111
Worksheet 8–2
Manufacturing
SBU
#1 Comp.
#2 Comp.
#3 Comp.
Value added
___
___
___
___
Manufacturing costs
___
___
___
___
Productivity
___
___
___
___
Capacity utilization
___
___
___
___
Labor costs
___
___
___
___
Raw material availability
___
___
___
___
Product/process protection
___
___
___
___
Pushing experience curve
___
___
___
___
CAD/CAM
___
___
___
___

Brand/company “intend
to buy” level
___
___
___
___
The previous chapter on your marketing communication
budget provides you with charts to help you calculate your
budget for advertising, sales promotion, and public relations.
You have the reach and frequency calculation spreadsheet for
advertising in the chapter on advertising (Chapter 9); the one
for trade shows, etc., is in the chapter on sales promotion
(Chapter 10). The research chapter (Chapter 17) will tell you
how to use a benchmark study to obtain your awareness level,
your “would consider” and “intend to buy” levels, among your
target audience, as well as how to measure the creativity of your
advertisements. Again, a benchmark study will answer these
questions for you.
You don’t have to outspend competition to win, just more
effective marketing. However, if one or more of your competi-
tors are outspending you and have a powerful creative depart-
ment, you should stop everything and determine how you are
going to fight back. Do you alter the product or service for
greater appeal and/or obtain a more effective creative depart-
ment?
Worksheet 8–4 will help you determine your competitive
score in terms of retailing.
Worksheet 8–4
Retailing
SBU
#1 Comp.
#2 Comp.
#3 Comp.
Merchandising
___
___
___
___
Location of outlets
___
___
___
___
Appearance of outlets
___
___
___
___
Warmth of employees
___
___
___
___
Markups
___
___
___
___
112
The Marketing Plan

Markdowns
___
___
___
___
Inventory turnover
___
___
___
___
Available capital
___
___
___
___
Convenience of shopping
___
___
___
___
Training of employees
___
___
___
___
If you are into retailing, you should take a trip to see
Bloomingdale’s in New York City. That is really a fun place to
shop. You should also take a tour of Wal-Mart’s home office or
read about them because they understand the whole world of
retailing better than any other company. In the past, their only
weak spot was employee relations, but now they are providing
more benefits to their employees.
Worksheet 8–5
Distribution/customer service
BSU
#1 Comp.
#2 Comp.
#3 Comp.
Extent of served market
coverage
___
___
___
___
Shelf space or dealer inventory
___
___
___
___
Distribution costs
___
___
___
___
Quality/expertise of
trade channels
___
___
___
___
Inventory costs
___
___
___
___
Technical service
___
___
___
___
Technology
___
___
___
___
Databases
___
___
___
___
Capital
___
___
___
___
Resources
Immediate customer
satisfaction
___
___
___
___
End user satisfaction
___
___
___
___
Computerization
___
___
___
___
Competitive Analysis 113

If your competition has more outlets than you do, their
marketing costs per outlet will be less than yours and their en-
tire cost structure will probably be more favorable. We have
talked about customer service before and will again later, but
remember, keeping a customer only costs about a fifth as
much as acquiring a new one. The CEO who calls all her cus-
tomers to ask how she can improve her service to them has an
extremely high customer retention rate.
Worksheet 8–6 asks you to score yourself against the com-
petition in terms of your sales force. Remember, these work-
sheets are very general, meant to help you home in on what
your company is doing well—and where it is falling short.
Worksheet 8–6
Sales force
SBU
#1 Comp.
#2 Comp.
#3 Comp.
Sales costs
___
___
___
___
Experience of sales personnel
___
___
___
___
Sales per sales call
___
___
___
___
Net margin per sales call
___
___
___
___
Closure rate
___
___
___
___
Time management
___
___
___
___
Salaries/bonuses
___
___
___
___
Sales training
___
___
___
___
Turnover
___
___
___
___
Communications
___
___
___
___
Expertise of sales managers
___
___
___
___
Sales aids
___
___
___
___
One of your most important marketing objectives should
be to have the highest sales closer rate in the market. You can
calculate your own internally and with a little investigation
obtain competitive rates. You should always have a debrief-
114
The Marketing Plan

ing session with the prospect after the presentation. This en-
ables you to find the pluses and minuses of your own team as
well as hear the attributes of your competitors’ sales talk.
Once you know your own closure rate, you want to set a
higher objective for the following year and your strategy
should be some form of sales training.
Worksheet 8–7 asks you to evaluate your company in terms
of research and development. If your company is not investing
in its future, it probably won’t have a very good one.
Worksheet 8–7
Research and development
SBU
#1 Comp.
#2 Comp.
#3 Comp.
R & D (% of sales)
___
___
___
___
New products/services
last 2 years
___
___
___
___
Success of introductions
___
___
___
___
New uses/flankers last 2 years
___
___
___
___
Marketing-driven versus
product-driven
___
___
___
___
New products/services
(last 5 years) as % of sales
___
___
___
___
The key factor here is the number of new products/services
in the last two years. Research indicates that about 70 percent
of markets start to deteriorate within three years. The company
with the highest percent of new items is usually the winner.
After you complete these worksheets, you will know what
you do well against the competition, and where you need to
pick up the pace. You will have the parameters you need for set-
ting up your marketing objectives.
Competitive Analysis 115

This page intentionally left blank
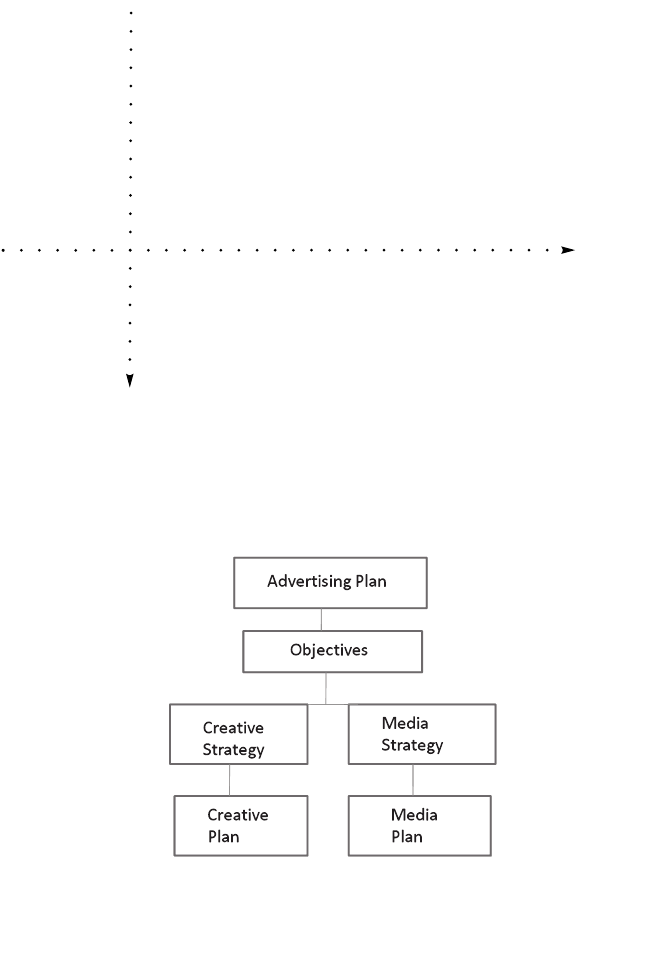
There are four separate aspects to an advertising plan that you
must consider, as shown in Figure 9–1. You normally develop
your two strategies and two plans before you write your objec-
tives. We will discuss objectives at the end of the chapter.
Figure 9–1
Components of an advertising plan.
117

Let’s start with the creative strategy. The creative strategy
does not write the ad, but gives you guidance for developing
the advertising and serves as a research tool to test whether
your communications are on target. The creative strategy is
normally written by the creative people in the advertising de-
partment, but it applies to all your communications to the cus-
tomer. In Chapter 4 we talked about customer analysis, and it’s
vital that the analysis be done before you write your creative
strategy.
The following eight statements express the creative strategy
governing a successful outreach program warning the general
public about the dangers of melanoma:
1. Objective: Encourage people to avoid sunburn.
2. Target: Teen sun worshippers.
3. Buying decision: Teens, moms, manufacturers, health
professionals, clubs, schools.
4. Purpose: Use SPF 15+.
5. Promise teens: Be more attractive to the opposite sex.
Promise moms: It’s safe to stay in the sun longer.
Promise manufacturers: Increased sales.
6. Support: SPF 15+ blocks most harmful rays (ACS, author-
ity).
7. Personality: Healthy, effective, savvy, fun, contemporary.
8. Timing: Pre- and early tanning season (some
continuous).
Notice that there are different selling lines for different tar-
gets—one for the end user (teens), one for the buyer (mom),
and one for the trade. The original selling line for teens was, “It
keeps you alive.” Through research they discovered this did not
turn teens on. Research revealed the clincher was, “Be more at-
tractive to the opposite sex.”
118
The Marketing Plan

A few years ago, I did some consulting work for a privately
held major stock brokerage company. Its promotional ap-
proach appeared to be off target, and when I told the managers
this, they stated that the chairman of the board really liked the
advertising campaign. In fact, he had each ad framed in his of-
fice. The chairman was then called into the meeting to hear the
reasons the promotional activity should be canceled. He
replied that there was a misunderstanding of the objective of
the advertising campaign. He compared it to a United Tech-
nologies campaign. The United Technologies campaign says
nothing about the product or service but addresses various is-
sues that the company believes would be of interest to the
reader. Each time a new ad appears, the company gets thou-
sands of requests for reprints. The basic thrust for one ad that
received over 10,000 requests for reprints made reference to the
common phrase “my girl.” The ad was addressed to males, and
it queried why, when somebody called, males would say, get
back to my girl, or call my girl for this, or have my girl do that.
The copy went on to say, “Doesn’t that girl have a name?
Mary? Sue? Joanne? Then why don’t you refer to her as Mary,
Sue, or Joanne?”
I asked the chairman if he was familiar with the Boeing
campaign featuring the 767s. The chairman replied that yes
indeed, he was familiar with that campaign, and it was an-
other example of what he was trying to do. He referred to this
type of activity as “selling image.” The problem here is that
neither United Technologies or Boeing is selling image. What
they are selling is their stock. And his company had no stock
to sell.
The reason I bring up this story is to illustrate a common
mistake in communications: that image in itself sells some-
thing. If by image you are referring to AFLAC’s duck, then you
are on target. However, if by image you are referring to your
The Advertising Plan 119

120
The Marketing Plan
company or corporation, remember that the only time people
buy companies is when they buy stock. At all other times they
are buying a product or service.
As discussed in Chapter 4, Customer Analysis, you always
want to lead your communications with a benefit and then
support it with the features of your product or service. Figure
9–2 is a reproduction of an ad for Memorial Sloan-Kettering
Cancer Center. It is a very unusual presentation of a letter ad-
dressed to Cancer, “Cancer, You said I’d never bear children.
My daughter says you’re wrong.” That’s a powerful headline.
(Another thing I like about the ad is that they didn’t use a fash-
ion model.)
Figure 9–3 is a reproduction of an ad for Intuit Quick-
Books. It’s not a fancy ad, but I believe it appeals to every small
business owner or manager. With a photo of business papers all
over the floor, the headline reads, “Get your business off the
ground.” Quick and to the point.
Figure 9–4 is a reproduction of an ad for Chubb Insurance.
Most insurance ads I see lead with the features of the policies.
Not this one. As the canoe and man is about to fall off a falls, the
headline reads, “Who insures you doesn’t matter. Until it does.”
I hope you noticed that on all three of the above ads, you
just have to read the headline to get the benefit. Now look at the
ad in Figure 9–5, which is like so many I see. The headline is,
“You say obsessive like it’s a bad thing.” Please tell me what they
are selling here, because I don’t know. If you read the body
copy, they do actually tell you what they are talking about, but
always remember that only 10 percent of the people who read
the headline read the body copy. (This statistic is based on sev-
eral readership research studies conducted through the years.)
When you are able to develop an effective campaign, you
should stick with it. I don’t understand why United Airlines no
longer uses their selling line, “Fly the friendly skies of United”
(text continues on page 124)

The Advertising Plan 121
Figure 9–2
Ad for Memorial Sloan-Kettering Cancer Center.

122
The Marketing Plan
Figure 9–3 Ad for Intuit QuickBooks.

The Advertising Plan 123
Figure 9–4
Ad for Chubb Insurance.

with the beautiful accompanying music, in their advertising. It
used to have the highest awareness level of any campaign. At
least the pilots know better, because they still say, “Thanks for
flying the friendly skies.” The problem probably was that the
124
The Marketing Plan
Figure 9–5
Ad for Ford Taurus.

creative people who developed the campaign thought they
were not doing their job if they didn’t come up with a new
story. Well, I can’t tell you what United is now saying in their
ads. Can you tell me? See how memorable?
In your campaign, each of your ads should say basically the
same thing. A common mistake is for a company to run an ad
on let’s say manufacturing one month and something totally
different the next. How on earth does that happen? Well, the
creative people say, “Hmmm, what haven’t we talked about for
a while? Oh, I know, let’s now run an ad about our sales team.”
That is not the way to obtain maximum awareness.
The advantages of advertising is that it is the best tool for
building awareness; television is an excellent reach medium;
radio a good frequency medium; print a good rifle approach;
outdoor offers the lowest cost per thousand; and the Internet
can probably do all the above. The disadvantages are it takes
a long time to work; it can be costly; and there is a lot of bad
creativity.
You are about to write your creative strategy, so keep in
mind that it:
1. Defines target audience in demographic as well as
psychographic terms.
2. Formulates major benefits or positioning of product or
service, along with copy points.
3. Does not “write” the ad, but provides direction for writing
an effective ad.
4. Must provide sufficient direction to allow evaluation of
ads and ad campaigns in all media.
Following is a worksheet you can use to write your creative
strategy; photocopy this or print out a copy from your folder of
downloaded worksheets.
The Advertising Plan 125

Worksheet 9–1
Creative strategy
1. Objective: _____________________________________________________
______________________________________________________________
2. Target: ________________________________________________________
______________________________________________________________
3. Benefits: ______________________________________________________
______________________________________________________________
4. Features: ______________________________________________________
______________________________________________________________
5. Personality: ____________________________________________________
______________________________________________________________
6. Timing: _______________________________________________________
______________________________________________________________
After you complete your creative strategy, you should give
a copy (hand-delivery is best, but e-mail will do) to everyone
who communicates with the customer.
Media Strategy
In your media strategy, you want to describe how you are going
to reach each individual in the purchase process. You may
need some research to find out how each one obtains their
news or communicates with others. Most individuals use more
than one media, but if you’re going after executives, it may be
newspapers or certain magazines. For mom and dad, it may be
television or radio. For the younger generation, it may be the In-
ternet, cell phones, or TV. Mediabrands, an ad-buying unit of
the Interpublic Group, just introduced a new unit called Geo-
mentum. Geomentum plans to be able to allocate your ad
126
The Marketing Plan

budget among the 40,000 ZIP codes in the United States, some-
times zeroing in on even smaller areas, like a city block.
Outdoor advertising gives you the lowest cost per thousand
(CPM), with the national average being about $1.80 per thou-
sand viewers. You can have thirty-sheet posters or painted bul-
letins, which are even larger. The New Jersey Nets recently
bought a painted bulletin right outside of Madison Square Gar-
den so that Madison Square Garden management could see
the ad right outside of their windows—funny, and effective.
The Knicks are no doubt fuming.
Outdoor advertising can be very effective if used correctly.
Keep your message to between four and six words, in huge type.
Most advertisers do not do this and it is impossible to read their
message as you zoom by in your car. Posters are bought by the
number of showings, with “a 100# showing” meaning that the
gross number of impressions will be equal to the population of
the city or area. That doesn’t mean every person will see one of
your posters because many people, who drive or walk by daily
in certain areas, will see one of your posters several times. But
the takeaway message is that outdoor delivers a very high fre-
quency of viewers.
If your selling line incorporates full-color artwork or pho-
tography, you may want to consider mass circulation maga-
zines, as long as they reach your target audience. Magazines are
losing circulation due to all the activity on the Internet, so you
now can get a good price break on your ad. Most magazines of-
fer regional buys, so you don’t have to be national to partici-
pate. Magazine advertising also enables you to have a Starch
report, which is an inexpensive way to have your ad critiqued.
Starch reports are discussed in Chapter 17, The Research Plan.
If your selling line includes sound, radio could be a good
choice. Radio is a frequency medium, reaching a relatively
The Advertising Plan 127

small group many times. Stations have good research on their
audiences, so if you can match up your target, it could be a go.
Newspapers, like magazines, are losing circulation. I take
three daily papers, the local one plus the Wall Street Journal
and the New York Times. However, there is just one other
house on the block that has a paper delivered. Although young
people are not into newspapers, they still can be an effective
advertising medium if your target is business executives or you
are selling retail. If you’re going to run a newspaper campaign,
you always want to talk to the editorial people first about hav-
ing them give you some free publicity in a news article about
your product or service. Ironically, you will probably get more
feedback from the news article than your ads.
Television is the most effective advertising medium be-
cause it combines sight and sound, but it’s expensive. However,
like newspapers and magazines, rates are coming down due to
all the action on the Internet, including programs, movies, and
advertising. In fact, some of the local stations will shoot your
commercial for you at a very reasonable rate. It won’t compare
with those produced by the commercial production houses,
but if your story is simple, it may work. Don’t overlook ten-sec-
ond ID commercials. You can have them produced by the pros
for a fraction of the cost of a thirty-second spot. A client of
mine in San Diego was a local potato chip manufacturer who
was competing against Granny Goose potato chips. I came up
with the idea of a talking potato chip and had the ID shot in
Hollywood. It kept my client competitive with his national
competition.
You also want to check your advertising “weight.” That
means you will have to look into reach and frequency. Fre-
quency is the number of times you reach the same individual
(and past advertising research states the minimum should be
five; the optimal range is between five and ten). The period of
128
The Marketing Plan

time you have to reach your minimum varies by media. For
outdoor, daily newspapers, radio, television, and the Internet,
it’s a month; for weekly magazines it’s three months; and for
monthly magazines, a year.
Reach is the percent of your target audience that you reach
at least once. When we get into your advertising plan’s objec-
tives, as we will later, you may have an awareness objective of
50 percent of the target audience. If that is true, you would need
a reach figure of approximately 70 percent, because not all of
your target will remember your ad.
The equation for reach and frequency is as follows:
Gross number of impressions = reach × frequency
Divide both sides by reach.
Gross number of impressions = reach × frequency
reach
reach
Reach cancels out on the right-hand side and the equation
becomes
Gross number of impressions = frequency
reach
You will see how this works in the media plan.
Media Plan
Following are two of the four schedules in the reach and fre-
quency case history.
Schedule 1 (the upper half of Figure 9–6) consists of four-
teen insertions in four magazines, delivering a frequency of
4.57 (second to last column on the right) and a reach of only 32
The Advertising Plan 129
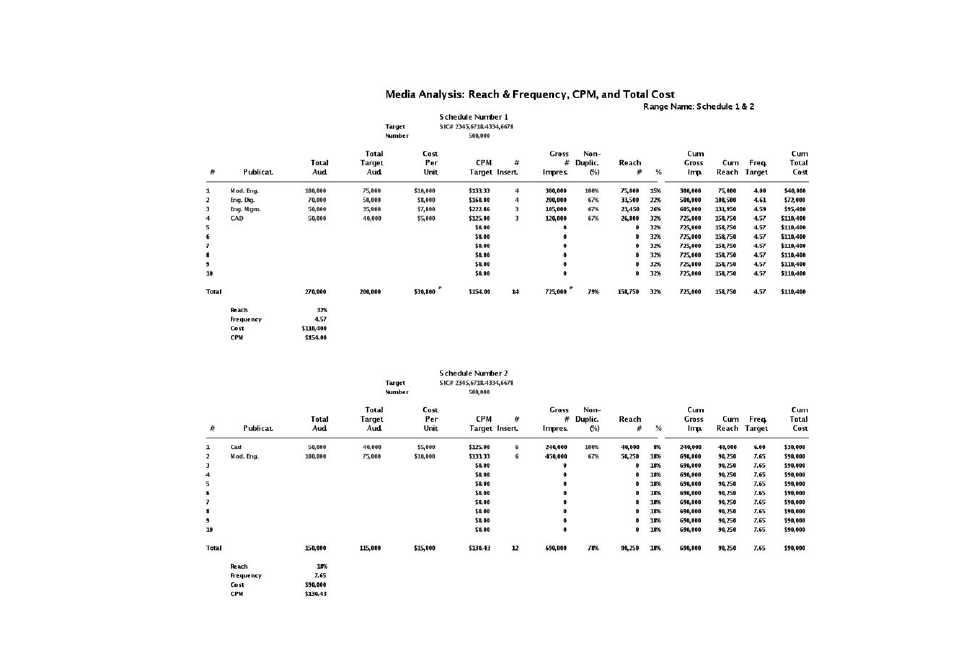
Figure 9–6
Media analysis: Reach and frequency, CPM, and total cost; schedules 1 and 2 (CRF; range name: Schedule1&2).

The Advertising Plan 131
percent (fifth column from the right). The information on how
the number of times you reach the same individual comes from
either the media itself or media research companies. If you are
working with an advertising agency, the agency will supply this
data.
Schedule 1 is clearly a weak schedule, so let’s go to sched-
ule 2. This one consists of twelve insertions in two of the mag-
azines. This increases your frequency to 7.65, but the reach
drops to just 18 percent. Now we will go to schedules 3 and 4,
shown in Figure 9–7, from the same Excel file, to see if we can
do better.
In schedule 3, we have the same magazines as in schedule
1, but the number of insertions has been increased to twenty-
four. This gives us a frequency of 7.56, but only increases the
reach to 32 percent. On schedule 4, we have added two more
magazines and kept the insertions at twenty-four. This gives us
a frequency of 5.30 and the reach increases to 44 percent. This
is not a bad schedule if your objective is a relatively low
awareness goal of say around 30 percent. If your objective is
higher, then you have to increase the number of magazines
you are using or add another type of media.
To give you an idea of how you might do, use your down-
loaded file “RF.xlw,” and fill in the data for a magazine ad dis-
tribution schedule that you might want to try. Only fill in your
data where you see blue lines or zeros. Although only the first
two schedules are shown in Figure 9–8, the electronic file al-
lows four variations, as you saw in Figures 9–6 and 9–7 above.
The above media analysis file can also be used for radio,
TV, and even the Internet. You just insert the number of spots
in place of the number of insertions.
Outdoor advertising has the lowest CPM, only $1.80 to
reach a thousand people. Mass audience magazines, such as
People, command the second lowest at $3.00. Next comes radio
(text continues on page 136)

Figure 9–7
Media analysis: Reach and frequency, CPM, and total cost; schedules 3 and 4 (CRF; range name: Schedule3_&4).
Range Name: Schedule 3 & 4
Schedule Number 3
Target
SIC# 2345,6718.4334,6678
Number
500,000
Total
Cost
Gross
Non-
Reach
Cum
Cum
Total
Target
Per
CPM
#
#
Duplic.
Reach
Gross
Cum,
Freq.
Total
#
Publicat.
Aud.
Aud.
Unit
Target
Insert.
Impres.
(%)
#
%
Imp.
Reach
Target
Cost
1
Mod. Eng.
100,000
75,000
$10,000
$133.33
6
450,000
100%
75,000
15%
450,000
75,000
6.00
$60,000
2
Eng. Dig.
70,000
50,000
$8,000
$160.00
6
300,000
67%
33,500
22%
750,000
108,500
6.91
$108,000
3
Eng. Mgm.
50,000
35,000
$7,800
$222.86
6
210,000
67%
23,450
26%
960,000
131,950
7.28
$154,800
4
CAD
50,000
40,000
$5,000
$125.00
6
240,000
67%
26,800
32%
1,200,000
158,750
7.56
$184,800
5
$0.00
0
0
32%
1,200,000
158,750
7.56
$184,800
6
$0.00
0
0
32%
1,200,000
158,750
7.56
$184,800
7
$0.00
0
0
32%
1,200,000
158,750
7.56
$184,800
8
$0.00
0
0
32%
1,200,000
158,750
7.56
$184,800
9
$0.00
0
0
32%
1,200,000
158,750
7.56
$184,800
10
$0.00
0
0
32%
1,200,000
158,750
7.56
$184,800
Total
270,000
200,000
$30,800
$154.00
24
1,200,000
79%
158,750
32%
1,200,000
158,750
7.56
$184,800
Reach
32%
Frequency
7.56
Cost
$184,800
CPM
$154.00
Openmirrors.comOpenmirrors.com

Range Name: Schedule 3 & 4
Schedule Number 4
Target
SIC# 2345,6718.4334,6678
Number
500,000
Total
Cost
Gross
Non-
Reach
Cum
Cum
Total
Target
Per
CPM
#
#
Duplic.
Reach
Gross
Cum,
Freq.
Total
#
Publicat.
Aud.
Aud.
Unit
Target
Insert.
Impres.
(%)
#
%
Imp.
Reach
Target
Cost
1
Mod. Eng.
100,000
75,000
$10,000
$133.33
4
300,000
100%
75,000
15%
300,000
75,000
4.00
$40,000
2
Eng. Dig.
70,000
50,000
$8,000
$160.00
4
200,000
67%
33,500
22%
500,000
108,500
4.61
$72,000
3
Eng. Mgm.
50,000
35,000
$7,800
$222.86
4
140,000
67%
23,450
26%
640,000
131,950
4.85
$103,200
4
CAD
50,000
40,000
$5,000
$125.00
4
160,000
67%
26,800
32%
800,000
158,750
5.04
$123,200
5
CAM
60,000
38,000
5,500
$144.74
4
152,000
67%
25,460
37%
952,000
184,210
5.17
$145,200
6
Exec. Eng.
150,000
55,000
$10,000
$181.82
4
220,000
67%
36,850
44%
1,172,000
221,060
5.30
$185,200
7
$0.00
0
0
44%
1,172,000
221,060
5.30
$185,200
8
$0.00
0
0
44%
1,172,000
221,060
5.30
$185,200
9
$0.00
0
0
44%
1,172,000
221,060
5.30
$185,200
10
$0.00
0
0
44%
1,172,000
221,060
5.30
$185,200
Total
480,000
293,000
$46,300
$158.02
24
1,172,000
75%
221,060
44%
1,172,000
221,060
5.30
$185,200
Reach
44%
Frequency
5.30
Cost
$185,200
CPM
$158.02
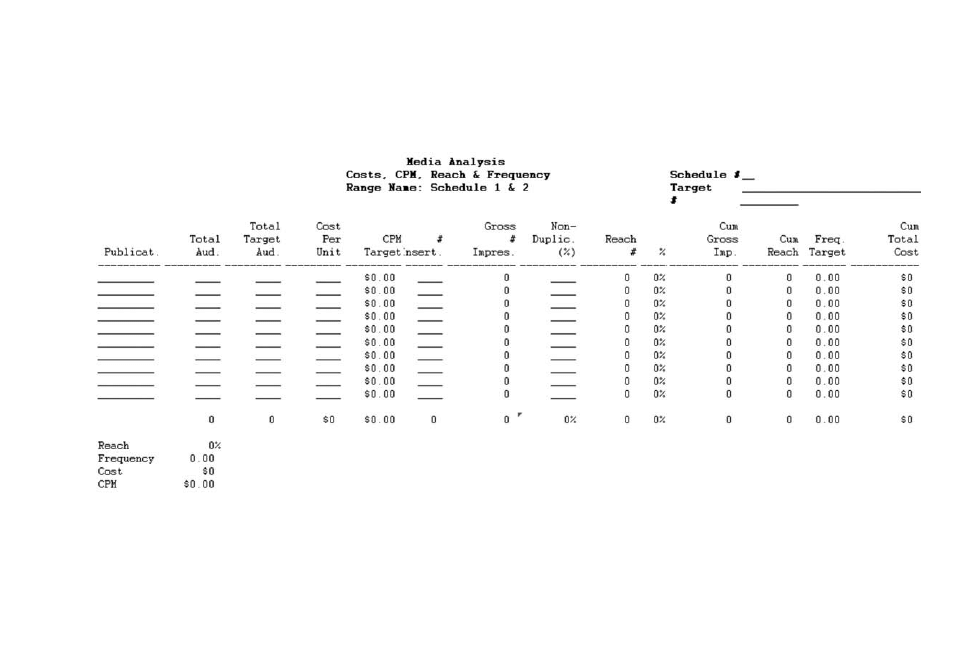
Figure 9–8
Your media analysis: Range and frequency schedules 1 and 2 (RF; range name: Schedule1&2).
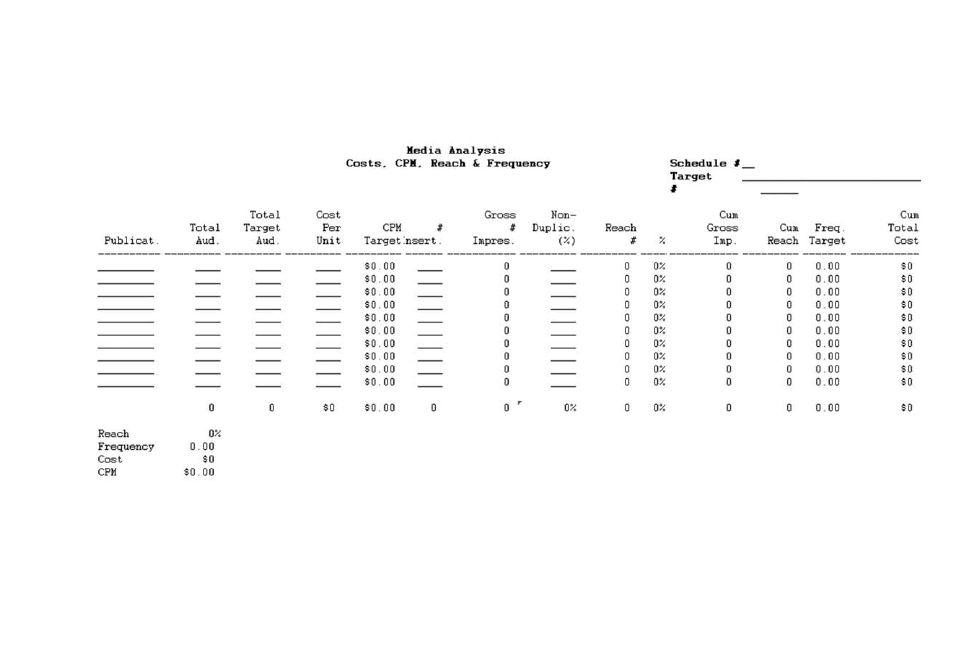

at $3.50 for a thirty-second commercial, followed by television
at $6.00 for an early evening spot. However, TV can be expen-
sive because it takes about fifteen spots per week for four
weeks to obtain a frequency of 4—but the reach is around 80
percent. Newspapers are next most expensive at a CPM of
$9.00, and trade magazines for men top our list at $12.00.
Creative Plan
The creative plan—not the creative strategy—is the actual ad-
vertising itself. Lead with the benefit, supported by the fea-
tures. As I said in an earlier chapter, when it leaves the factory,
it’s called lipstick; when it is bought by the customer, it’s
called hope. In print advertising, the features belong in the
body copy. Don’t use reverse type or it will cut your readership
by up to 80 percent. Try not to be too cute. Sometimes it’s a
problem understanding what the gecko says in the Geico tele-
vision ads.
You want to test your ads or communications at various
junctures, as shown in Figure 9–9, which shows a flow chart of
the creative development process.
It seems clear to me that much advertising is pretty close to
worthless. It’s a wise investment of research dollars to be sure
you are on target.
A management tool you may want to consider for your en-
tire marketing team comes from an article in the Raleigh,
North Carolina, News & Observer about McKinney, an adver-
tising agency in Durham, North Carolina. Management felt it
was important that employees run into one another and chat,
as the average conversation can quickly turn into a creative
epiphany. As a result, the mailroom and mailboxes now lie ad-
jacent to a spacious café where employees gather to get a cup of
coffee, grab a bite to eat, or catch up on the latest quirky news
136
The Marketing Plan
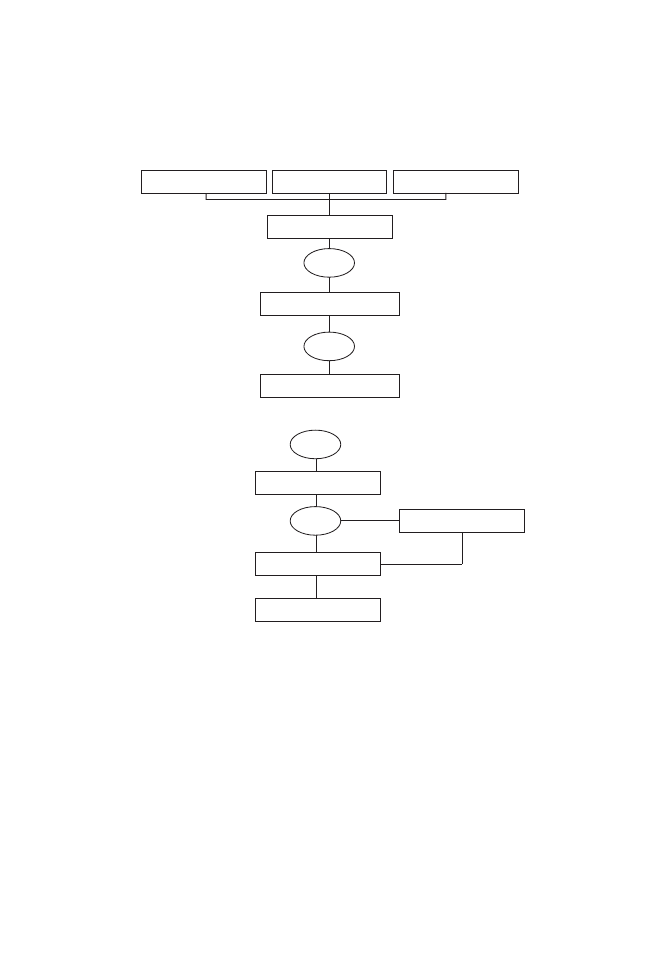
posted on a nearby magnetic board. But the café is not just for
eating. An enormous white onyx table stretches the length of
the room and has hosted everything from Mellow Mushroom
pizza parties to exquisite catered events. Additional seating
nearby and officewide Wi-Fi gives “McKinneyites” a chance to
work wherever they are the most productive. And in many
cases, it’s in between conversations, right by the mailroom.
This approach could make your entire marketing team become
closer and work better together.
The Advertising Plan 137
Figure 9–9
Creative development testing timeline.
Creative Development
Benefits Delivered
Benefits Sought
Alternate Concepts
Test
Alternate Selling Lines
Alternate Executions
Perceptions
Test
Finished Production
Produce Campaign
Back Up Campaign
Media Schedule
Test
Test

Objectives and Strategies
Following is a worksheet for your advertising plan objectives
and strategies. Photocopy this or print out a copy from your
downloaded Worksheets folder. You can write over my termi-
nology, but I inserted those categories to give you an idea what
you should be measuring for.
Worksheet 9–2
Advertising plan: Objectives and strategies
Objectives
1. Awareness: ____________________________________________________
______________________________________________________________
2. Recall: ________________________________________________________
______________________________________________________________
3. Reach and frequency: ___________________________________________
______________________________________________________________
4. ______________________________________________________________
______________________________________________________________
Strategies
1. ______________________________________________________________
______________________________________________________________
2. ______________________________________________________________
______________________________________________________________
3. ______________________________________________________________
______________________________________________________________
4. ______________________________________________________________
______________________________________________________________
Note
1. Alli Soule, “Mailroom, Café Foster Chats,” News & Observer,
July 26, 2009.
138
The Marketing Plan

139
There are many types of sales promotion. Following are the
major ones.
?
Price deals
?
Sweepstakes/contests
?
Coupons
?
Promotions
?
Samples
?
Brochures
?
Premiums
?
Direct mail
?
POP (point of purchase)
?
Trade shows
Let’s take a look at them one by one.
Price Deals
The advantages of price deals are:
1. They can induce customers to try the product or service.
2. They can establish a purchase pattern.
3. They should increase sales.
4. They may neutralize competitive promotions.

The disadvantages of price deals are:
1. They don’t build loyalty.
2. They don’t reverse a declining sales trend.
3. They won’t change “non-acceptance” of a brand.
When you discount your price, make it a surprise; save dis-
counts until your supplier does something special. Don’t use
promotional discounts to sell in, but to sell through and posi-
tion against the right type of customer.
Following is a chart that shows who buys your discounted
merchandise.
Regular Discounted
merchandise
merchandise
Loyal buyers
41%
13%
Buyers loyal to competition
19%
24%
Not loyal to any brand
24%
21%
“Deal” buyers
16%
42%
Notice that 42 percent of the deal merchandise is bought by
deal buyers, who most of the time will leave you as soon as you
pull the promotion. The ideal promotion is one that is designed
to attract the “not loyal to any brand” and “loyal to competi-
tion.” Usually a bigger than average discount will entice these
two groups.
Coupons
Coupons can be an effective promotional tool. I buy all my of-
fice supplies, including electronic gear, from the local Office-
Max, because they mail me $10- and $20-off coupons every
other week. I also buy all my books at Barnes & Noble because
140
The Marketing Plan

they e-mail me similar coupons every few weeks. Try to be
unique for maximum impact. A local car dealer ran a full-page
newspaper ad with a coupon. The value was right out of the
promotional book of Procter & Gamble. The value was 25
cents. The ad said you could now buy a $20,000 automobile for
just 19,999.75. The promotion set sales records at the dealer-
ship. An ad for another car dealer showed all his cars hanging
from a clothesline. Of course they were all white. The ad pro-
claimed it as the August White Sale, with a coupon below. The
event was very successful. (People still notice clever.)
If you can possibly do so, use buy-back coupons. This is
where the customer buys the product or service and then has to
mail back the coupon to obtain her refund. It is a beautiful way
to build your database. You then send out quarterly correspon-
dence to these individuals hawking what you have to sell.
You should also check out electronic coupons. If you are a
participant, as a customer’s merchandise gets scanned during
checkout at a grocery store, if they have purchased a competing
brand, out pops your own coupon. This eliminates the cost of
giving coupons to people who would have purchased your
brand without the coupon. And it induces that customer to give
your version of the same product a whirl. Who knows, she may
become a loyal customer.
Samples
Research indicates that sampling is the best way to achieve
product trial or first-time buying. Procter & Gamble has been
using this approach for years. Recently other types of busi-
nesses have used sampling. Right now you can purchase a
General Motors automobile, drive it for sixty days, and if you
don’t want to keep it, you can return the car and get all your
money back. This strategy was originated by Lee Iacocca at
The Sales Promotion Plan 141

Chrysler years ago and everybody thought he was nuts, but few
people returned the car. Today, many companies send you a
sample of what they are selling for a free trial period, usually for
between thirty and ninety days. In most cases, you can keep the
sample even if you don’t agree to sign up for their program.
Premiums
McDonald’s is the king of premiums. They are constantly of-
fering premiums that the kids love and consequently, it brings
in the whole family. Be sure your premium is desirable to a
member of your target audience and can’t be obtained any-
place else. You may want to offer a self-liquidating premium in
your ads. This is the type you offer at a very low price and where
customers send money and vouchers or proof of purchase to
obtain a premium gift. American Express does this all the time.
Effective premium strategies are not limited to consumer
goods. A manufacturer of heavy earth-moving equipment
mailed out miniature electric trains to prospective customers.
In a series of mailings, the prospects received various train cars
used for hauling, such as a tanker, then a caboose, and finally
the engine. After the completion of the mailing, the manufac-
turer’s sales force had little problem setting up appointments
with the recipients, especially the one-third that kept the com-
plete train set on top of their desk.
Point of Purchase (POP)
A POP display can be a very effective sales tool because it’s lo-
cated right next to the merchandise—but unless it’s unique and
stands out from the competition, it won’t get you much of a
bump. This is the mistake companies are making in grocery
142
The Marketing Plan

stores. Their self-talkers, the little posters attached near the
merchandise, are all the same. When I worked on the Hamm’s
Beer account, we put together a fifteen-foot-tall end-of-aisle
display featuring the Hamm’s bear, who skated around on the
fixture. We offered it to retailers for the weekend if they would
purchase 200 cases of the beer. The demand was so great we
had retailers standing in line for weeks.
If you are selling off shelves in retail stores, you want to take
into account the physical challenges facing elderly shoppers.
Drugstore chain Rite Aid is revising its private-label goods
with bigger package fonts. Family Dollar is adapting new light-
ing and shelf labels. Walgreens plans to install call buttons near
heavy merchandise like bottled water and laundry detergent
and magnifying glasses on store shelves.
Sweepstakes and Contests
In a sweepstakes, you cannot force the participant to purchase
your merchandise. That is because no skill is involved and it is
thus considered a lottery, which is illegal for a for-profit com-
pany. However, you can require a purchase for a contest.
Whether you choose a sweepstakes or a contest, the key ques-
tion is always going to be “Who will participate?” You must
structure your campaign so that your target audience is well
represented among the participants.
As always, try to be unique. In 1995 Mars ran the M&M Color
Campaign and collected millions of dollars in free publicity. Par-
ticipants had the choice of selecting purple, blue, or pink as the
color for the new variety of M&M. The announcement of the
winning color—blue—was carried on most television networks.
The company had the Empire State Building lighted in blue that
night, resulting in wide print media coverage.
The Sales Promotion Plan 143

Promotions
As with all parts of your marketing plan, you want to be unique
for maximum effectiveness. Burger King now has what they re-
fer to as “Whopper Bars.” They are already operative in Ger-
many, Singapore, and Venezuela and will be opening one in
Miami’s South Beach and one in New York’s Times Square. The
stores will be more modern, but the main difference is that beer
will also be on the menu.
Holiday Inn now has live bed warmers for guests. Manage-
ment will send a staff member in a fleece sleeper suit to warm
a guest’s bed before they go to sleep. Bloomingdale’s flagship
store on Lexington Avenue in New York City now has what
they call “Big Window Challenge.” Each brand sponsors a
window display that showcases a room featuring its own sig-
nature look, personality, and lifestyle. The winner was Eddie
Ross, for Elle Décor, who presented “The Modern Woman,” a
room that brings together vintage and modern colors, pat-
terns, and details. An aura of happiness, confidence, and ad-
venture permeates the room among hot pink candlesticks, an
orange art deco painting, and twin turquoise blue lamps.
Brochures
Back in Chapter 1 we told you not to put a picture of the tor-
sion spring manufacturing facility on the cover of your sales
brochure. We repeat that admonition here: When you are
writing a sales brochure, remember that you are not selling
the building that contains your home office; please don’t put
a picture of the building on the cover. As always, you lead with
your benefits to get the reader to open up the brochure. I re-
cently received a brochure from American Express. On the
144
The Marketing Plan

cover were the words, “Skyguide Executive Privilege Club.”
The background was a rather boring series of plane outlines.
On the inside of the brochure was a list of neat benefits. That’s
OK if the person opens it, but this particular cover didn’t give
you a good reason for doing so.
Another common mistake is putting the copy on the inside
of the brochure in reverse (white copy on a dark background.)
Doing this reduces your readership up to 80 percent. People do
not like to read reverse copy. It is too hard on the eyes.
The companies that are doing it right are direct sales re-
tailers with their mail catalogs. Among retailers who rely on di-
rect sales, 62 percent say their biggest revenue generator is a
paper catalog. “There will be some paper version for as long as
I’m in the business,” says Steve Fuller, chief marketing officer
for L.L. Bean.
Direct Mail
The best combination for direct mail is a brochure, letter, and a
postage-paid return postcard. The brochure and the letter
should each tell the whole story, but in a different way. The
postcard should have a couple of boxes to check. They could be
“have a consultant call,” “send me more material,” and “not in-
terested.” Use the word consultant rather than salesperson. In-
clude a “not interested” box because if a postcard with this box
checked is returned, it probably means the participant is in fact
interested in your promotion (otherwise, why would they
bother responding at all?) but that you are doing something
wrong in the presentation.
Try to put a benefit next to the address on the envelope. For
an insurance company, I put a picture of some children on the
envelope with the words, “Protect your kids.”
The Sales Promotion Plan 145

Trade Shows
The software file TRADE.xls can be used to determine the ef-
fectiveness or value of your trade shows, brochures, coupons,
or bingo cards (game cards). Ideally you would like to trace the
specific type of activity relative to the number of sales con-
summated. Some companies can physically track a lead all the
way to the eventual sale. However, many businesses, especially
those marketing industrial products, cannot. They may talk to
a prospect today and the sale will not be consummated for a
year or two. Companies in this situation never really determine
the true value of a particular trade show or brochure. They
could be running trade shows or sending out brochures, using
bingo cards, etc., for years and never know whether it is a losing
proposition or not.
This model is based on the premise that practically all com-
panies can trace their leads at least to the number of sales pre-
sentations that are eventually made. If you can do so, then you
can place a value on each of the leads that you get from each of
the preceding types of marketing communications activities
and use that information to determine whether you should
continue to employ a particular tactic.
Let’s take a look at the case history from CTRADE, shown in
Figure 10–1. The particular event is a trade show and the cost is
$100,000. The number of sales presentations that have been
made by the sales force during the last five years is 100,000, and
the number of sales that have been made during this same pe-
riod is 9,876. All companies have this type of data and based on
these figures, you can determine your “closure rate.” The “clo-
sure rate” is the percent of total sales presentations that are
made that eventually result in a sale. For this particular com-
pany, if they have made 100,000 sales presentations over a pe-
riod of years, and sales were 9,876, it means that the closure
146
The Marketing Plan
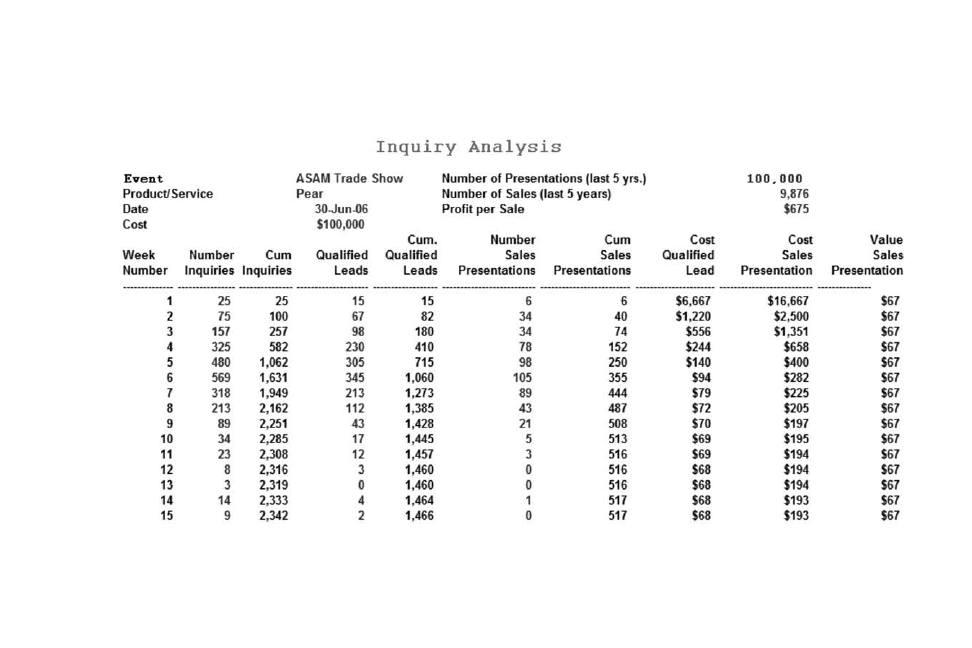
Figure 10–1
Inquiry analysis (CTRADE).

rate is slightly less than 10 percent. The next variable is the
profit per sale. In this particular company, it’s $675.00. If the
profit per sale is $675.00 and the sales force closes on approxi-
mately one out of ten sales presentations, then the value of a
sales presentation is $67.00. This is shown in the column to the
far right in the model.
For this trade show, the number of inquiries received by
the company are shown by week in the second column, with
the third column being a cumulative total. The fourth column
is the number that will qualify. All leads should be qualified
by some means; usually the best way is through telemarket-
ing. That means someone in your company actually calls up
the person who has submitted the lead to determine whether
they are a member of the target audience. The next column is
a cumulative total on the number of qualified leads. Follow-
ing that is the number of sales presentations made. For ex-
ample, the company sent out to the sales team fifteen of the
qualified leads received from week one, and of those fifteen,
the sales force was able to make presentations to six of them.
During the second week, eighty-two qualified leads were sent
out to the field, and the sales force was able to make thirty-four
sales presentations.
The seventh column from the left gives you a cumulative to-
tal of the number of sales presentations followed by the cost per
qualified lead, the cost for each sales presentation, and finally,
the value per sales presentation as previously discussed. You
will note that at the end of week 15, the cost for each of the sales
presentations was $193, while the value of a sales presentation
is only $67. Obviously, it’s not working for this particular com-
pany to participate in this trade show.
The cost of a sales presentation is determined by dividing
the number of sales presentations that are actually made
148
The Marketing Plan

into the cost of the event, which in this particular case was
$100,000. The sales force made 517 sales presentations and
517 divided into 100,000 is $193. The cost of sending the
salesperson out to make the presentation is not included be-
cause the value of the sales presentation is based on the profit
for selling each unit. This profit figure has already taken into
account the costs of marketing.
The way to use this model is to adapt it to your various ac-
tivities such as brochures, bingo cards, and trade shows, and de-
termine which one is giving you the lowest cost on a sales
presentation. Whenever you find an activity where the cost of a
sales presentation is less than the value of a sales presentation,
you’ve got yourself a winner.
Figure 10–2 depicts this particular case history as a graph.
The value of a sales presentation is the horizontal line from the
Y axis at $67. The cost of a qualified lead cuts below the value of
a sales presentation after week 7. However, every qualified lead
does not result in a sales presentation. The curve on the cost for
a sales presentation gets no lower than $193, therefore, for this
particular activity, the cost for each sales presentation is cost-
ing the company $193, and the value of each of these presen-
tations is only $67. Obviously, this is a misuse of funds.
Figure 10–3 shows a copy of the inquiry analysis file from
TRADE.xls where you can insert your own data. You will
The Sales Promotion Plan 149
Figure 10–2
Cost versus value (CTRADE; Chart).

Figure 10–3
Your inquiry analysis (TRADE).
Inquiry Analysis
Event
_______________
# of Sales Presentations (last 5 years)
____
Product/Service
_______________
# of Sales (last 5 years)
____
Date
_______________
Profit per Sale
____
Cost
__________
Cum
Qual.
Cum Qu.
# Sls
Cum Sls
Cost
Cost
Value
Week #
# Inq.
Inq.
Leads
Leads
Pres.
Pres.
Q.L.
S.P.
Sls Pres.
-------
------
-------
------------
---------
-------
--------
-----------
-----------
---------------
1
____
____
____
____
____
____
$0
$0
$0
2
____
0
____
0
____
0
$0
$0
$0
3
____
0
____
0
____
0
$0
$0
$0
4
____
0
____
0
____
0
$0
$0
$0
5
____
0
____
0
____
0
$0
$0
$0
6
____
0
____
0
____
0
$0
$0
$0
7
____
0
____
0
____
0
$0
$0
$0
8
____
0
____
0
____
0
$0
$0
$0
9
____
0
____
0
____
0
$0
$0
$0
10
____
0
____
0
____
0
$0
$0
$0
11
____
0
____
0
____
0
$0
$0
$0
12
____
0
____
0
____
0
$0
$0
$0
13
____
0
____
0
____
0
$0
$0
$0
14
____
0
____
0
____
0
$0
$0
$0
15
____
0
____
0
____
0
$0
$0
$0

probably have to work with someone from accounting/finance
to get meaningful data from a campaign your company has
run. You may not be able to get the information in a usable
form, but going forward, you know what you will need as per
the data shown in the case history.
Objectives and Strategies
Following is a worksheet you can use to write your objectives
and strategies for your entire sales promotion plan, with
some suggested topics. You can substitute your own cate-
gories if these are not useful. Since you will be developing
your objectives and strategies differently for each event, you
will want to make as many photocopies of the worksheet
(or printouts from the Worksheets folder) as you think you
will need.
Be sure to make a list of your goals for each event or type
of sales promotion identifying a specific business purpose
with quantifiable objectives. “Sometimes people get so
caught up in the event itself they forget what they’re seeking
to accomplish there,” says Roger Dow, president and CEO of
the U.S. Travel Association. “If you’re sending people to a
trade show, have them list the top five clients they want to
meet and their objective for each one. When they come
back, ask them what actually happened and how their meet-
ing will benefit the organization.
The Sales Promotion Plan 151
Openmirrors.com

Worksheet 10–1
Sales promotion plan: Objectives and strategies
Objectives
1. # of presentations and closure rate: ________________________________
______________________________________________________________
2. # Merchandise moved: ___________________________________________
______________________________________________________________
3. # of mailings: __________________________________________________
______________________________________________________________
4. # of promotions: ________________________________________________
______________________________________________________________
Strategies
1. ______________________________________________________________
______________________________________________________________
2. ______________________________________________________________
______________________________________________________________
3. ______________________________________________________________
______________________________________________________________
4. ______________________________________________________________
______________________________________________________________
Note
1. Jeffrey Ball, “In Digital Era, Marketers Still Prefer a Paper
Trail,” Wall Street Journal, October 16, 2009; http://online.wsj
.com/article/NA_WSJ_PUB:SB125565110691488935.html.
152
The Marketing Plan

Public relations activity includes the following areas:
?
Product/service publicity
?
Charity
?
Customer perceptions
?
Internal marketing
?
Community relations
Let’s examine each of them briefly.
Product/Service Publicity
A publicity story about a company is worth how many ads? No
one knows for sure, but it has to be more than one. And the price
is right. In addition, the press is constantly looking for material to
fill their pages on time. Approximately one-third of the articles in
print publications originate outside of the press room. Therefore,
someone in your business, preferably with writing skills, should
be constantly looking for a publicity angle that will appeal to the
press. If you are selling an iPhone or Windows 7, it may be rela-
153

tively easy, but Bloomingdale’s managed to obtain a half-page
publicity article in the New York Times on the revamp of their
cosmetic department.
Here’s a story that illustrates how powerful public relations
can be: I was an account executive for an advertising agency
charged with planning the introduction of Fresca into the New
York City market. We were running TV commercials that
showed teenagers shooting pool or doing other activities and
when they started drinking Fresca, it would start to snow. The
more they drank, the harder it would snow and at the end of
the commercial it was a raging blizzard. The tag line was, “The
frosty, freezing taste of Fresca, it’s a blizzard.” We scheduled an
evening press party to commemorate the introduction and
when I looked out my office window about two in the after-
noon, I noticed it was snowing. By the time the press party
started, it was like a blizzard outside.
After the press party was over, we called the New York
Times and said we wanted to reserve space for a full-page back
of section ad in the morning edition. We had to call three times
because they thought we were all drunk, but on the third call
they said they would reserve the space and the ad had to be
there by midnight. If not, we would still have to pay for the
space. We went out in the blizzard and took a picture of our
CEO holding a bottle of Fresca. When New Yorkers shoveled
their way to their morning newspapers and turned to our ad,
they saw the picture of our CEO holding the bottle of Fresca in
the raging blizzard and the headline (and only copy) said, “We
Apologize.”
We received free publicity on this ad in every major news-
paper, from coast to coast. Although there’s no doubt we got
lucky on this one, it goes to show that with a little ingenuity, you
can receive a lot of free advertising.
154
The Marketing Plan

Let’s see how good you are in formatting a news release.
Following are the facts gathered by a reporter. See how you
would organize it into a news story. Study these random facts
and put a check next to the very important pieces of informa-
tion and an X next to those that aren’t very important and could
easily be placed at the bottom of this story. Lastly put a circle
next to those facts that fall between the two extremes.
_____ John Williams was promoted at Johnson College in Aberdeen,
South Dakota, yesterday.
_____ The promotion was announced by college president William
Smathers.
_____ Williams has been on the faculty since 1974.
_____
His new assignment is chairman of the political science depart-
ment.
_____ He was formerly lieutenant governor of South Dakota for one
term.
_____ He has been a professor of political science at the college
since 1976, after starting as an associate professor.
_____ He and his wife, Carolyn, live in Aberdeen.
_____ They have two sons.
_____ At thirty-eight, he is the youngest department head in the
school’s history.
_____ The political science department has a faculty of twenty.
_____ Williams plans to make the department known throughout
the country as a leading center of thought on state and local
government.
_____ He was a state assemblyman for two terms prior to his elec -
tion as lieutenant governor in 1970. He also taught at the Uni-
versity of South Dakota before running for office.
_____ He has a M.A. in political science from Yale University.
_____ He was born in Twin Brooks, South Dakota.
The Public Relations Plan 155

_____ He is the author of Passing through the State House: A
Lieutenant Governor’s Diary and The Care and Feeding of
New Laws.
_____ Johnson College has 650 political science majors.
_____ In making the announcement, Smathers said, “John’s
promotion is an indication of our interest in the study of
state and local government. His experience in local politics
and his books and articles on the subject make him the
ideal person to head our expansion in this area.”
_____ Smathers estimated that the school will have over two
thousand political science majors and at least a tripling of the
number of course offerings in the subject within ten years.
_____ Williams will head a massive recruiting drive for students and
faculty over the next several years.
_____ Williams left active participation in politics in 1974 after he
and ex-Governor Patrick Terming were defeated in their bid
for reelection.
OK. Let’s see how you did. The ensuing news story in the
next day’s local newspaper would be along the following lines:
The appointment of John Williams, former lieutenant gover-
nor of South Dakota, as head of Johnson College’s depart-
ment of political science was announced yesterday by
William Smathers, president of the Aberdeen-based school.
Williams, at 38 the youngest department head in the school’s
51-year history, will spearhead a drive to make Johnson a lead-
ing center for the study of state and local government.
“John’s experience in local politics and his books and arti-
cles on the subject make him the ideal person to head our ex-
pansion in this area,” said Smathers.
He added that Williams plans to concentrate on recruiting
new faculty and students over the next several years.
156
The Marketing Plan

A professor of political science at the school since 1976,
Williams was lieutenant governor of the state from 1971 to
1975.
He and running mate Governor Patrick Terming were nar-
rowly defeated by Grover Kington and Alexander Narovansky
in 1974, and he joined the Johnson faculty as an associate pro-
fessor shortly after leaving office.
In his new assignment, Williams will head a faculty of 20
and oversee the political science course program for a student
body of 6,000.
According to President Smathers, the department’s expan-
sion plans call for a tripling of the number of political science
course offerings and an increase in the number of students
majoring in the subject from 650 to more than 2,000 within
the next 10 years.
A native of Twin Brooks, S.D., Williams is the author of
Passing through the State House: A Lieutenant Governor’s Di-
ary, The Care and Feeding of New Laws, and numerous arti-
cles for academic journals.
He also served two terms as a state assemblyman and was
an assistant professor of political science at the University of
South Dakota before running for office.
He has a M.A. in political science from Yale University.
Williams and his wife, Carolyn, reside in Aberdeen. They
have two sons.
Charity
Participating in charity drives can be an effective promotional
tool for improving customer perception. You see it all the time
with Wal-Mart, McDonald’s, even the NFL with their pink foot-
ball shoes. This strategy works both ways—it helps your com-
pany’s image and it helps the charity.
The Public Relations Plan 157

Take as an example the January 2010 campaign for the Girl
Scouts. As posted by Dale Buss on brandchannel.com, “The
theme of the Girl Scouts most recent campaign is ‘Every Cookie
Has a Mission: To Help Girls Do Great Things.’”
The campaign and accompanying viral YouTube video fo-
cuses on the underappreciated accomplishments—which are
many—of the cookie-sales program. The video, however, es-
chews traditional images of Girl Scouts per se and instead de-
livers its message through compelling copy and graphic icons.
It illustrates how cookie sales help people around the world.
Consumers, in fact, do help society by purchasing cookies
from local Girl Scouts encamped around card tables outside of
supermarkets and at high-school sporting events. As cookie
lovers salivate over the stacked boxes of Tagalongs, Thin Mints,
and Samoas, they can feel good about everything their cookie
purchases help the scouts accomplish.
Girl Scouts USA, the parent organization of the thousands
of local Girl Scout groups around the country, wants Americans
to understand how the cookie proceeds are used to support
worthy causes such as victims of floods, residents of homeless
shelters, and U.S. soldiers overseas. What begins as a box of
cookies sold by a young woman goes to help human beings of
all ages in the most dire of circumstances.
The juxtaposition between the innocent, all-American
Girl Scouts and the ugly reality of human suffering may seem
like a difficult connection to make, but it is there. Big time. The
cookie-focused campaign is also a precursor to an overall re-
branding plan by the Girl Scouts. The rebranding campaign fo-
cuses on how scouting builds confidence and leadership skills
in participating girls. Just as importantly, selling cookies allows
the girls to develop business skills and financial discipline.
And you just wanted a thin mint.
158
The Marketing Plan

Customer Perception
This actually is what public relations is all about. Keep asking
what you could do to improve customer loyalty. Wal-Mart is
creating friends with their stance on medical insurance. A local
plumber answers his phone with the phrase, “How can I make
your day?” He also sends out gift certificates for free ice cream.
And there was the army general, who while talking to his
troops on the front lines, asked if they needed anything. One
soldier said he could really use a Snickers bar. When the gen-
eral got back to his headquarters, he ordered Snickers for
every soldier in the field, and had them delivered to the front
lines. Afterwards, one soldier said, “I would follow that general
anywhere.”
Internal Marketing
Delta used to be my favorite airline. The employees were very
friendly and helpful. They seemed to work together well. So it
did not come as a complete surprise when I heard the employ-
ees of Delta Airlines gave their CEO a present. It was a new Boe-
ing 757. The reason the employees gave was just that he was a
nice guy. They paid the $30 million price tag by having weekly
deductions taken out of their paychecks. Today, I doubt that
they would buy their CEO a cigar.
The question to you is would your employees buy your
CEO a cigar? If not, the work is cut out for you. Do you have an
internal house organ written by the employees? Do you have
goals for each employee and give rewards when they achieve
them? Does management talk to each employee? Do you have
gatherings where a line employee can slap a management em-
ployee on the back and ask, “How ya’ doin’?”
The Public Relations Plan 159

Always remember, effective internal marketing makes ex-
ternal marketing so much easier.
Community Relations
A good community relations program may help you obtain fa-
vorable financing for expansion, gain favorable treatment in
the form of taxes and ordinances, and attract highly qualified
employees. You should give thought to corporate sponsorship
of various activities such as scholarship programs, performing
arts programs, local athletic teams, and environmental pro-
grams.
Two examples of extensive community relations are Kmart
and Sears. Kmart has donated $70 million to charity and Sears
is helping renovate the homes of low-income families. Sears
also saves jobs of employees who serve in the military so when
they finish deployment they return to their jobs.
Objectives and Strategies
Following is your worksheet with some suggested topics. You
can photocopy this page, or print out a copy from your down-
loaded Worksheets folder.
Worksheet 11–1
Public relations plan: Objectives and strategies
Objectives
1. # of releases and total circulation: __________________________________
______________________________________________________________
______________________________________________________________
2. # of internal events: _____________________________________________
______________________________________________________________
160
The Marketing Plan

3. # of charity contact: _____________________________________________
______________________________________________________________
4. Increase in favorable customer perception: __________________________
______________________________________________________________
Strategies
1. ______________________________________________________________
______________________________________________________________
2. ______________________________________________________________
______________________________________________________________
3. ______________________________________________________________
______________________________________________________________
4. ______________________________________________________________
______________________________________________________________
Notes
1. Ariel Kaminer, “The Makeup Floor at Bloomingdale’s Puts On
a New Face,” New York Times, October 25, 2009, page 27; http://
www.nytimes.com/2009/10/25/nyregion/25critic.html?_r=1&scp=
1&sq=The%20Makeup%20Floor%20at%20Bloomingdale%E2%80
%99s%20Puts%20On%20a%20New%20Face&st=Search.
2. http://www.brandchannel.com/home/post/2010/01/29/
Girl-Scouts-USA-Begins-Viral-Leveraging-Of-Iconic-Cookie-Sales
.aspx.
The Public Relations Plan 161

This page intentionally left blank

In determining the price for their product/service, many com-
panies just add up all their costs and arbitrarily add a certain
amount for profit—and that becomes their selling price. The
question is: Is this price giving them the maximum marginal
income?
Apple, Inc. is doing very well right now financially. Of
course, their iPhone is a big winner. But their Mac computer
only has a 7.6 percent market share in the United States as of
the second quarter of 2009, and only 3.36 percent worldwide.
Dell has a 26.3 percent share and Hewlett-Packard has a 26 per-
cent share. I believe many people would agree that the Mac
has better graphics and an operating system superior to that of
PCs, such as Dell and HP, which run Microsoft Windows.
Then why is their market share so low? I believe it is because
they are premium priced. If they dropped their price to match
Dell and HP would their shares double or triple?
Conversely, Australia Chardonnay wine was a good seller
here in the United States until recently. They kept dropping
their price to the point that people began to think it was inferior
and consequently, they started losing sales. These two tales are
163

my way of saying that you may want to do some research to see
if you have an optimum price.
The first two matrixes of the pricing model (CPRICING.xls)
are shown in Figure 12–1. The first matrix establishes fixed
costs. This pricing model case history is based on a proposal
that includes a $10,000,000 plant (shown in Figure 12–5). In this
hypothetical situation, we are depreciating the building over
five years or $2,000,000 per year. Corporate fixed costs are esti-
mated to be somewhere between $300,000 and $500,000, op-
erational fixed costs between $8,200,000 and $9,500,000, and
the cost for our own staff, which includes management and
others who are not directly involved in production, at $3 mil-
lion. This gives a total fixed cost estimated to be somewhere be-
tween $13,500,000 and $15,000,000 per year.
The second matrix on Figure 12–1 concerns the selection of
the selling price. The variables are estimated variable costs (VC
high versus VC low), selling price, and estimated sales at that
price. In our example, the estimated high variable cost is $1,500
and the low variable cost $1,350. In contrast to fixed costs, vari-
able costs vary relative to the number of units. If this company
comes in at its estimated high variable cost of $1,500, that
means that the cost of goods, labor, and other variable costs
would be approximately $1,500 per unit. After the variables are
inserted, the computer will determine the marginal income per
unit as well as the total marginal income for both the high and
low variable costs. What you are looking for here is the price that
will give you the highest total marginal income, whether you
have high or low VC. We see that the highest total marginal in-
come ($15 million and $18 million, respectively) is generated
when our sales price is $2,100.
If the item is priced at $800 per unit, estimated sales are
projected at 120,000 units. However, if the company came in
with its high variable cost, it would lose $700 per unit and if it
164
The Marketing Plan

came in with its low variable cost, it would lose $550 per unit. At
the other extreme we see the high selling price of $2,800. Here
the sales projection is 10,000 units. The marginal income per
unit would be $1,300 if the company comes in with its high
variable cost and $1,450 if they come in with their low variable
cost. However, because the total unit sales are so low (10,000),
this high price still does not give us our highest total marginal
income. Total marginal income is the marginal income per unit
(selling price minus variable cost) times estimated sales.
Figure 12–1
Pricing model: Establishing fixed costs and selection of selling price
(CPRICING; range name: First Half ).
Pricing Model
Establishing Fixed Costs
Fixed
Fixed
Cost
Cost
Item
(low)
(high)
Deprec.
$2,000,000
$2,000,000
Corporate
$300,000
$500,000
Operations
$8,200,000
$9,500,000
Staff
$3,000,000
$3,000,000
Total FC
$13,500,000
$15,000,000
Selection of Selling Price
Marginal
Income
Selling
Est.
Per Unit
Total Marginal Income
Price
Sales
High VC
Low VC
High
Low
Range
(units)
$1,500
$1,350
Var. Cost
Var. Cost
$800
120,000
($700)
($550)
($84,000,000)
($66,000,000)
$900
100,000
($600)
($450)
($60,000,000)
($45,000,000)
$1,000
84,000
($500)
($350)
($42,000,000)
($29,400,000)
$1,300
60,000
($200)
($50)
($12,000,000)
($3,000,000)
$1,500
40,000
$0
$150
$0
$6,000,000
$1,800
34,000
$300
$450
$10,200,000
$15,300,000
$2,100
25,000
$600
$750
$15,000,000
$18,750,000
$2,500
12,000
$1,000
$1,150
$12,000,000
$13,800,000
$2,800
10,000
$1,300
$1,450
$13,000,000
$14,500,000
Range Name: First Half
The Sales Plan: Pricing 165

As we see in Figure 12–1, at a selling price of $2,100, the to-
tal marginal income is estimated to be between $15,000,000
and $18,750,000.
Figure 12–2 (Total Marginal Income) shows a chart from
the Excel file (chart name: MARGINCOM) illustrating the total
marginal income for both the high and low variable costs. No-
tice that each line chart peaks at $2,100. Figure 12–3 (Price/Vol-
ume Relationship) is an XY chart from the Excel file (chart
name: PRICEVOL) depicting the relationship between the var-
ious prices and the estimated volume for each. This line should
always be a relatively smooth curve, with the curve being close
to the horizontal for products or services that are insensitive to
price (for example, Scotch) and more vertical when they are
price sensitive (for example, paper napkins, paper towels, etc.).
Figure 12–2
Total marginal income (CPRICING; chart name: MARGINCOM).
($100,000,000)
($80,000,000)
($60,000,000)
($40,000,000)
($20,000,000)
$0
$20,000,000
$40,000,000
$800 $1,000 $1,500 $2,100 $2,800
Total Marginal Income
Selected Prices
Total Marginal Income
Selected Selling Prices
High Var Cost
Low Var Cost
166
The Marketing Plan

It is clear from the slope of the curve that our hypothetical
product is price sensitive.
The second half of the pricing model (range name: Second
Half ), as shown in Figure 12–4, determines the high and low
marginal income on both a unit and a percentage basis. The
two variables are the high and low sales price. In the previous
section of the model, it was determined that the optimum sales
price should be $2,100. That figure is inserted in the column
marked high in the model. For the low price we have taken the
price immediately below the highest price. The reason for this
is that even if you price a product or service at $2,100, the trade
is going to try and beat you down to get a lower price. After we
have inserted our two variables, the computer model picks up
the low variable cost against a high sales price to give us our
maximum marginal income per unit of $750 or 36 percent. The
Figure 12–3
Price/volume relationship (CPRICING; chart name: PRICEVOL).
0
20000
40000
60000
80000
100000
120000
140000
$0
$500 $1,000 $1,500 $2,000 $2,500 $3,000
Est. Volume
Selected Prices
Price/Volume Relationship
The Sales Plan: Pricing 167

other extreme or least favorable scenario would mean a $1,800
sales price with our high variable cost of $1,500, giving us a
marginal income per unit of only $300, which is a mere 17 per-
cent return.
Now that we have our high and low marginal income, we
can determine our breakeven points, which is the second part
of this figure. The column on the left is our most favorable sce-
nario and the column to the far right is our least favorable sce-
nario. For example, if we come in with our low fixed cost of
Figure 12–4
Pricing model: High/low marginal income, breakeven points,
and net income (CPRICING; range name: Second Half ).
High/Low Marginal Income (Units & Percent)
Item
High
Low
Sales Price
$2,100
$1,800
Var. Cost
$1,350
$1,500
M.I./Unit
$750
$300
M.I. (%)
35.71%
16.67%
Breakeven Points
Low F.C.
High F.C.
Low F.C.
High F.C.
High M.I.
High M.I.
Low M.I.
Low M.I.
$37,800,000
$42,000,000
$81,000,000
$90,000,000
Net Income
Sales Growth
Sales*M.I.
Less Ave.
Net
Year
5%
26%
Fix. Costs
Income
1
$57,525,000
$15,066,071
$14,250,000
$816,071
2
$60,401,250
$15,819,375
$14,250,000
$1,569,375
3
$63,421,313
$16,610,344
$14,250,000
$2,360,344
4
$66,592,378
$17,440,861
$14,250,000
$3,190,861
5
$69,921,997
$18,312,904
$14,250,000
$4,062,904
Pricing Model
Range Name: Second Half
168
The Marketing Plan

$13,500,000 and our high marginal income of $750 per unit or
36 percent, then our breakeven point is only $37,800,000. How-
ever, if we come with our high fixed cost of $15,000,000 and our
low marginal income of only $300 per unit or 17 percent, our
breakeven point skyrockets all the way up to $90,000,000.
The third matrix on Figure 12–4 gives us our net income.
The variables here are annual sales growth rate and first-year
sales. First-year sales can either be the recommended sales
price of $2,100 multiplied by estimated sales of 25,000 units, or,
if you wanted to be conservative, it could be an average of the
high and low selling price times the average for the estimated
sales for each of these particular prices. For example, you
could take the average between $2,100 and $1,800, which
would be $1,950; and the average between the estimated sales
for each price, 34,000 and 25,000, or 29,500. Multiplying $1,950
times 29,500 units would give you the first-year sales of
$57,525,000. To determine the marginal income, the computer
takes the average between the previously calculated high and
low margins (36 percent and 17 percent) or 26 percent. There-
fore, after subtracting the estimated average cost for labor,
cost of goods, etc., marginal income for the first year will be
$15,660,071. From this is subtracted average fixed cost of
$14,250,000, resulting in a net income of $816,071. For years 2
through 5, the computer increases annual sales at the rate of 5
percent, which will provide an annual net income at the end of
year 5 of $4,062,904.
The last part of our hypothetical pricing model, as shown in
Figure 12–5, is discounted cash flow.
Actually, the most important factor or number in this entire
model is a variable that you see underneath the discount factor
in the far right-hand column. What the 17.4 percent means is
that if all the preceding figures are correct, then you will be re-
ceiving a 17.4 percent return on your money after taxes. We’ll
The Sales Plan: Pricing 169

170
The Marketing Plan
return to this figure in a moment. Going over to the left-hand
side of this part of the model, the variable is the tax rate. What
has been inserted is 46 percent. The computer then multiplies
the net income from the preceding part of the model, giving us
a net income after taxes of $440,679 for the first year. Then
adding back in depreciation, you get a total cash flow at the end
of the first year of $2,440,679. The cash outlay or the cost of the
plant ($10,000,000) is shown underneath the initial cost col-
umn. For years 1 through 5, the total cash flow is $16,479,760.
On a discount factor or net present value, this gives you a 17.4
percent return on your money.
The net present value formula goes in the cell that cur-
rently contains $9,053. Then, after you have completed all
parts of the model, you keep varying the percentage figure im-
mediately under the column titled “discount factor” until the
number two rows below becomes the closest to zero. For
example, if you change the discount factor from 17.4 percent
to 17.5 percent, the figure two rows below would be-
come –16,046. If you change the discount factor to 17.3, it
would become 34,251. Therefore, 17.4 percent is the correct
discount factor or return on this company’s money. (We used
this reasoning in calculating discounted cash flow when we
Figure 12–5
Discounted cash flow (CPRICING; range name: DCF).
Range Name: DCF
Discounted Cash Flow
Net Income
Total
Discount
After Tax
Add Back
Initial
Cash
Factor
Year
46.00%
Deprec.
Cost
Flow
17.40%
$10,000,000
($10,000,000)
$9,053
1
$440,679
$2,000,000
$2,440,679
2
$847,463
$2,000,000
$2,847,463
3
$1,274,586
$2,000,000
$3,274,586
4
$1,723,065
$2,000,000
$3,723,065
5
$2,193,968
$2,000,000
$4,193,968

were discussing the product/service plan, back in Chapter 6,
remember?)
Obviously, a 17.4 percent return after taxes is very favor-
able. If management of this hypothetical company were in
agreement with all of the previous figures in this model, then
quite likely the company would go ahead with this proposal be-
cause it gives a very attractive return. If the return was only 5–10
percent after taxes, then most likely it would not be a viable
project. The reason is that it’s possible to buy municipal bonds
at a 10–12 percent return with no taxes and little risk.
Figures 12-6, 12-7, and 12-8 show the two ranges in the
electronic file PRICING.xls, which you can use for your own
Figure 12–6
Your pricing model: Establishing fixed costs and selection of selling
price (PRICING; range name: First Half ).
Pricing Model
Range Name: First Half
Establishing
Fixed Costs
Fixed
Fixed
Cost
Cost
Item
(low)
(high)
Deprec.
____
____
Corporate
____
____
Operations
____
____
Staff
____
____
Total FC
$0
$0
Selection of Selling Price
Selling
Est.
Marginal Income Per Unit Total Marginal Income
Price
Sales
High VC
Low VC
High
Low
Range
(units)
____
____
Var. Cost
Var. Cost
____
____
$0
$0
$0
$0
____
____
$0
$0
$0
$0
____
____
$0
$0
$0
$0
____
____
$0
$0
$0
$0
____
____
$0
$0
$0
$0
____
____
$0
$0
$0
$0
____
____
$0
$0
$0
$0
____
____
$0
$0
$0
$0
____
____
$0
$0
$0
$0
The Sales Plan: Pricing 171

Figure 12–7 Your pricing model: High/low marginal income, breakeven points, and
net income (PRICING; range name: Second Half ).
Pricing Model
High/Low Marginal Income (Unit & Percent)
Item
High
Low
Sales Price
____
____
Var. Cost
____
____
M.I./Unit
$0
$0
M.I. (%)
0.00%
0.00%
Range Name: Second Half
Breakeven Points
Low F.C.
High F.C.
Low F.C.
High F.C.
High M.I.
High M.I.
Low M.I.
Low M.I.
----------
--------------
--------------
--------------
--------------
--------------
$0
$0
$0
$0
Net Income
Sales Growth
Sales*M.I.
Less Ave.
Net
Year
____
0%
Fix. Costs
Income
----------
--------------
--------------
--------------
--------------
--------------
1
____
$0
$0
$0
2
$0
$0
$0
$0
3
$0
$0
$0
$0
4
$0
$0
$0
$0
5
$0
$0
$0
$0
Figure 12–8
Your discounted cash flow (PRICING; range name: DCF).
Discounted Cash Flow
Range Name: DCF
Net Income
Total
Discount
After Tax
Add Back
Initial
Cash
Factor
Year
____
Deprec.
Cost
Flow
_____
----------
--------------
--------------
--------------
--------------
--------------
____
$0
$0
1
$0
$0
$0
2
$0
$0
$0
3
$0
$0
$0
4
$0
$0
$0
5
$0
$0
$0
172
The Marketing Plan

The Sales Plan: Pricing 173
data. Remember, you only fill in the blue areas and zeros. The
black zeros are formulas.
The reason the discounted cash flow factor is so helpful
is that it enables you to compare the rate of return on your
money for various projects or ventures. This particular project
would return 17.4 percent after taxes. This can be compared
with the current return on the stock market, money funds,
bonds, etc., as well as various other projects. In addition to the
rate of return, the other factor to be examined is risk. For ex-
ample, if a company was able to obtain 10 percent return after
taxes on a venture that had a very low risk such as municipal
bonds, this would probably be a better investment than intro-
ducing a new product or service that only promised a 12 per-
cent return. In this particular case, there is only a two-point
spread between something that has very little risk versus a
product or service introduction, which of course always in-
volves considerable risk.
This is the first of two chapters on the Sales Plan. The ob-
jectives and strategies worksheet for this segment will be at the
end of the next chapter.

This page intentionally left blank

175
The computer files discussed in this chapter can be used for the
introduction of a new product or service or an existing business to
help you determine your sales forecasts, market share, and profit
and loss.
In our case history file, CSALES.xls, you will see data relative
to such factors as what percent of the potential buyers will be-
come aware of what is being sold, future coverage area or dis-
tribution goals, sales closure rate, etc. By manipulating this data,
you can see what effect each variable can have on the outcomes:
sales, market share, profit, etc. And you will get a feel for how the
model works.
If you were setting out to design this type of model, you
would insert your objectives of the business at the bottom of the
model and then add all the intangibles that influence these ob-
jectives at the top of the model. You would then add formulas
between the intangibles and the objectives relative to how the
intangibles influence the objectives.
This has already been done for you in this model. It is ready
for you to insert your estimates and see what effect it has on
your objectives. You can ask yourself, “What if sales closure rate

increases x percent? What effect would it have on sales?” To an-
swer this question, you insert the new closure rate and then
scroll down to the objective to see the results. You keep altering
your estimates until you reach the objectives you are seeking.
Then, in your marketing plan (see Worksheet 13–1 at the
end of this chapter), you state how you are going to obtain the
estimate you inserted for each intangible and if your marketing
plan execution is successful, you should obtain the level of ob-
jectives shown in the model.
The amounts or levels you insert for the various intangibles
are estimates on your part. The more research you have on this
subject, the more reliable the model. But even if you don’t have
all this research, inserting a “best estimate” on your part should
give you a better idea of where you are going than just flying by
the seat of your pants.
There are two parts to the model. The case history
(CSALES.xlw) presents a hypothetical situation, with numbers
or values already inserted. You can change any of the estimates
to see what effect it has on the objectives. As with all Excel files,
the numbers in blue are modifiable estimates; the numbers in
black are formulas. The case history shows three years or
thirty-six months of activity, although in your own model you
can insert data for just one or two years if you desire. After you
are through experimenting with the case history, you can bring
up your file, SALES.xlw, and insert your estimates in the cells
with blue lines
This model is divided into six ranges and has ten charts.
The six matrixes are:
1. Trial transactions (range name: Trial)
2. Repeat purchases (range name: Repeat)
3. Unit and dollar volume (range name: Volume)
4. Share of market (range name: Share)
176
The Marketing Plan

5. Profit and loss (range name: Profit)
6. Market pricing and value (range name: Pricing)
The ten charts are:
1. Awareness and distribution
2. Trial
3. New triers and total repeat
4. Costs
5. Unit market share
6. Dollar market share
7. First-year sales and profit
8. Second-year sales and profit
9. Third-year sales and profit
10. Yearly sales and profit
Let’s work our way through these matrixes, starting with
Trial Transactions (see Figure 13–1). This matrix calculates the
number of customers who will try or buy what you are selling
for the first time. It consists of nine factors (A through I) that are
either your estimate or a formula.
Let’s look at each of the variables involved.
A. Total number of potential buyers represents the total size
of the market in which you operate. It would consist of your
customers plus competitors’ customers plus all individuals
or companies that are in the market to buy what you sell
but have not yet bought from either you or your
competitors. This is a variable you do not control, but it is a
variable because the size of a market varies from one mar-
ket to the next. This number can only be an estimate, but
you should acquire as much data as you can to help you in
your estimate because this gives you an idea of the total po-
The Sales Plan: Future Sales 177

178
The Marketing Plan
Figure 13–1
Trial transactions (CSALES; range name: Trial).
Trial Transactions
Range Name: Trial
A. Total Number Potential Buyers (000):
75,000
B. Sales Closure Rate:
28.00%
**************** Aware ***************
******************
Trial ****************
C.
D.
E.
F.
G.
H.
I.
Potential
Newly
Cum
New
Cum Potential
Buyers Aware
Aware Aware
Distribution
Trial
Trial
Buyers
Month
%
(000)
(000)
%
(000)
(000)
Trying
0
0%
0
0
10%
0
0
0
1
3%
2,250
2,250
20%
126
126
0.17%
2
6%
2,250
4,500
25%
158
284
0.38%
3
10%
3,000
7,500
29%
244
527
0.70%
4
13%
2,250
9,750
33%
208
735
0.98%
5
16%
2,250 12,000
36%
227
962
1.28%
6
19%
2,250 14,250
39%
246
1,208
1.61%
7
22%
2,250 16,500
42%
265
1,472
1.96%
8
25%
2,250 18,750
45%
284
1,756
2.34%
9
28%
2,250 21,000
48%
302
2,058
2.74%
10
31%
2,250 23,250
51%
321
2,379
3.17%
11
34%
2,250 25,500
54%
340
2,720
3.63%
12
37%
2,250 27,750
57%
359
3,079
4.10%
13
38%
750 28,500
58%
122
3,200
4.27%
14
39%
750 29,250
59%
124
3,324
4.43%
15
40%
750 30,000
60%
126
3,450
4.60%
16
41%
750 30,750
61%
128
3,578
4.77%
17
42%
750 31,500
62%
130
3,709
4.94%
18
43%
750 32,250
63%
132
3,841
5.12%
19
44%
750 33,000
64%
134
3,975
5.30%
20
45%
750 33,750
65%
137
4,112
5.48%
21
46%
750 34,500
66%
139
4,250
5.67%
22
47%
750 35,250
66%
139
4,389
5.85%
23
48%
750 36,000
66%
139
4,528
6.04%
24
49%
750 36,750
66%
139
4,666
6.22%
25
50%
750 37,500
66%
139
4,805
6.41%
26
51%
750 38,250
66%
139
4,943
6.59%
27
52%
750 39,000
66%
139
5,082
6.78%
28
53%
750 39,750
66%
139
5,221
6.96%
29
54%
750 40,500
66%
139
5,359
7.15%
30
55%
750 41,250
66%
139
5,498
7.33%
31
56%
750 42,000
66%
139
5,636
7.52%
32
57%
750 42,750
66%
139
5,775
7.70%
33
58%
750 43,500
66%
139
5,914
7.88%
34
59%
750 44,250
66%
139
6,052
8.07%
35
60%
750 45,000
66%
139
6,191
8.25%
36
61%
750 45,750
66%
139
6,329
8.44%

tential sales in your market and helps determine your mar-
ket share. It does not represent the dollars; rather, it is the
number of potential purchasers.
B. Sales closure rate represents your estimate of what per-
cent of the potential buyers who become aware of you
will try your service or buy what you have to sell for the
first time. Put down the best estimate you can make and
then check your number as you roll out your marketing
plan.
C. Potential buyers aware represents your estimate of what
percent of the potential buyers will become aware of your
business each month after you start executing your mar-
keting plan through the use of sales teams, advertising,
sales promotion, public relations, etc.
D. Newly aware is a formula that gives you the number of in-
dividuals or companies that become aware of you each
month. It is based on C. Potential buyers aware times
A. Total number of potential buyers.
E. Cumulative aware is a formula and is the cumulative to-
tal of D. Newly aware.
F. Distribution is your estimate of what percent of the total
potential buyers can conveniently buy from you if they so
desire. If you have sales people who cover 60 percent of
the territory, then you have 60 percent distribution. If
you have three stores and 80 percent of the potential
buyers can conveniently come to one of your stores, you
have 80 percent distribution. If you sell via the Internet,
then the number of clicks to your site should be added to
your coverage (see Chapter 16, The Internet Plan).
G. New trial or first purchases is a formula consisting of
C. Potential buyers aware times B. Sales closure rate
times F. Distribution.
The Sales Plan: Future Sales 179

H. Cumulative trial is a formula and is the cumulative total
of G. New trial.
I.
Potential buyers trying is a formula of G. New trial
divided by A. Total number of potential buyers.
Figure 13–2 is a chart in the Excel file that illustrates the re-
lationship between awareness and distribution.
After you complete this range in your own matrix (SALES
.xlw; see Figure 13–11), you will have an estimate of the number
of new customers.
Now, let’s move on to repeat purchases.
The matrix shown in Figure 13–3 calculates the number of
customers that will buy your product/service more than once.
It consists of eleven factors (J through T) that are either your es-
timate or a formula. They are:
J.
Average repeat purchase cycle is your estimate of the
amount of time that a customer is out of the market after
180
The Marketing Plan
Figure 13–2
Awareness and distribution (CSALES; chart name: Awareness &
Distribution).

The Sales Plan: Future Sales 181
Figure 13–3
Repeat purchases (CSALES; range name: Repeat).
Repeat Purchases
Range Name: Repeat
J. Avg. Repeat Purchase Cycle (months):
2
K. Percent Triers Repeat Once (%):
40.00%
L. Percent Triers Repeat Twice (%):
60.00%
M. Percent Repeat Continuously (%):
70.00%
N.
O.
P.
Q
R
S
T
U.
New
First Second
Cum
Repeat
Total
Total Repeat
Triers
Repeat Repeat
2nd
Contin. Repeat
Trans % Total
Month
(000)
(000)
(000) Repeat
(000)
(000)
(000)
Trans.
0
0
0
0
0
1
126
0
0
0
126
2
158
0
0
0
0
158
3
244
50
0
0
0
50
294
4
208
63
0
0
0
63
271
5
227
97
30
30
0
128
354
6
246
83
38
68
0
121
367
7
265
91
58
127
21
170
435
8
284
98
50
176
48
196
479
9
302
106
54
231
89
249
551
10
321
113
59
290
123
296
617
11
340
121
64
353
162
346
686
12
359
129
68
421
203
399
759
13
122
136
73
494
247
456
578
14
124
144
77
571
295
516
640
15
126
49
82
653
346
476
602
16
128
50
86
739
400
535
664
17
130
50
29
768
457
537
667
18
132
51
30
798
517
598
730
19
134
52
30
828
538
620
754
20
137
53
31
859
558
642
779
21
139
54
31
890
580
665
803
22
139
55
32
922
601
688
826
23
139
55
32
954
623
711
849
24
139
55
33
987
645
733
872
25
139
55
33
1,020
668
757
895
26
139
55
33
1,053
691
779
918
27
139
55
33
1,087
714
803
941
28
139
55
33
1,120
737
826
965
29
139
55
33
1,153
761
849
988
30
139
55
33
1,186
784
873
1,011
31
139
55
33
1,220
807
896
1,035
32
139
55
33
1,253
830
919
1,058
33
139
55
33
1,286
854
942
1,081
34
139
55
33
1,319
877
966
1,104
35
139
55
33
1,353
900
989
1,128
36
139
55
33
1,386
924
1,012
1,151
Total
6,329
2,421
1,386
15,999 19,806 26,136
76%

they buy from you or a competitor. If you sell haircuts, it
may be thirty days. If you sell computers, it may by two or
three years.
K. Percent triers repeat once is your estimate of the percent
of the buyers who try you or make a first purchase from
you that will repeat the purchase within the time frame
you inserted in J above.
L. Percent triers repeat twice is your estimate of the
percent of buyers who repeated one purchase that you
estimate will repeat a second time within the time frame
you inserted in J above.
M. Percent triers repeat continuously is your estimate of
the percent of buyers who repeated their purchase from
you twice that will continue to be loyal customers.
N. New triers is a formula that picks up the numbers from
G. New trial described above.
O. First repeat is a formula that multiplies K. Percent triers
repeat once by N. New triers and deposits the number in
this column one or more months later based on J.
Average repeat purchase cycle.
P. Second repeat is a formula that multiplies P. Second re-
peat by K. Percent triers repeat once and deposits the
number in this column one or more months later based
on J. Average repeat purchase cycle.
Q. Cumulative second repeat is a formula that is needed to
calculate R. Repeat continuously.
R. Repeat continuously is a formula that multiplies
M. Percent triers repeat continuously by Q. Cumu -
lative second repeat and deposits the number one or
more months later based on J. Average repeat purchase
cycle.
S. Total repeats is a formula that adds columns O. First re-
peat, P. Second repeat, and R. Repeat continuously.
182
The Marketing Plan
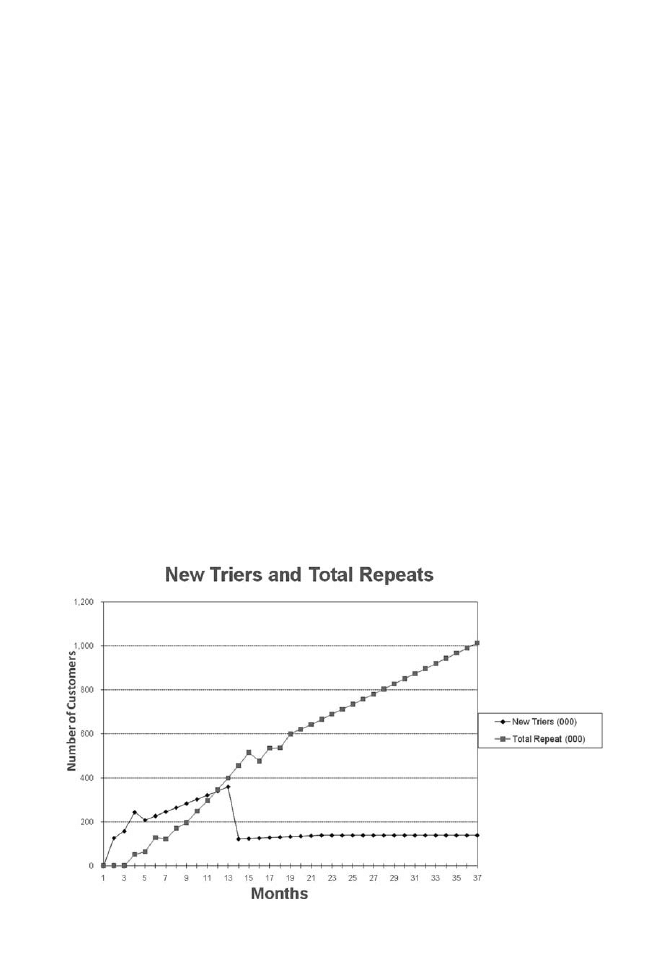
T. Total transactions is a formula that adds N. New triers
and S. Total repeats.
U. Repeat % total transactions is a formula that divides
S. Total repeats by T. Total transactions.
Figure 13–4 is a graph representing New Triers and Total
Repeats.
After you complete range Repeat in your own file,
SALES.xlw, you will have an estimate on the total number of
sales transactions (column T). Range Trial calculates the num-
ber of trial sales transactions and range Repeat picks up the
numbers from range Trial and adds the number of repeats.
The result is total sales transactions.
The next range converts transactions into unit and dollar
volume.
The matrix depicted in Figure 13–5 takes the number of
transactions from range Repeat and multiplies it by the esti-
The Sales Plan: Future Sales 183
Figure 13–4
New Triers and Total Repeats (CSALES; chart name: New Triers & Total
Repeats).
Openmirrors.com

184
The Marketing Plan
Figure 13–5
Unit and dollar volume (CSALES; range name: Volume).
Unit and Dollar Volume
Range Name: Volume
V. Average Number Units Trial Transaction:
1.10
W. Average Number Units Repeat Transaction: 1.30
X Price Per Unit:
0.89
$
Y.
Z
AA
BB
CC
DD
EE
---------
-------
Units -------
------
------
---
Dollars -------
------
Repeat
Trial
Repeat
Total
Trial
Repeat
Total % Total
Month
(000)
(000)
(000)
(000)
(000)
(000) Dollars
0
0
0
0
$0
$0
$0
1
139
0
139
$123
$0
$123
2
173
0
173
$154
$0
$154
3
268
66
333
$238
$58
$297
4
229
82
311
$204
$73
$276
5
249
166
415
$222
$148
$370
6
270
157
428
$241
$140
$380
7
291
221
513
$259
$197
$456
8
312
255
566
$278
$227
$504
9
333
323
656
$296
$288
$584
10
353
385
738
$315
$342
$657
11
374
450
824
$333
$400
$733
12
395
519
914
$352
$462
$814
13
134
593
727
$119
$528
$647
14
136
670
807
$121
$597
$718
15
139
619
758
$123
$551
$674
16
141
696
837
$125
$620
$745
17
143
697
841
$127
$621
$748
18
146
778
923
$130
$692
$822
19
148
806
954
$132
$717
$849
20
150
835
985
$134
$743
$877
21
152
864
1,017
$136
$769
$905
22
152
894
1,046
$136
$795
$931
23
152
924
1,076
$136
$822
$958
24
152
954
1,106
$136
$849
$984
25
152
984
1,136
$136
$875
$1,011
26
152
1,013
1,166
$136
$902
$1,038
27
152
1,044
1,196
$136
$929
$1,064
28
152
1,074
1,226
$136
$956
$1,091
29
152
1,104
1,257
$136
$983
$1,118
30
152
1,134
1,287
$136
$1,010
$1,145
31
152
1,165
1,317
$136
$1,037
$1,172
32
152
1,195
1,347
$136
$1,064
$1,199
33
152
1,225
1,378
$136
$1,090
$1,226
34
152
1,255
1,408
$136
$1,117
$1,253
35
152
1,286
1,438
$136
$1,144
$1,280
36
152
1,316
1,468
$136
$1,171
$1,307
Total
6,962
25,748 32,711 $6,196 $22,916 $29,112
79%

mated average number of products/services or items pur-
chased for each sale to arrive at the unit volume. After the unit
volume is calculated, this number is multiplied by the esti-
mated dollar value per sale to arrive at total dollar volume.
This range consists of ten factors that are either your esti-
mate or a formula (V through EE). They are:
V. Average number units trial transaction is an estimate of
the average number of items a new customer will
purchase at one time.
W. Average number units repeat transaction is an estimate
of the average number of items a repeat customer will
purchase at one time. This may be the same as V. above
or you may believe a repeat customer will purchase more
units because he/she is now more familiar with your
product/service.
X. Price per unit is the selling price per unit or item.
Y. Units trial is a formula that multiplies N. New triers by
V. Average number units trial transaction to arrive at
volume in units for new customers.
Z. Units repeat is a formula that multiplies S. Total repeats
by W. Average number units repeat transaction to
arrive at volume in units for repeat customers.
AA. Total units is a formula that adds Y. Units trial and Z.
Units repeat to arrive at total volume in units.
BB. Dollars trial is a formula that multiplies Y. Units trial by
X. Price per unit to arrive at dollar sales from new
customers.
CC. Dollar repeat is a formula that multiplies Z. Units repeat
by X. Price per unit to arrive at dollar sales from repeat
customers.
DD. Dollars total is a formula that adds BB. Dollars trial and
CC. Dollars repeat to arrive at total dollar sales.
The Sales Plan: Future Sales 185

EE. Repeat percent of total dollars is a formula that divides
CC. Dollars repeat by DD. Total dollars.
After you complete this range in SALES.xlw, you have your
estimate on total unit and dollar volume. Isn’t this a better
way to arrive at your sales goals than just estimating a 5 to 10
percent increase for next year? Once sales goals have been es-
tablished, the next range, range Share (see Figure 13–6), cal-
culates share of market.
Range Share takes the unit and dollar volume estimates
from range Volume and calculates share of market. Share of
market is perhaps only an estimate, but it’s an important factor.
If you are not watching your share, you could be increasing
your sales but a competitor could be increasing their sales
faster and be gaining share on you. That competitor(s) could
then eventually become so big that you could no longer com-
pete with them.
Range Share consists of five factors (FF through JJ) that are
either your estimate or a formula. They are:
FF.
Average market selling price is an estimate of the price
per unit. It could be the same as X. Price per unit unless
you sell to middlemen or the trade. Even so, you want to
use the price to the end user to calculate share.
GG. Total market in units is an estimate of the total market
size in units. This would consist of your sales plus all
competitor sales plus all other potential customers for
the product/service you and your competitors sell.
HH. Total market in dollars is an estimate of the total size of
the market as GG. Total market in units, but now you are
dealing in dollars.
186
The Marketing Plan

The Sales Plan: Future Sales 187
Figure 13–6
Share of market (CSALES; range name: Share).
Share of Market
Range Name: Share
FF. Average Market Selling Price:
1.39
$
GG. Total Market in Units (000):
30,000
HH. Total Market in Dollars (000):
$40,000
II.
JJ.
Unit
Dollar
Share
Share
Month
Market
Market
0
0.00%
0.00%
1
0.46%
0.48%
2
0.58%
0.60%
3
1.11%
1.16%
4
1.04%
1.08%
5
1.38%
1.44%
6
1.43%
1.49%
7
1.71%
1.78%
8
1.89%
1.97%
9
2.19%
2.28%
10
2.46%
2.56%
11
2.75%
2.86%
12
3.05%
3.18%
13
2.42%
2.53%
14
2.69%
2.80%
15
2.53%
2.63%
16
2.79%
2.91%
17
2.80%
2.92%
18
3.08%
3.21%
19
3.18%
3.31%
20
3.28%
3.42%
21
3.39%
3.53%
22
3.49%
3.64%
23
3.59%
3.74%
24
3.69%
3.84%
25
3.79%
3.95%
26
3.89%
4.05%
27
3.99%
4.16%
28
4.09%
4.26%
29
4.19%
4.37%
30
4.29%
4.47%
31
4.39%
4.58%
32
4.49%
4.68%
33
4.59%
4.79%
34
4.69%
4.89%
35
4.79%
5.00%
36
4.89%
5.10%
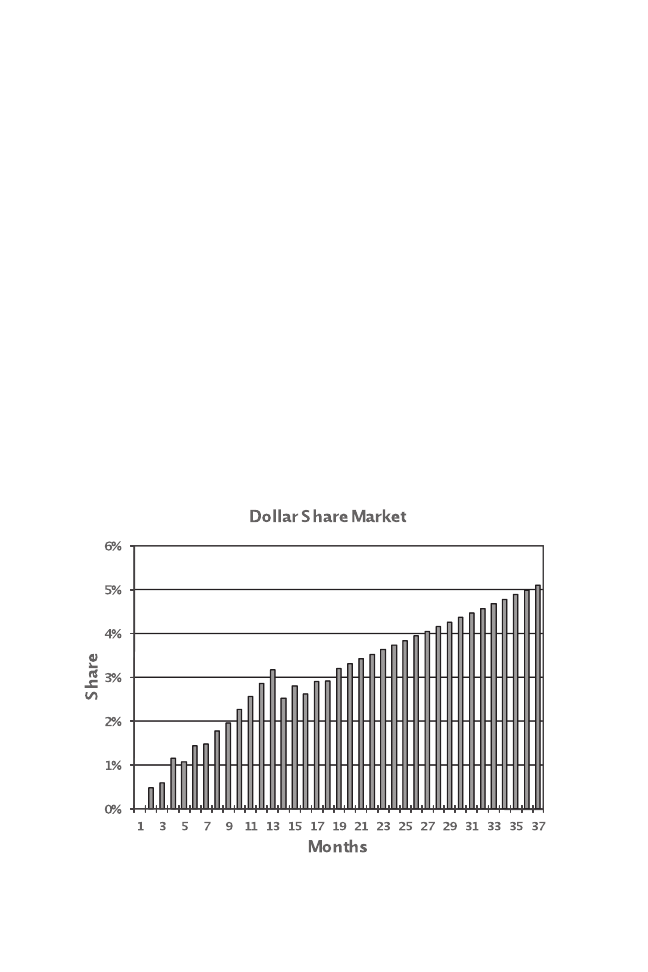
II.
Unit share of market is a formula that calculates unit
market share and is arrived at by dividing AA. Total units
(unit sales) by GG. Total market in units.
JJ.
Dollar share of market is a formula that calculates the
dollar market share and is arrived at by multiplying AA.
Total units times FF. Average selling price and dividing
the total by HH. Total market in Dollars.
Figure 13–7 represents JJ. Dollar share of market as a
graph. Guess this company has been doing something right.
Now that we have the estimated share of market in units and
dollars, we will go on to the next to last range in the model, range
Profit, to calculate a profit and loss statement (see Figure 13-8).
Range Profit uses the dollar sales from DD. Total dollars in
range Volume along with costs to calculate profit and loss.
188
The Marketing Plan
Figure 13–7
Dollar share of market (CSALES; chart name: Dollar Market Share).

This range consists of seven factors (KK through QQ) that
are either estimates or a formula. They are:
KK. Sales is a formula that picks up the sales figures from
DD. Total dollars.
LL. Gross margin is an estimate of what percent of total sales
dollars remain after cost of goods is subtracted.
MM. Marketing reflects estimated marketing costs, which con-
sists of sales, advertising, sales promotion, public
relations, customer service, and market research.
The Sales Plan: Future Sales 189
Figure 13–8
Profit and loss (CSALES; range name: Profit).
Profit and Loss ($000)
Range Name: Profit
KK.
LL.
MM.
NN.
OO.
PP.
QQ.
Gross
Before Tax
First Year:
Sales
Margin
Marketing
Admin.
R&D
Deprec.
Profit
1st Q
$574
33%
$600
$110
$250
$100
($870)
2nd Q
$1,027
33%
$110
$110
$500
$100
($481)
3rd Q
$1,544
33%
$115
$125
$350
$100
($180)
4th Q
$2,204
33%
$100
$125
$200
$100
$202
Total 1st Year
$5,349
$925
$470
$1,300
$400
($1,330)
Second Year:
Sales
Profit
1st Q
$2,039
35%
$300
$125
$75
$100
$114
2nd Q
$2,315
35%
$250
$130
$75
$100
$255
3rd Q
$2,630
35%
$200
$130
$130
$100
$361
4th Q
$2,873
35%
$250
$145
$145
$100
$366
Total 2nd Year
$9,857
$1,000
$530
$425
$400
$1,095
Third Year:
Sales
Profit
1st Q
$3,113
43%
$500
$150
$110
$100
$479
2nd Q
$3,355
43%
$250
$150
$110
$100
$833
3rd Q
$3,598
43%
$200
$155
$75
$100
$1,017
4th Q
$3,840
43%
$300
$155
$75
$100
$1,021
Total 3rd Year
$13,906
$1,250
$610
$370
$400
$3,350
Total 3 Years
$29,112
$3,175
$1,610
$2,095
$1,200
$3,115

NN. Administration reflects estimated operating costs such
as accounting, telephones, rent, office supplies, employer
social security payments, receptionist, taxes, insurance,
etc.
OO. Other costs could represent R&D, depreciation, bad
debts, interest, etc.
PP. Other costs represent a second entry spot for other costs.
(If you need a third column for other costs in your file,
SALES.xlw, you can add it, but be sure to move the
formula in QQ. to its new spot, and incorporate the new
category of other costs.)
QQ. Profit before taxes is a formula that picks up KK. Sales
and multiplies it by LL. Gross Margin and then subtracts
costs such as MM. Marketing, NN. Administration, OO.
Other costs, and PP. Other costs. The result is profit
before taxes.
Figure 13–9 is a bar graph of the expenses over a three-year
period that we saw in Figure 13–8. You can see that some re-
main relatively constant, and others (R&D and marketing) are
quite variable.
The last matrix in the sales module is on pricing. Figure
13–10 shows some prices and perceived values of SBU’s product
and the products of various competitors, as rated by prospective
customers.
If you look at the chart at the bottom of Figure 13–10 you’ll
see that we’ve bisected the field with a diagonal line. You al-
ways want your price to be below the diagonal. In other words,
you want the perceived value of your product or service to be
higher than the actual price. The reason that the Toyota Camry
is such a hot seller is that people think its perceived value is
greater than its actual cost. Imported beer costs more than do-
mestic, but it sells because the buyer believes its taste is far su-
190
The Marketing Plan
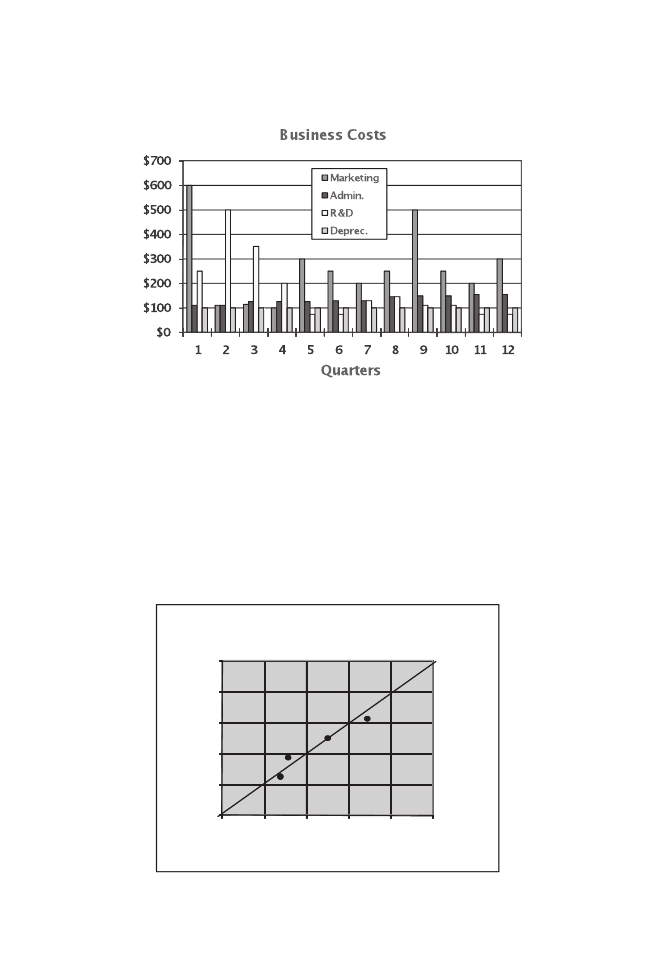
The Sales Plan: Future Sales 191
Figure 13–9
Business costs (CSALES; chart name: Costs).
Figure 13–10
Market pricing and value (CSALES; range name: Pricing).
Market Pricing and Value
Range Name: Pricing
SBU
Perceived Value
Market Price
Company
$475
$450
Comp 1
$400
$400
Comp 2
$325
$350
Comp 3
$310
$300
Comp 4
Comp 5
$200
$280
$360
$440
$520
$600
$200 $280 $360 $440 $520 $600
Market Price Versus Perceived Value
Company
Comp. 1
Comp. 2
Comp. 3
Perceived Value
Price

perior to a domestic beer such as Budweiser. That is the ideal
situation—that your perceived value is greater than your price.
New Products/Services
When you launch a new product or service, there are some im-
portant things to keep in mind at all times. Some of them may
be represented in the software (monitoring of your goals, for
example), but most of them are a function of your own internal
marketing and team-building skills. Note I say “internal.” If you
don’t have everyone aware, on-board, even enthusiastic, your
product launch will suffer. In particular, the goals of the launch
must be known by all—and “all” means employees from all as-
pects of marketing: sales, marketing, customer service (yes,
customer service, as we explain in Chapter 14), even account-
ing and finance.
Figure 13-11 is a facsimile of your first matrix for sales
forecasting. Insert your estimates into the downloaded file
(SALES.xlw; range name: Trial) and then take a look at your re-
sulting objectives such as sales, profit, etc. If you don’t see what
you like, keep inserting different estimates until you get the ob-
jectives you want. Remember, however, you have to be able to
achieve the estimates that you insert.
I believe the sales closure rate is the most important meas-
urement in your sales plan so I am including a checklist of
pointers for increasing your closure rate. You may want to share
this with all your sales presenters.
Remember, sales is a part of marketing.
?
Have a good ten-second opener.
?
Emphasize what the product or service will do for the
customer.
?
Cover all important selling points on every call.
192
The Marketing Plan

The Sales Plan: Future Sales 193
Figure 13–11
Your trial transactions (SALES; range name: Trial).
Trial Transactions
Range Name: Trial
A. Total Number Potential Buyers (000):
____
B. Sales Closure Rate:
____
********************
Aware ***************
****************
***
Trial
************
*
C.
D.
E.
F.
G.
H.
I.
Potential
Newly
Cum
New
Cum
Potential
Buyers Aware
Aware
Aware
Distribution
Trial
Trial
Buyers
Month
%
(000)
(000)
%
(000)
(000)
Trying
0
____
0
0
____
0
0
0
1
____
0
0
____
0
0
0.00%
2
____
0
0
____
0
0
0.00%
3
____
0
0
____
0
0
0.00%
4
____
0
0
____
0
0
0.00%
5
____
0
0
____
0
0
0.00%
6
____
0
0
____
0
0
0.00%
7
____
0
0
____
0
0
0.00%
8
____
0
0
____
0
0
0.00%
9
____
0
0
____
0
0
0.00%
10
____
0
0
____
0
0
0.00%
11
____
0
0
____
0
0
0.00%
12
____
0
0
____
0
0
0.00%
13
____
0
0
____
0
0
0.00%
14
____
0
0
____
0
0
0.00%
15
____
0
0
____
0
0
0.00%
16
____
0
0
____
0
0
0.00%
17
____
0
0
____
0
0
0.00%
18
____
0
0
____
0
0
0.00%
19
____
0
0
____
0
0
0.00%
20
____
0
0
____
0
0
0.00%
21
____
0
0
____
0
0
0.00%
22
____
0
0
____
0
0
0.00%
23
____
0
0
____
0
0
0.00%
24
____
0
0
____
0
0
0.00%
25
____
0
0
____
0
0
0.00%
26
____
0
0
____
0
0
0.00%
27
____
0
0
____
0
0
0.00%
28
____
0
0
____
0
0
0.00%
29
____
0
0
____
0
0
0.00%
30
____
0
0
____
0
0
0.00%
31
____
0
0
____
0
0
0.00%
32
____
0
0
____
0
0
0.00%
33
____
0
0
____
0
0
0.00%
34
____
0
0
____
0
0
0.00%
35
____
0
0
____
0
0
0.00%
36
____
0
0
____
0
0
0.00%

?
Proceed logically from one point to another.
?
Anticipate objections and include answers to them in
your presentation.
?
Use visuals to make a point.
?
Get the customer into the act.
?
Say “you,” not “we.”
?
Check your progress selling each benefit by asking ques-
tions.
?
Arouse curiosity.
?
How you handle your product, visual, or sales tool is as
important as what you say. Be sure to handle them with
respect.
?
Use a sixty-second close.
?
Ask for the order.
When I was a young boy I sold magazines door to door. I
would ask the person who opened the door whether they
would like a copy of Colliers, Companion, or American. I was
not very successful. Then my father, who was in sales training,
changed my opener and told me to bring my dog with me. This
was in Minnesota, where it always snows. My new opener,
while standing on the door step, with snow coming down and
my dog by my side, was, “Would you like an evening’s enjoy-
ment?” (Remember, this was long before Netflix, or even a TV in
every home.) I soon became one of the most successful mag-
azine carriers in the state.
So many companies keep talking about the features of their
product or service. If I were selling computers, I would not just
stand there next to the prospect while she glanced at the various
models. I would have the machines operable and ask the
prospect to bring up Word and type herself a message and go to
the spreadsheet and type in some numbers. You want to get the
194
The Marketing Plan

person directly involved with what you are selling, and then
segue into more technical material.
If you anticipate some objections, like premium pricing,
bring the factor up before your prospect does. For example,
with Apple’s computers, you will have fewer viruses than with
a PC, so you won’t lose your stuff, and better graphics that will
make your presentations the best in the office. If you board
dogs and are premium priced, tell the prospect that his dog will
not miss him as much because he will enjoy being in a bigger
cage and will have the fun of playing with other dogs several
times a day.
When you are at the end of your presentation, you don’t
want the prospect to say I will think about it. Get her into the act.
On your close, always give her a choice of two or more options.
Which model, A or B, do you believe will give you the greatest in-
crease in your office productivity? Or which deductable, $500 or
$1,000, fits in best with your economic projections?
Objectives and Strategies
Following is a worksheet for your sales plan with some suggested
topics. You can photocopy this or print out a copy from your
downloaded Worksheets folder.
Worksheet 13–1
Sales Plan: Objectives and strategies
Objectives
1. Sales call closure rate: ___________________________________________
______________________________________________________________
2. Trial rate: ______________________________________________________
______________________________________________________________
The Sales Plan: Future Sales 195

3. Repeat sales rate: _______________________________________________
______________________________________________________________
4. Distribution rate: _______________________________________________
______________________________________________________________
Strategies
1. ______________________________________________________________
______________________________________________________________
2. ______________________________________________________________
______________________________________________________________
3. ______________________________________________________________
______________________________________________________________
4. ______________________________________________________________
______________________________________________________________
196
The Marketing Plan

Customer service is not a department, it’s an attitude. It has to
be a part of marketing, because these employees must know all
about the products and services, the advertising, public rela-
tions, and sales promotion. That is the only way they can give
intelligent answers to questions by customers. They should
also be aware of the company’s vision, which should translate
into a Disneyland mode of operation for customer service,
whose reps are referred to as “my Disney team” and whose em-
ployees all tout Disneyland as the place “where dreams come
true.” Hard to imagine a more positive attitude than that.
Customer service can be a profit point as well, because re-
search has indicated that keeping a customer only costs one-fifth
as much as acquiring a new one. For example, a clerk at Nord-
strom’s gave a refund to a customer for returning a tire, even
though Nordstrom’s doesn’t sell tires, and an employee at Mid-
west Express lent one of his business suits to a passenger who
had lost his luggage. Do you think these two customers will keep
coming back?
One of the most important things you can do is review all
your customer service policies. Most likely they are written for
197

the benefit of the company. That’s all wrong. They should be
written for the benefit of the customer. What do you think when
an employee says to you, “Sorry, but that is our policy”? Do you
plan on going back to that store or business? Now, what if the
employee said, “Sorry, that is our normal policy, but let’s see if
there is a way to solve your need”? All the difference in the
world. Therefore, you have to talk to management about
changing company policies or at least give customer service
some freedom in their interpretation—all in the service of bet-
ter branding and marketing.
It’s also important to make it easy for the customer to com-
plain or obtain information. How do you feel when you dial a
business and you sit on the phone while the company’s com-
puter goes through about twenty extension possibilities that
don’t interest you? Why don’t you hire a person to answer the
phone on the first ring and say as the local plumber does,
“How can I make your day”?
If your company discourages returns, you may be losing
sales—and perhaps even customers. That’s because when
customers know they can return anything they buy, no ques-
tions asked, they are likely to buy more than shoppers who are
afraid they may get stuck with the merchandise. According to
J. Andrew Petersen and V. Kumar, there is an optimum rate of
return. Higher returns, up to a point, have been shown to re-
sult in higher future sales. But if the rate of returns is too high,
the cost to the company increases. You should analyze the cost
of returns to your company and the effect of the returns on
sales to determine what rate of return gives you the highest
profit. These authors go on to suggest ways a company might
discourage returns if the rate is too high.
You also want to monitor service internally to be sure that
employees treat each other like customers. If an employee is
in a bad mood when a customer approaches, that mood will
198
The Marketing Plan

probably be perceived by the customer. Listen to everyone in
the distribution chain as well. The more you know about what
everyone is thinking, the more efficient customer service
becomes.
Stay in touch after the sale, but not by sending out a ques-
tionnaire for the buyer to fill out. Who has the time? And be-
sides, these satisfaction surveys are relatively meaningless,
because customers don’t necessarily tell the truth—I don’t, do
you?—and the surveys themselves are structured in a way
guaranteed to avoid meaningful information: “on a scale of 1 to
5, how satisfied are you with . . .” Besides, this strategy just ben-
efits the company. Instead, call up your customers and ask
them how you can serve them better. I know a CEO that does
this and usually she has to repeat herself several times because
the listener doesn’t think she means it. She keeps repeating
herself and often the listener finally says, “Nobody has ever
asked me that before.” She has an outstanding repeat business.
Companies are adding “services” to their manufacturing
lines. Many keep their service offerings separate from the rest
of the operation, in order to ensure a sharp focus on the new
and innovative service packages being sold. Truck manufac-
turers, for example, now may offer driver training options, or
logistics management services, or even “greener trucking”
programs. The more successful firms offer a generic service
package, instead of the more usual “parts replacement and
servicing.” For instance, one truck manufacturer offers a main-
tenance and repair package with standardized prices for spare
parts and scheduling for service (no surprises there)—but if a
customer wants to use another company’s replacement part,
the company customizes the plan by dropping the replace-
ment-parts feature.
That truck manufacturer is clearly looking
out for its customers’ interests—and you can bet that client is
there for the long haul.
The Customer Service Plan 199

Objectives and Strategies
The worksheet below offers you the opportunity to develop
your objective and strategies relating to customer service. You
can photocopy this, or print out a copy from the Worksheets
folder you downloaded to your computer. I’ve made sugges-
tions as to the kinds of things you may want to address as ob-
jectives, but you should modify this worksheet to meet the
needs of your company, product, or service.
Worksheet 14–1
Customer service plan: Objectives and strategies
Objectives
1. Answering time: ________________________________________________
______________________________________________________________
2. Policies: _______________________________________________________
______________________________________________________________
3. Personality: ___________________________________________________
______________________________________________________________
4. Company and trade knowledge: __________________________________
______________________________________________________________
Strategies
1. ______________________________________________________________
______________________________________________________________
2. ______________________________________________________________
______________________________________________________________
3. ______________________________________________________________
______________________________________________________________
4. ______________________________________________________________
______________________________________________________________
200
The Marketing Plan

Notes
1. J. Andrew Petersen and V. Kumar, “Get smart about product
returns,” Wall Street Journal, November 30, 2009; http://online.wsj
.com/article/SB10001424052970203585004574392464143500106
.html.
2. Stephen W. Brown, Anders Gustafsson, and Lars Witell, “Be-
yond products,” Wall Street Journal, June 22, 2009; http://online
.wsj.com/article/SB10001424052970204830304574131273123644620
.html.
The Customer Service Plan 201

This page intentionally left blank

The primary purpose of this chapter is to illustrate two com-
mon mis takes in sales development. They are:
1. Selling for volume rather than for profit.
2. Directing equal marketing pressure at all possible
customers rather than concentrating on those with the
highest poten tial.
To illustrate what I mean by this, I have put together four
separate sales plans for the hypothetical Swing Corporation.
The Swing Corporation manufactures and markets an
audio package for the elaborate-packaging market. Three
models are of fered: circuits, tubes, and valves. The sales
plans are for the Northeast region, which represents approx-
imately 10 percent of the corporation’s national market. The
four sales plans are titled:
1. Forecasting by Sales Volume by Customer
2. Forecasting by Net Profit by Customer
Maximizing High-Potential Accounts
203

3. Forecasting by Net Profit by Customer by Product/Service
4. Forecasting by Maximizing High-Potential Accounts
Forecasting by sales volume (Plan 1) is still the most preva-
lent means of determining sales for the following year. How-
ever, the prob lem is that sales volume by itself is meaningless.
What good is it if you sell a million units and lose on each one?
Forecasting by net profit by customer (Plan 2) is superior to
Plan 1, but if you’re selling more than one product or service to
the customer, you don’t know which ones are the winners and
which ones are the losers. Therefore, forecasting by net profit
by customer by product/service (Plan 3) is more effective
than either Plan 1 or Plan 2. As you will see later in this chap-
ter, when Plan 3 was used, it was determined that one of the
three models (valves) was a money loser.
Forecasting by maximizing high-potential accounts (Plan 4)
is based on the premise that you need to spend no more time or
money on obtaining a 30 percent share of a 100-unit potential
customer, which equates to 30 units, than on obtaining a 30 per-
cent share of a 10-unit potential customer, which equates to only
3 units. Consequently, marketing efforts should be concentrated
on those customers with the high est potential. Applying this prin-
ciple to the hypothetical case history, total sales are decreased 8
percent, but net profit increases 273 percent.
Forecasting by Sales Volume by Customer
(Sales Plan 1)
Figure 15–1 illustrates forecasting by sales volume by cus-
tomer. Col umn 1 contains the names of the customers. Column
2 is an estimate of the client’s total purchases, from all suppli-
ers, in the market seg ments in which the company competes.
The third column shows the company’s sales to each of its
204
The Marketing Plan

Maximizing High-Potential Accounts 205
clients. The data from columns 2 and 3 permit you to calculate
your share of market by customer. For example, it is estimated
that AT&T will buy $332,678 worth of elab orate-packaging
products, and Swing Corporation’s share of those total pur-
chases is estimated at $89,007, or 27 percent. The advantage of
estimating your current share of market by client or account is
that it permits you to forecast on the basis of share rather than
sales. As mentioned, you can increase your sales and at the
same time lose share. This situation could become a severe
problem for you in the years ahead.
The fifth column in Figure 15–1 is an estimate of the growth
in total purchases by customer for the next year. This growth
rate can be ap plied to the current year client volume to obtain
estimated client vol ume for the new year. Forecasting should
then be based on your stra tegic choice of share increase, share
maintenance, or share decrease. For example, the current esti-
mated share for AT&T is 27 percent, and Swing wants to in-
crease that share to 30 percent for the next year. Multiplying the
estimated share by estimated client volume would then give
you your sales forecast for the new period. In this case it’s
$119,764.
The next column contains the name of the salesperson as
well as his or her estimate on the number of sales calls that will
be needed for the new year. This information can then be used
to calculate the estimated sales volume by sales call. For ex-
ample, Holston estimates that he will need twenty sales calls
on AT&T for the new year, and the sales forecast is $119,764.
This equates to a sales volume of $5,988 for each of the twenty
sales calls.
At the bottom of Figure 15–1 is a summary of the estimated
sales activity for each of the five salespeople for the new year.
You will notice that, given these data, Summers, if he hits his
forecast, will be the most effective salesperson. His total sales
(text continues on page 208)

Figure 15–1
Forecasting by volume by customer—Plan 1.
Client Name
Current Year
r
a
e
Y
t
n
e
r
r
u
C
+1
Client Vol.
Our Sales
Shar e
Growth Est. Clt. Vol. Est. Share
Sales
Slspers. Nb. of Calls
Sales/Cal l
AT&T $33 2,678
$ 89,00 7
27%
20%
$399, 214
30%
$11 9,764
Hol ston
20
$5,9 88
Amd ah l
$90 6,783
$1 02,33 3
11%
30%
$1, 178, 818
12%
$14 1,458
Hol ston
30
$4,7 15
Appl e $ 1,267 ,490
$3 67,89 0
29% 15%
$1, 457, 614
30%
$43 7,284
Carls on
80
$5,4 66
Bocu zzi
$2 1,234
$ 10,89 0
51%
40%
$29, 728
55%
$1 6,350
Lewi s
10
$1,6 35
Bu sh $89 9,067
$1 12,33 9
12%
5%
$944, 020
15%
$14 1,603
Sum mers
40
$3,5 40
Comm odore $89 0,006
$1 13,33 5 13%
-20% $712, 005
15% $10 6,801
Ab bot t
30
$3,5 60
Eagl e $66 7,889
$1 13,32 4
17%
-30%
$467, 522
20%
$9 3,504
Ab bot t
30
$3,1 17
Farraro $22 3,445
$ 45,66 7
20% 15%
$256, 962
25%
$6 4,240
Sum mers
20
$3,2 12
Gaire $22 0,890
$ 12,44 3
6%
10%
$242, 979
10%
$2 4,298
Lewi s
20
$1,2 15
Graft $6 4,566
$ 43,99 0
68%
40%
$90, 392
70%
$6 3,275
Carls on
20
$3,1 64
Green $ 2,334 ,567
$7 33,32 4
31% 10%
$2, 568, 024
35%
$89 8,808
Ab bot t
50
$17,9 76
Hewlit t $26 7,590
$1 23,34 5
46% 5%
$280, 970
50%
$14 0,485
Carls on
30
$4,6 83
Honeywell
$89 0,000
$2 23,44 5
25%
0%
$890, 000
25%
$22 2,500
Lewi s
40
$5,5 63
IBM
$33 4,689
$1 23,44 5
37%
10%
$368, 158
40%
$14 7,263
Ab bot t
50
$2,9 45
Jo hnson $ 3,890 ,563
$3 89,44 5
10% -10%
$3, 501, 507
15%
$52 5,226
Sum mers
1 00 $5,2 52
Lut her
$ 2,134 ,889
$2 56,77 9
12%
30%
$2, 775, 356
15%
$41 6,303
Hol ston
70
$5,9 47
Orange
$ 1,123 ,567
$2 22,45 6
20%
10%
$1, 235, 924
20%
$24 7,185
Lewi s
20
$12,3 59
Osb orn e $45 3,990
$1 11,33 4
25%
- 1 5 %
$385, 892
25%
$9 6,473
Ab bot t
30
$3,2 16
Pear $89 0,766
$3 32,45 6
37%
30%
$1, 157, 996
40%
$46 3,198
Lewi s
40
$11,5 80
Pet ers $11 1,345
$ 25,55 6
23%
20%
$133, 614
25%
$3 3,404
Lewi s
10
$3,3 40
Pet ers on
$16 8,766
$ 89,00 6
53%
0%
$168, 766
55%
$9 2,821
Sum mers
10
$9,2 82
Reagan $33 4,554
$2 31,22 4
69% 10%
$368, 009
70%
$25 7,607
Hol ston
40
$6,4 40
Robin
$88 9,766
$2 89,00 6
32%
25%
$1, 112, 208
35%
$38 9,273
Carls on
80
$4,8 66
Smi th
$ 1,222 ,334
$3 00,44 3
25%
15%
$1, 405, 684
25%
$35 1,421
Sum mers
70
$5,0 20
Sparro w
$16 2,678
$ 89,00 8
55%
10%
$178, 946
55%
$9 8,420
Carls on
20
$4,9 21
Sperry
$34 5,213
$ 50,89 0
15%
25%
$431, 516
20%
$8 6,303
Hol ston
50
$1,7 26

Current Y ear
Current Year
+
+
1
Client Name
C lient Vol.
Our Sales
Share
Growth Est. Clt. Vol. Est. Share
Sales
Slspers. Nb. of Calls
SaleslCall
Stemp er
$9 98, 767
$ 367 ,88 9 3 7% - 1 0 % $8 98, 890
40 % $3 59, 556
Su mm ers
30 $ 11,9 85
Tayl or $6 67, 778
$ 111 ,89 0
1 7%
1 0%
$7 34, 556
20 %
$1 46, 911
H ols to n
30
$4,8 97
Wan g
$3 47, 294
$ 134 ,89 0 3 9%
2 0% $4 16, 753
40 % $1 66, 701
Abb ott
60 $2,7 78
Washi ngt on $3 24, 554
$ 113 ,44 8 3 5%
2 0% $3 89, 465
40 % $1 55, 786
Lewi s
40 $3,8 95
Web er $1 07, 888
$66 ,55 4
6 2%
-3 0%
$ 75, 522
65 %
$ 49, 089
Carlso n
20
$2,4 54
Tot al
$2 3,4 95, 606
$5, 397 ,05 1
2 3%
7%
$2 5,2 57, 006
26 %
$ 6,5 53, 311
1, 190
$5,5 07
Current Year
1
Salesperson
Abbott
Salesperson
Carlson
Salesperson
Holston
Salesperson
Lewis
Salesperson
Summers
Tot al Sal es
$1, 509 ,55 1
$1, 177 ,82 5
$ 1,1 68, 347
$ 1,16 2,7 21
$ 1,5 34, 868
6
7
6
6
6
s
t
n
e
i
l
C
f
o
r
e
b
m
u
N
8
0
8
,
8
9
8
$
t
n
e
i
l
C
t
s
e
g
r
a
L
$ 437 ,28 4 $4 16, 303 $46 3,1 98 $5 25, 226
Avg. Sls . p er Call per Cl ient
$5 ,59 9
$4 ,25 9
$4, 952
$ 5,6 55
$6, 382
0
7
2
0
8
1
0
4
2
0
5
2
0
5
2
s
l
l
a
C
f
o
.
b
N
l
a
t
o
T

are projected at $1,534,868, and average sales per call are ex-
pected to be $6,382.
However, this type of analysis can be very misleading if
your company sells products/services with different margins.
In these cases, the people who sell the most normally are not
the ones who contribute the largest amount to profit. Why? Be-
cause they are selling the prod ucts/services that are the easiest
to sell—and those usually have the lowest margins. Therefore,
if these companies are rewarding their salespeople on the ba-
sis of volume, most likely they are rewarding the wrong people.
Sales Plan 2 illustrates this fact.
Forecasting by Net Profit by Customer (Plan 2)
Sales Plan 2 is illustrated in three figures: Figure 15–2, which
shows the estimated sales by product category; Figure 15–3,
which calculates the margins by category and gross profit;
and Figure 15–3a, which looks at expenses and profit per
client per sales call.
If you are selling more than one product/service and they of-
fer different margins, then the first step in forecasting net profit is
to break out estimated sales for each. For example, we know
from Sales Plan 1 (Figure 15–1) that total estimated purchases by
AT&T are $119,764. In Figure 15–2, total estimated purchases are
subdivided by model. It is estimated that AT&T will purchase
$25,778 of the circuit model, $6,457 of the tubes model, and
$87,529 of the valves model. Figure 15–2 also shows the percent-
age of client purchases by model type. Twenty-two percent of
AT&T purchases will be for circuits, 5 percent for tubes, and 73
percent for valves. These percentage figures will be used later in
Sales Plan 4 to determine company development.
In Figure 15–3, the first column contains the name of the
client and columns two, three, and four list the gross profit by
208
The Marketing Plan

model. The margins are at the top of the column: circuits have
a 17.07 percent margin; tubes, 10.59 percent; and valves, 4.15
percent. These margins are from the previous year. The fifth
column contains the sum of columns two, three, and four, or
total gross profit.
Moving on to Figure 15–3a, we see that the first three
columns allocate the expenses per client. The first of these ex-
Figure 15–2
Sales by product category—Plan 2.
Client
Estimated Sales
Percentage of Sales
Circuits
Tubes
Valves
Circuits
Tubes
Valves
AT&T
$25,778
$6,457
$87,529
22%
5%
73%
Amdahl
$31,667
$34,665
$75,126
22%
25%
53%
Apple
$122,388
$45,778
$269,118
28%
10%
62%
Bocuzzi
$3,489
$2,377
$10,484
21%
15%
64%
Bush
$54,990
$42,009
$44,604
39%
30%
31%
Commodore
$21,778
$21,990
$63,033
20%
21%
59%
Eagle
$23,556
$10,880
$59,068
25%
12%
63%
Farraro
$10,445
$23,998
$29,797
16%
37%
46%
Gaire
$16,778
$3, 778
$3,742
69%
16%
15%
Graft
$12,889
$10,008
$40,378
20%
16%
64%
Green
$156,897
$245,889
$496,022
17%
27%
55%
Hewlitt
$23,990
$41,990
$74,505
17%
30%
53%
Honeywell
$128,890
$89,990
$3,620
58%
40%
2%
IBM
$12,996
$32,990
$101,277
9%
22%
69%
Johnson
$12 3,776
$213,887
$187,563
24%
41%
36%
Luther
$222,886
$114,667
$78,750
54%
28%
19%
Orange
$45,332
$21,996
$179,857
18%
9%
73%
Osborne
$38,776
$12,885
$44,812
40%
13%
46%
Pear
$135,665
$167,889
$159,644
29%
36%
34%
Peters
$6,775
$2,345
$24,284
20%
7%
73%
Peterson
$12,332
$21,887
$58,602
13%
24%
63%
Reagan
$49,867
$21,665
$186,075
19%
8%
72%
Robin
$56,779
$23,996
$308,498
15%
6%
79%
Smith
$23,997
$35,442
$291,982
7%
10%
83%
Sparrow
$21,886
$34,221
$42,313
22%
35%
43%
Sperry
$21,331
$14,335
$50,637
25%
17%
59%
Stemper
$47,884
$27,885
$283,787
13%
8%
79%
Taylor
$32,997
$41,885
$72,029
22%
29%
49%
Wang
$31,552
$21,998
$113,151
19%
13%
68%
Washington
$21,553
$45,331
$88,902
14%
29%
57%
Weber
$12,332
$6,755
$30,002
25%
14%
61%
Total
$1,552,251
$1,441 ,868
$3,559,192
24%
22%
54%
Maximizing High-Potential Accounts 209
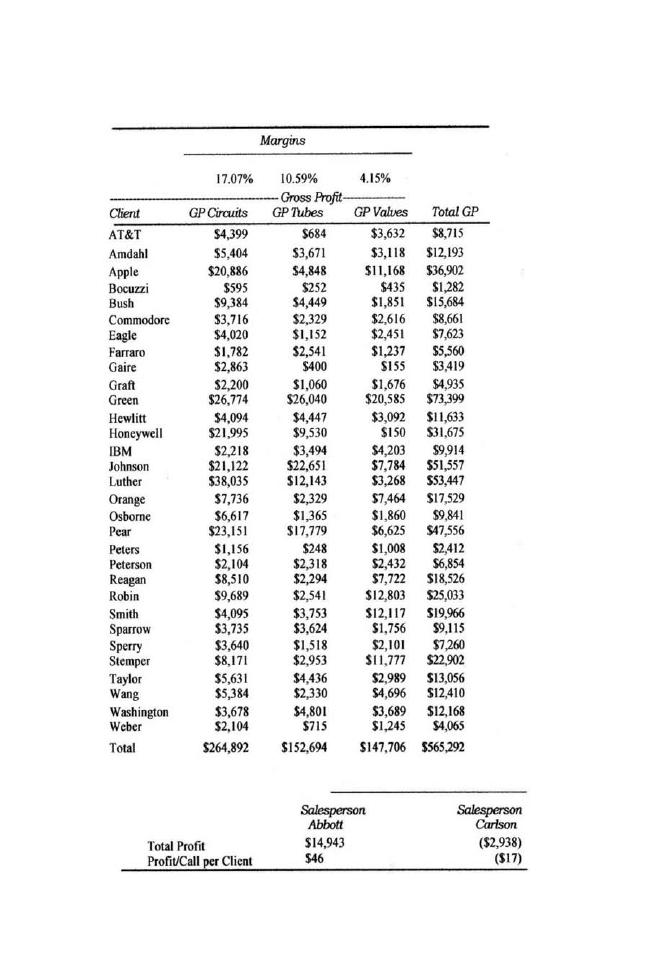
Figure 15–3
Margin and gross profit—Plan 2.
210
The Marketing Plan
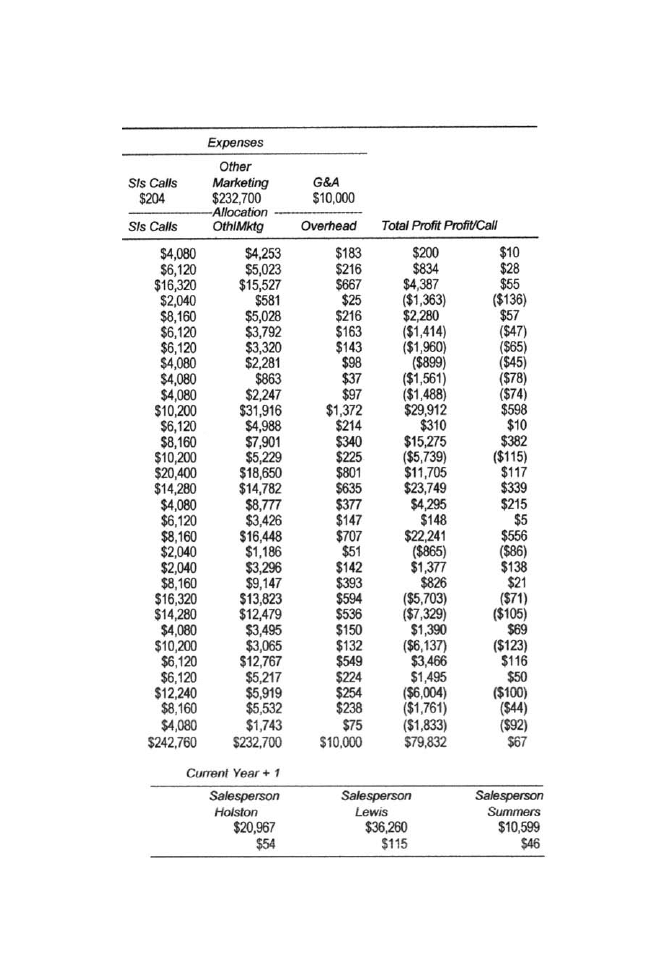
Figure 15–3a
Expenses per client and total profit per sales call—Plan 2.
Maximizing High-Potential Accounts 211

pense columns is for sales calls. Each sales call has been arbi-
trarily budgeted at $204.00. As we saw in Figure 15–1, Holston,
the salesperson for AT&T, estimated that he would need twenty
sales calls for the new year, or $4,080, so this is the amount
listed underneath sales calls for AT&T in the first column.
Other marketing costs and G&A have been allocated on the ba-
sis of last year’s expenditures as a percentage of sales.
AT&T’s estimated total purchases of $119,764 (which also
comes from Figure 15–1) are 1.8 percent of total estimated
sales of $6,553,311. Multiplying 1.8 percent by total other mar-
keting costs of $232,700 gives $4,253. This is the amount that is
listed underneath other marketing for AT&T. The next column
charges G&A; the same method is used for this as for other
marketing costs. Now that expenses have been allocated by
client, they can be subtracted from total gross profit to arrive at
net profit by cus tomer. The net profit shown for AT&T is $200.
When you know the total estimated profit by client or cus-
tomer, you can calculate the estimated profit per sales call. This
is shown in the last column of Figure 15–3a and a summary ap-
pears across the bottom of Figures 15–3 and 15–3a. You will no-
tice that although Summers was projected to be number one in
volume, he is not number one in either total profit or profit per
sales call. Holston and Lewis are projected to deliver a higher
total profit than Summers, with Summers and Abbott tied for
number two in profit per sales call.
You will also notice in Figure 15–3a that several of the
clients are showing a negative for total profit. Once again, if you
analyze only volume, you cannot determine whether or not
you are losing money servicing some customers. (This example
uses clients or companies, but the same is true if your customer
base is divided by markets.) Sales Plan 2 reveals that some
clients are unprofitable, but it does not tell you which prod-
ucts/services sold to each customer or market are the losers.
212
The Marketing Plan

For example, client Eagle, which is the seventh client from the
top, accounts for $7,623 in total gross profit, but shows
a –$1,960 in total profit. Quite possibly, one or more of the
models are profitable. The question is which ones. This ques-
tion is addressed in Sales Plan 3.
Forecasting by Net Profit by Customer by
Product/Service (Plan 3)
Sales Plan 3 is similar to Plan 2 except that in Plan 3 expenses
have been allocated to each individual product. This cost allo-
cation is based on percentage of sales. These calculations are
shown at the top of Figure 15–4.
Sales costs have not been previously allocated by product
cate gories, so the total sales calls budget for the Northeast re-
gion as shown in Figure 15–3a ($242,760) has been allocated to
each product at the same percentage (3.7 percent). This per-
cent is arrived at by dividing the total sales budget by total sales
($6,553,311, as shown in Figure 15–1). G&A has been handled
the same way. However, other marketing expenditures have
been previously budgeted by product category, so last year’s
percent allocation has been used.
Let’s use AT&T again for an example. Figure 15–2 contains
sales estimates by product or model category (circuits, tubes,
and valves). The sales estimate on circuits for AT&T is $25,778.
To obtain the net profit on circuits sold through AT&T, you
would multiply the $25,778 estimated sales volume by the
gross margin of 17.06 percent. This would give you a gross
profit of $4,399. This amount appears in the second column in
Figure 15–4, in the row for AT&T. To obtain the net profit on cir-
cuits from AT&T, you would multiply the sales volume estimate
of $25,778 by the cost allocation (based on a percentage of
sales) for sales, other marketing, and overhead expenses. By
Maximizing High-Potential Accounts 213

214
The Marketing Plan
Figure 15–4
Net profit by product—Plan 3.
Cost Allocation:
Circuits
Total
Tubes Valves
Cost Amount
%
Amount
%
Amount
%
Sales $242,760
$57,501
3.70%
$53,412 3.70%
$131,846
3.70%
Other Mktg.
$232,700
$55,588
3.58%
$62,089 4.31%
$115,022
3.23%
G&A $10,000
$2,369
0.15%
$2,200
0.15%
$5,431
0.15%
Total
$485,459 $115,458
7.44%
$117,701 8.16% $252,299
7.09%
Margins
17.06% 10.59%
4.15%
Net Profit
----------- Gross,
Valves
Circuits Tubes Valves
Total
Client Circuits
Tubes
AT&T $4,399 $684
$3,632
$2,482
$157
($2,572)
$66
Amdahl $5,404
$3,671
$3,118
$3,049
$841 ($2,208)
$1,682
Apple $20,886
$4,848
$11,168
$11,782
$1,111
($7,908)
$4,985
Bocuzzi
$595
$252
$435
$336
$58
($308)
$85
Bush $9,384
$4,449
$1,851
$5,294
$1,020
($1,311)
$5,003
Commodore $3,716
$2,329
$2,616
$2,097
$534 ($1,852)
$778
Eagle $4,020
$1,152
$2,451
$2,268
$264
($1,736)
$796
Farraro $1,782
$2,541
$1,237
$1,006
$582 ($876)
$712
Gaire $2,863
$400
$155
$1,615
$92 ($110)
$1,597
Graft $2,200
$1,060
$1,676
$1,241
$243
($1,187)
$297
Green $26,774
$26,040
$20,585
$15,104 $5,968
($14,576)
$6,495
Hewlitt $4,094
$4,447
$3,092
$2,309
$1,019 ($2,189)
$1,139
Honeywell $21,995 $9,530
$150
$12,408
$2,184
($106)
$14,486
IBM $2,218
$3,494
$4,203
$1,251
$801
($2,976)
($924)
Johnson $21,122
$22,651
$7,784
$11,916
$5,191
($5,512)
$11,595
Luther $38,035
$12,143
$3,268
$21,457
$2,783
($2,314)
$21,926
Orange $7,736
$2,329
$7,464
$4,364
$534 ($5,285)
($387)
Osborne $6,617 $1,365
$1,860
$3,733 $313 ($1,317)
$2,729
Pear $23,151
$17,779
$6,625
$13,060
$4,075
($4,691)
$12,443
Peters $1,156 $248
$1,008
$652 $57 ($714)
($4)
Peterson $2,104 $2,318
$2,432
$1,187 $531 ($1,722) ($4)
Reagan $8,510
$2,294
$7,722
$4,801 $526 ($5,468)
($142)
Robin $9,689
$2,541
$12,803
$5,466 $582
($9,066)
($3,017)
Smith $4,095
$3,753
$12,117
$2,310 $860
($8,580)
($5,410)
Sparrow $3,735 $3,624
$1,756
$2,107 $831 ($1,243)
$1,694
Sperry $3,640
$1,518
$2,101
$2,054 $348 ($1,488)
$913
Stemper $8,171 $2,953
$11,777
$4,610 $677 ($8,340)
($3,053)
Taylor $5,631
$4,436
$2,989
$3,177 $1,017
($2,117)
$2,076
Wang $5,384
$2,330
$4,696
$3,037 $534
($3,325)
$246
Washington $3,678
$4,801
$3,689
$2,075 $1,100
($2,613) $563
Weber $2,104 $715
$1,245
$1,187
$164 ($882)
$469
Total $264,892
$152,694 $147,706 $149,434 $34,993
($104,593)
$79,834

multi plying the total cost allocation of 7.44 percent by the total
estimated volume of $25,778 and subtracting this total ex-
pense item from gross profit, you will receive net profit in the
amount of $2,482. This amount appears in the fifth column in
Figure 15–4 underneath net profit on circuits.
If you look across the bottom line in Figure 15–4 at the to-
tals, you will notice that the net profit on circuits is projected at
$149,434; on tubes, $34,993; and on valves a loss of $104,593. In
other words, as the company is now operating, being in the
valve busi ness is costing it over $100,000 a year. As previously
mentioned, the sad part about a situation like this is that most
companies do not realize that one or more products/services
are literally dragging down their total profit—and they are not
aware of it because they do not calculate net profit by individ-
ual products or services.
Now, you may be thinking to yourself that it would be a
great idea to break out expenses by product or service category,
but you conclude that you cannot physically calculate these
numbers. I would reply that you are copping out. Regardless of
the product/service, it is not that difficult to allocate the costs
or expenditures, especially when you take into consideration
the 20/80 rule of thumb—that is, 20 percent of the activity,
whether it be manufacturing or administration, probably ac -
counts for over 80 percent of the total cost or expenditure.
Therefore, just measure or monitor the manpower, machines,
and so on that are used most extensively or are the most ex-
pensive and you will quickly get the figures you need.
Forecasting by Maximizing High-Potential
Accounts (Plan 4)
As mentioned at the beginning of this chapter, the premise be-
hind Plan 4 is that it should be no harder, and cost you no more,
Maximizing High-Potential Accounts 215

to go after the high-potential markets or customers than to pur-
sue the average or below-average customer. IBM has been going
to the data processing people in the large companies and say-
ing, “I hear you have a problem.” The data processing people
say, “We sure do. We’ve lost control, because all our employees
are going out into the marketplace and se lecting their own PCs.
In addition, when we have to tie all these PCs together or net-
work them, we really are going to have a severe problem.” What
is the IBM salesperson’s reply? Simple: She pulls out a contract
for 200 IBM PCs and shows it to the data processing people. The
IBM salesperson says that if they sign the contract, they will be
back in control. They can pass out the IBM PCs to the employ-
ees, and when they have to network the system, it will be a piece
of cake, because all the machines will be IBM. What are the data
processing people going to do? Sign the contract, obviously.
Meanwhile, the com petitors’ salespeople are spending an equal
amount of time trying to sell one or two of their computers.
Our illustration of forecasting by maximizing high-poten-
tial ac counts will be divided into five parts. They are:
1. Estimated sales potential and company development
(Figure 15–5 and 15–5a)
2. Number of share points per marketing unit and cost per
marketing unit (Figure 15–6)
3. Forecasting by maximizing high-potential accounts—
circuits (Figures 15–7 and 15–8)
4. Forecasting by maximizing high-potential accounts—
tubes (Figures 15–9 and 15–10)
5. Forecasting by maximizing high-potential accounts—
valves (Figures 15–11 and 15–12)
Figure 15–5 contains estimated client total purchases by
product category. Figure 15–5a indexes clients’ purchases
216
The Marketing Plan

against the national average. For example, AT&T’s total pur-
chases for circuits for the new year are estimated at $122,776.
This is only 57 percent of the national average. The national
average (in this case, the Northeast region) is calculated by di-
viding the number of clients (31) into total estimated pur-
chases ($6,682,266). This gives you the national average of
$215,557. AT&T’s total purchases are 43 percent below this na-
tional average. AT&T is also low in potential on tube pur-
chases, with its total estimated pur chases equaling only 18
percent of the national average. Its valve pur chases are only 60
percent of the national average. Conversely, the second client
listed, Amdahl, would be considered an extremely high-
potential customer, because the estimated circuit volume is
more than twice the national average, volume for tubes is 14
percent above the national average, and volume for valves, 27
percent over.
The third client, Apple, is similar to Amdahl, with total es-
timated purchases for each of the three product categories
being considerably above the national average. By contrast,
the fourth client, Bocuzzi, offers such low potential that it is
literally impossible to handle this account at a profit. This
does not mean that you should completely disregard cus-
tomers that account for very small volume, especially if there
is a possibility that they will increase their purchases in the fu-
ture. The point is that you should not be servicing an account
like Bocuzzi the same way you are servicing accounts such as
Amdahl and Apple.
On the right-hand side of Figure 15–5a is estimated com-
pany sales by product category. These sales data have been
picked up from Figure 15–2. As was done with client potential,
company sales have also been indexed versus the national av-
erage. For example, estimated circuit sales to AT&T are ap-
proximately half of the national average for cir cuits, tube sales
Maximizing High-Potential Accounts 217

are estimated to be only 14 percent, and valve sales, 76 percent.
Company-estimated sales to Apple illustrate the opposite ex-
treme. Both estimated circuit and valve sales are more than
twice the national average.
218
The Marketing Plan
Figures 15–5
Estimated sales potential—Plan 4.
Client
Cl ient
Client Volume
Index Natl. Avg.
Cir cuits Tu bes Valves Cir.
Tu.
Va.
AT&T
$ 122,7 76
$34,6 67 $ 241,7 71 57%
18%
60%
Amdah l
$ 443,8 90
$ 224,7 78 $ 510,1 50 2 06% 114% 127%
Appl e
$ 433,2 89
$ 224,7 79 $ 799,5 46 2 01% 114% 199%
Bo cu zzi
$4,5 44
$7,5 66
$17,6 18
2%
4%
4%
Bu sh
$ 222,8 80
$ 332,7 79 $ 388,3 61 1 03% 169%
97%
Co mmodore
$ 122,4 40
$ 223,5 56 $ 366,0 09 57% 113%
91%
Eagle
$ 113,4 46
$22,9 90 $ 331,0 86 53%
12%
82%
Farraro
$34,8 89
$51,8 80 $ 170,1 93 16%
26%
42%
Gaire
$56,8 80
$ 134,6 67 $51,4 32 26%
68%
13%
Graft
$22,8 87
$25,6 77 $41,8 28 11%
13%
10%
Green
$ 336,7 78
$ 557,8 80 $1,6 73,3 66 1 56% 283% 416%
Hewl it t
$32,4 46
$56,7 79 $ 191,7 45 15%
29%
48%
Honeywell
$ 221,8 87
$ 227,6 65 $ 440,4 48 1 03% 116% 110%
IBM
$ 134,6 67
$ 109,8 87 $ 123,6 04 62%
56%
31%
Joh nson
$ 668,9 97
$1, 223,7 89 $1,6 08,7 21 3 10% 621% 400%
Lut her
$1, 567,4 43
$ 335,6 67 $ 872,2 46 7 27% 170% 217%
Oran ge
$ 221,8 89
$ 345,7 78 $ 668,2 57 1 03% 176% 166%
Osbo rn e
$ 113,4 43
$ 156,7 76 $ 115,6 73 53%
80%
29%
Pear
$ 223,4 46
$ 228,9 90 $ 705,5 60 1 04% 116% 175%
Pet ers
$56,7 79
$35,6 64
$41,1 71
26%
18%
10%
Pet ers on
$43,4 47
$81,8 80 $43,4 39 20%
42%
11%
Reagan
$56,8 89
$ 102,7 78
$ 208,3 42
26%
52%
52%
Ro bin
$ 223,7 78
$ 134,6 67
$ 753,7 63
1 04%
68% 187%
Sm it h
$ 332,8 80
$ 443,7 78
$ 629,0 26
1 54% 225% 156%
Sp arro w
$45,6 67
$32,5 56
$ 100,7 23
21%
17%
25%
Sp erry
$ 223,5 56
$56,8 89
$ 151,0 71
1 04%
29%
38%
St emper
$ 112,8 90
$ 198,7 70
$ 587,2 30
52% 101% 146%
Taylor
$ 134,8 89
$ 234,8 89
$ 364,7 78
63% 119%
91%
Wan g
$ 210,8 97
$78,6 65
$ 127,1 91
98%
40%
32%
Was hin gton
$ 123,8 89
$ 156,7 74
$ 108,8 02
57%
80%
27%
Web er
$17,7 88
$23,4 42 $34,2 92 8%
12%
9%
Tot al
$6, 682,2 66
$6, 107,3 02 $12,4 67,4 38 1 00% 100% 100%
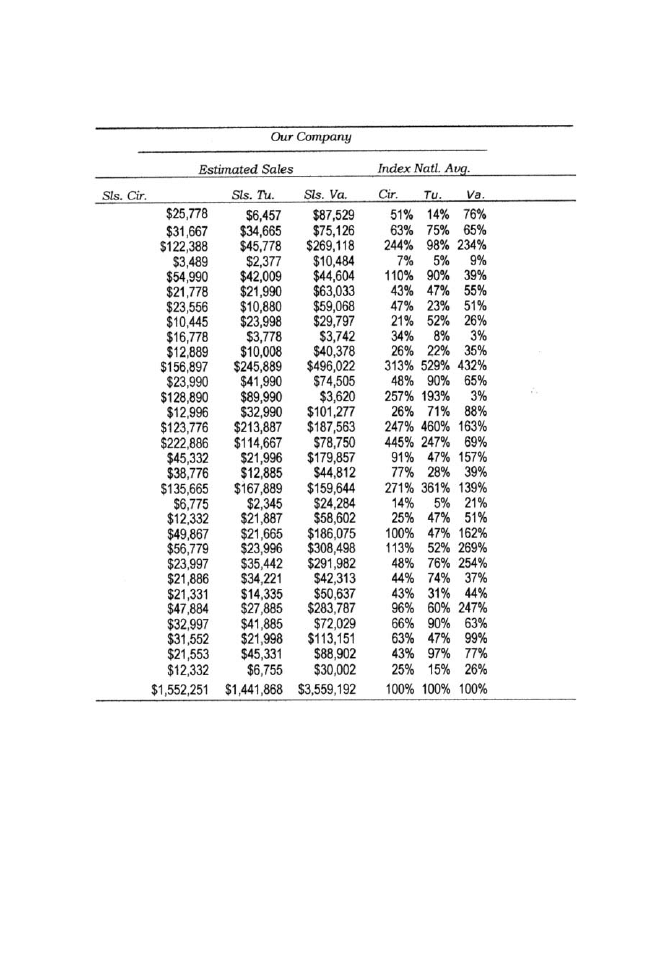
This indexing of estimated sales versus the national aver-
age is referred to as brand/service or company development.
Ideally, what you should be trying to accomplish through your
marketing efforts is to obtain above-national-average develop-
ment in markets or companies that have above-average poten-
tial. That is another way of saying that your objective should be
Figure 15–5a
Company development—Plan 4
Maximizing High-Potential Accounts 219

to obtain a share in high-potential markets or accounts that is
equal to or greater than your share in lower-potential markets
or accounts.
The share objective for the Northeast region is 26 percent,
as stated in Figure 15–1. This is a very good way to set a rea-
sonable goal: your share of a particular high-potential client
should equal your share of that market. Applying this share ob-
jective against AT&T’s total es timated purchase of circuits in
the amount of $122,776 yields $31,921. This approximates the
sales estimate for AT&T, as shown in Figure 15–5. However, if
we apply the 26 percent share goal against the total estimated
purchases of circuits by Amdahl, this comes to $115,411. The
company’s current sales estimate is only $31,667. The question
is, is it really that much more difficult to obtain a 26 percent
share of the Am dahl business than to get 26 percent of the
AT&T business? Not really—if you point these discrepancies
out to your marketing people and then reward them on the ba-
sis of profit rather than volume.
Now that client potential as well as company development
has been determined, the next question is, how much market-
ing pressure should be applied against each client, and what
will be the cost? These questions are answered in Figure 15–6,
which contains the second step we must take to maximize our
high-potential customers.
The first part of Figure 15–6, Section A, shows how we de-
termine the number of share points that should be obtained
per marketing unit. A marketing unit, referred to in abbreviated
form as MU, is an arbitrary amount of marketing weight. In this
case history, the total number of estimated sales calls listed in
Figure 15–1 has been used as the number for the total number
of mar keting units available. This figure is 1,190, as indicated
on the first line under Section A in Figure 15–6. This number
220
The Marketing Plan

Maximizing High-Potential Accounts 221
could just as well have been 1,000, 10,000, or 500. It is an arbi-
trary figure that you use to:
1. De termine the number of units of marketing pressure that
will be applied against each customer, market, or client.
2. Allocate marketing and other appropriate expenditures
for each market or customer.
The next item is the number of customers. Here 93 has
been used. The explanation is that there are thirty-one cus-
tomers and three product lines; 3 times 31 equals 93. (The as-
sumption is that each of the customers purchases each of the
product lines.) This permits calculation of the average num ber
of market units per customer, dividing the total number of
marketing units available (1,190) by the number of customers
(93) to reach 12.8, the weight of our MU.
Figure 15–6
Marketing units: share points, cost, and cost by cost component.
Amount
Explanation
A. Number of share points per marketing unit (MU)
1)
-
5
1
.
g
i
F
(
s
l
l
a
c
s
e
l
a
s
f
o
r
e
b
m
u
n
l
a
t
o
T
0
9
1
,
1
Total MUs
Number of customers
93 31 customer
⫻ 3 product lines
Average number of MUs per customer 12.8 1190/93
Total potential sales
$25,257,006 See Figure 15-1
Average product potential per customer $271,581 $25,257,006/93
Average share objective
26% See Figure 15-1
Average number of share points per MU 2.03 26%/12.8
B. Cost per MU
Total sales costs
$242,760 See Figure 15-3a
Total other marketing costs
$232,700 See Figure 15-3a
Total G&A
$10,000 See Figure 15-3a
Total marketing/G&A
$485,460 $242,760 + $232,700 + $10,000
Cost per MU
$407.95 $485,460/1193
C. Cost per MU by cost component
Sales
$204.00 $242,760/1190
Other marketing
$195.55 $232,700/1190
G&A
$8.40 $10,000/1190
Openmirrors.com

222
The Marketing Plan
The next line states total potential sales, and the answer is
$25,257,006. This comes from Figure 15–1. Then comes an-
other calcu lation, average product potential per customer. The
answer is $271,581, this being the result of dividing $25,257,006
by 93. The average share objective follows; this is 26 percent,
again lifted from Figure 15–1. With all the above information,
you can now calculate the average number of share points that
should be obtained per marketing unit, which is 2.03. This is
simply 26 percent divided by 12.8.
To state this in another way, we have now determined the
amount of marketing pressure that should be applied per
share point in high-potential accounts. If the share objective
is 26 percent, that will mean approximately thirteen sales calls
(26 percent divided by 2.03) and thirteen units of other types
of marketing effort that are being used. If the share objective
is 10 percent, it will mean approximately five sales calls. And
so on.
Here’s a worksheet for you to calculate the number of
share points per marketing unit for your company. It’s really
pretty straightforward if you go step by step. You can make a
photocopy of this, or print out a copy from the Worksheets
folder that you downloaded to your computer.
Worksheet 15–1
Number of share points per marketing unit
Total MUs ________________________________________________________
Number of customers ______________________________________________
Average # of MUs per customer ______________________________________
Total potential sales _______________________________________________
Average P/S potential per customer ___________________________________
Average share objective ____________________________________________
Average # of share points per MU _____________________________________

Now that the number of share points per marketing unit
has been determined, the next step is to calculate the mar-
keting cost for each marketing unit. This is calculated under
Section B in Figure 15–6. Ac cording to Figure 15–3a, total sales
costs are estimated at $242,760, other marketing expenditures
at $232,700, and G&A costs at $10,000. The sum of these fig-
ures results in a total marketing/G&A cost of $485,460, which
is divided by number of MUs (1,190), to give a cost per mar-
keting unit of $407.95. You will note that G&A costs have been
included along with marketing. The reason for this is that it
permits a calculation of net profit.
Use Worksheet 15–2 to calculate costs per marketing unit
for your company.
Worksheet 15–2
Cost per marketing unit
Total sales costs ___________________________________________________
Total other marketing costs__________________________________________
Total G&A ________________________________________________________
Total marketing/G&A _______________________________________________
Cost per MU ______________________________________________________
Section C of Figure 15–6 is a breakout of the cost of a mar-
keting unit into sales, other mar keting expenditures, and G&A.
Worksheet 15–3 enables you to break out your cost per mar-
keting unit by cost component.
Worksheet 15–3
Cost per marketing unit by cost component
Sales ____________________________________________________________
Other Marketing __________________________________________________
G&A_____________________________________________________________
Maximizing High-Potential Accounts 223

The preceding calculations give us sufficient data to apply
the prin ciple maximizing high-potential accounts. This is il-
lustrated in the next three tables, with Figure 15–7 covering cir-
cuits; Figure 15–8, tubes; and Figure 15–9, valves.
In Figure 15–7, the first column lists the various clients, but
unlike in the previous tables, the clients have been rearranged
on the basis of their potential purchases of circuits. This is a nu-
merical sort in de scending order of the national average index
from Figure 15–5. You will notice that the client Luther (how did
that happen?) is estimated to have the highest potential on cir-
cuits, with an index of 727 percent, or seven times the national
average. The next client, Johnson, has an index of 310 percent,
which is three times the national average. Amdahl has an index
of 206 percent, and so on. Clients Luther through Honeywell,
which have an above-average potential, are listed at the top of
the table, and clients with an index below 100 percent, or lower
than the national average, are listed in the lower half.
The reason for this division is that two separate strategies
will be used—one for above-average-potential customers and
another for below-average-potential customers. The strategy for
high-potential ac counts is stated at the top of Figure 15–7, “In-
crease development to level of potential in high-potential ac-
counts and allocate marketing and G&A expenses on basis of
share objective.” The strategy for low-potential accounts is
stated in Figure 15–8: “No in crease in sales in low-potential ac-
counts and no marketing units against ac counts where just one
MU would generate a loss.” The meaning of these two strategies
will become clearer as the rest of the table is discussed.
Starting at the top, we see in Figure 15–7 that the first client
listed is Luther. The second column shows estimated total circuit
purchases, with the index (that is, potential circuits) shown in
the third column. The fourth and fifth columns are on company
224
The Marketing Plan

Figure 15–7
Above average potential—circuits.
d
e
s
i
v
e
R
t
n
e
r
r
u
C
Client
Company
Dev.
Volume
Share
Gross
Margin
17.06%
Nb. of MUs
(Share/
Total Cost of
2.0319
=
MUs
@
Revised
MUs)
$407.95
Profit
Client
Volume
Circuits
Pot.
Cir.
Dev.
Cir.
Volume
Circuits
Luther
$1,567,443
727%
445%
$222,886
727%
$364,108
23%
$62,117
11
$4,664
$57,453
Johnson
$668,997
310%
247%
$123,776
310%
$155,404
23%
$26,512
11
$4,664
$21,848
Amdahl
$443,890
206%
63%
$31,667
206%
$103,113
23%
$17,591
11
$4,664
$12,927
Apple
$433,289
201%
244%
$122,388
244%
$122,388
28%
$20,879
14
$5,671
$15,208
Green
$336,778
156%
313%
$156,897
313%
$156,897
47%
$26,767
23
$9,354
$17,413
Smith
$332,880
154%
48%
$23,997
154%
$77,326
23%
$13,192
11
$4,664
$8,528
Robin
$223,778
104%
113%
$56,779
113%
$56,779
25%
$9,686
12
$5,094
$4,592
Sperry
$223,556
104%
43%
$21,331
104%
$51,931
23%
$8,859
11
$4,664
$4,196
Pear
$223,446
104%
271%
$135,665
271%
$135,665
61%
$23,144
30
$12,190
$10,955
Bush
$222,880
103%
110%
$54,990
110%
$54,990
25%
$9,381
12
$4,954
$4,428
Orange
$221,889
103%
91%
$45,332
103%
$51,544
23%
$8,793
11
$4,664
$4,129
Honeywell
$221,887
103%
257%
$128,890
257%
$128,890
58%
$21,989
29
$11,663
$10,326
Total
$5,120,713
198%
187%
$1,124,598
243%
$1,459,034
28%
$248,911
188.52
$76,908
$172,003
Increase development to level of potential in high-potential accounts
and allocate marketing and G&A expenses on basis of share objective.

development, with column four being the index and column five
being the volume. The data for both these columns are picked up
from Figure 15–5a. The sixth column contains the revised devel-
opment objectives; the figure is picked up from either column
three or column four, whichever is larger. For example, the re-
vised development for Luther is shown as 727 percent, and this
equals the potential index in column three. In the case of Apple,
which is the fourth client down, the development objective is 244
percent, which is picked up from column four because the cur-
rent company development is greater than the potential. An al-
ternative way of stating this strategy on new development
objectives is that sales goals will be equal to the client po tential
or current company development, whichever one is higher.
These new development objectives are used to calculate
the re vised sales volume, which is shown in column seven.
The next column translates these volume figures into share,
with the average share for high-potential accounts equaling
28 percent. The ninth column lists the gross margin. This fig-
ure minus the marketing-unit expenditure detailed in the
next two columns results in the revised profit shown in the
far thest column to the right.
Going back to the two columns between the gross margin
and the revised profit, the one on the left details the number of
marketing units to be used, and the one on the right states the
total costs of the mar keting units. For example, eleven mar-
keting units will be used against Lu ther, because if you divide
2.03 into the 23 percent share objective, you will get 11. The to-
tal MU expenditure charged against Luther is eleven times the
cost per unit (11 × $497.95).
All you have to do is look at the total revised profit for the
high-potential clients on circuits alone, and you will realize
what a dramatic effect this type of sales-development strategy
can have on your bottom line. The total revised profit for both
226
The Marketing Plan

low- and high-potential clients, as shown in the very bottom
row in the right-most column of Figure 15–8, is $175,891, which
exceeds the total previous indi cated profit for all three product
categories against all thirty-one clients.
Figure 15–8 executes the strategy for low-potential clients,
which, as stated above, is, “No increase in sales in low-potential
accounts and no marketing units against accounts where just
one MU would generate a loss.” For example, clients Wang
through Commodore can still offer profitable business, but
clients Eagle through Bocuzzi are impossible to service without
incurring a loss, because the cost of a marketing unit exceeds
the gross profit generated by the resulting share points. For ex-
ample, one marketing unit (one sales call, and so on) on a na-
tional average comes out to approximately a two share. A two
share of the client potential on client Eagle is $2,268 ($113,446
× 0.02). The gross margin on $2,268 at the rate of 17.06 percent
equals $387. This is less than the cost of a marketing unit,
which is $407. This is not to say that in the real world you
should completely eliminate clients such as Eagle through
Bocuzzi, but it should indicate to you that you have to handle
this type of business with a different strategy—maybe just tele-
marketing, or just brochures.
You can’t solve a problem until you can spot it and only
then develop new strategies. For example, Johns Hopkins Uni-
versity researchers were frustrated by the high school dropout
rate. That was their problem. So they did research and found a
high correlation between poor attendance of eight-graders
and their subsequent dropout rate. Now the schools have spe-
cial programs to help those with this profile.
Figures 15–9, 15–10, 15–11, and 15–12 are the same as Fig-
ures 15–7 and 15–8, except that they concern different product
lines: tubes and valves. These exhibits illustrate that for these
two products, no client below the national average in potential
(text continues on page 233)
Maximizing High-Potential Accounts 227

Figure 15–8
Below average potential—circuits.
No increase in sales in low-potential accounts and no marketing units against accounts where just one MU would generate a loss.
d
e
s
i
v
e
R
t
n
e
r
r
u
C
Client
Company
Dev.
Volume
Share
Gross
Margin
17.06%
Nb. of MUs
(Share/
Total Cost of
2.0319
=
MUs
@
Revised
MUs)
$407.95
Profit
Client
Volume
Circuits
Pot.
Cir.
Dev.
Cir.
Volume
Circuits
Wang
$210,897
98%
63%
$31,552
63%
$31,552
15%
$5,383
7
$3,004
$2,379
Taylor
$134,889
63%
66%
$32,997
66%
$32,997
24%
$5,629
12
$4,911
$718
IBM
$134,667
62%
26%
$12,996
26%
$12,996
10%
$2,217
5
$1,938
$280
Washington
$123,889
57%
43%
$21,553
43%
$21,553
17%
$3,677
9
$3,493
$184
AT&T
$122,776
57%
51%
$25,778
51%
$25,778
21%
$4,398
10
$4,215
$182
Commodore
$122,440
57%
43%
$21,778
43%
$21,778
18%
$3,715
9
$3,571
$144
Eagle
$113,446
53%
47%
$23,556
0%
$0
0%
$0
0
$0
$0
Osborne
$113,443
53%
77%
$38,776
0%
$0
0%
$0
0
$0
$0
Stemper
$112,890
52%
96%
$47,884
0%
$0
0%
$0
0
$0
$0
Reagan
$56,889
26%
100%
$49,867
0%
$0
0%
$0
0
$0
$0
Gaire
$56,880
26%
34%
$16,778
0%
$0
0%
$0
0
$0
$0
Peters
$56,779
26%
14%
$6,775
0%
$0
0%
$0
0
$0
$0
Sparrow
$45,667
21%
44%
$21,886
0%
$0
0%
$0
0
$0
$0
Peterson
$43,447
20%
25%
$12,332
0%
$0
0%
$0
0
$0
$0
Farraro
$34,889
16%
21%
$10,445
0%
$0
0%
$0
0
$0
$0
Hewlitt
$32,446
15%
48%
$23,990
0%
$0
0%
$0
0
$0
$0
Graft
$22,887
11%
26%
$12,889
0%
$0
0%
$0
0
$0
$0
Weber
$17,788
8%
25%
$12,332
0%
$0
0%
$0
0
$0
$0
Bocuzzi
$4,544
2%
7%
$3,489
0%
$0
0%
$0
0
$0
$0
Total
$1,561,553
38%
45%
$427,653
15%
$146,654
9%
$25,019
51.80
$21,132
$3,887
Gr. Tot.
$6,682,266
100%
100%
$1,552,251
103%
$1,605,688
24%
$273,930
240.32
$98,040
$175,891
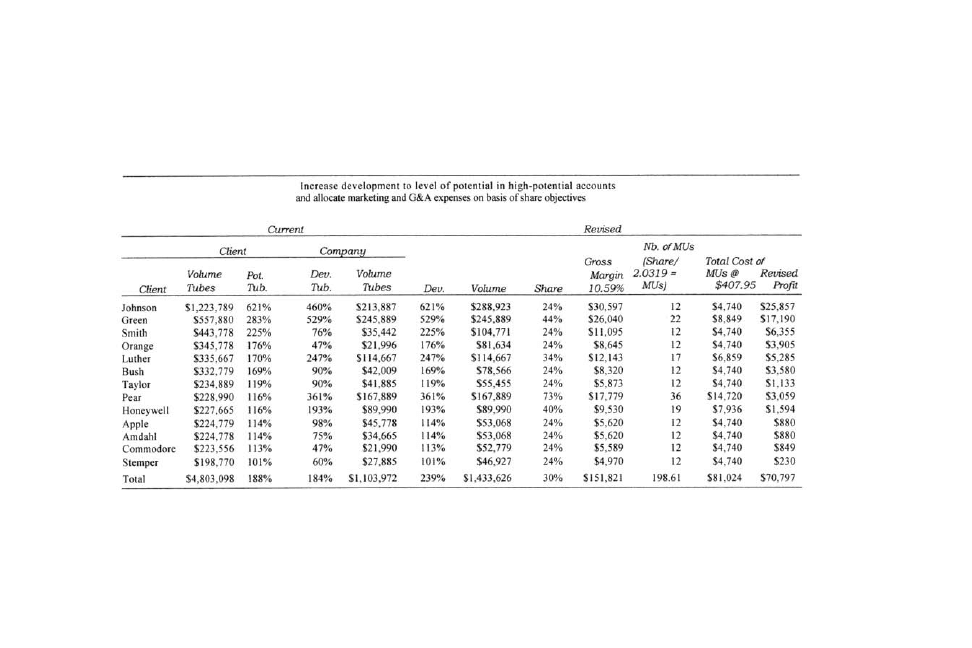
Figure 15–9
Above average potential—tubes.

Figure 15–10
Below average potential—tubes.
No increase in sales in low-
-potential accounts and no marketing units against accounts where just one MU would generate a loss.
d
e
s
i
v
e
R
t
n
e
r
r
u
C
Client
Company
Dev.
Volume
Share
Gross
Margin
10.59%
Nb.
of MUs
(Share/
Total Cost
of
2.0319
=
MUs
@
Revised
MUs)
$407.95
Profit
Client
Volume
Tubes
Pot.
Tub.
Dev.
Tub.
Volume
Tubes
Osborne
$156,776
80%
28%
$12,885
0%
$0
0%
$0
0
$0
$0
Washington
$156,774
80%
97%
$45,331
0%
$0
0%
$0
0
$0
$0
Robin
$134,667
68%
52%
$23,996
0%
$0
0%
$0
0
$0
$0
Gaire
$134,667
68%
8%
$3,778
0%
$0
0%
$0
0
$0
$0
IBM
$109,887
56%
71%
$32,990
0%
$0
0%
$0
0
$0
$0
Reagan
$102,778
52%
47%
$21,665
0%
$0
0%
$0
0
$0
$0
Peterson
$81,880
42%
47%
$21,887
0%
$0
0%
$0
0
$0
$0
Wang
$78,665
40%
47%
$21,998
0%
$0
0%
$0
0
$0
$0
Sperry
$56,889
29%
31%
$14,335
0%
$0
0%
$0
0
$0
$0
Hewett
$56,779
29%
90%
$41,990
0%
$0
0%
$0
0
$0
$0
Farraro
$51,880
26%
52%
$23,998
0%
$0
0%
$0
0
$0
$0
Peters
$35,664
18%
5%
$2,345
0%
$0
0%
$0
0
$0
$0
AT&T
$34,667
18%
14%
$6,457
0%
$0
0%
$0
0
$0
$0
Sparrow
$32,556
17%
52%
$24,221
0%
$0
0%
$0
0
$0
$0
Graft
$25,677
13%
22%
$10,008
0%
$0
0%
$0
0
$0
$0
Weber
$23,442
12%
15%
$6,755
0%
$0
0%
$0
0
$0
$0
Eagle
$22,990
12%
23%
$10,880
0%
$0
0%
$0
0
$0
$0
Bocuzzi
$7,566
4%
5%
$2,377
0%
$0
0%
$0
0
$0
$0
Total
$1,304,204
37%
39%
$327,896
0%
$0
0%
$0
0
$0
$0
Gr. Tot.
$6,107,302
100%
100%
$1,441,868
100%
$1,433,626
23%
$151,821
198.61
$81,024
$70,797

Figure 15–11
Above average potential—valves
Increase development to level of potential in high-potential accounts
and allocate marketing and G&A expenses on basis of share objective.
d
e
s
i
v
e
R
t
n
e
r
r
u
C
Client
Company
Dev.
Volume
Share
Gross
Margin
4.15%
Nb. of MUs
(Share/
Total Cost of
2.0319
=
MUs
@
Revised
MUs)
$407.95
Profit
Client
Volume
Valves
Pot.
Val.
Dev.
Val.
Volume
Valves
Green
$1,673,366 416%
432%
$496,022
432%
$496,022
30%
$20,585
15
$5,951
$14,634
Johnson
$1,608,721 400%
163%
$187,563
400%
$459,256
29%
$19,059
14
$5,732
$13,327
Luther
Apple
$872,246
$799,546
217%
199%
69%
234%
$78,750
$269,118
217%
234%
$249,008
$269,118
29%
34%
$10,334
$11,168
14
17
$5,732 $$44:6401
21
Robin
$753,763 187%
269%
$308,498
269%
$308,498
41%
$12,803
20
$8,217
$4,585
Pear
$705,560 175%
139%
$159,644
175%
$201,423
29%
$8,359
14
$5,732
$2,627
Orange
$668,257 166%
157%
$179,857
166%
$190,773
29%
$7,917
14
$5,732
$2,185
Smith
$629,026 156%
254%
$291,982
254%
$291,982
46%
$12,117
23
$9,319
$2,798
Stemper
$587,230 146%
247%
$283,787
247%
$283,787
48%
$11,777
24
$9,703
$2,075
Amdahl
$510,150 127%
65%
$75,126
127%
$145,637
29%
$6,044
14
$5,732
$312
Honeywell
$440,448 110%
3%
$3,620
110%
$125,739
29%
$5,218
14
$5,732
($513)
Total
$9,248,311 209%
185% $2,333,968
239%
$3,021,243
33%
$125,382
182.22
$74,338
$51,043

Figure 15–12
Below average potential—valves.
No increase in sales in low-potential accounts and no marketing units against accounts where just one MU would generate a loss.
d
e
s
i
v
e
R
t
n
e
r
r
u
C
Client
Company
Dev.
Volume
Share
Gross
Margin
4.15%
Nb. of MUs
(Share/
Total Cost
2.0319 =
of MUs @
Revised
MUs)
$407.95
Profit
Client
Volume
Valves
Pot.
Val.
Dev.
Val.
Volume
Valves
Bush
$388,361
97%
39%
$44,604
0%
$0
0%
$0
0
$0
$0
Commodore
$366,009
91%
55%
$63,033
0%
$0
0%
$0
0
$0
$0
Taylor
$364,778
91%
63%
$72,029
0%
$0
0%
$0
0
$0
$0
Eagle
$331,086
82%
51%
$59, 068
0%
$0
0%
$0
0
$0
$0
AT&T
$241,771
60%
76%
$87,529
0%
$0
0%
$0
0
$0
$0
Reagan
$208,342
52%
162%
$186,075
0%
$0
0%
$0
0
$0
$0
Hewlitt
$191,745
48%
65%
$74,505
0%
$0
0%
$0
0
$0
$0
Farraro
$170,193
42%
26%
$29,797
0%
$0
0%
$0
0
$0
$0
Sperry
$151,071
38%
44%
$50,637
0%
$0
0%
$0
0
$0
$0
Wang
$127,191
32%
99%
$113,151
0%
$0
0%
$0
0
$0
$0
IBM
$123,604
31%
88%
$101,277
0%
$0
0%
$0
0
$0
$0
Osborne
$115,673
29%
39%
$44,812
0%
$0
0%
$0
0
$0
$0
Washington
$108,802
27%
77%
$88,902
0%
$0
0%
$0
0
$0
$0
Sparro w
$100,723
25%
37%
$42,313
0%
$0
0%
$0
0
$0
$0
Gaire
$51,432
13%
3%
$3,742
0%
$0
0%
$0
0
$0
$0
Peterson
$43,439
11%
51%
$58,602
0%
$0
0%
$0
0
$0
$0
Graft
$41,828
10%
35%
$40,378
0%
$0
0%
$0
0
$0
$0
Peters
$41,171
10%
21%
$24,284
0%
$0
0%
$0
0
$0
$0
Weber
$34,292
9%
26%
$30,002
0%
$0
0%
$0
0
$0
$0
Bocuzzi
$17,618
4%
9%
$10,484
0%
$0
0%
$0
0
$0
$0
Total
$3,219,127
40%
53%
$1,225,224
0%
$0
0%
$0
0
$0
$0
Gr. Tot.
$12,467,438
100%
100%
$3,559,192
85%
$3,021,243
24%
$125,382
182.22
$74,338
$51,043

can be han dled profitably. The reason is that these gross mar-
gins are much lower than for circuits.
What Have We Learned?
Figure 15–13 is a summary of the four sales plans.
Figure 15–14 presents what is probably of greatest interest.
It compares Plan 3 and Plan 4. It shows that total sales for Plan
4 are 8 percent lower than for Plan 3 and that gross profit is 2
percent lower. However, expenses for Plan 4 are 48 percent
lower than for Plan 3, resulting in a net-profit increase of 273
Maximizing High-Potential Accounts 233
Figure 15–13
The four sales plans.
Plan 1: Forecasting by Sales Volume by Customer
Current Year
Current Year +1
`
Expenses `
Gross Number of
Sales
Sales % +/−
Margin Profit Sales Calls
Sales Other Mktg G&A
Profit
Circuits
Tubes
Valves
Total $5,397,051 $6,553,311 21%
1,190
Plan 2: Forecasting by Net Profit by Customer
Current Year
Current
Year +1 `
Expenses `
Gross Number of
Sales
Sales % +/−
Margin Profit Sales Calls
Sales Other Mktg G&A
Profit
Circuits
$1,552,251 17.06% $264,892
Tubes $1,441,868 10.59% $152,694
Valves $3,559,192
4.15% $147,706
Total $5,397,051 $6,553,311 21% 8.62% $565,292 1190 $242,760 $232,700 $10,000 $79,832
Plan 3: Forecasting by Net Profit by Customer by Product
Current Year
Current
Year +1
Expenses `
Gross Number of
Sales
Sales % +/−
Margin Profit Sales Calls
Sales Other Mktg G&A
Profit
Circuits
$1,552,251 17.06% $264,892
$57,501 $55,588 $2,369
$149,439
Tubes $1,441,868 10.59% $152,694 $53,412 $62,089 $2,200 $34,993
Valves $3,559,192
4.15% $147,706 $131,845 $115,022 $5,431 ($104,592)
Total $5,397,051 $6,553,311 21% 8.62% $565,292 1190 $242,758 $232,699 $10,000 $79,757
Plan 4: Forecasting by Maximizing High-Potential Accounts
Current Year +1
Revised Current Year +1
Marketing Unit
(
MU
)
Expenses
by
Component
Gross
Sales
Other Mktg
G&A
Sales
Sales % +/
−
Margin Profit # of MUs
$
204.00
$
195.55
$
8.40
Profit
Circuits $1,552,251 $1,605,688 3% 17.06% $273,930 240.32 $49,026 $46,994 $2,020 $175,891
Tubes $1,441,868 $1,433,626 − 1% 10.59% $151,821 198.61 $40,517 $38,838 $1,669 $70,797
Valves $3,559,192 $3,021,243 −15% 4.15% $125,382 182.22 $37,174 $35,633 $1,531 $51,043
Total $6,553,311 $6,060,557 − 8% 9.09% $551,133 621.16 $126,717 $121,465 $5,220 $297,731

percent for Plan 4 over Plan 3. The reason for the large decrease
in expenditures is that the number of MUs has been cut from
1,190 to 621. This would require fewer sales personnel; the staff
can be reduced through either transfers or attrition.
Worksheet 15–4, which ends this chapter, enables you to
finish your own analysis of your client base. If you have already
completed Worksheets 15–1, 15–2, and 15–3 to establish your
MUs, then go ahead and fill out Worksheet 15–4 now. If you
haven’t, go back and do them first. If you don’t know your
clients’ sales potential, assign that task to your sales force. The
rest of the data you should have in house.
234
The Marketing Plan
Figure 15–14
Plan 3 versus Plan 4.
Plan 3
_Plan 4
+/−
Percentage
Total Sales $6,553,311 $6,060,557 ($492,754) −8%
Gross Profit $565,214 $551,133 ($14,081)
−2%
Expenses
Sales $242,758 $126,717 ($116,042)
−48%
Other Mktg $232,699 $121,465 ($111,234) −48%
G&A $10,000
$5,220 ($4,780)
−48%
Total Expenses $485,457 $253,402 ($232,056) −48%
Net Profit $79,757 $297,731 $217,974
273%

Worksheet 15–4
Forecasting by maximizing high-potential accounts
Product/Service ______________________
Gross
# MUs
Cost of
Client
Company
dddtdd
margin
per share
MU
Revised
Client
Volume Potential
Dev.
Volume
Dev.
Volume
Share
______
______
______
profit
____________
______
______ ______ ______ ______ ______
______
______
______
______
______
____________
______
______ ______ ______ ______ ______
______
______
______
______
______
____________
______
______ ______ ______ ______ ______
______
______
______
______
______
____________
______
______ ______ ______ ______ ______
______
______
______
______
______
____________
______
______ ______ ______ ______ ______
______
______
______
______
______
____________
______
______ ______ ______ ______ ______
______
______
______
______
______
____________
______
______ ______ ______ ______ ______
______
______
______
______
______
____________
______
______ ______ ______ ______ ______
______
______
______
______
______
____________
______
______ ______ ______ ______ ______
______
______
______
______
______
____________
______
______ ______ ______ ______ ______
______
______
______
______
______
____________
______
______ ______ ______ ______ ______
______
______
______
______
______
____________
______
______ ______ ______ ______ ______
______
______
______
______
______
____________
______
______ ______ ______ ______ ______
______
______
______
______
______
____________
______
______ ______ ______ ______ ______
______
______
______
______
______
____________
______
______ ______ ______ ______ ______
______
______
______
______
______
____________
______
______ ______ ______ ______ ______
______
______
______
______
______
____________
______
______ ______ ______ ______ ______
______
______
______
______
______
____________
______
______ ______ ______ ______ ______
______
______
______
______
______

This page intentionally left blank

In North America alone, over 250 million people connect to the
Internet every day; globally, that figure is closer to 2 billion—
and climbing. In order to compete in an economy that has be-
come increasingly connected globally, effective use of the
Internet and its various technological tools to market, adver-
tise, and promote products and services is a necessity whether
you’re IBM, McDonald’s, or a small local business—ready or
not. In this chapter we cover the following: search engine opti-
mization (SEO), pay per click (PPC), banner and pop-up ads,
smartphones apps, and social media. SEO is particularly im-
portant because, unless you use outside media to promote
your Internet site, you will only be “seen” if the search engines
register your keywords. We show you how to optimize your key-
words and offer a list of websites that will help you select the
best ones for your business.
There are four basic types of websites—promotional, con-
tent-based, customer service, and transactional (i.e., sales)—
but increasingly websites combine elements of each of the four
basic websites into their websites. For example, on Verizon
Wireless’s website, you’ll come across promotional information
237

on their cellular offerings and special deals. Through their cus-
tomer service component, you can pay your bill or find out how
many minutes and text messages you’ve used. You can buy a
new phone or a Bluetooth headset and have them shipped to
your home. And you can find customer reviews of phones, as
well as content on cell phone safety tips or how you can save
money by bundling service offerings or other informational
content. Amazon.com and countless other websites do the
same.
Pay-Per-Click (PPC)
Pay-per-click programs are Internet advertising tools in which
you, as an advertiser, pay a host or a search engine when their
advertisement is clicked on by a web surfer. Generally when-
ever there’s a pay-per-click arrangement on a website, the ad-
vertiser pays a fixed rate to the website/publisher. In many
cases, the publisher/website has a rate card, much like a mag-
azine, newspaper, or television network detailing how much it
will cost to advertise within the website and it’s based on sev-
eral factors, including the popularity of that particular portion
of the website. It’s much more likely to be “pay more per click”
on a segment of a website that’s extremely popular and has a lot
of traffic. Of course these rates can be negotiated if your busi-
ness is planning to enter a long-term or high-value contract.
With search engines, it’s much more likely for advertisers to
bid on keyword searches relevant to their target market and to
their business. In the bid-based model, the advertiser will sign
a contract that allows them to compete against other advertis-
ers in a private auction hosted by a publisher, an advertising
network, or a search engine. Each advertiser informs the host
of the maximum amount that he or she is willing to pay for a
given ad spot, often based on a keyword. The auction plays out
238
The Marketing Plan

in an automated fashion every time a visitor triggers the ad spot
whenever they use a search engine. When the ad spot is part of
a search engine results page (SERP), the automated auction
takes place whenever a search for the keyword that is being bid
upon occurs. All bids for the keyword that target the searcher’s
geolocation (real-world location), the day and time of the
search, etc., are then compared and the winner determined. In
situations where there are multiple ad spots, a common occur-
rence on SERPs, there can be multiple winners whose positions
on the page are influenced by the amount each company has
bid. The ad with the highest bid generally shows up first,
though additional factors such as ad quality and relevance can
sometimes come into play. Bidding through a web engine may
be an attractive way to market and advertise your company,
your products, or your services to as large of an audience as
possible. After all, almost every Internet user will use a search
engine page—whether it’s Google, Bing, or Yahoo!—at some
point while online.
Banner and Pop-Up Advertising
Banner adverting consists of embedding your advertisement
into a web page. You should place your banner ads on websites
that have something in common with what you are selling. If
your company manufactures washing machines and you place
a banner ad on a website that sells computer parts, you proba-
bly won’t have many readers clicking over to your website.
There are three ways you can promote your banner ad. You
can pay the owner of the website you want to advertise on, you
can exchange with others, and you can create your own “net-
work,” where you commission many sites to display your ad.
DoubleClick (www.doubleclick.com), a subsidiary of Google,
can help you with this.
The Internet Plan 239

If possible, you want to add movement or animation to
your ad for greater effectiveness, as motion captures a viewer’s
attention. Several companies such as Corel (www.corel.com),
ABC Banners (www.abcbanners.com), and Make Your Banner
(www.makeyourbanner.com) can help you produce an effec-
tive banner ad.
But you should try to avoid making large expenditures on
this kind of promotion. Banner ads have become less success-
ful over the last decade or so, as many Internet users find them
obtrusive, distracting, and irritating. And we have all grown in-
creasingly wary of banner and pop-up ads, since some crimi-
nals use these methods to scam people or to pass on computer
viruses.
Search Engine Optimization (SEO)
Search engine optimization involves the process of improving
the visibility of a website or a web page on search engines by
targeting different kinds of searches including image search, lo-
cal search, video search, and industry-specific search engines.
As search engines have gradually replaced the Yellow Pages
and the White Pages, it has become increasingly necessary to
employ SEO tactics for your business.
SEO as an Internet marketing strategy considers how
search engines work and what people actually search for when
they’re online. Optimizing a website for searches can involve
editing its content, as well as its HTML and other associated
coding that make up the website and its design, to increase
their relevance to specific keywords. This is also done to re-
move any barriers to the indexing activities of search engines.
Generally, the earlier (or higher on the page) and more fre-
quently a website appears in the search engine’s results list, the
more visitors it’ll receive.
240
The Marketing Plan

You cannot do this alone. A number of companies sell
their services: www.seocentro.com/tools/search-engine/
metatag-analyzer.html, wordtracker.com, and adwords.google
.com/select/KeywordToolExternal are a few of the better
known ones.
Cell Phones and Smartphones
At the end of 2009, roughly 21 percent of all American cell
phone subscribers were using a smartphone such as the Black-
berry, the iPhone, the Droid, and other models. Over the first
few months of 2010, smartphone users have increased to about
29 percent of all cell phone subscribers. According to a recent
Nielsen survey of cell phone users considering changing their
phones or plans, 45 percent of respondents answered that
they were considering some sort of smartphone as their next
cell phone purchase. Based on these numbers and the falling
prices of these devices, Nielsen projects that by the end of 2011,
smartphones will overtake the standard phone market. Now
that’s increasing market share with a vengeance! Analysts are
speculating that about 1 billion people globally will be using a
smartphone by 2014. With such a growing trend, it will quickly
seem imperative to consider marketing products and services
through mobile devices, as these consumers will be accessing
all sorts of specialized content on their phones.
Harris Interactive expects the entire mobile ad segment to
become a $7.4 billion market by 2014. This even includes text
messages. In a recent Harris survey, 40 percent of respon-
dents said texting is extremely or very important. Clear Chan-
nel Communications in January 2010 sold out its inventory of
certain mobile ads.
Consumer products marketers—food, beverage, liquor, fast-
food restaurants, household cleaners, personal care, pet, and ap-
The Internet Plan 241

parel brands, for example—have been at the forefront of using
mobile apps to promote, market, and advertise their businesses.
For many marketers, mobile apps have increasingly become part
of an existing media strategy. In fact, in a December 2009 survey
conducted by DM2PRO and Quattro Wireless, 64.8 percent of
marketers and publishers reported planning to invest in mobile
apps. Mobile phones and devices play an important role in con-
sumers’ lives and are spurring the growth of mobile apps.
Since many of these brands desire a closer relationship
with consumers, mobile apps are ideal, because they offer—be-
yond the marketing message—the opportunity to invite these
consumers into personal exchanges and much more immer-
sive experiences. Of course if a brand is interested in develop-
ing a mobile app, they need to make sure that the app will be
valuable to the user. There are now numerous mobile apps that
fill utilitarian needs, serving up informative tips and educa-
tional bits; plenty that offer pure entertainment; and others
that hover in between. For example, there are exciting new
apps that enable you to reach your customers by mobile phone.
Google has its “whisper”—targeted ads that will whisper your
brand if the mobile users mention one of your keywords during
a conversation. They also have an ad service that inserts your
brand next to a search by a user. Foursquare brings up your
store when the mobile user enters your area. Microsoft is chan-
neling text-based ads on screens of phones using its upcoming
Windows Phone 7 operating system, and Apple recently intro-
duced the company’s iAd platform.
Flipboard is a revolutionary iPad app for social news or
even a personal newsstand. It turns Twitter and Facebook ac-
counts into magazine look-alikes. It builds custom magazines
from prebuilt curated boards or improved Twitter lists. And it
works in reverse. A brand’s Twitter account can be flipped to
Flipboard.
242
The Marketing Plan

Strategically, mobile apps may be appropriate for your com-
pany if your brand or company has a reputation for being a
trendsetter. Plus companies will frequently jump at the chance to
have regular, if not permanent, access to customers at just about
any time and any place without the other distractions of Web 2.0.
But this should only be done if your customer base sees them-
selves as trendsetters as well. Certainly, if being considered the
first and best brand is part of your competitive advantage, then
having a mobile app frequently creates powerful buzz among the
social media world, as well as providing you with instant PR.
As brands are increasingly exchangeable, consumers are
much more likely to quickly change brands multiple times. The
mobile app is a closed environment for interaction between
customers and brands in which brands can concentrate on the
consumer dialogue—on the consumer’s terms. Brands that
want to keep their market position may also be interested in
apps as a way to set a new standard to their competition, forc-
ing the competition to catch up to the standard and even per-
fect it. In the world of Web 2.0 ideology nothing is perfect from
the beginning. If something is missing, it can be optimized, ad-
justed, or set up anew—by the brand itself or by the community
of the active consumers.
Executives who attended the Cannes Lions ad festival in
2009 told Reuters that emerging economics were also promis-
ing, though the lack of a global mobile phone standard could
break a speedy development. “If you are interrupted every two
minutes by advertising,” says David Jones, global chief execu-
tive of Havas Worldwide, “not many people want that. The in-
dustry needs to work out smart and clever ways to engage
people on mobiles.”
However, mobile advertising will likely attract interest from
niche advertisers, which do not usually use mainstream media.
They could shift ad budgets away from newspapers.
The Internet Plan 243

You should check out AdMob, Inc. (www.admob.com), if
you are interested in advertising on cell phones. They sell ads
across thousands of websites that are tailored for cell phones and
were recently purchased by Google. Be careful, however: The ads
are very small and the cell phone user can become annoyed.
WeReward can promote your business to smartphone users
in your area. They use GPS to locate nearby potential customers
and then send them ads on your facility. If the customer buys at
your store, then he/she receives rewards from WeReward.
Social Media
Social media has revolutionized the Internet, how it’s used, and
how companies must market their services and products. Face-
book, the website which expanded the social media revolution,
now has over 400 million active users and recently became the
world’s most popular, most clicked website, beating out Google.
“Marketers have always known that the best way to sell some-
thing is to get your friends to sell it,” says Sheryl Sandburg, Face-
book’s chief operating officer. “That is what people do all day on
Facebook. We enable effective word-of-mouth advertising at
scale for the first time.”
Under the headline “Pepsi drops the Super Bowl to focus
on Facebook,” brandchannel.com’s blogger Sara Zucker said,
“Give Pepsi some credit. In addition to its efforts to offer con-
sumers healthier options, the beverage behemoth also plans to
forgo the Super Bowl to work on expanding into new media. . .
. Pepsi is focusing its energy and money on its online presence
where the brand believes a younger and accessible demo-
graphic is spending its time.”
That same blog quotes Ralph Santana, VP of marketing for
PepsiCo North America: “We’re living in a new age with con-
sumers. They are looking for more of a two-way dialogue, story-
244
The Marketing Plan

telling and word of mouth. Mediums like the digital space are
much more conducive toward that.” Many companies are
spending more advertising money on social media, because that
is where the action is. Pizza Hut currently has over 25,000 fol-
lowers on Twitter and over a million on Facebook. McDonald’s
has over 13,000 Twitter followers and 1,600,000 on Facebook.
Facebook is now offering a series of ad formats that tell
users which of their Facebook friends have expressed interest
in the brand or product featured in the ad. It is based on data it
collects on the likes and friends of its users. The ad appears on
the right side of a user’s homepage, with an image and head-
line from the advertiser. With the ads are the names of any of
the user’s friends who have clicked on a button indicating they
like the brand or ad.
Facebook had a 16.21 percent share of display-ad views in
the United States in May 2010, up from 6.8 percent in January
2009, according to comScore, Inc., and Yahoo! is in second place
with a 12.1 percent share. They have now commissioned Nielsen
Company to measure ad performance. You can pay either by
click or impression. You can go to the Facebook site and sign up
for your ad. They will take you through the whole process in-
cluding the design.
If your promotion campaign lends itself to video, the place
to go is YouTube. Roughly 50 million users upload videos at an
outstanding rate of twenty-four-hours worth of video every sin-
gle minute, but millions more watch video clips daily. In fact,
YouTube has quickly become the second most popular website
and largest search engine in the world as more people go to
YouTube than watch the Super Bowl. Their site, too, will take
you through the complete process of becoming an advertiser.
YouTube has signed up NPR, Politico, The Huffington Post, and
the San Francisco Chronicle for YouTube Direct, a new method
for managing video submissions from readers.
The Internet Plan 245

Branded entertainment on the web is gaining ground by
the day: “The goal is to extend our reach,” says Ellen Liu, media
director at the Clorox Company in Oakland, California, “and at-
tain a higher level of engagement than is possible through tac-
tics like running 30-second commercials that interrupt
episodes of conventional TV series.”
Twitter, the microblogging and social media site, is quickly
gaining users and is constantly mentioned on the news. Many
companies, like Best Buy, are constantly monitoring Twitter to
determine what is being said about their stores and product of-
ferings. Best Buy has their “Twelpforce” Twitter strategy where
500 people scout the site looking for persons who have ques-
tions about computers, television sets, etc. When a person
tweets about a question on a product that Best Buy carries—or
has a comment about Best Buy—invariably she will receive a
tweet from a Best Buy representative. Here’s a nice story: After
buying a new navigational system at 6
A
.
M
. on the most frenzied
shopping day of the year, Laura S. Kern of Los Angeles could
not figure out why it was not giving her traffic updates. She sent
a message to Best Buy’s Twitter account and within five min-
utes not one but two Best Buy employees responded with fix-it
advice. Bet Ms. Kern is one of Best Buy’s most loyal customers.
IBM and their agency, Ogilvy North America, used web
searches, comments posted on YouTube, and conversations
on Twitter to help develop their award-winning “Smarter
Planet” campaign.
The Magazines Publishers of America is using Twitter to dis-
pel the rumor that the Internet will drive magazines into ex-
tinction. It is running “The Twenty Tweetable Truths About
Magazines,” a campaign made up of factoids about the vitality of
magazines. Various members post them on Twitter. The site is
even being used by companies tweeting for hires as well as job
seekers.
246
The Marketing Plan

If you want links to your website on Twitter or from specific
blogs, check out SponsoredReviews.com. They only charge
$1.67 per link. And if you want bloggers to recommend your
product or service, go to Mylikes.
Following is a worksheet for your objectives and strategies
for the Internet with some objective suggestions. You can pho-
tocopy the worksheet here, or you can print out a copy from
your downloaded Worksheets folder. You will probably need
someone with Internet marketing experience to determine a
realistic number of hits, clicks, etc., for your objectives.
Worksheet 16–1
Internet Plan: Objectives and strategies
Objectives
1. # of hits on SEO: ________________________________________________
______________________________________________________________
2. # of clicks on PPC: _______________________________________________
______________________________________________________________
3. # of clicks on Facebook: __________________________________________
______________________________________________________________
4. # of clicks on Twitter: ____________________________________________
______________________________________________________________
Strategies
1. ______________________________________________________________
______________________________________________________________
2. ______________________________________________________________
______________________________________________________________
3. ______________________________________________________________
______________________________________________________________
4. ______________________________________________________________
______________________________________________________________
The Internet Plan 247

Notes
1. “Smart phones, social networks to boost mobile advertising,”
June 29, 2009; http://in.reuters.com/article/idINLT63327920090629.
2. Emily Steel and Geoffrey A. Fowler, “Facebook Touts Selling
Power of Friendship,” Wall Street Journal, July 7, 2010; http://
online.wsj.com/article/SB100014240527487045450045753530925
63126732.html.
3. Sarah Zucker, “Pepsi Drops Super Bowl to Focus on Face-
book,” February 1, 2010; http://www.brandchannel.com/home/
post/2010/02/01/Pepsi-Drops-Super-Bowl-To-Focus-On-Facebook
.aspx.
4. “Clorox, ConAgra, Maybelline Deals Signal Resurgence in
Web Series Interest,” PlaceVine, November 24, 2009; http://
www.placevine.com/blog/2009/11/24/clorox-conagra-maybelline-
resurgence-in-interest-for-web-series/.
248
The Marketing Plan

You have noticed at the end of each chapter on a marketing
component, I have inserted a copy of the Word document into
which you insert your objectives and strategies for each part of
the marketing plan. These objectives should be written so they
are measurable—because unless they are measurable, you
cannot monitor them. I believe a plan that is not monitored is
not a plan, but just a wish list. You want to monitor your plan
every few weeks and make changes if you are off target. Don’t
wait until the end of the plan year to check your progress be-
cause you may have wasted most of the year by so doing.
You can monitor several of your measurable objectives in-
house. Some of these are your number of sales leads, presen-
tations, and closure rate; Internet clicks; reach and frequency;
and customer service and public relations activities. To moni-
tor other types of objectives such as your customer analysis,
pricing, sales forecasting, and product/service objectives, you
may need some outside help.
You could definitely order a benchmark study in which an
outside research company can pose questions to your current
and potential customers. To test your print advertising, you can
249

use companies such as Starch Research (www.starchresearch
.com) and for broadcast advertising, Ipsos ASI Research (www
.ispos-asi.com). Focus groups can also be used to find answers
to some questions, and although they can be more limited than
a benchmark study, they are frequently less expensive. And of
course, there is the Internet. Each of these methods will be dis-
cussed in the following sections.
In-House Activities
Some marketing people are unaware of all the market data
buried within a company, so your first step is to ask around
about what is available. Your own marketing department may
be a treasure trove. You also want to check with trade associa-
tions, trade journals, and the federal government. The federal
government has more research data than all the research com-
panies combined. The trick is finding where it is. There is also
a ton of information available on the Internet.
Benchmark Studies
Most survey research simply involves surveys among a repre-
sentative sample of individuals. Very carefully designed ques-
tionnaires, usually administered in a structured manner, are
used to guide the interview. They could be about attitudes,
needs, or preferences. The questions could be “closed-end”
(for example, “yes” or “no”) or they could be “open-ended”
(“What do you think of . . .?”). There are no right or wrong an-
swers in survey research. You can find research companies by
checking the Council of American Survey Research Organiza-
tion’s (www.casro.org) more than 325 members and using their
member directory: You insert your market, description of po-
tential customers, and what type of benchmark study you de-
250
The Marketing Plan

sire, and a selection of appropriate organizations will be pre-
sented to you.
There are several types of benchmark studies: personal in-
terviews, telephone, mail, and e-mail. Personal interviews are
the most effective because you can ask more questions, the in-
terviewer can probe and ask follow-up questions, and you can
show graphics. The disadvantages are that they are the most
expensive and take the most time to complete the study. Tele-
phone interviews can save you time and money, but you have
to ask fewer questions and you can’t show graphics. Interviews
by mail cost the least of the three “nondigital” methods, but the
disadvantages are the low rate of return, and the returns may
not represent the universe of respondents you are interested in.
You can also turn to the Internet for your surveys. The In-
ternet allows you to send surveys via e-mail to large numbers
of potential participants who can then fill out the surveys on
their own time—if they choose to fill them out. These surveys
frequently contain similar material to that of surveys done by
companies such as Starch, Roper, and Ipsos ASI. The Internet
surveys can ask a variety of questions on a particular subject
or product offering. For example, the National Basketball
Association, Major League Baseball, and the National Hockey
League have electronic surveys asking fans all sorts of
questions including their feelings and thoughts on that
league’s particular ad campaign, on that league’s particular
broadcasts, which teams fans like, how often fans go to games,
and what fans would prefer to see and do at the game—and
more.
You can use a benchmark study to help determine the size
of your market, your market share, perception of your price,
your complete customer analysis, perception of your business,
perception of competition, and other answers you need for
your fact book and to measure your objectives.
The Research Plan 251
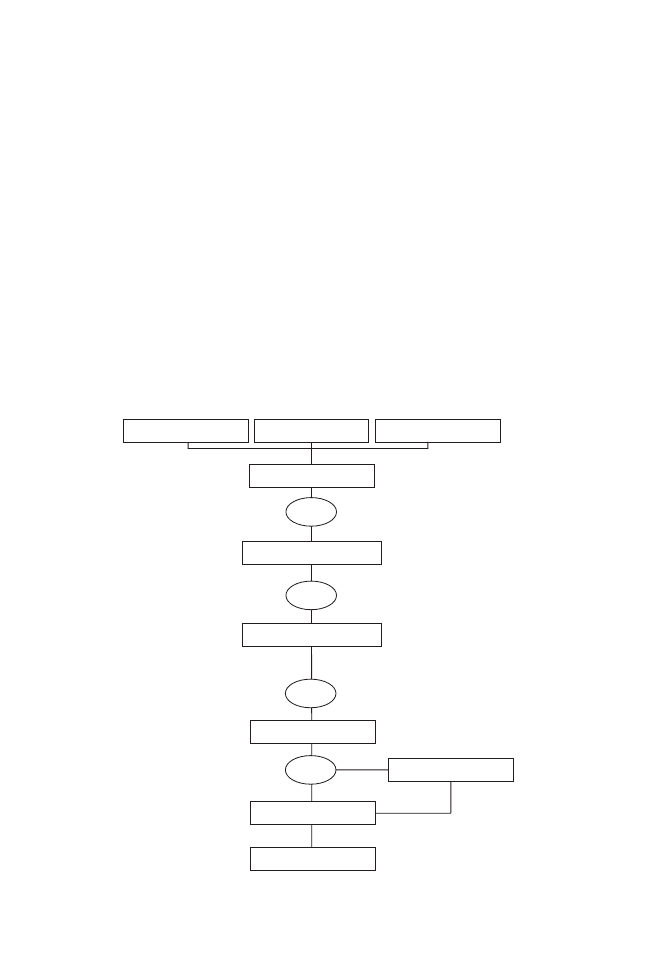
Advertising Research
Figure 17-1 is a flow chart on creative development that I
showed you in Chapter 9, The Advertising Plan. It shows you
the different points in the strategy development process you
need to text. It’s vital that you understand the importance of
testing your advertising concepts.
You can obtain information on benefits sought and benefits
delivered from your benchmark study. You can also test your
Figure 17–1
Creative development testing timeline.
Creative Development
Benefits Delivered
Benefits Sought
Alternate Concepts
Test
Alternate Selling Lines
Perceptions
Test
Alternate Executions
Finished Production
Produce Campaign
Back Up Campaign
Media Schedule
Test
Test
252
The Marketing Plan

The Research Plan 253
various concepts by drawing them on some 8½-by-11 inch
sheets of cardboard and passing them on to the interviewee
like a deck of cards. You then ask about their perception of each
card (or screen, if you are doing this electronically).
Research on Your Print Campaign
Starch Research, Roper Canada, Ipsos ASI, and many other
companies provide valuable research on your print advertis-
ing. These research companies offer surveys conducted by
means of personal interviews with readers of specific issues of
news papers, consumer magazines, and business and profes-
sional publications.
The first objective of any ad is to be noticed. Any research
firm measures this fundamental aspect of advertising perform-
ance, as well as measuring the ad’s ability to communicate
brand association, and the extent of reader involvement in
copy reading. These measures—noting, brand association, and
read most—are reported for each ad in a particular magazine is-
sue. This permits a useful context for evaluation, as ad effec-
tiveness is related to scores for other ads of the same size, color,
and product category.
Ad norms or averages for specific titles provide a further
performance benchmark. Track your own campaign, measure
competitive advertising, and learn which elements contribute
to high readership scores.
All print advertisements are designed to meet specific
communication objectives. Yet few ads are independently eval-
uated to determine whether the intended message is being
conveyed. In fact, some ads inadvertently communicate unde-
sired messages.
These research companies also can provide advertisers
with evidence of advertising effectiveness and the return on

their advertising investment. Typically, these studies will eval-
uate each advertisement on the basis of its creative elements
(interest, innovation, visual appeal, and attention value) as well
as its content elements (clarity, information value, believability,
and persuasiveness). Additionally, communication value, rel-
evance, attitude to the product or advertising, and the amount
of information contained within the ad will be measured in
these studies. An extensive database of norms will provide the
context for evaluation.
One or more concept ads are evaluated to help advertisers
determine the most effective combination of visuals and copy
to achieve the desired communication objectives. Test ads are
inserted into a mocked-up magazine or newspaper that re-
spondents are asked to leaf through. Questions are posed con-
cerning ad recall on an unaided, partly aided, and prompted
basis. Respondents are asked to read the test ad thoroughly and
a diagnostic test is administered.
Research for an Internet Campaign
A source for Internet research you want to check out is
emarketer.com. According to Paul Iagnoco, director of global
digital strategy at Kellogg’s, “With its articles, charts, and
analysis, eMarketer is a whole library of resources for us.
eMarketer is the authority—it validates trends and gives
credibility to what we’re proposing.”
Another is doubleclick.com. The company’s research team
can offer clients deep insights on industry trends, as well as
performance metrics and benchmarks. It provides custom
campaign analyses, manages individual client-driven research
projects, and offers training and best practices presentations
and sessions.
A new company by the name of Omniture (www.omniture
254
The Marketing Plan

.com) delivers its customers traffic data as it happens in real
time, tracking everything from how many people visit a website
to where they’re coming from to how long they linger. Google
and some hosting services provide the same information.
Quantcast (www.quantcast.com) allows you to obtain the de-
mographics of visitors to your site and can now also place you
on sites that meet your demographics.
Below is a worksheet for your research plan objectives and
strategies, which you can photocopy or print out from your
downloaded folder of worksheets. This is where you list all your
measurable objectives from other parts of the plan and spell
out how you are going to monitor them. Be sure you put num-
bers in your objectives so you can keep measuring whether or
not you are hitting your target. If you are not on target, then you
should consider changing your strategies.
Worksheet 17–1
Research plan: Objectives and strategies
Objectives
1. ______________________________________________________________
______________________________________________________________
2. ______________________________________________________________
______________________________________________________________
3. ______________________________________________________________
______________________________________________________________
4. ______________________________________________________________
______________________________________________________________
5. ______________________________________________________________
______________________________________________________________
6. ______________________________________________________________
______________________________________________________________
The Research Plan 255

Strategies
1. ______________________________________________________________
______________________________________________________________
2. ______________________________________________________________
______________________________________________________________
3. ______________________________________________________________
______________________________________________________________
4. ______________________________________________________________
______________________________________________________________
5. ______________________________________________________________
______________________________________________________________
6. ______________________________________________________________
______________________________________________________________

257
What I recommend you do first is to go back through the vari-
ous case histories. Change numbers here and there to see
what happens to the overall goals or objectives of each file (you
can even save your “trysies” with different names). Play
around. Get familiar with each of them. When you feel com-
fortable with the case study files, open up the software with the
files for your data and start inserting some facts or numbers
and then complete your objectives and strategies. You can start
with any file, but I suggest you follow the book.
On customer analysis (see Chapter 4), what you are looking
for is who really makes the buying decision and what turns
them on. You don’t start by describing what your product or
service does, but what it will do for the prospective buyer. You
don’t buy roses for your better half because they are beautiful.
You buy them in the hopes that you will get a kiss.
In Chapter 6 (The Product/Service Plan) I gave you the
choice of four different mousetraps to trap your customers.
Your business needs a personality. A uniqueness. You want to
be a Marriott. A Wal-Mart. Not a General Motors, which has a

blah personality due to their financial problems and boring
advertising.
In Chapter 7 (Caculating Your Marketing Communications
Budget), you were provided with worksheets to help you cal-
culate a budget, and in Chapter 8 (Competitive Analysis), the
worksheets help you compare your product/service to those of
your competitors.
In the chapter on advertising (see Chapter 9), I refer to the
creative strategy. This is a critical document because if you do
not have one, there will be no continuity in your message to
customers. You should have one message for each prospect at
the top of the purchase process, whether you are making a sales
presentation, staffing a booth at a trade show, or sending some
advertising in his or her direction. If you are going after a CEO,
engineer, or housewife, each has a different benefit that turns
him or her on. Find that benefit and that should be the only
message to that particular job description or lifestyle. You also
want to calculate your reach and frequency to be sure you have
the right weight in your advertising expenditures.
Be sure you take advantage of all the facets of sales promo-
tion (see Chapter 10). Once again, be unique. Bring in a fifteen-
foot-tall end-of-aisle display into your retail outlets. Be sure
it’s animated. Offer a 25 cent coupon on your $20,000 pieces
of equipment. Check to see if the cost of your trade shows,
bingo cards, and catalogs are less than the amount of profit they
deliver.
Remember, a favorable publicity story on your business is
worth several ads (see Chapter 11). If one company can get ex-
pansive news coverage on just adding a new department to
their store, you can’t cop out by saying you have nothing inter-
esting to write about. And tie-ins with charity have been very
successful for several companies.
As I said in Chapter 12, The Sales Plan: Pricing, please do
258
The Marketing Plan

not add up your costs and then add an arbitrary markup. You
are not looking at the price that gives you the greatest volume
or the greatest unit margin. You want the price that gives you
the greatest margin in total dollars.
In determining future sales (see Chapter 13), once again
do not use an arbitrary growth percentage. Although this file
is quite large, it takes into account all the factors that will de-
termine your future sales and profit. You will need some re-
search here, as you will to get the data you need for some of
the other files, but it is information you need if you are going
to be a professional planner.
Tell everyone in your company that customer service is not
a department, but an attitude (see Chapter 14). Weren’t you
impressed when you called a business and a live person an-
swered on the first ring? I don’t care if that receptionist costs
that company $100,000 per year; she was more than worth it.
Keeping a customer only costs one-fifth as much as acquiring
a new one.
The Internet is a whole new ball game, especially social
media. If you’re going to use the Internet to get customers—
and in today’s world, that’s pretty much of a must!—do so sen-
sibly. Get in touch with some of the websites I mention in
Chapter 16, and move cautiously. You may want to hire your
own consultant to guide you.
After going through the Excel files inserting your data, the
next step is to contact a research company to help you confirm
your data and fill in any blanks. Contact a research company
that will do a benchmark study (see Chapter 17) for you and
show them all the data you inserted into the software files. They
will then give you a proposal for a study.
After you complete your research, you should be able to
finish inserting your own company data into the software
cells for:
Pulling the Plan Together 259

1. Customer analysis
2. Experience curve
3. Reach and frequency
4. Trade
5. Pricing
6. Sales forecasting
All this information belongs in your fact book and it sup-
ports your objectives and strategies. You also should have com-
pleted your objectives and strategies in the Word files for the:
1. Product/service plan
2. Advertising plan
3. Sales promotion plan
4. Public relations plan
5. Sales plan
6. Customer service plan
7. Internet plan
8. Research plan
All of these plans belong in your marketing plan, along
with your:
1. Positioning strategy
2. Creative strategy
3. Marketing communications budget
4. Competitive analysis
5. Maximizing the high-potential accounts
In addition, you may want to add some overall objectives
and strategies. Your overall objectives could cover factors such
as profit and market share and your overall strategies could deal
260
The Marketing Plan

with your company-wide positioning. Worksheet 18–1 follows.
You can photocopy it, or print out a copy from your downloaded
Worksheets folder.
Worksheet 18–1
Marketing plan: Overall objectives and strategies
Objectives
1. ______________________________________________________________
______________________________________________________________
2. ______________________________________________________________
______________________________________________________________
3. ______________________________________________________________
______________________________________________________________
4. ______________________________________________________________
______________________________________________________________
Strategies
1. ______________________________________________________________
______________________________________________________________
2. ______________________________________________________________
______________________________________________________________
3. ______________________________________________________________
______________________________________________________________
4. ______________________________________________________________
______________________________________________________________
Print out copies of all your completed files and you are
done. Hooray! Remember to keep self-inspecting and using re-
search to continuously monitor your plan.
Pulling the Plan Together 261

This page intentionally left blank

This document will provide you with a handy summary of how
to prepare your own marketing plan, all of which was discussed
in detail in this 4th edition of The Marketing Plan. We will pres-
ent the following topics in abbreviated, outline form.
Section I:
Strategic Position, Marketing Personnel, Fact
Book Summary, and Major Marketing
Objectives and Strategies
Section II:
Product/Service Plan
Section III:
Marketing Communications Plan
Section IV:
Research Plan
Section V:
Customer Service Plan
Section VI:
Sales Management Plan
Section VII: Budget, Timing, Plans, and Action Plans
Section I: Strategic Position, Marketing Personnel, Fact Book
Summary, and Major Marketing Objectives and Strategies
Strategic Position
1. Relative profit potential of this market within the com -
pany. Ex ample: a new market with the highest profit
Appendix A
Marketing Plan Basics
263

potential of all markets in which the business is
currently competing.
2. Critique on company versus competition as to current
status as well as ability to acquire the critical business
strengths needed to become a major player in this market.
3. Definition of strategic position and payout. Example:
Strategic position will be to go for maximum market share
and become market leader with a break-even in five years.
Marketing Personnel
1. State which components of the business are involved in
the marketing function.
2. If you employ an advertising agency, state its role in the
prepa ration of the plan.
3. State the name of the planning leader for the plan, the
members of the planning team, the individual who is
responsible for keeping the fact book up to date, and the
individuals responsi ble for monitoring the various
sections of the plan to be sure the strategies are executed
correctly and the objectives are met.
Fact Book Summary
1. Statement on marketing aspects of the market.
2. Statement on marketing strength of competition.
3. Definition of target audience.
4. Delineation of company marketing strengths and
weaknesses for competing in this market.
Major Marketing Objectives
1. Market share objectives.
2. Distribution and depth of line objectives.
264
Appendix A

3. New product/service introduction objectives.
4. Awareness, preference, and sales closure rate objectives.
5. Repeat purchase rate and volume/profit per purchase
objec tives.
6. Marketing budget and timing.
7. Gross sales, gross margin, operating margin, and net
profit objectives (sum of all functional plans: R&D, engi-
neering, man ufacturing, operations, marketing, and
G&A).
8. Return-on-investment (ROI), return-on-assets (ROA), re-
turn-on-net-assets (RONA), and/or discounted cash flow
(DCF) objec tives (sum of all functional plans).
Major Marketing Strategies
1. Positioning statement. Example: Position the brand in
the seg ment of the market of consumers who desire
more prepro grammed options, thus extending the use
and value of the brand. This target is the numbers-
oriented person (e.g., the engineer, aviator, accountant,
or retailer).
2. Distribution strategy. Example: Position the brand
among deal ers as the most attractive service to the
above-mentioned target, one that is not currently being
reached by brands Able and Baker and thus not a dupli-
cation of inventory. Develop in-store merchandising
units to demonstrate and allow consumer to “work”
new model, thereby reinforcing brand difference at
point of sale.
3. Communications strategy. Example: Thrust of marketing
com munications will be consumer “pull” rather than
dealer “push.” Dealer push is when you sell on price.
Build brand awareness and recognition of brand
Marketing Plan Basics 265

difference with target consumer, first through specialized
media and later through mass media.
4. Pricing strategy. Example: Price competitively with major
com petition.
Section II: Product/Service Plan
Product/Service Plan Objectives
1. Set objectives for subjects such as allocation of marketing
dollars per product/service, distribution, depth of line,
packag ing, pricing, awareness, preference, and repeat
purchasing.
2. Examples:
a. Model 1040 and 1041 will receive 90 percent of market-
ing dollars due to higher profit margins.
b. Increase the average price to $1,961 on models 1040
and 1041.
c. Expand distribution among chains from 29 percent to
50 percent, among department stores from 50 percent
to 75 percent, and among independents from 17 per-
cent to 35 percent.
d. Reduce packaging costs to $2.50 for chains, $2.25 for
de partment stores, $1.50 for owned and operateds
(O/O), and $3.00 for independents.
Product/Service Plan Strategies
1. Set one or more strategies for each objective.
2. Examples:
a. All advertising and sales promotion will feature mod-
els 1040 and 1041. In addition, sales force will receive
double bonus points on these two models.
266
Appendix A
Openmirrors.com

b. Prices will be raised for O/Os and independents to
$2,100, coupled with the company’s pledge for greater
advertising support. Chain and department store
pricing will remain the same.
c. Major expansion in distribution will be obtained
through a 35 percent increase in the sales force and a
25 percent in crease in the communications budget.
d. The new technology on vacuum packaging developed
last year by R&D will be used for all models within the
next two years.
Product/Service Plans
1. Develop at least one plan for each above strategy. The
plan states how you plan to execute the strategy.
2. Summarize the plan in the marketing plan and put the
data in action plans. The action plan should include each
step or task, who is responsible for each step or task, and
the date by which each step or task has to be completed.
If the strategy is to use trade shows to accomplish a
certain objective, then the action plan should delineate
each step necessary to execute the strategy, including se-
lecting the shows, booking the space, designing the
exhibit, and determining who will attend.
Section III: Marketing Communication Plan
Marketing Communications Plan Objectives
1. Include objectives on advertising, sales promotion, and
public relations.
2. Advertising Plan examples:
a. Among senior data processing professionals in
companies with sales over $20 million: increase
Marketing Plan Basics 267

awareness of Ryan minicomputer from 30 percent to
50 percent; increase asso ciation with major selling
point (more data storage per dollar) from 25 percent
to 40 percent.
b. Among dealers of small computer systems, increase
aware ness of brand.
3. Sales Promotion Plan examples:
a. Demonstrate high-impact resistance of new housing
on en ergy monitor to 300 design engineers.
b. Reduce sales time necessary to educate purchasing
agents on specifications of thermocoupler line from
an average of ninety minutes to thirty minutes.
c. Generate $50,000 in direct sales of replacement parts.
d. Reduce the number of unqualified leads sent to the
sales force by 50 percent.
4. Public Relations Plan examples:
a. Placement of two major articles in general business,
news magazines, or Internet.
b. Placement of major article on new Series 100 line in
every data processing publication.
Marketing Communications Plan Strategies
1. Set one or more strategies for each above objective.
2. Advertising Plan examples:
a. Creative strategy:
i. Major benefit: more data storage per dollar.
ii. Copy points: Competitively priced; offers twice the
num ber of circuits per chip; supports 30 percent
more sectors per track versus competition.
b. Media strategy:
i. Reach 65 percent of senior data processing profes-
sionals in companies with sales over $20 million
268
Appendix A

with a frequency of eight over a twelve-month
period.
ii. Concentrate all media dollars in the leading trade
vertical magazine, adding second magazine in the
field only if necessary to reach required reach.
3. Sales Promotion Plan examples:
a. To demonstrate impact resistance of new housing,
take a booth in July WESPLEX show and design
exhibit offering a prize to anyone checking housing
with sledge hammer. Publicize exhibit and prize by di-
rect mail to design engineers.
b. Review brochures on thermocoupler line to incorpo-
rate com plete specifications and clear explanation to
differences between each item in the line.
c. To build direct sales program for replacement parts,
start with list of customers with models between the
ages of three and five. Set up system of twenty-four-
hour handling of orders. Stress that fast service results
in less downtime for customer.
4. Public Relations Plan examples:
a. Use lure of exclusive sneak preview of Series 100 line
and/or set up exclusive interview with CEO for major
business/newsweekly article.
b. Fly in editors of all data processing publications for
preview of Series 100 three months before introduction
to secure major coverage in their May editions.
Section IV: Research Plan
Research Plan Objectives
1. Set objectives for methods you will use to measure the
effective ness of your marketing plan, changes in the
market, and new product/service development.
Marketing Plan Basics 269

2. Examples:
a. Conduct a statistically projectable study of the target
audi ence to obtain current levels on awareness, reg-
istration of selling message, preference, and intent
to buy.
b. Determine needs of the company’s customers and the
cur rent ranking of the company’s customer service
department concerning the competition.
c. Determine two leading benefits of new model 707 to
the aircraft instrumentation industry.
Section V: Customer Service Plan
Customer Service Plan Objectives
1. Set objectives for the performance of customer service
(e.g., effectiveness ranking within the industry, manage-
ment involve ment, marketing involvement, knowledge of
product/service line, number of telephone rings before
response, cost of han dling returns, and expertise of tech-
nical personnel).
2. Examples:
a. Company will be ranked number one in the industry
in customer service effectiveness within two years.
b. All phones will be answered by the third ring.
c. Customer service personnel will have access to all
marketing information available to product mangers.
Customer Service Plan Strategies
1. Set one or more strategies for each objective.
2. Examples:
a. All customer service personnel will be given a free
weekend trip to either Disneyland or Disney World to
permit them to observe the finest customer service or-
ganization in the world.
270
Appendix A

b. An independent company will be commissioned to
answer any customer service phone after two rings.
The customer service department will be charged the
complete cost, which will be deducted from customer
service employees’ bo nuses.
c. All customer service personnel responsible for
product/ser vice knowledge will have access to a data -
base that will allow them to bring up any type of infor-
mation on any product/service sold by the company.
Section VI: Sales Management Plan
Sales Management Plan Objectives
1. Set objectives on subjects such as sales goals per product/
service line, sales closure rate, cost per sales call, number
of sales calls per day, and sales training.
2. Examples:
a. Maintain current field force of twenty people on
service A and increase sales from $910,113 to $995,000.
b. Increase average sales closure rate from current 22
percent to 28 percent.
c. Average 20 percent of sales force calls by field force on
service B to frequent travelers to speed up penetration
of this market.
d. Increase division profitability by increasing sales of
service C from 30 percent to 35 percent.
Sales Management Plan Strategies
1. Set one or more strategies for each objective.
2. Examples:
a. Improve field sales force productivity on service A
through a combination of efforts including forming
home office unit with 1-800 telephone number lines
Marketing Plan Basics 271

to take over customer tracking and routine reorders
and creating series of direct-mail pieces to qualify in-
quiries before sending to field.
b. To increase closure rate, a minimum of one-third of
the entire sale force will be sent to a new one-week
session for sales training that will incorporate a new
concept of “town meeting” dialogue to improve each
individual’s ability to close.
c. To increase penetration of service C, hire ten new
salespeo ple to work as task force rolling out service as
each new region is targeted.
d. To increase proportion of sales of service C, create
bonus compensation plan based on points awarded
according to margins on various services.
Section VII: Budgets, Timing, Plans, and Action Plans
Budgets
All objectives should be measurable to enable you to deter-
mine whether you meet them. That means they require a goal,
a control, and timing or date. In the preceding pages there are
several examples of objectives with goals. Put the control (usu-
ally the amount of money to be spent) or the budget in each
objective, or you can put the control for each objective in sum-
mary form at the end of the plan.
After you have approved goals and controls, monitor them
each week to be sure you are on target. If you are off target
sometime during the year, you have to change either the goal or
the control or alter the strategy.
Timing
Timing refers to the date by which the objective must be
achieved. Like controls, the timing can be inserted in each ob-
272
Appendix A

jec tive or can be summarized at the end of the plan. Like con-
trols, timing has to be continuously monitored.
Plans
Plans are the execution of the strategies. They should be summa -
rized in the marketing plan. After the complete marketing plan is
approved, action plans should be written to provide the details. If
you include all the details of executing a strategy in the marketing
plan itself, you may be confronted with three possible problems:
1. You end up with a 50- to 200-page document that no one
will read, and the plan just gathers dust on the shelf.
2. If the plan is not approved, you have wasted time
developing all the details.
3. Using a separate action plan lets the people who will ac-
tually execute the plan decide for themselves how they
should do it.
Action Plans
An action plan contains the detailed execution of one or more
strategies and should include at least three factors:
1. Each necessary step or task
2. Who will be responsible for accomplishing each step
or task
3. The required completion date of each step or task
For each marketing plan, you may have between five and
twenty action plans. The sum of all your action plans are your
milestone calendar or perk chart. A milestone calendar keeps
you on target relative to timing. A perk chart determines which
completion dates for certain steps or tasks are the most critical
and have to be watched most closely. These critical steps or
Marketing Plan Basics 273

tasks are the ones that influence the beginning of another step
or task.
Keep your action plans in separate documents. Your fact
book should also be in a separate binder. This will enable you
to have a short, concise, operational marketing plan that you
can refer to each week. If your marketing plan is not opera-
tional, the prepara tion is nothing more than an exercise. These
documents can also be on your server, with all employees hav-
ing access through their own computer.
274
Appendix A

I. Working with advertising agencies:
A. Relationship should be as business partner, not
adversary.
B. Recognize the business versus creative conflict.
C. Recognize that the account representative is usually
not rewarded for above-average profit on the account,
but for quality of account team performance and
client satisfaction.
D. Involve the agency in your business:
1. Provide them with more information than they
need—marketing plans, sales analyses, salesmen’s
reports, lab reports—about your specific business.
2. Invite them to visit the factory, sales meetings,
management conferences, trade shows; the more
they know about your business in general, the bet-
ter they can help you.
3. Take a writer and media buyer to lunch; get to
know their business.
E. Be sure the agency is adequately compensated for the
work you expect of them.
Appendix B
Everything You Need to Know About
Working with an Advertising Agency
275

F. Pay agency invoices on time so that agency does not
have to use its own funds to cover media invoices.
G. Avoid misunderstandings by having written
summaries of the basis for compensation, explicit
billing procedures, and normal lead times for produc-
tion that, if adhered to, will avoid overtime charges.
H. Insist the agency provide conference reports on all
client contacts, delivered to your office within two days.
I. When there is a problem, bring it up immediately.
If not resolved to your satisfaction, go higher up in
agency management chain. Annually, prepare a writ-
ten evaluation of the agency; document the good, the
bad, and the ugly.
J. Write letter or send an e-mail to agency management
when a member of account team provides exceptional
contribution.
II. Agency compensation
A. Compensation is based on many factors:
1. Number of ads prepared.
2. Number of services from agency.
3. Number of client approval levels.
4. Number of times plans and budgets changed dur-
ing year.
5. Amount of information supplied to agency.
6. Detail involved in media purchases.
B. Service expectations:
1. Rule of thumb: Between 25% and 33% of agency in-
come on an account will go to direct salaries to
those working on that account.
2. Example: If there’s $1 million in billing and agency
income is $150,000 (15%), then the agency would
put between $38,000 and $50,000 in salaries
against account.
276
Appendix B

C. Forms of compensation
1. Commission
a. Usually 15% of gross on media and production
materials purchased. For the client, the
advantage is that the amount varies with budget
and is easy to compute; disadvantage is that it’s
not related to amount or quality of service.
b. For the agency, the advantage is that it shares
in success as the budget grows; disadvantage
is if the budget is cut back at end of year when
all the work is done, budget may be too small
to generate income to cover services
demanded.
2. Retainer
a. Monthly fee that may amount to more or less
than 15% commission, but must be paid regard-
less of budget fluctuations.
b. For the client, the advantage is that it’s related
to amount of service rendered; the disadvantage,
that it must be paid even if budget is severely
reduced.
c. For the agency, the advantage is an even cash
flow with an assured certain income; disadvan-
tage is they do not share benefits of increased
sales and advertising budget.
3. Flat fee
a. A stated or negotiated fee for a given project or
type of work. Usually in addition to commission
or retainer.
b. Can be used for art direction, mechanical
preparation, creative work on collateral promo-
tion material, supervision of research projects,
concept work for new products, etc.
Everything You Need to Know About Working with an Advertising Agency 277

c. For the client, the advantage is compensation
related to service; disadvantage is determining
appropriate fee.
d. For agency, advantage is providing income for
extra services, supplemental payments can be re-
quested if original negotiated fee is inadequate;
disadvantage is that client may think the agency
is charging too much.
4. Cost plus
a. Agency income is based on actual costs plus
guaranteed profit such as 10%, billed monthly.
b. For the client, advantage is related to service
provided; disadvantage is that it may result in
more service than is needed.
c. For the agency, the advantage is the assurance it
can meet client requirements and still make
profit; disadvantage is it is limited to average
profit, and accounting is complicated.
5. Bonus
a. Additional compensation to agency for meeting
stated goal or goals.
b. Goals may be share of market, sales, and/or
awareness and preference—or anything else the
client and the agency have agreed on.
6. Combinations
a. Any combination of above methods may be
appropriate for a given client. Some examples
follow.
b. Monthly retainer plus 5% commission.
c. For industrial accounts, 15% commission plus
flat fee for creative work on each ad.
d. Monthly retainer for account service, flat fee for
creative work, media purchased in-house.
278
Appendix B

III. Agency evaluations
A. Informal evaluation
1. Several times a year you should evaluate the
agency and take steps to fix problems before they
become unmanageable
2. Yardsticks:
a. Are our ads better than our competitors?
b. Are projects moving ahead of schedule?
c. Does account team understand our business?
d. Is billing timely, accurate, and within estimate?
B. Formal evaluation
1. Objective: improve advertising.
2. Danger: discourage or alienate agency personnel.
3. Essential: perspective on relative importance of
factors being rated; for example, creative quality is
more important than timely conference reports.
4. Develop checklist of factors of performance related
to your needs. If rating scale used, also provide for
statements why high or low ratings were given, as
well as providing an overall evaluation of strengths
and weaknesses of the agency.
5. Get input from and review evaluation with your
management concerned with agency performance.
6. Review written evaluation personally with head of
agency and account representatives. Request writ-
ten response from agency in two weeks.
IV. Letter of agreement
A. Services to be performed by agency.
B. Compensation based on:
1. Media space.
2. Media production.
3. Creative fees.
4. Sales promotion.
Everything You Need to Know About Working with an Advertising Agency 279

5. Research.
6. Printing.
7. Agency travel.
8. Other compensation.
9. Items billable without compensation.
C. Agency legal liability/indemnity for ad content and
product performance.
D. Right to review pertinent agency records.
E. Financial working procedures.
1. Terms of payment of invoices.
2. Billing of production and sales promotion on com-
pletion or monthly as accrued.
3. Cash discount.
4. Estimates for expenditures over $200 with revisions
if they are exceeded by 10%.
5. Client approval procedures.
6. When competitive bids are required.
7. Media invoices submitted no more than 30 days
prior to being due to media; client allowed 10 days
to pay agency.
8. Non-media invoices supported with copies of
invoices from outside suppliers.
F. Termination.
1. Must give 90-day notice.
2. Compensation provided during 90 days.
3. All materials and information to be returned.
V. Terminating the agency
A. Give three months to perform to your satisfaction.
B. If no improvement, give notice of termination with
compensation to continue for 90 days or as stated in
letter of agreement.
C. Work out dates when termination will be announced
to agency personnel, client personnel, and to the press.
280
Appendix B

VI. Selecting a new agency
A. Determine your criteria for a new agency.
1. Services required.
2. Size of agency relative to your budget.
3. Agency experience in your business.
4. Local versus out of town.
5. Preferred amount and method of compensation.
B. Select ten or twelve contenders.
1. Agencies doing ads you admire.
2. Suggestions from other ad managers.
3. Yellow pages.
4. Red Book (standard directory of agencies).
5. Ad Club, BPAA.
6. AD AGE billing issue.
7. Media representatives.
8. Consultant.
C. Contact contenders.
1. Letter or e-mail to agency head
a. Ask if interested and if any conflicts.
b. Tell them who you are; send products, budget,
annual reports.
c. If they are interested, ask to visit office for a one-
hour tour and conversation.
d. If they aren’t interested, ask them to
recommend other agencies.
2. Visit agency office to check for:
a. Chemistry/personalities.
b. Number of employees.
c. Atmosphere.
d. List of current clients.
e. Permission to contact certain clients.
3. Cut down your prospects to between three and five
and ask them for formal presentations.
Everything You Need to Know About Working with an Advertising Agency 281

D. Handling inquiries
1. Have ready response to the press and to agencies
not on contender list.
2. For press, “no comment” or prepared statement
with optional facts, such as:
a. List of contending agencies.
b. Why the former agency was terminated.
c. Whether additional agencies will be considered.
d. Amount of advertising budget.
e. When decision on new agency will be made.
3. Set up a system to handle agencies who call.
a. Send information on company.
b. Send questionnaire on their list of clients,
billings, number of employees, sample of print
ads, why they might do a good job for you.
E. Formal presentation
1. Length: three hours. Portion of meeting to cover set
questions, content of the remainder of time should
be left to the agency. Provide written guidelines.
Allow three weeks preparation.
2. Set questions to be covered:
a. Agency history.
b. List of clients.
c. Selection of ads done by creative people still at
agency.
d. Background of key people.
e. How they plan to learn your business.
f. How they typically develop a campaign.
g. How they typically develop a media plan.
h. How they charge for services.
i. Special services you may require.
282
Appendix B

3. Specify in advance whether or not you will look at
speculative creative work and if the agencies will be
compensated for same.
4. Specify that any ideas advanced to you may be
used by you with no, or specified, compensation to
the agency.
F. Implementing the decision.
1. Make decision within 24 hours.
2. Make sure compensation arrangements are clear.
3. If the agency is small, check its credit rating.
4. Call losers personally and follow with thank-you
letter.
5. Send a case of champagne to agency on the same
day that you notify them of their appointment.
6. Work out letter of agreement.
Everything You Need to Know About Working with an Advertising Agency 283

This page intentionally left blank

ABC Banners, 240
account executives (advertising
action plans, 18, 273–274
administration (profit and loss matrix),
AdMob, Inc., 244
advertising, 258, 268–269
banner, 239–240
in market life cycle, 40
pay-per-click, 238–239
pop-up, 239–240
print, 253–254
research for, 252–253
see also promotion; public relations
advertising agency(-ies), 275–283
compensation of, 276–278
evaluations of, 279
letter of agreement with, 279–280
selecting, 23–25, 281–283
termination of, 280
working with, 275–276
advertising plan, 117–138
for magazines, 127, 131
and media plan, 129–136
and media strategy, 126–129
for newspapers, 128, 136
for outdoor ads, 127, 131
for radio, 127–128, 131, 136
for television, 128, 136
AFLAC, 119
Amazon, 238
American Express, 142, 144–145
Anheuser-Busch, 35, 48
Apple, Inc., 12, 67, 93, 110, 163, 242
AT&T, 21, 67, 68
average market selling price (share of
market matrix), 186
average number units repeat transaction
(unit and dollar volume matrix), 185
average number units trial transaction
(unit and dollar volume matrix), 185
average repeat purchase cycle (repeat
purchases matrix), 180, 182
backward vertical integration, 92
banner advertising, 239–240
Barnes & Noble, 140–141
benchmark studies, 112, 250–251
Best Buy, 246
Bing, 10
Bloomingdale’s, 67, 70, 113, 144, 154
Boeing, 93, 119
brand development, 67–71, 219, 265–266
by Girl Scouts, 158
and Internet plan, 243
positioning statements in, 69–71
successful, 12–13, 67, 68
brand managers, 22–23
brand personality, 69–71
285

breakeven points, 168–169
British Airways, 73, 95
brochures, 144–145
budgets
marketing communications, see mar-
keting communications budget
objectives for, 272
Budweiser, 48, 67, 73–75
Burger King, 144
Busch, August, III, 49
business plans, 13–17
Buss, Dale, on Girls Scouts’ branding, 158
buy-back coupons, 141
buying decisions, 58
capital-intensive markets, 44
catalogs, 145
cell phones, 241–244
charity, 157–158
Chrysler, 142
Chubb Insurance, 120, 123
Cisco, 10, 35, 67, 111
Clear Channel Communications, 241
“closure rate,” 146, 148
Coach, 110
Coca-Cola Company, 94, 110
community relations, 160
company development, 219
compensation, of advertising agencies,
competitive analysis, 109–115
of distribution/customer service, 113
of manufacturing, 110–111
of promotion, 111–112
of quality, 110
of research and development, 115
of retailing, 112–113
of sales force, 114–115
competitive strength, 35–38
content-based websites, 237
contests, 143
Coolidge, Calvin, on sin, 68
Corel, 240
corporate sponsorship, 160
costs
of design engineering, 28, 46
fixed, 49, 163–165, 169, 171
of manufacturing, 28, 46
of marketing, 28, 46
of operations, 28, 46
of research and development, 28, 46
variable, 164–166
Council of American Survey Research
Organization, 250
coupons, 140–141
Crayola, 12
creative departments (advertising
agencies), 24
creative plan (advertising), 136–137,
creative strategy (advertising), 118–126,
Cross pens, 69
cumulative aware (trial transactions
matrix), 179
cumulative second repeat (repeat
purchases matrix), 182
cumulative trial (trial transactions
matrix), 180
customer, net profit by, 208–213
customer analysis, 55–66, 257
and advertising, 118
benchmark studies for, 251
and delivery of benefits, 63–65
market segmentation in, 55–59
research and examination in, 61–63
customer perceptions, 159
customer service, 259
competitive analysis of, 113
plans for, 270–271
strategy for, 95
customer service plan, 197–200
and customer service policies,
internal monitoring in, 198–199
customer service websites, 237
cyclical markets, 49, 50
Days Inn, 74
DCF, see discounted cash flow
Dell, 33, 163
Delta Airlines, 159
depth of line, 110
design engineering, 28, 46
differentiation, 110
direct mail, 145
discounted cash flow (DCF)
calculation of, 79, 84–87, 97–98
and pricing, 88, 91, 169–170, 172, 173
286
Index

distribution
competitive analysis of, 113
expansion in, 267
strategy for, 95, 265
distribution (trial transactions matrix),
DM2PRO, 242
dollar repeat (unit and dollar volume
matrix), 185
dollar share of market (share of market
matrix), 187
dollars total (unit and dollar volume
matrix), 185
dollars trial (unit and dollar volume
matrix), 185
DoubleClick, 239, 254
Dow, Roger, on goals for trade shows, 151
DuPont, 11, 69, 92
economies of scale, 36
electronic coupons, 141
eMarketer, 254
engineering
costs of, 28, 46
strategy for, 95–96
estimated sales, 219
experience curve, 75–76
calculating, 76–83
savings related to, 97, 98
strategy models for, 87
taking advantage of, 35–36
Facebook, 242, 245
fact book, 2, 3, 17, 260, 264
Family Dollar, 143
FedEx, 68, 95
first repeat (repeat purchases matrix),
fixed costs
control of, 49
and pricing, 163–165, 169, 171
Flemming Zulack Williamson Zauderer
LLP, 14
Flipboard, 242
focus groups, 250
Ford, 124
forecasting, 203–235
by maximizing high-potential
accounts, 215–235
by net profit by customer, 208–213
by net profit by product/service,
by sales volume by customer, 204–208
forward vertical integration, 92
Foursquare, 242
frequency (advertising), 129
Fresca, 94, 154
Fuller, Steve, on paper catalogs, 145
future sales, 175–196
of new products and services, 192–195
range profit in, 188–190
repeat purchases in, 180–183
share of market in, 186–188
trial transactions in, 176–180, 193
unit and dollar volume in, 183–186
Geico, 136
general and administrative (G&A)
expenses, 46
General Motors (GM), 38, 141, 257–258
Geomentum, 125–126
Girl Scouts, 158
GM, see General Motors
Godiva chocolates, 69
Google, 10, 242, 244, 255
Google AdWords, 241
gross margin (profit and loss matrix), 189
Haagen Dazs, 69
Hamm’s Beer, 143
Hanson, Bjorn, on Marriott’s brand, 74
Harris Interactive, 241
Hasselblad cameras, 74
Hawaiian Punch, 68–69
Hewlett-Packard, 33, 163
high marginal income, 167–169
high-potential accounts, maximizing,
see maximizing high-potential
accounts
Holiday Inn, 144
Hopper, Dennis, 16
Iacocca, Lee, 141–142
Iagnoco, Paul, on eMarketer, 254
IBM, 21, 35, 39, 95, 216, 246
income
marginal, 166–169
net, 168, 169
in-house activities, 250
Intel, 67
Index 287

internal marketing, 159–160
Internet plan, 237–247, 259
banner ads in, 239–240
for cell phones and smartphones,
pay-per-click programs in, 238–239
pop-up advertising in, 239–240
search engine optimization in, 240–241
social media in, 244–247
and types of websites, 237–238
Internet research, 254–255
Internet surveys, 251
Intuit, 120, 122
Ipsos ASI Research, 250, 251, 253
J.C. Penney, 34
Johnson & Johnson, 68
Jones, David, on advertising, 243
Kern, Laura S., 246
Kmart, 34, 160
Kumar, V., 198
Lampert, Edward, 34
learning curve, 36
letters of agreement, with advertising
agencies, 279–280
Liu, Ellen, on social media, 246
low marginal income, 167–169
Macy’s, 55
Madison Square Garden, 127
magazine advertising, 127, 131
Magazines Publishers of America, 246
Major League Baseball, 251
Make Your Banners, 240
Mandarin Oriental, The Hotel Group,
manufacturing
competitive analysis of, 110–111
costs of, 28, 46
and services, 199
strategy for, 95–96
marginal income, 166–169
market analysis, 27–53
of competitive strength, 35–38
market cost structure in, 43–46
of market growth, 33–35
and market life cycle, 28, 38–41
market physical structure in, 47–51
of market size, 31–33
and price sensitivity, 42–43
profit potential in, 27–30
marketing
costs of, 28, 46
internal, 159–160
objectives for, 264–265
personnel working in, 21, 264
sales as part of, 192
vice president of, 22
see also specific headings
marketing (profit and loss matrix), 189
marketing communication plans, 267–269
marketing communications budget,
depth of line worksheet for, 107
importance to customer worksheet
for, 105
market growth worksheet for, 104
market share objective worksheet for,
new products/services worksheet for,
participant market factor worksheet
for, 102
plant utilization worksheet for, 104
premium or discounted pricing work-
sheet for, 106
recap worksheet for, 108
relative quality worksheet for, 106
standard vs. custom products/services
worksheet for, 107–108
typical sales transaction amount
worksheet for, 105
marketing management, 21–25
and choice of advertising agency, 23–25
departmental coordination in, 21
organizational setup for, 22–23
marketing plan
components of, 3–6, see also specific
components
size of, 2, 18
summary of, 263–274
marketing units (MUs), 219–220, 223
market life cycle
and profit potential, 28
stages of, 38–41
market pricing and value matrix, 190–192
market profit potential, 27–30, 51–53, 56
market(s)
cost structure of, 43–46
cyclical, 49, 50
288
Index

determining your, 10
discovering new, 10
growth of, 33–35
physical structure of, 47–51
seasonal, 48–50
service, 45
share of, 186–188, 205
size of, 31–33, 251
market segmentation
in customer analysis, 55–59
as factor in market physical structure,
market share, 102, 251
Marriott Hotels, 73, 74, 95, 110
Mars, Incorporated, 143
maximizing high-potential accounts,
by determining number of share
points and cost per marketing unit,
220–223
by estimating sales potential and
company development, 217–220
examples of, 224–233
McDonald’s, 67, 110, 142, 157, 245
McKinney (advertising agency), 136, 137
Mediabrands, 125
media departments (advertising
media plan (advertising), 129–136
media strategy (advertising), 126–129
Memorial Sloan-Kettering Cancer
Center, 120, 121
Merck, 35
Microsoft, 10, 109, 242
Midwest Express, 197
milestone calendars, 273
Miller Brewing, 48
MillerCoors LLC, 11
Mininni, Ted, on resonant brands, 12–13
mobile phones, 241–244
Montessori schools, 74
MUs (marketing units), 219–220, 223
Mylikes.com, 247
National Basketball Association, 251
National Football League (NFL), 157
National Hockey League, 251
Neiman Marcus, 67
net income, 168, 169
net present value, 170
net profit
by customer, forecasting by, 208–213
by product/service, forecasting by,
New Jersey Nets, 127
newly aware (trial transactions matrix),
newspaper advertising, 128, 136
news releases, 155
new trial (trial transactions matrix), 179
new triers (repeat purchases matrix), 182
New York Times, 154
NFL (National Football League), 157
Nielsen Company, 241, 245
Nordstrom’s, 197
objectives, 17–19
OfficeMax, 140
Ogilvy North America, 246
Omniture, 254–255
operating profit, 46–47
operations, 28, 46
Oracle Corporation, 11, 93
other costs (profit and loss matrix), 190
outdoor advertising, 127, 131
OXO, 12
P.A. Semi, 93
Panera Bread, 74
participant market factor, 101
pay-per-click (PPC) programs, 238–239
PepsiCo, 11, 93, 244
percent triers repeat continuously
(repeat purchases matrix), 182
percent triers repeat once (repeat
purchases matrix), 180, 182
percent triers repeat twice (repeat pur-
chases matrix), 182
perk charts, 273
Petersen, J. Andrew, 198
Philip Morris, 48
Pizza Hut, 245
planning process, 9–19
business plan in, 13–17
strategic plan in, 10–13
use of fact book in, 17–18
point of purchase (POP) displays, 142–143
Poise, 16
pop-up advertising, 239–240
positioning statements, 69–71, 265
potential buyers aware (trial
transactions matrix), 179
Index 289

potential buyers trying (trial
transactions matrix), 180
PPC (pay-per-click) programs, 238–239
price deals, 139–140
price per unit (unit and dollar volume
matrix), 185
price sensitivity, 42–43
price/volume relationship, 167–168
pricing, 163–173, 258–259
determining breakeven points for,
and discounted cash flow, 88, 91,
and fixed costs, 163–165, 169, 171
as part of sales plan, 190–192
and price/volume relationship,
strategy for, 87–91, 266
and total marginal income, 166–167
print advertising, 253–254, see also mag-
azine advertising; newspaper
advertising
Procter & Gamble, 22–24, 35, 94, 141
product(s)
forecasting by net profit by, 213–215
new, 192–195
objectives for, 266
perceived value of, 42
plans for, 267
and public relations, 153–157
quality of, 110
strategies for, 266–267
product/service plan, 73–99
customer service and distribution
strategy in, 95
and discounted cash flow, 79, 84–87,
experience curve in, 75–83, 87, 97
manufacturing and engineering strat-
pricing strategy in, 87–91
promotion strategy in, 94–95
sales strategy in, 95
and value added, 92–93
profit
net, 208–215
operating, 46–47
range, 188–190
profit and loss matrix (sales plan),
profit before taxes (profit and loss matrix),
profit potential, market, 27–30, 51–53, 56
projectability, 65
promotion, 269
advantages of, 258
competitive analysis of, 111–112
strategy for, 94–95
with videos, 245
see also advertising; sales promotion
plan
promotional websites, 237
public relations, 258, 269
public relations plan, 153–161
charity in, 157–158
community relations in, 160
and customer perception, 159
and internal marketing, 159–160
product/service publicity in, 153–157
purchase process, 60–63
purchase rate, 110
Quantcast, 255
Quattro Wireless, 242
radio advertising, 127–128, 131, 136
R&D, see research and development
reach (advertising), 129
Reeves, Rosser, on changing campaigns,
regulatory exposure, 49–50
reliability, 65
repeat continuously (repeat purchases
matrix), 182
repeat percent of total dollars (unit and
dollar volume matrix), 186
repeat purchases matrix (sales plan),
repeat % total transactions (repeat pur-
chases matrix), 183
research and development (R&D)
competitive analysis of, 115
costs of, 28, 46
and market life cycle, 39–40
markets requiring high levels of, 43–44
research plan, 249–255, 269–270
advertising research in, 252–253
benchmark studies in, 250–251
in-house data for, 250
for Internet campaigns, 254–255
290
Index

for print campaigns, 249–250,
retailing, 112–113
return on investment (ROI)
and discounted cash flow, 79
and market cost structure, 44
and market share, 32
Reynolds Metals, 92
Rite Aid, 143
ROI, see return on investment
Roper, 251
Roper Canada, 253
Ross, Eddie, 144
sales
estimated, 219
forecasting by volume of, 204–208
future, see future sales
strategy for, 95
see also pricing
sales (profit and loss matrix), 189
sales closure rate (trial transactions
matrix), 179
sales development, common mistakes
sales force, 114–115, 266
sales management, 271–272
sales plan(s), 163–173, 175–196
determining breakeven points in,
discounted cash flow in, 169–170, 172,
fixed costs in, 163–165, 169, 171
forecasting by maximizing high-
potential accounts, 215–233
forecasting by net profit by customer,
forecasting by net profit by
product/service, 213–215
forecasting by sales volume by
customer, 204–208
for new products and services, 192–195
price/volume relationship in, 167–168
range profit in, 188–190
repeat purchases in, 180–183
share of market in, 186–188
total marginal income in, 166–167
trial transactions in, 176–180, 193
unit and dollar volume in, 183–186
see also pricing
sales presentations, 148–149
sales promotion plan, 139–152
brochures in, 144–145
coupons in, 140–141
direct mail in, 145
point of purchase displays in, 142–143
price deals in, 139–140
samples in, 141–142
sweepstakes and contests in, 143
trade shows in, 146–151
see also promotion
sales volume by customer, forecasting
samples (promotional), 141–142
Sandburg, Sheryl, on social media, 244
San Francisco Examiner, 11
Santana, Ralph, on social media, 244–245
search engine optimization (SEO), 237,
search engine results page (SERP), 239
search engines, 10
Sears, 34, 67, 160
seasonal markets, 48–50
second repeat (repeat purchases matrix),
segmentation, see market segmentation
selling price, 164–166
SEO (search engine optimization), 237,
SEOCentro, 241
SERP (search engine results page), 239
service markets, 45
service(s)
development of, 219
forecasting by net profit by, 213–215
and manufacturing, 199
new, 192–195
objectives for, 266
perceived value of, 42
plans for, 267
and public relations, 153–157
quality of, 110
strategies for, 266–267
share objective, 222
share of market matrix (sales plan),
share points, 220–223
Simon, Bryant, on success of Starbucks,
Six Sigma, 10–11
Index 291

smartphones, 241–244
social media, 244–247
SponsoredReviews.com, 247
Staples, 13
Starbucks, 62, 63, 74
Starch Research, 127, 250, 251, 253
Strategic Planning Institute, 32
strategic plans, 10–13
strategic position, 263–264
strategies, 17–18
Sun Microsystems, 11, 93
surveys, 250–251
sweepstakes, 143
Target, 34, 74
target audience, 125
taxes, 170, 171
technology, 267
Ted Bates (advertising agency), 69
television advertising, 128, 136
Texas Instruments, 94
3M, 43–44
timing, 272–273
total marginal income, 166–167
total market in dollars (share of market
matrix), 186
total market in units (share of market
matrix), 186
total number of potential buyers (trial
transactions matrix), 177, 178
total repeats (repeat purchases matrix),
total transactions (repeat purchases
matrix), 183
total units (unit and dollar volume
matrix), 185
Toyota, 67, 190
trade associations, 250
trade journals, 250
trade shows, 146–151
transactional websites, 237
trial rate, 110
trial transactions matrix (sales plan),
Twitter, 242, 246, 247
Unilever, 12
unit and dollar volume matrix (sales
United Airlines, 120, 124–125
United Technologies, 119
unit share of market (share of market
matrix), 187
units repeat (unit and dollar volume
matrix), 185
units trial (unit and dollar volume
matrix), 185
value added, 92–93, 110, 111
variable costs (VCs), 164–166
Verizon Wireless, 237–238
vertical integration, 92
vice president of marketing, 22
video promotions, 245
volume
forecasting by sales, 204–208
and price, 167–168
selling for, 203
Vought Aircraft Industries, 93
Walgreens, 143
Wal-Mart, 34, 74, 75, 95, 113, 157, 159
Web 2.0, 243
websites, 237–238, see also specific sites
WeReward, 243
Wordtracker, 241
Yahoo!, 10, 245
YouTube, 245, 246
Zucker, Sara, on Pepsi’s social media
strategy, 244
292
Index
Wyszukiwarka
Podobne podstrony:
Survival Medicine Home Remedies How To Prepare And Use Herbs Drying And Preparations
Marketing How to Prepare a Market Analysis
ECP Alchemy of the Heart How to Give and Receive More Love [OCR]
How to Reset and ReLearn the Adaptations
11 How to prepare the launch date of a new project successfully
ECP Alchemy of the Heart How to Give and Receive More Love [OCR]
Gardening Classic How to Grow and Prepare Tomatoes
How to prepare for IELTS Speaking
How to prepare your Curriculum Vitae
How to create and develop brand value
Body Lang How to Read and Make Body Movements for Maximum Success
how to prepare for a?ckpacking expiditiona
How to speak and write correctl Nieznany
How to burn and play PS2 games (2)
IELTS How to prepare for writing
How to prepare for IELTS Speaking
więcej podobnych podstron