
G
GAMMA-RAY SPECTROSCOPY
See
RADIOCHEMICAL METHODS: Gamma-Ray Spectrometry
GAS CHROMATOGRAPHY
Contents
Overview
Principles
Column Technology
Gas–Solid Chromatography
Multidimensional Techniques
High-Temperature Techniques
High-Speed Techniques
Instrumentation
Online Coupled LC–GC
Pyrolysis
Detectors
Mass Spectrometry
Fourier Transform Infrared Spectroscopy
Physicochemical Measurements
Environmental Applications
Forensic Applications
Petrochemical Applications
Chiral Separations
Overview
K Robards
, Charles Sturt University, Wagga Wagga,
NSW, Australia
& 2005, Elsevier Ltd. All Rights Reserved.
Introduction
Gas chromatography (GC) is a dynamic method
of separation and detection of volatile compounds.
It was first introduced in the 1950s and rapidly
established itself as a routine analytical technique in
most industrial and academic laboratories. From its
introduction and until the advent of high-perform-
ance liquid chromatography, it dominated separation
methods. This can be attributed to the capability for
high resolution, selectivity, and sensitivity.
Separation in GC is achieved by partitioning of
gaseous solutes between a typically inert gaseous
mobile phase and a stationary liquid or solid phase
retained in a column. These variants are described as
gas–liquid chromatography (GLC) and gas–solid
chromatography (GSC), respectively. With the ex-
ception of some specialized areas such as the anal-
ysis for inorganic gases, it is GLC which is used.
Nevertheless, the instrumentation is virtually identi-
cal for the two techniques.
In the most common approach (elution develop-
ment), the sample is introduced into the chromato-
graph via the sample inlet into a continuous flow of
mobile phase, which is referred to as the carrier gas.
The sample is vaporized in the inlet system and
transported by the carrier gas to the thermostatted
column where separation occurs. The individual
components give rise to an electrical signal in the
detector that may have provision for the inlet of ad-
ditional make-up gas. This is necessary to permit
separate optimization of gas flow through the col-
umn and detector. After suitable amplification the
detector signal is conducted to a recording device.
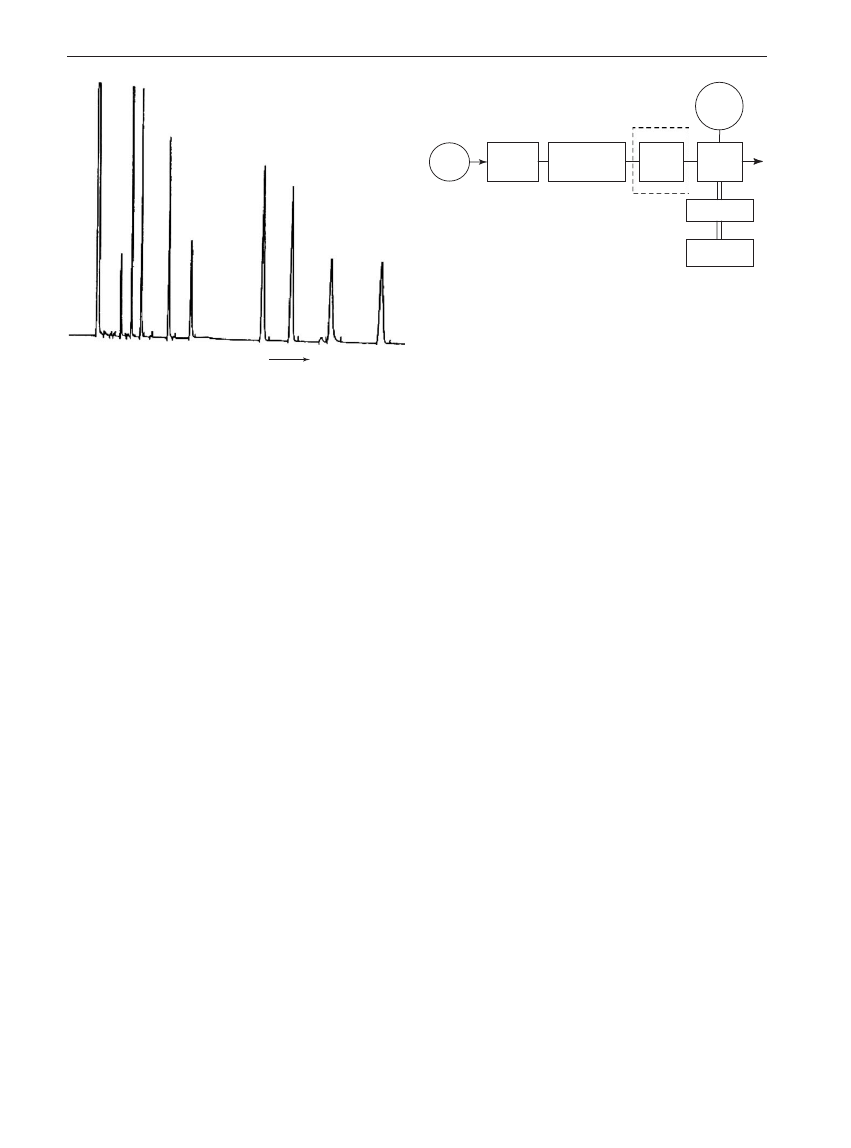
The detector output is produced as a chromatogram
(Figure 1). This is a plot of detector signal versus time
in which individual peaks represent the separated
components of the sample. Sample components can
be identified from their characteristic retention times.
With proper calibration, the amounts of the compo-
nents of a mixture can be measured accurately also.
Figure 2 shows the essential components of a gas
chromatograph as a block diagram. These parts can
be identified as the carrier gas, sample introduction
system, the column, the detector, and data acquisi-
tion system comprising an electrometer and integra-
tor/recording device. Although not apparent from the
figure, there are three separately controlled heated
zones for the inlet, column, and detector in the typi-
cal instrument. An overview of some of these aspects
is given in the following sections. The reader is also
referred to the more detailed discussion of detectors
and specific techniques such as pyrolysis GC, high-
speed GC, and GSC. Extensive resources for training,
method development, and support services are
provided by a number of manufacturers of gas chro-
matographic instrumentation.
Sample
It follows from the preceding discussion that the ba-
sic requirement with respect to sample is that it has
an appreciable vapor pressure at the column tempera-
ture. As usually practiced, the sample must also be
thermally stable. This allows the sample components
to vaporize in, and move with, the gaseous mobile
phase. This requirement is not as severe a restriction
as it appears since column temperatures as high as
450
1C (3001C is more common) are used in GC.
Thus, GC can be applied to all permanent gases,
most nonionized small- or medium-sized organic
molecules (typically up to C30), and many organo-
metallic compounds but it cannot be used for macro-
molecules or salts. In some instances, nonvolatile
compounds can be converted into more volatile and
stable derivatives before chromatography. In a typi-
cal sample containing a mixture of volatile and
nonvolatile components, care must be taken that the
nonvolatile solutes are not deposited in the system
where they can interfere with subsequent analyses.
Mobile Phases
Substances capable of interacting with the analyte
and influencing selectivity have been used as carrier
gases in rare instances. However, the ideal mobile
phase for GC is usually nonreactive toward the anal-
yte(s), nonflammable, cheap, and environmentally
friendly since it is vented at the end of the instru-
ment. Hence, the choice of a mobile phase or carrier
2
3
4
1
5
7
6
8
9
Retention time
Figure 1
A gas chromatogram showing the separation of a
nine-component mixture. Peaks due to individual compounds are
labeled 1 through 9. The unlabeled peak is attributed to the sam-
ple solvent. The retention time for individual components can be
read from the chromatogram although it is generally provided in a
separate report.
Carrier
gas
Pressure
or flow
controller
Injection
port
(thermostatted)
Column
Oven
Detector
gas(es)
Detector
(heated)
Electrometer
Recording
device
Figure 2
Block diagram of a gas chromatograph.
2
GAS CHROMATOGRAPHY
/ Overview

gas is determined by practical constraints of cost,
availability, inertness, and detector compatibility
rather than its ability to effect a particular separa-
tion. The usual mobile phase in GC is therefore a
noninteractive gas that does not influence selectivity.
However, the carrier gas can influence resolution
through its effect on column efficiency because of
differences in solute diffusion rates for various gases.
Moreover, it can effect analysis time and plays a role
in pressure-limiting situations because of differences
in gas viscosities (see Table 1).
Taking these considerations into account, hy-
drogen, helium, and nitrogen are the most popular
carrier gases in GC. Carrier gases are usually sup-
plied from a compressed gas cylinder. Gas purity is a
major consideration and, in general, the highest pu-
rity gas should be used to reduce deterioration of the
stationary phase and lessen detector noise. Moreover,
it is usual to include oxygen and moisture traps in the
carrier gas lines. These traps are commercially avail-
able, containing activated carbon (to remove organic
impurities) or molecular sieves (for moisture and
oxygen). The traps must be monitored and periodi-
cally regenerated. When changing cylinders, it is im-
portant to ensure that all fittings are free of dust and
dirt particles before connection to gas lines.
Typical compressed gas cylinders contain a pres-
sure of 20 MPa whereas supply line pressures to the
gas chromatograph are more commonly in the range
50–300 kPa.
Thus,
appropriate
regulators
and
controllers are used to step down and control the
pressure and flow rate to the column. With tradi-
tional instruments, the carrier gas is regulated by
either a pressure regulator or flow controller. The
choice between the two is dependent on the inlet
system and column type. In recent years, instrument
manufacturers have introduced completely electro-
nic programmable pressure-controlled gas chro-
matographs.
When a capillary column is installed in an instru-
ment it should be checked for carrier gas flow before
connecting the detector end of the column to avoid
the possibility of heating a column with no flow.
When the column connection has been completed,
the system should be checked for gas leaks. Once any
leaks have been eliminated and the column purged
with carrier gas, the volumetric flow rate (ml min
1
)
or the theoretically more useful average linear gas
velocity (cm s
1
) can be measured.
Sample Introduction Systems
The injection port or inlet system is the next major
component of the gas chromatograph. It must receive
the sample and deliver the correct amount of mate-
rial to the column so as not to exceed the sample
capacity of the column or the linear range of the
detector in use. Several types of inlet and sample
introduction techniques have been developed to accom-
modate the diversity of sample types and particularly
the state of aggregation of the sample and the range
of columns. Specialized techniques include equili-
brium headspace sampling, purge and trap sampling,
pyrolysis GC, and multidimensional chromatogra-
phy in which the sample entering the column differs
from the composition of the original sample. How-
ever, in the more usual case, the material entering the
column must have the same composition as the
original sample. Additionally, the sample has to be
delivered to the column as a sharp band.
The most common analysis involves injection of
1–3
ml of a liquid into a heated inlet. This is accom-
plished by means of a microsyringe through a septum
made of elastomer or rubber, which seals the inlet
system as the syringe needle is withdrawn. Septa have
a limited lifetime dependent on the mode of injection
(automatic versus operator injection), the injector
temperature, and the septum quality. They are avail-
able from a number of manufacturers and a good
operating principle is to perform a separation with
a solvent blank, particularly with a new batch of
septa. Syringe injection is also applicable to gases
(50–1000
ml) but reproducibility is relatively poor
and a sampling valve is more common. Syringes are
available from a number of manufacturers in various
configurations; needle point style, length of needle,
fixed or replaceable needle. Most needles are con-
structed of stainless steel but specialty fused silica
needles are available for on-column injection. An
important consideration in choosing a syringe is the
correct needle length to ensure delivery of the sample
at the correct position in the injection zone.
With packed columns, the sample solution is in-
troduced via the syringe into the sealed injection port
that is heated to a higher temperature than the col-
umn in order to assist vaporization. Sample discrimi-
nation, which can be regarded as a measure of how
well the detected peak areas reflect the original
Table 1
Physical properties (at 273 K and 101 kPa) of carrier
gases used in gas chromatography
Gas
Thermal
conductivity
(10
8
W m
1
K
1
)
Viscosity
(10
7
Pa s)
Density
(kg m
3
)
Hydrogen
16.75
84
0.0899
Helium
14.07
186
0.1785
Nitrogen
2.39
166
1.2505
Argon
1.67
212
1.7839
Neon
4.56
298
0.8999
GAS CHROMATOGRAPHY
/ Overview
3

sample composition, is not a problem. On the other
hand, the much smaller sample capacity and lower
carrier gas flow-rates associated with capillary col-
umns magnify the extent of any problems and these
are manifest as sample discrimination. Thus, more
attention has been given to detailed investigation of
various injection techniques when using capillary
columns. These include the use of a vaporizing in-
jector (i.e., heated injection port), cold syringe needle
injection, hot needle injection, and solvent flush
technique. The hot needle and solvent flush tech-
niques are about equally effective in reducing dis-
crimination and are preferred over other methods.
Traditional sample inlet systems were constructed
of metal, thus providing metallic surfaces where
sample decomposition was possible during sample
evaporation. Interchangeable glass liners in the inlet,
which are available in a range of configurations, are
now standard in practically every sample injection
system involving evaporation of the injected sample.
Capillary columns have a very low sample capacity,
and to avoid overloading the stationary phase spe-
cialized injection systems have evolved. The more
important of these are split injection, splitless injec-
tion, cold on-column injection, and programmed
temperature vaporizer split/splitless injection. These
variants have evolved to meet the diverse needs of
sample type and analyte concentration. For instance,
splitless injection is more suited to trace/ultratrace
analysis than is split injection.
Columns
In GC where the mobile phase is noninteractive,
the column alone determines the selectivity of the
separation. From its inception, up to the 1980s,
almost all separations in GC were performed on
conventional packed columns despite the demonstra-
tion by Golay in 1957 of much greater efficiency
obtainable with capillary columns. However, the
obvious advantages of capillary columns in terms of
higher resolution, greater sensitivity (despite injection
of less solute), reduced analysis time (to achieve
equivalent resolution), and greater chemical inertness
were gradually recognized. More recently, polymer-
clad flexible fused silica capillary columns with
chemically bonded and/or cross-linked immobilized
stationary phases have become commercially avail-
able at reasonable cost and this has led to the current
popularity of capillary columns. These columns now
routinely provide high efficiency, inertness, and
reproducibility. Alternatively, some separation effi-
ciency can be sacrificed by using shorter columns to
achieve very rapid analyses.
Capillary columns are available from several manu-
facturers in a wide range of column internal dia-
meters (0.1–1.0 mm), column lengths (5–50 m), and
stationary phase film thicknesses (0.1–5.0
mm). Gen-
erally, sample capacity increases but the efficiency
decreases as the internal diameter or film thickness
increases. The larger bore capillary columns with in-
ternal diameters between 0.53 and 1.00 mm are
termed wide bore or megabore capillary columns and
these have similar capacities, but greater efficiencies,
than packed columns (see Table 2).
The largest variation in properties between
conventional packed columns and capillary columns
is associated with the column permeability. For this
reason, capillary columns offer much less flow
resistance and can be used in much longer lengths.
Ultimately, the comparison of different column types
is between the efficient use of column head pressure.
Thus, a packed column containing 10
mm particles
can generate 50 000 theoretical plates per meter but
requires a head pressure of 20 MPa m
1
, whereas a
70 m capillary column of 50
mm internal diameter
can provide over one million theoretical plates with a
column pressure drop of
B2.2 MPa.
The stationary phase distinguishes GSC from
GLC. In the former it is a solid adsorbent whereas
in GLC it is a liquid either coated on a solid support
(packed column) or deposited directly on the column
walls. GSC preceded GLC but has never achieved
the same prominence. Nonetheless, GSC has some
Table 2
Comparison of packed and capillary columns
Parameter
Column type
Packed
Microbore capillary
Capillary
Megabore capillary
Internal diameter (mm)
1/4 in
100
mm
200
mm
530
mm
Length (m)
0.5–3
5–50
5–100
5–100
Permeability (10
7
cm
2
)
1–50
300–20 000
Film thickness (
mm)
1–10
0.1
0.2–2
1–5
Carrier gas average linear velocity (cm s
1
)
2–4
20–30
20–35
20–40
Flow rate (ml min
1
)
50–60
0.2–0.5
0.2–2.0
3–5
Sample capacity (ng)
20 000
o5
20–500
1000–15 000
4
GAS CHROMATOGRAPHY
/ Overview

important application areas such as the separation of
inorganic gases and low molecular mass hydrocar-
bons for which GLC shows little selectivity. The
main adsorbents for GSC are based on silica, char-
coal, alumina, or molecular sieves although the
development of new adsorbents is continuing.
The liquids used as stationary phases in packed and
capillary columns are closely related. Nevertheless,
liquid phases in capillary columns are usually cross-
linked and bonded and may exhibit slight differences
in selectivity to nominally equivalent packed column
materials. The selection and comparison of stationary
phases is confusing for newcomers as some 300 phas-
es are available and in excess of 1000 have been de-
scribed in the literature. Nevertheless, a fairly limited
set of packed columns will suffice in most laborato-
ries while an even more limited set of capillary col-
umns will satisfy the needs of most laboratories.
Moreover, two forces have combined to contain the
proliferation of phases. Firstly, the high efficiency of
capillary columns has reduced the necessity for many
selective liquid phases and, secondly, theoretical studies
have aided in phase selection.
There are several factors to consider in selecting a
stationary phase. General considerations include
temperature limits of the stationary phase, column
efficiency, and lifetime and detector compatibility.
Since nonpolar phases generally give more efficient
columns that also exhibit superior lifetimes, it is wise
to use the least polar phase that provides satisfactory
separation. Phases containing the specific element
corresponding with element-selective detectors (e.g.,
cyanopropyl phases with an NPD detector; trifluoro-
propyl phases with an ECD detector) should be
avoided where possible. These selective detectors will
be substantially more sensitive to ‘normal’ column
bleed with such phases.
The most difficult factor to assess is the ability of a
phase to effect the desired separation. From this per-
spective, the selection of a stationary phase and col-
umn is a daunting prospect. In theory, the selection is
based upon maximizing the difference in selectivity
between the solutes toward the phase. The separa-
tion is increased by exploiting solute–stationary
phase interactions that retard the progress of some
solutes relative to others so as to increase their re-
tentions. The types of interactions to consider are:
*
London or dispersion forces which are weak and
nonspecific;
*
dipole–dipole interactions or dipole-induced di-
pole interactions; and
*
acid–base interactions or proton transferring (or
sharing) tendencies of either the solute or station-
ary phase.
In practice, experience of similar separation prob-
lems, literature data relating to the target separation,
and availability of the column phases are often the
factors that determine the choice of a particular
phase and column for a specific application.
The ideal liquid phase has a low vapor pressure,
high thermal and chemical stability, low viscosity,
nonreactivity toward sample components, and a wide
temperature operating range, extending from
80
1C
to 450
1C. The phase must exhibit reasonable solvent
properties (i.e., dissolving power) for the solutes in
order to ensure symmetrical peaks. Stationary phases
can be divided into nonpolar, polar, and specialty
phases. These differ in their ability to interact with
solutes of different structure, i.e., their selectivity. The
nonpolar phases contain no functional groups capable
of specific interaction (e.g., hydrogen bonding or di-
pole interactions) with the sample. Here, interaction
between solute and stationary phase is limited to
dispersive forces, and components therefore separate
according to their volatility with the elution order fol-
lowing the boiling points. Compounds that cannot be
differentiated on the basis of their boiling points (i.e.,
they have similar or equal boiling points) require a
different stationary phase for separation. To obtain the
differentiation of solutes by forces other than disper-
sion, a polar phase containing groups capable of spe-
cific interactions with sample components is required.
The elution order now depends on a combination of
volatility and specific polar–polar interactions. The
relative magnitude of the various interactions (dis-
persive, dipole, hydrogen bonding, and acid/base)
determines the selectivity of the phase toward parti-
cular solutes. The selectivity and resolution of a sepa-
ration can be optimized by choosing a stationary
phase that exploits the different interactions.
Nonpolar phases include a variety of hydrocar-
bons, such as squalane or Apolane C87, or mixtures
of long-chain n-alkanes such as Apiezon L. Polymers
based on a silicon-oxygen-silicon backbone form the
basis of the most widely used group of stationary
phases. These linear polysiloxanes differ in their
average molecular mass, thermal stability, and vis-
cosity. The chemical difference lies in the substituent
and degree of substitution on the silicon backbone.
Polar phases have been prepared by substituting
polar trifluoropropyl or cyano groups for the methyl
groups of the dimethylsilicones. By incorporating
different proportions of the polar groups, station-
ary phases with a wide range of polarities can be
produced. Other polar materials include polyethy-
lene glycols or polyoxiranes with the structure
–(CH
2
CH
2
–O)
n
–.
Specialty phases have been developed for use with
particular analytical techniques such as GC–MS
GAS CHROMATOGRAPHY
/ Overview
5

where low bleed phases are essential, to meet the
needs of particular groups (e.g., United States
Environmental Protection Agency methods), or to
separate particular classes of solutes. Included in the
latter are chiral phases and Carbowax phases modi-
fied for separation of acids and bases.
Column Temperature
Column temperature is an important variable that
must be controlled in GC. Thus, the column is
housed in a thermostatted oven. For simple samples
containing relatively few peaks, an appropriate col-
umn temperature can be determined experimentally
to achieve the separation and isothermal analysis is
suitable. Nonetheless, many samples contain com-
ponents with a wide range of volatility and more
volatile components are eluted rapidly with no reso-
lution when analyzed isothermally at a high tempera-
ture whilst the analysis time is unacceptably long and
later eluting peaks are very broad and may be lost as
baseline drift when analyzed isothermally at a low
temperature. For such samples, temperature pro-
gramming in which the column temperature is ramped
during the analysis is essential.
Detectors
Online detection is an integral part of a gas chro-
matograph. The detector monitors the column effluent
and produces an electric signal that is proportional to
the amount of analyte being eluted. The output signal
is recorded as a continuous trace of signal intensity
against time. In principle, any physical or physico-
chemical property of the analyte that deviates from the
properties of the carrier gas can serve as the basis for
detection. Thus, over 100 detectors for GC have been
described but relatively few are in common use.
The operation and applicability of different detec-
tors can be compared against several performance
criteria. These criteria include the sensitivity, noise,
minimum detectable quantity or detection limit, de-
tector time constant and response time, and the
selectivity of the response. For purposes of screen-
ing a sample of unknown composition, a universal
detector has definite advantages whereas a selective
detector may aid in the identification of an unknown
compound or a given class of compounds. Selective
detectors are particularly useful for the analysis of
complex mixtures, where the selectivity may greatly
simplify the chromatogram through suppression of
the response of many potentially interfering com-
pounds.
Detectors can also be classified as destructive or
nondestructive. With nondestructive detectors, the
original chemical form of the analyte persists
throughout the detection process. This is an obvious
advantage when the analyte is required for further
analysis. In destructive detectors, the process of de-
tection involves an irreversible chemical change in
the analyte. A more useful classification distinguishes
detectors on the basis of the transducer mechanism
as ionization, spectroscopic, etc.
A consideration of the characteristics discussed
above and the needs of a particular analytical prob-
lem will determine the most appropriate detector for
a given problem. A detector with a wide linear dyna-
mic range and low detection limit will be adopted for
the determination of trace components in addition to
main components in a sample. On the other hand, the
use of a selective detector is convenient if the trace
components belong to a particular class of substance
or possess some common functional group.
Of the many available detectors, the most common
(Table 3) are thermal conductivity detector (TCD),
flame ionization detector (FID), electron-capture de-
tector (ECD), alkali-flame ionization detector (AFID
or NPD), flame photometric detector (FPD), and
mass selective detector. The TCD and FID are usually
considered universal detectors as they respond to
most analytes whereas the ECD, AFID, and FPD are
the most useful selective detectors and give differen-
tial responses to analytes containing different func-
tional groups. Note that this does not imply that the
magnitude of the response of the universal detectors
is constant to all analytes. The mass selective detec-
tor has the advantage of operation in either universal
or selective detection mode whilst an infrared detec-
tor is a powerful tool for distinguishing isomers.
Table 3
Classification of the most common gas chromatographic detectors
Detector
Response
Optimal detection limit
Destructive
TCD
Organic and inorganic solutes
5–100 ng
No
FID
All organic solutes except formic acid and formaldehyde
10–100 pg
Yes
ECD
Halogenated and nitro compounds
0.05–1 pg
No
AFID
P- or N-containing solutes
0.1–10 pg
Yes
FPD
P- or S-containing solutes
10–100 pg
Yes
Mass
selective
General all-purpose detector that is replacing FID in a number of
situations
Dependent on mode of
operation
Yes
6
GAS CHROMATOGRAPHY
/ Overview

The first detector commercially available for GC,
the TCD or katharometer, remains a consideration
for situations requiring universal detection. The TCD
responds to any compound, irrespective of its struc-
ture, whose thermal conductivity differs from that of
the carrier gas. Hence, it is the only choice for de-
tection of compounds to which other more sensitive
detectors give a poor or negligible response. In par-
ticular, it is the standard detector for determination
of inorganic gases such as the permanent gases, hy-
drogen, oxygen, nitrogen, carbon dioxide, carbon
monoxide, carbon disulfide, and water.
The FID is the standard workhorse detector in GC.
It consists of a stainless steel jet constructed so that
carrier gas exiting the column flows through the jet,
mixes with hydrogen gas, and flows to a microburner
tip that is swept by a high flow of air for combustion.
Ions produced by the combustion are collected at a
pair of polarized electrodes, constituting a small
background current that is the signal. When solutes
enter the detector, they are combusted and the signal
increases. The current produced is then amplified and
passed to a recording device. Unlike the TCD, the
FID gives virtually no response to inorganic com-
pounds. Most organic compounds, however, give
similar responses, which is approximately propor-
tional to the total mass of the carbon and hydrogen in
the analyte. A reduced response is usually observed
with the first members of a homologous series and
compounds with a large proportion of oxygen.
The popularity of the ECD can be attributed to the
high sensitivity to organohalogen compounds, which
include many compounds of environmental interest,
including polychlorinated biphenyls and pesticides. It
is the least selective of the so-called selective detec-
tors but has the highest sensitivity of any contempo-
rary detector. The NPD or thermionic ionization or
emission detector is a modified FID in which a con-
stant supply of an alkali metal salt, such as rubidium
chloride, is introduced into the flame. It is a detector
of choice for analysis of organophosphorus pesti-
cides and pharmaceuticals. The FPD detects specific
luminescent emission originating from various excit-
ed state species produced in a flame by sulfur- and
phosphorus-containing compounds.
Dual Detection
The simultaneous use of two or more detectors,
whose outputs complement each other, can aid in
compound identification by generating substance-
characteristic detector response ratios. In some
instances, the detectors are operated sequentially or,
alternatively, the column eluate is split and passed
separately to the individual detectors. The combina-
tion of a selective with a universal detector can
provide information on both the whole sample and,
at the same time, greater quantitative sensitivity on
specific components.
See also: Gas Chromatography: Principles; Column Tech-
nology; Instrumentation; Detectors; Mass Spectrometry.
Further Reading
Cazes J and Scott RPW (2002) Chromatography Theory.
Chromatographic Science Series, vol. 88. New York:
Dekker.
Gehrke CW, Wixom RL, and Bayer E (eds.) (2001) Chro-
matography—a century of discovery 1900–2000. Journal
of Chromatography Library, vol. 64.
Grant DW and Grant RPW (1996) Capillary Gas Chro-
matography. Separation Science Series. New York: Wiley.
Grob RL and Barry EF (1995) Modern Practice of Gas
Chromatography, 3rd edn. New York: Wiley.
Handley AJ and Adlard ER (2001) Gas Chromatographic
Techniques and Applications. Sheffield: Academic Press/
Blackwell Science.
Issaq HJ (ed.) (2002) A Century of Separation Science.
New York: Dekker.
Jennings W, Mittlefehldt E, and Stremple P (1997) Ana-
lytical Gas Chromatography, 2nd edn. San Diego, CA:
Academic Press.
McNair HM and Miller JM (1998) Basic Gas Chro-
matography. New York: Wiley-Interscience.
Moldoveanu SC and David V (2002) Sample preparation
in chromatography. Journal of Chromatography Library,
vol. 65.
Niessen WMA (ed.) (2001) Current Practice of Gas Chro-
matography–Mass Spectrometry. Chromatographic Sci-
ence Series, vol. 86. New York: Dekker.
Robards K, Haddad PR, and Jackson PE (1994) Principles
and Practice of Modern Chromatographic Methods.
London: Academic Press.
Principles
P J Marriott
, RMIT University, Melbourne, VIC,
Australia
& 2005, Elsevier Ltd. All Rights Reserved.
Introduction
Gas chromatography (GC) is the premier chemi-
cal separation method for volatile compounds. It
GAS CHROMATOGRAPHY
/ Principles
7
Wyszukiwarka
Podobne podstrony:
Chromatography overview
Application of Solid Phase Microextraction Gas Chromatograp
Ion Exchange Chromatography overview
kwasy gas chromatography
Liquid Chromatography Overview
Gas chromatography–mass spectrometry method for determining
In tube solid phase micro extraction gas chromatography of v
HS SPME procedures for gas chromatographic analysis of biolo
Solid phase microextraction coupled to gas chromatography a
03 2000 Revisions Overview Rev 3 1 03
chromanie przestankowe 2
Overview of Exploration and Production
192Preparatywna i procesowa chromatografia cieczowa
Access to History 001 Gas Attack! The Canadians at Ypres, 1915
overview simatic controllers 04 2007 en plc
6Hydrophobic Interaction Chromatography
więcej podobnych podstron