
Jan Przystupa
Bureau of Macroeconomic Research
National Bank of Poland
The exchange rate in the monetary transmission mechanism.
1. A broadly accepted thesis in the economic literature states that in an open economy, with
high mobility of capital, the only monetary policy efficient in the long run is the policy based
on three pillars:
[1] flexible exchange rate;
[2] direct inflation targeting;
[3] clearly defined monetary policy rule
1
.
Then, exchange rates become an essential element of the monetary policy transmission
mechanism – allowing the arbitrage of domestic and foreign interest rates through expected
changes of exchange rate. The substantial role of exchange rates in transmission mechanism
has been also confirmed for Poland. Therefore we have decided to develop research works on
that part of transmission. The results have been presented below.
Uncovered interest rate parity model
.
1. The uncovered interest rate parity model (UIP), which relates expected exchange rate de-
preciation to changes in the level of domestic and foreign interest rates, seems to be a proper
theoretical construction suitable both for research on transmission mechanism and for predict-
ing the changes of exchange rates in the future.
Suppose that the UIP, in its classic form, holds in n periods. Then:
( 1 )
(
)
n
n
t
n
t
n
i
t
i
t
t
i
i
e
e
E
n
α
+
−
=
−
å
=
+
*
,
,
1
1
where
t
E - expected in time t change of the nominal exchange rate in the period t+i;
t
e - logarithm of the spot exchange rate (relation of domestic to foreign currency);
n
t
i
,
- domestic and foreign (marked by *), n-period interest rate in time t;
n
α
- risk premium, constant in n periods.
Suppose that in the short period, expected changes of the exchange rate are determined by the
white noise process, i.e. no considerable disturbances occur between period t and t+1:
1
See Obstfeld, Rogoff (1995) in regard to [1], Bernanke et al. (1999) in regard to [2], Taylor (1999) in regard to
[3]. In an open economy the rules of the monetary policy can take the form of the following equation:
1
1
0
−
+
+
+
=
t
t
t
t
t
e
h
e
h
gy
f
i
π
, where: i - the short term nominal interest rate set by the central bank, y –
output gap, e – real exchange rate. For f>1 and g=h=0 only inflation has been stabilised. Implementation of the
exchange rate to the rule, although promising in the theory, can only slightly stabilise inflation (by diminishing
standard deviation – France, Italy) or substantially worsen results (Germany),whereas the variance of the output
gap has increased in any case.

t
t
t
t
t
e
E
e
E
ε
=
−
−
+
1
1
and
1
−
−
=
∆
t
t
t
e
e
e
then the IUP model can be tested as the following regression:
( 2 )
(
)
å
=
+
+
+
−
+
=
∆
n
i
n
t
t
n
t
n
t
n
n
t
i
i
e
n
1
,
*
,
,
1
1
ε
β
α
Wadhwani (1999), basing on estimation of equation ( 2 ) has shown that the UIP model, in its
classic form (β=1), does not hold in any analysed country; it is too restrictive not permitting
any feed-backs between interest rate, fundamentals and exchange rate.
Taylor (1995) claims that even if the risk premium permits for β<1, it is unacceptable for
parameter β to be close to or less than zero – however, the estimation of equation ( 2 ) usually
gives such results. Let n denote monthly periods - if n is lower, the probability of the UIP re-
jection is higher, as Bekaert and Hodrick (2001) pointed out; however, the UIP model holds
much better at long horizons (over 12 months) - Chinn and Meredith (2001).
Chinn and Meredith`s theses were not tested for exchange rate of zloty because even if the
rolling estimations are applied, the short time series do not allow a 12 months time lag. How-
ever, for the exchange rate of zloty to U.S. dollar, the classic form of the UIP model has been
tested for n=3 (equation ( 2 )). The final form of the UIP has been chosen basing on the com-
parison of the cointegration among variables fulfilling UIP conditions
2
with proper signs of
coefficients, adjusted R
2
and with the Durbin-Watson statistics..
( 3 )
(
)
)
067
,
0
(
)
002
,
0
(
/
)
054
,
0
(
/
3
483
,
0
3
3
05
,
0
621
,
0
+
−
+
=
+
t
t
USD
PLN
t
USD
PLN
t
M
Libor
M
Wibor
e
e
72
,
0
.
2
=
R
Adj
D-W=1,83
In equation ( 3 ) β=0,05 seems to confirm results of Bekaert and Hodrick (2001), i.e. for low
n, the relation between interest rate disparity and changes in nominal exchange rate is weak. It
can imply (Mark (1995)) that the probability of a proper determination of the exchange rate
path between period t and t+n based on the UIP model is lower than the one based on the
random walk models. Nevertheless, the positive value of β suggests that the interest rates
seem to be a factor (although not a leading one) explaining the exchange rate changes.
In the case where β parameter is positive but substantially lower than 1, Wadhwani (1999)
proposed instead of rejecting the UIP model replacing it by the following equation:
( 4 )
(
)
÷
ø
ö
ç
è
æ
−
−
−
+
=
∆
+
t
t
t
t
n
t
x
x
i
i
e
_
*
ρ
β
α
where x denotes risk premium, understood by Wadhwani as a deviation of the share of bal-
ance on current account in GDP and of net foreign assets in GDP or unemployment rate from
long-term averages of these variables (marked by the upper bar). It should be mentioned that
the time-varying risk premium separates expected changes of exchange rates from changes of
interest rate disparity.
2
The Phillips-Perron unit root test have been held by all variables used in the UIP model.

3. Bekaert, Wei and Xing (2002) pointed out the relation between uncovered interest rate dis-
parity and term structure of interest rates. Model of the expectation hypothesis of the term
structure of the interest rates (EHTS) holds, if the long-term, the n-period interest rate i
t,n,
is
an unbiased estimator of the average expected short-term interest rate i
t+h,1
over the life of
the bond increased by the premium c
n
:
( 5 )
(
)
n
h
t
n
h
t
n
t
c
i
E
n
i
+
=
+
−
=
å
1
,
1
0
,
1
Campbell and Shiller (1991) proved that the EHTS model set off by equation ( 5 ) can be
tested by regression ( 6 ):
( 6 )
(
)
å
−
=
−
+
+
+
−
+
=
−
1
0
,
,
,
,
,
1
k
i
m
n
t
m
t
n
t
ehts
m
n
n
m
t
m
im
t
u
i
i
i
i
k
β
α
where k=n/m and m<n
Suppose that UIP in the longer period n is given by UIP in the shorter period m and by EHTS
in the period n. Bekaert, Wei and Xing (2002) showed then the UIP model also holds in pe-
riod m. So, the expected path of the nominal exchange rate between periods t and t+n can be
expressed as follows:
( 7 )
(
)
(
)
(
)
(
)
n
t
n
t
n
t
n
m
t
n
t
m
t
n
t
EHTS
n
n
t
n
t
UIP
n
n
n
i
n
i
t
x
x
i
i
i
i
i
i
a
e
n
,
,
_
,
*
,
*
,
,
,
*
,
,
1
1
µ
ρ
β
β
α
+
÷
ø
ö
ç
è
æ
−
−
−
−
−
−
−
+
+
=
∆
å
=
+
Equation ( 7 ) combines the current and implied forward rates with expected nominal ex-
change rate, where the level of exchange rate has been adjusted by the risk premium deter-
mined by fundamentals.
Equation ( 7 ), estimated for exchange rate of zloty to U.S. dollar, takes the following form:
( 8 )
(
)
(
) (
)
]
[
)
089
,
0
(
1
)
079
,
0
(
)
011
,
0
(
)
122
,
0
(
)
456
,
0
(
)
123
,
0
(
/
)
068
,
0
(
/
3
628
,
0
735
,
0
123
,
0
564
,
0
1
3
1
3
991
,
0
3
3
580
,
0
506
,
0
+
úû
ù
+
+
êë
é
−
+
−
−
−
−
+
−
+
=
−
+
t
USD
PLN
t
USD
PLN
t
bh
fdi
dbp
M
fLibor
M
fLibor
M
fWibor
M
fWibor
M
Libor
M
Wibor
e
e
78
,
0
.
2
=
R
Adj
D-W = 1,96
where:
USD
PLN
e
/
- logarithm of the nominal exchange rate of zloty to U.S. dollar;
Wibor3M-Libor3M - nominal interest rate disparity;

fWibor3M, fWibor1M, fLibor3M, fLibor3M - implied three- and one-month forward rate
calculated according to Nelson-Siegel (1987) procedure where implied forward
rate f for the period
( )
2
1
, t
t
has been expressed by the following formula:
(
) (
)
(
)
1
)
,
(
1
(
)
,
(
1
(
,
1
2
0
1
0
2
1
1
0
2
0
2
1
−
ú
û
ù
ê
ë
é
+
+
=
−
−
−
t
t
t
t
t
t
t
t
i
t
t
i
t
t
f
(
)
( )
=
=
1
0
2
0
,
,
t
t
i
t
t
i
}
spot interest rates;
dbp, fdi, bh - accordingly: logarithms of budget deficit, foreign direct investments and net
exports, adjusted by logarithm of the output gap.
Equation ( 8 ) shows that the reaction of the nominal exchange rate of zloty to the expected
changes of the future interest rates (appreciation) has been almost twice as high as the ex-
change rate reaction to disparity changes (depreciation). If the budget deficit and foreign di-
rect investments simultaneously increase and trade balance improves, then, to reverse the ap-
preciation, the fall of the interest rate disparity should be almost threefold higher than the
changes in the dynamics of fundamentals.
Expected reaction of zloty to changes of individual categories has been shown in Chart 1.
The impulse response of zloty is characterised by lack of return of zloty to the previous equi-
librium level. However, in the case of any individual variable a new equilibrium has been
reached in less than 12 months. A difference has been observed particularly for the foreign
direct investments and budget deficit.
Chart 1 shows that:
•
reaction of the exchange rate to changes of the interest rate disparity by 1 percentage
point seems to be relatively weak – three months after an impulse had occurred, the
zloty could depreciate by less than 3/100 PLN. The new equilibrium, with expected
6/100 PLN depreciation, has been reached after six months;
•
expected change of the interest rates by 1 p.p. causes an appreciation of zloty by 14/100
PLN expected in three months. A new equilibrium, with expected 6/100 PLN apprecia-
tion, has been reached after six months;
•
the government bonds worth 10% of the planned budget deficit sold in period t can
cause an appreciation of zloty by 8/100 PLN within 3 months. A new equilibrium, with
expected 3/100 PLN appreciation, has been reached after six months;
•
the fall in foreign direct investments by 10% shall cause a depreciation of zloty by
11/100 PLN within 3 months;
•
zloty can appreciate by 3/100 PLN if the trade deficit improves by 10% .
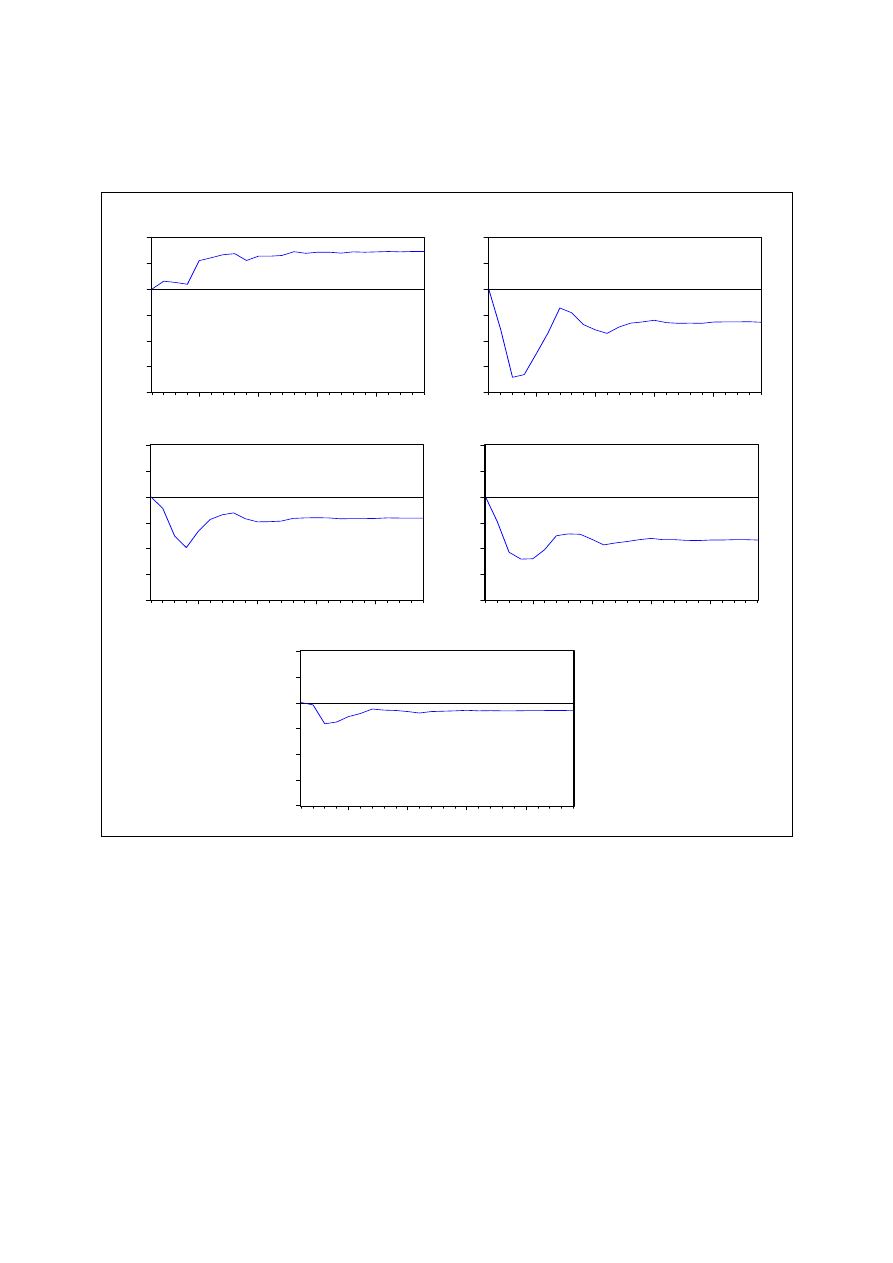
Chart 1
Expected reaction (in zloty) of the nominal rate of zloty on changes in the period t of:
interest rate disparity by 1 percentage point and budget deficit, foreign direct investments,
net exports by 10%.
-.16
-.12
-.08
-.04
.00
.04
.08
5
10
15
20
Response of PLN/USD to the disparity change
-.16
-.12
-.08
-.04
.00
.04
.08
5
10
15
20
Response of PLN/USD to the change
of the term structure of the interest rates
-.16
-.12
-.08
-.04
.00
.04
.08
5
10
15
20
Response of PLN/USD to the change of the budget deficit
-.16
-.12
-.08
-.04
.00
.04
.08
5
10
15
20
Response of PLN/USD to the FDI flows
-.16
-.12
-.08
-.04
.00
.04
.08
5
10
15
20
Response of PLN/USD to the changes of the net exports

Pass-through effect.
1.
Suppose that equation ( 8 ), estimated in the previous paragraph, holds for the Polish zloty
both in the short and long horizon, i.e. the expected changes of the exchange rate of zloty de-
pend on the interest rate disparity, term structure of the domestic interest rates and on the risk
premium. Then, changes of the exchange rate, affecting the level of import prices expressed in
the domestic currency, influence the consumption price index (CPI) directly - through prices
of imported consumption goods - and indirectly - through changes in the production price
index (PPI) caused by price fluctuations of the imported raw-materials and intermediate
goods. Fluctuations of the domestic prices, generated by changes of the exchange rates, im-
pact in turn on the domestic demand, changing relations between real and potential output.
Changes of the output gap are directly transferred to the CPI.
In the same mode, but independently of the exchange rate changes, the CPI is affected by
fluctuations of the foreign prices.
In the economic literature, the total effect of transmission of the external factors to the domes-
tic CPI, which incorporates changes of the foreign prices (supply shock), as well as of the
exchange rate (exchange rate shock) and of the output gap (demand shock), is known as the
pass-through effect
3
.
2.
Theory of the purchasing power parity (PPP), in its standard version, suggests that in the
long run, the depreciation of the exchange rate shall always lead either to a proportional in-
crease of prices in a country with a depreciating currency or to the fall of prices in the country
with an appreciating currency
4
. It that case, the transmission of the exchange rate changes to
the CPI would be complete and the pass-through effect shall equal one. However, empirical
analyses show that the standard version of the PPP theory has been rarely fulfilled.
Usually it is rather assumed that the relation between price levels of similar baskets of goods
should be constant but not necessarily equal one - then the PPP theory in its relative version is
applied (Rogoff (1996)).
Simultaneously, an occurrence of the Balassa-Samuelson effect (BS) indicates that even a
relation between price levels can vary over time. Then, the pass-through indicator can fluctu-
ate at the rate determined by the BS effect.
In Poland, a positive correlation between the BS and pass-through effects has been observed
between 1996 and 2001; the correlation coefficient was 0,96. Hence, one can state that a re-
duction of the BS effect causes a proportional decrease of the total pass-through.
3
Calculation of the statistical pass-through effect is based on the following formula:
PT
t,t+j
= CPI
t,t+j
/
EXR
t,t+j
where
PT
t,t+
j - cumulated pass-through effect after j months;
CPI - cumulated consumption price index (CPI);
EXR - cumulated index of the nominal effective exchange rate, see Dornbusch(1987) or McCarthy (1999).
4
It is usually assumed that a small economy, with no impact on the world market, is being analysed. The second
country usually means the rest of the world. Then, the price adjustment takes place only in the small economy
and the pass-through effect is calculated for the nominal effective exchange rate.

3.
Moreover, if in any analysed economy, there is a low elasticity of the minimum wages and
prices of the production factors in relation to the domestic prices, then the reaction of the do-
mestic prices to the import price changes is weaker and weaker. It means that the pass-
through indicator should be continuously decreasing. In McCarthy`s works (1999 and 2001),
the detailed description of the pass-through effect has been presented and the impact of se-
quence of the supply, demand and exchange rate shocks on the import, producer and con-
sumer prices has been explained. Corresponding prices are functions of:
( 9)
( )
m
e
d
s
m
t
m
E
ε
ε
α
ε
α
ε
α
π
π
+
+
+
+
=
−
3
2
1
1
( 10)
( )
w
m
e
d
s
w
t
w
E
ε
ε
β
ε
β
ε
β
ε
β
π
π
+
+
+
+
+
=
−
4
3
2
1
1
( 11)
( )
c
w
m
e
d
s
c
t
c
E
ε
ε
γ
ε
γ
ε
γ
ε
γ
ε
γ
π
π
+
+
+
+
+
+
=
−
5
4
3
2
1
1
where:
π
m
- index of the import transaction prices expressed in the domestic currency;
π
w
- price index of the sold production of industry (PPI);
π
c
- consumption price index (CPI);
E
t-1
- expected value of the corresponding variable in the period t-1.
ε
s
- supply shock, identified with the oil price (π
oil
):
( )
s
oil
t
oil
E
ε
π
π
+
=
−
1
ε
d
- demand shock, identified with the output gap (φ):
( )
d
s
t
a
E
ε
ε
ϕ
ϕ
+
+
=
−
1
1
εεεε
e
- exchange rate shock, identified with the changes of the nominal effective exchange
rate:
( )
e
d
s
t
b
b
e
E
e
ε
ε
ε
+
+
+
∆
=
∆
−
2
1
1
4.
Results of the chain sequence pass-through model estimated for Poland are presented in the
table below (Tab. 1). Model was estimated on quarterly data from 1993 – I quarter 2002.
McCarthy`s model and the model presented above differ from each other in the definition of
the supply shock. In the presented work, oil prices are expressed in the dollar terms (instead
of domestic currency), which lets separate the supply shock from the exchange rate shock.
Apart from it, regarding the assumed identical reaction of the import prices to changes of the
external prices and of the exchange rate, the demand shock has been proportionally splitted
between two last categories.

Tab. 1
Pass-through effect calculated for the indices of import, producer and consumer prices.
Pass-through effect after →
for ↓
2 quarters
4 quarters
8 quarters
Import transaction prices (PM)
of which PT effect identified exclu-
sively with:
supply shock (oil price)
exchange rate shock
0,51
0,12
0,39
0,69
0,15
0,54
0,79
0,17
0,62
Price index of the sold production of
industry (PPI)
of which PT effect identified exclu-
sively with:
0,26
0,50
0,59
Supply shock (oil price)
Demand shock (assigned to the oil
price changes)
together
0,05
0,01
0,06
0,09
0,01
0,10
0,11
0,01
0,12
Exchange rate shock
Demand shock (assigned to the
exchange rate changes)
together
0,20
0,01
0,21
0,37
0,03
0,40
0,43
0,04
0,47
Consumption price index CPI)
of which PT effect identified exclu-
sively with::
0,17 0,36 0,42
Supply shock (oil price)
Demand shock (assigned to the oil
price changes)
together
0,02
0,00
0,02
0,09
0,02
0,11
0,11
0,03
0,14
Exchange rate shock
Demand shock (assigned to the
exchange rate changes)
together
0,14
0,01
0,15
0,21
0,04
0,25
0,24
0,04
0,28
Source: Author`s calculations.
In the equation of import prices, independently of the period chosen for estimation, all coeffi-
cients are stable. Hence, the proper estimation of the pass-through effect seems to be very
likely. Short-term pass-through, defined as an effect of transmitting in two quarters the results
of changes of the external prices and of exchange rate to the import prices, is 0,51. The long-
term pass-through, understood as a cumulated effect of transmission, equals 0,79. Both
figures are similar to the results obtained by Camp and Goldberg (2002) for the OECD coun-
tries, averaging accordingly 0,6 and 0,75 (for Germany 0,6 and 0,8). Moreover, the method
applied in this work allowed differentiating between a reaction of prices on the supply and

exchange rate shocks. The exchange rate shock, in the short as well as in the long period, ex-
plains 76-78% of the total pass-through effect. The rate of reaction of the import prices on
changes of the exchange rate is also similar to the average for the OECD countries – about
65% of the cumulated pass-through effect appears between the first and the second quarter
after the shock has occurred, about 87% - till the fourth quarter. The impulse fades totally
after 7-8 quarters (chart 2).
In the equation of the price index of the sold production of industry all coefficients are unsta-
ble for subperiods including the years 1993-1995, probably because of the rapid changes in
the structure of economy taking place during that time. Reduction of the data set can diminish
the reliability to some extent, even despite the stabilisation of coefficients in the equation in
all analysed subperiods containing years 1996- 2002. While the import prices absorb 79% of
the supply and exchange rate shocks, the PPI absorb almost 100%. Long-term pass-through
runs to 0,59 and it is close to the share of the imports of intermediate goods in the total Polish
imports (60,8% in 2001). Short-term pass-through equals 0,26, so 45% of the total pass-
through effect takes place after two quarters and 85% after one year. It means that the strong-
est reaction of the PPP shall be expected between the second and the fourth quarter since
shocks have occurred (Chart 2).
In the equation of the consumer prices (CPI) all coefficients are stable in the subperiods where
years 1993-1996 are excluded. Because of the significant reduction of the data set, the model
has been also estimated for the monthly data from June 1998 to April 2002. Then, the long-
term pass-through equals 0,42 and 41% of the total effect is cumulated in the first two quar-
ters and 85% in the first year. Structure of the time-lags is similar to that of the PPI equation
(Chart 2).
5.
The model based on the monthly data allows identifying more precisely the time structure
of reaction of prices to the supply and exchange rate shocks. Results are as follows:
•
for the import prices, the highest pass-through shall be expected between the second and
the fourth month since the shocks have occurred;
•
the strongest reaction of the PPI occurs between the third and the seventh month;
•
for the CPI, the strongest reaction shall be expected between the fourth and the eighth
month.
Simultaneously, both for the quarterly and for the monthly model, the share of the exchange
rate shock in the total long-term pass-through equals 57%, whereas in the short-term pass-
through it's over 82%. Hence, in the long horizon the supply shocks (represented by the oil
prices) seem to be more and more significant. On the other hand, while the role of the demand
shock in the short period can be omitted, in the long run it increases to 17%.
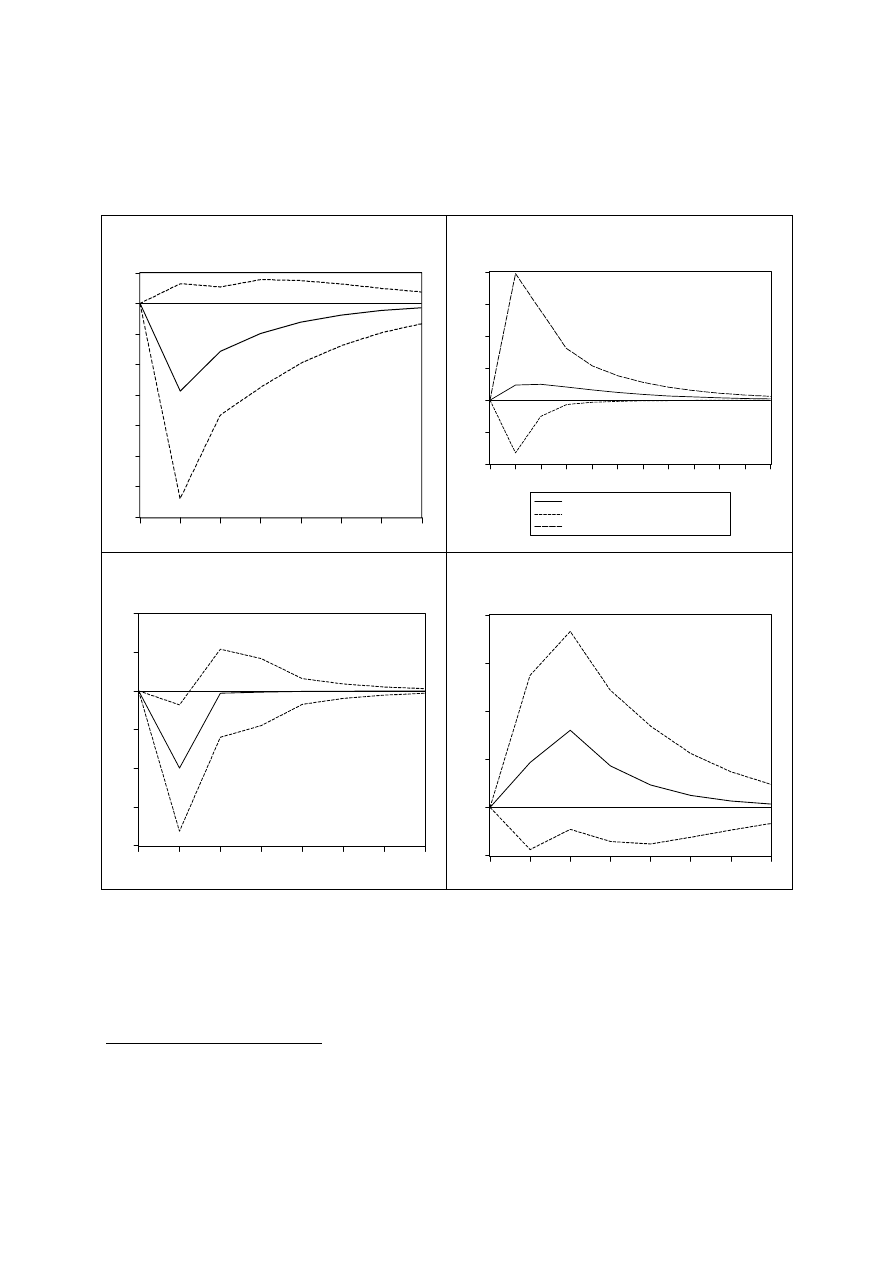
Chart 2
Response of the domestic prices on the changes of the oil prices and the nominal effective
exchange rate of zloty.
Simultaneously, a positive correlation
(
)
67
,
0
2
=
R
between the pass-through and the output
gap is observed. Hence, it can be concluded, that the pass-through effect is linked with the
business cycle
5
.
5
Assuming that the output gap is lower during recovery and decline, positive correlation coefficient implies that
in the mentioned phases of the business cycle the pass-through effect should decrease. On the other hand, the
greater output gap characteristic of the boom as well as of the crisis, implies an increase of the pass-through
effect. Moreover, during the crisis, an increase of the pass-through effect causes a fall of inflation (connected
with a negative output gap). This correlation is confirmed by the research conducted in the IMF for the develo-
ped economies (World Economic Outlook. May 2001).
-.10
-.05
.00
.05
.10
.15
.20
1
2
3
4
5
6
7
8
9
10
11
12
Oil prices
Nominal effective exchange rate
Import prices
Response of Production Price Index to Nonfactorized
One Unit Innovations of Import Prices, Nominal Effective
Exchange Rate and Oil Prices
-.7
-.6
-.5
-.4
-.3
-.2
-.1
.0
.1
1
2
3
4
5
6
7
8
Response of Import Prices to Nonfactorized
One Unit Nominal Effective Exchange Rate Innovation
-.4
-.3
-.2
-.1
.0
.1
.2
1
2
3
4
5
6
7
8
Response of CPIB to Nonfactorized
One Unit Nominal Effective Exchange Rate Innovation
-.02
.00
.02
.04
.06
.08
1
2
3
4
5
6
7
8
Response of CPI to Nonfactorized
One Unit Oil Prices Innovation

6.
In the emerging economies, the huge volatility of the output gap occurrs both between the
phases of the business cycle and inside its separated phases. Mann (1986) says that – under
the imperfect competition – the huge volatility of the output gap together with the fluctuations
of the domestic currency shall rather change the importers` profit margin than influence the
domestic prices – then, the pass-through effect should decrease. A similar reaction of the im-
porters can be observed during high volatility of the exchange rate – they rather change their
profit margin than prices – hence, the pass-through effect falls.
6
Indirectly, similar phenome-
non can be observed in Poland – maximum correlation between standard deviation of the
PLN/USD exchange rate and changes of the CPI is –0,31 and for PLN/EUR exchange rate is
-0,25.
The empirical works done by Feinberg (1986) or Goldberg and Knetter (1997) show that the
market structure is essential for the pass-through effect: the lowest pass-through is observed in
the sectors of the imperfect competition, where producers dispose of the great monopolistic
power and are able to make the market segmentation.
For the American economy, similar investigations, confirming that thesis, were made by
Dornbusch (1987). He analysed the pass-through effect in the various segments of the market
characterised by the different level of the import penetration
7
and substitution between im-
ported and domestic goods. Dornbusch showed that - according to the pricing to the market -
foreign exporters who sell their product at the market with the depreciating currency, rather
prefer keeping their share in the market than increasing prices in line with depreciation;
hence, the pass-through effect has been diminished. So, the pass-through effect depends on
the pricing to the market, structure and concentration of production and on the structure and
import penetration. The more positive pricing to the market, higher concentration of produc-
tion, higher import substitution and lower level of import penetration, the lower the pass-
through effect.
7.
Works done for Poland are not complete. Nevertheless, basing on this investigations a pass-
through effect at the macroeconomic level could be evaluated. It seems that while the reaction
of the import prices is similar to the reaction observed in any small, open economy, a further
transmission of the supply and exchange rate shocks to the PPI and CPI is substantially higher
in Poland then in other developed countries. For the U.S.A., France and Switzerland the long-
term pass-through effect equals 0,1, for Germany 0,15, but for the Netherlands and Belgium
0,35 (Mc' Carthy (2001)). The long-term effect for Poland is similar to that of the South Af-
rica (Smal (2002)) and is much lower than in Turkey where it equals 0,78 (Domaç (2002)).
But also in Poland during the two digit inflation between 1993-1995, the pass-through effect
was similar to the one currently observed in Turkey. It might suggest that also in Poland the
pass-through effect depends on the level of the observed inflation. Such a conclusion set up
by Taylor (2000) has been positively verified by Choudhri and Hakura (2001) for 71 coun-
tries.
6
This relationship occurrs in the developed economies. Results for the developing countries are different.
Ghosh, Ostry, Gulde and Wolf (1997) have observed that implementation of the floating exchange rate regime
and a resulting higher volatility of the exchange rate increases the pass-through effect and, consequently, incre-
ases the inflation by 3 percentage points one year after the change, by 1,8 points after two years and by 2,3 po-
ints after three years.
7
Import penetration index relates value of imports to domestic demand.

References:
Adolfson M.
Optimal Monetary Policy
Delegation under Incomplete
Exchange Rate Pass-Through
SSE/EFI Working Paper No.
478, Stockholm, 2001
Bekaert G., Hodrick R.J.
Expectations Hypotheses
Tests
Journal of Finance, No. 56/4,
2001
Bekaert G., Wei M., Xing Y. Uncovered Interest Rate Par-
ity and the Term Structure
NBER Working Paper No.
8795, Cambridge, 2002
Bernanke B.S., T. Laubach,
F.S. Mishkin, A.S. Posen
Inflation Targeting
Princeton, New Jersey:
Princeton University Press,
1999
Campa J.M., Goldberg L.S. Exchange Rate Pass-Through
into Import Prices. A Macro
or Micro Phenomenon
NBER, April 2002
Campbell J.Y., Shiller R.J. Yield Spread and Interest
Rate Movements: A Bird s
Eye View
Review of Economic Studies
No. 58/3 1991
Chinn M., Meredith G.
Testing Uncovered Interest
Parity at Short and Long Ho-
rizons
NBER Working Paper No.
8643, Cambridge, 2001
Choudhri E.U., Hakura D.S. Exchange Rate Pass-Throuhg
to Domestic Prices: Does the
Inflationary Environment
Matter?
IMF Working Paper
WP/01/194, 2001
De Grauwe P., Grimaldi M. The Exchange Rate and Its
Fundamentals. A Chaotic
Perspective
CES ifo Working Paper No.
639(6), 2002
Devereux M,B., Lane Ph. R. Exchange Rates and Mone-
tary Policy in Emergin Mar-
ket Economies
CEPR, 2001
Devereux M.B., Engel Ch.
Exchange Rate Pass-Through,
Exchange Rate Volatility and
Exchange Rate Didconnect
NBER Working Paper No.
8858, Cambridge, 2002
Domaç I.
On the Exchange Rate Pass-
Through: Evidence From
Turkey
Central Bank of the Republic
of Turkey, April 2002
Dornbusch R.
Exchange Rates and Prices
American Economic Review,
No. 77/1987
Engel Ch.
The Responsiveness of Con-
sumer Prices to Exchange
Rates and the Implications for
Exchange-Rate Policy: a Sur-
vey of a Few Recent New
NBER Working Paper No.
8725, Cambridge, 2002

Open-Economy Macro Model
Feinberg M.
The Interaction of Foreign
Exchangeand Market Power
Effects on German Domestic
Prices
Journal of Industrial Econom-
ics, No. 35/1986
Filipović D.
Exponential-Polynominal
Families of the Term Struc-
ture of Interest Rates
Department of Mathematics,
ETH, Zurich, 2001
Ghosh A., Ostry D., Gulde
A., Wolf C.
Does the Exchange Rate Re-
gime Matter for Inflation and
Growth
IMF, 1997
Goldberg P., Knetter M.
Goods Prices and Exchange
Rates: What Have We
Learned?
Journal of Economic Litera-
ture, No. 35/1997
Halpern L., Koren M.
Products, Firms and Ex-
change Rate
Institut of Economics of Hun-
garian Academy of Sciences,
2001.
Holman J.A.
International Transmission of
Anticipated Inflation under
Alternative Exchange-Rate
Regimes
Federal Reserve Bank od
Kansas City, Kansas City,
1999
Kilian L., Taylor M.P.
Why is it so difficult to beat
the random walk forecast of
exchange rates
University of Michigan, 2001
Mann C.
Prices, Profit Margins and
Exchange Rates
Federal Reserve Bulletin, No.
72/1986
Mark N.C.
Exchange Rates and Funda-
mentals: Evidence of Long
Horizon Predictability
American Economic Review
No. 85/1 1995
McCarthy J.
Pass-Through of Exchange
Rates and Import Prices to
Domestic Inflation in Some
Industrialized Economies
Federal Reserve Bank of New
York, 2000
Nelson Ch.R., Siegel A.F.
Parsimonius Modeling of
Yield Curves
Journal of Business, No. 60/4
1987
Obstfeld, Maurice, K. Ro-
goff
The Mirage of Fixed Ex-
change Rates
Journal of Economic Perspec-
tives, Fall 1995, Nr. 9 (4)
Rogoff K.
The Purchasing Power Parity
Puzzle
Journal of Economic Litera-
ture, nr 34/1996
Smal M.M.
Recent exchange rate devel-
opments in South Africa and
the pass-through effect
South African Reserve Bank,
April 2002

Taylor J.
Low Inflation, Pass-Through,
and the Pricing Power of
Firms
European Economic Review
No. 44, 2000
Taylor J.B.
The Role of Exchange Rate in
Monetary Policy Rules
Stanford University, 2001
Taylor M.P.
The Economics of Exchange
Rate
Journal of Economic Litera-
ture, No. 33, 1995
Wadhwani S.B.
Currency Puzzles
LSE Lecture on 16 September
1999
Wyszukiwarka
Podobne podstrony:
więcej podobnych podstron