
3. COMPETING IN THE WORLD ECONOMY
OECD SCIENCE, TECHNOLOGY AND INDUSTRY SCOREBOARD 2009 © OECD 2009
88
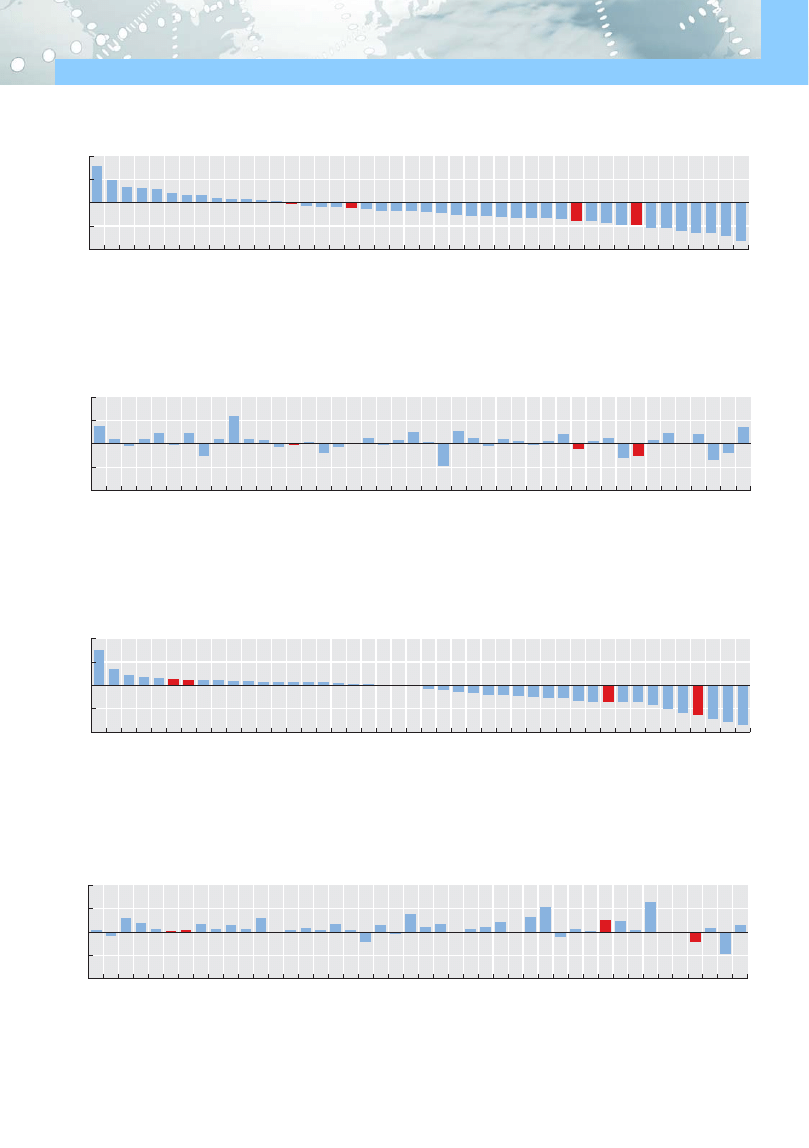
3.3. Manufacturing trade balance by technology intensity
The manufacturing trade balance reveals an econ-
omy’s structural strengths and weaknesses in terms
of technological intensity. It indicates whether an
industry performs relatively better (or worse) than
total manufacturing and can be interpreted as an indi-
cator of revealed comparative advantage that is based
on countries’ trade specialisation.
In 2007, only 11 OECD countries and 2 non-members
(Israel and Slovenia) show a strong comparative
advantage in trade in high-technology manufactures.
As in previous years, Switzerland had a trade surplus
of over 7%, followed by Ireland with 5%. Trade in high-
technology industries represented around 3% of total
manufacturing trade in the United States, Mexico and
Korea. In Israel and Slovenia the trade surplus was 2%
and 1%, respectively. Most countries’ comparative
advantage in trade in high-technology industries
changed little between 1997 and 2007, although there
were notable exceptions. It rose by 6 percentage points
in Iceland, by 4 percentage points in Switzerland and in
South Africa, and by 2 percentage points in Brazil.
Over the same period, it dropped by 5 percentage
points in Japan and by 3 percentage points in India
and in China.
Between 1997 and 2007, the picture was somewhat
different for trade in medium-high-technology indus-
tries. In particular, more countries had a strong com-
parative advantage in 2007. As in previous years,
Japan led with a surplus of 15%, followed by Germany
and Ireland with 7% and 5%, respectively. In 2007,
Slovenia was the only non-OECD country to have not
only a fairly strong comparative advantage of 2% in
trade in medium-high technologies but also to benefit
from an increase of 4 percentage points in its contribu-
tion to the manufacturing trade balance. Over 1997-2007,
the contribution of trade in medium-high-technology
industries increased by 13 percentage points in
Indonesia, 11 percentage points in Turkey and
6 percentage points in China, despite negative contri-
butions to their overall manufacturing trade balance.
In 2007, much of the manufacturing trade balance of
these countries relied on the positive contribution of
low-technology industries.
Sources
OECD, STAN Bilateral Trade Database,
www.oecd.org/sti/btd.
OECD, STAN Indicators Database,
www.oecd.org/sti/stan/indicators.
Going further
Hatzichronoglou, T. (1997), “Revision of the High Tech-
nology Sector and Product Classification”, OECD Sci-
ence, Technology and Industry Working Papers 1997/2,
OECD, Paris.
OECD (2005), Measuring Globalisation: OECD Handbook
on Economic Globalisation Indicators, OECD, Paris.
OECD (2007), Staying Competitive in the Global Economy:
Moving Up the Value Chain, OECD, Paris.
Pilat, D. et al. (2006), “The Changing Nature of Manu-
facturing in OECD Countries”, OECD Science, Technology
and Industry Working Papers 2006/9, OECD, Paris.
Figure notes
Underlying data for China include trade with
Hong Kong, China.
Changes in contribution to the manufacturing trade
balance refer to 1999-2007 for Luxembourg, to 2000-07
for South Africa and to 2000-07 for the BRIICS (Brazil,
Russian Federation, India, Indonesia, China and South
Africa).
Contributions to the trade balance
The contribution to the manufacturing trade
balance is calculated as follows:
(X
i
-M
i
) – (X-M)*[(X
i
+M
i
) / (X+M)],
where (X
i
-M
i
) is the observed manufacturing sec-
tor trade balance and (X-M)*[(X
i
+M
i
) / (X+M)] is
the theoretical trade balance.
A positive value for an industry i indicates a
structural surplus, while a negative value indi-
cates a structural deficit. The indicator is
expressed as a percentage of total manufactur-
ing trade in order to eliminate business cycle
variations.
3. COMPETING IN THE WORLD ECONOMY
OECD SCIENCE, TECHNOLOGY AND INDUSTRY SCOREBOARD 2009 © OECD 2009
89
3.3. Manufacturing trade balance by technology intensity
Contribution of high-technology industries to the manufacturing trade balance, 2007
As a percentage of manufacturing trade
1 2
http://dx.doi.org/10.1787/744524463556
Change in contribution to the manufacturing trade balance: high-technology industries, 1997-2007
As a percentage of manufacturing trade
1 2
http://dx.doi.org/10.1787/744542886012
Contribution of medium-high-technology industries to the manufacturing trade balance, 2007
As a percentage of manufacturing trade
1 2
http://dx.doi.org/10.1787/744586031377
Change in contribution to the manufacturing trade balance: medium-high-technology industries, 1997-2007
As a percentage of manufacturing trade
1 2
http://dx.doi.org/10.1787/744600432311
-10
-5
0
5
10
%
Weaker comparative advantage
Stronger comparative advantage
Sw
itz
er
la
nd
Ire
la
nd
Un
ite
d S
ta
te
s
M
ex
ic
o
Ko
re
a
Un
ite
d K
in
gd
om
Hu
ng
ar
y
Is
ra
el
Fr
an
ce
Ic
el
an
d
Sl
ov
en
ia
De
nm
ar
k
Sw
ed
en
OE
CD
Be
lg
iu
m
In
do
ne
si
a
Es
to
ni
a
EU
19
Au
st
ria
Ne
th
er
la
nd
s
Fi
nl
an
d
Cz
ec
h R
ep
ub
lic
No
rw
ay
Ja
pa
n
Sl
ov
ak R
ep
ub
lic
Gr
ee
ce
Ge
rm
an
y
Ca
na
da
Ita
ly
Po
rt
ug
al
Sp
ai
n
Lu
xe
m
bo
ur
g
BR
IIC
S
Po
la
nd
Tu
rk
ey
Ch
in
a
Ac
ce
ss
io
n
co
un
tri
es
Au
st
ra
lia
Br
az
il
Ch
ile
Ne
w Z
ea
la
nd
In
di
a
Ru
ssi
an
F
ed
er
at
io
n
So
ut
h A
fr
ic
a
-20
-10
0
10
20
%
Weaker comparative advantage
Stronger comparative advantage
Ja
pa
n
Ge
rm
an
y
Ire
la
nd
Cz
ec
h R
ep
ub
lic
Un
ite
d S
ta
te
s
OE
CD
EU
19
Sl
ov
en
ia
M
ex
ic
o
Hu
ng
ar
y
Un
ite
d K
in
gd
om
Sl
ov
ak R
ep
ub
lic
Fr
an
ce
Sp
ai
n
Au
st
ria
Ita
ly
Ko
re
a
Ne
th
er
la
nd
s
Sw
itz
er
la
nd
Sw
ed
en
Be
lg
iu
m
Po
la
nd
De
nm
ar
k
Po
rt
ug
al
Ca
na
da
Es
to
ni
a
Fi
nl
an
d
Gr
ee
ce
Lu
xe
m
bo
ur
g
Ch
in
a
Tu
rk
ey
So
ut
h A
fr
ic
a
No
rw
ay
Is
ra
el
BR
IIC
S
In
di
a
Br
az
il
In
do
ne
si
a
Au
st
ra
lia
Ne
w Z
ea
la
nd
Ac
ce
ss
io
n
co
un
tri
es
Ic
el
an
d
Ru
ssi
an
F
ed
er
at
io
n
Ch
ile
Document Outline
- 3. Competing in the World Economy
Wyszukiwarka
Podobne podstrony:
więcej podobnych podstron