
485
25.1 Introduction
Wrocław (Breslau) is one of only a few cities in Central Europe
1
that can claim to
have contributed to the early history of continuous temperature measurements. The
reconstructions of meteorological elements necessary for research in this field have
to be firmly founded on representative instrumental measurements in order to provide
a reliable insight into the past with the use of these same stations and their homo-
geneous series. Only reconstructions which are informed by the latest geophysical
research can be used in the development of reliable climatic models for more accurate
long-term forecasts.
The extant climatic data were often derived from station where there were
changes in both the locations and observation times of measurements. Therefore
they require careful homogenization which, in restoring the uniformity of the series,
will reconcile the possible, physically explicable changes of measurement values by
which it is constituted. What is important in this verification process is the cross-
referencing of the checked series with the values occurring in the immediate vicinity
of the station being examined. Mean monthly temperature values from other Silesian
stations are relevant in relation to the early temperature measurements in Wrocław.
The published data (Galle
for these stations cover only the period
between 1806 and 1851; they do not include the very beginning of the so-called
“Wrocław series”. The present reconstruction will focus on monthly average air
Chapter 25
The First One Hundred Years (1791–1890)
of the Wrocław Air Temperature Series
Krystyna Brys´ and Tadeusz Brys´
R. Przybylak et al. (eds.), The Polish Climate in the European Context:
An Historical Overview
, DOI 10.1007/978-90-481-3167-9_25,
© Springer Science + Business Media B.V. 2010
K. Bry
ś
Department of Agro- and Hydrometeorology, Wrocław University of Environmental and Life
Sciences, Plac Grunwaldzki 24, 50-363, Wrocław, Poland
e-mail: krystyna.brys@up.wroc.pl
T. Bry
ś
Faculty of Technology and Economy, Wrocław College of Humanities, 54-062, Wrocław, ul.
Stabłowicka 95,
1
In the second half of the eighteenth century there were at least 100 meteorological stations in
Europe, along with several operational networks. However, most of these (especially in Central
Europe) were short lived and worked no longer than a few years or decades.

486
K. Bry
ś and T. Bryś
temperature (Tp) values in the first 100 years (1791–1890) of the series, taking into
account the historical temperature measurements in the Silesian region.
25.2 The Beginnings of the Wrocław Air Temperature Series
The first permanent meteorological observations in Wrocław to include air temperature
(Tp) measurements most probably date back to the late seventeenth century
(Hellmann
, 1914; Landsberg
; Munzar
; Pyka
2
However,
systematic air temperature measurements originally began in February 1791, were
carried out at three observation times, and have continued until the present (taking
into consideration changes in station location)
3
. They were made by scholars at the
Astronomical Observatory, based in the Mathematics Tower of the Universitatis
Leopoldinae Vratislaviensis (the Latin name for Wrocław University, founded in
1702 by the Jesuits). Temperature measurements were taken there as a continuous
series at least until the end of 1930, at either the north-east or the north-west window
(depending on the shadow cast by the building) at a height of 88.3 French ft, that is
h = 28.7 m above ground level. In the first decades of the Observatory’s activity the
location was sometimes changed (Galle
, which may have had a substantial
impact on the homogeneity of the series during the nineteenth century (this issue
will be examined more closely later in this work).
The compilation of the observation data from the first 85 years, from 1791 to
1875, was achieved thanks to the astronomer Galle
, renowned for the
observational discovery of Neptune made on the basis of Le Verrier’s calculations.
In his early monograph Grundzüge der Schlesische Klimatologie, Galle
published Wrocław air temperature data recorded in the years 1791–1854 at the
2
The first systematic, instrumental temperature measurements were conducted by David von Grebner
in Wrocław in 1710 and lasted until 1721 (Hellmann
, 1914; Landsberg
. The results of
these measurements were published by Grebner after 1721 in the form of a manuscript, which was
kept in the library of the University of Wrocław and which possibly survived the havoc and destruc-
tion of the war (Pyka
. These measurements preceded his earlier meteorological observations
(also connected with air temperature) starting in 1692 in Wrocław. It was not until 1717 that the
comparative temperature series from two Silesian stations (Wrocław and Oława) and one Slovakian
station (Preszow) came into existence, as reported in the serial encyclopedic press Breslauer
Samlungen
. This comparative temperature series, which began
in 1717, was carried out by Kanold until 1726 and then continued by Büchner in 1727–1730. Pyka’s
publication (2003) contains the erroneous information, stating that Johann Kanold started his meteo-
rological examinations in Wrocław in 1679, which is actually the year of his birth.
3
The nineteenth-century changes in the location of measurements in the University building were
assiduously recorded by Galle
. Later changes were connected with the transfer of measure-
ments from the University building, situated in the old city centre, to the outskirts of Wrocław
(Krzyki, G
ądów, Biskupin, Strachowice), and have been presented by Pyka
and Bry
ś and
Bry
.

487
25 The First One Hundred Years (1791–1890) of the Wrocław Air Temperature Series
Breslau-Sternwarte Observatory (
f = 51°06’56.5”N, l = 17°02’10.6”E, H station = 118.0
m ASL, H
Tp
= 146.7 m ASL). They were presented in the form of mean daily,
monthly and annual values, as well as extreme temperature values. These measure-
ments were conducted with the use of mercury thermometers with Réaumur scales
(1.0°C = 0.8°R), used for the Wrocław measurements until the end of the 1870’s.
The observations, except for the years 1837–1845 (Galle
4
were carried out
at three regular times 6h, 14h and 22h local time, which were respectively, accord-
ing to notation of hours 18h, 2h and 10h, as noon was at that time denoted in
astronomy as 0h (or 24h) while midnight was denoted as 12h. This was the case
until the end of 1886. As of 1 January 1887, morning observations throughout the
former German meteorological network were conducted at 7h (6h GMT), and eve-
ning measurements were made at 21h (20h GMT), leaving 14h (as before). The
mean daily temperature was calculated as the mean mathematical value of the tem-
peratures taken at 6h, 14h and 22h (i.e., 5h, 13h, 21h UTC), and as of 1887 accord-
ing to the equation: (7h + 14h + 2 × 21h)/4.
5
25.3 The Correction of the Influence of Location Changes
on Air Temperature Measurements in Wrocław
in the Nineteenth Century
From 1801 to 1831 air temperature measurements conducted in the Breslau-
Sternwarte Observatory were transferred from the Tower of Mathematics to another
part of the University. They were located at a height of 13.3 m, on the second floor,
in a northern window of the main building of the University attached to the
University church. In the year 1832 measurements were relocated to the earlier loca-
tion, at a height of 28.7 m. However, on numerous occasions and for only short
periods usually as the result of renovation works, the temperature measurements
were transferred to the previous height of 13.3 m, and were taken in northern win-
dows of the second floor of the Tower, in the magnetic room. According to Galle’s
estimates, this was the case for about a quarter of all measurements taken in
4
In the years 1837–1845 and 1852–1875, observations were conducted five times a day. In the first
8-year period, they were taken at 6h, 9h, 12h, 15h, 21h, and from 1852 they were taken at three
standard times (6h, 14h, 22h), and additionally at 10h and 18h. However while calculating the
mean daily temperatures only the three mentioned standard times were taken into consideration
(Galle
. The issues of correcting Galle’s data and calculations of the means for 1837–1845
are discussed in the next sections of the paper.
5
Local Central-European Time (CET) is also used in the remaining chapters of the paper.

488
K. Bry
ś and T. Bryś
the period 1791–1878. It is likely that most of these changes took place after 1852
6
and were taken into consideration by Galle
by introducing the pertinent cor-
rections into the calculation of the Tp daily mean value. Consequently it was neces-
sary to take into account a correction for the remaining period of 1801–1831. On the
basis of the measurements taken by Galle
in 1871–1872 at a height of 13.3
m,
7
at the same time as the standard measurements taken at a height of 28.7 m, a
statistically significant regression equation can be derived that provides a reliable
correction of the mean monthly Tp values (margin of error from −0.2°C to + 0.2°C)
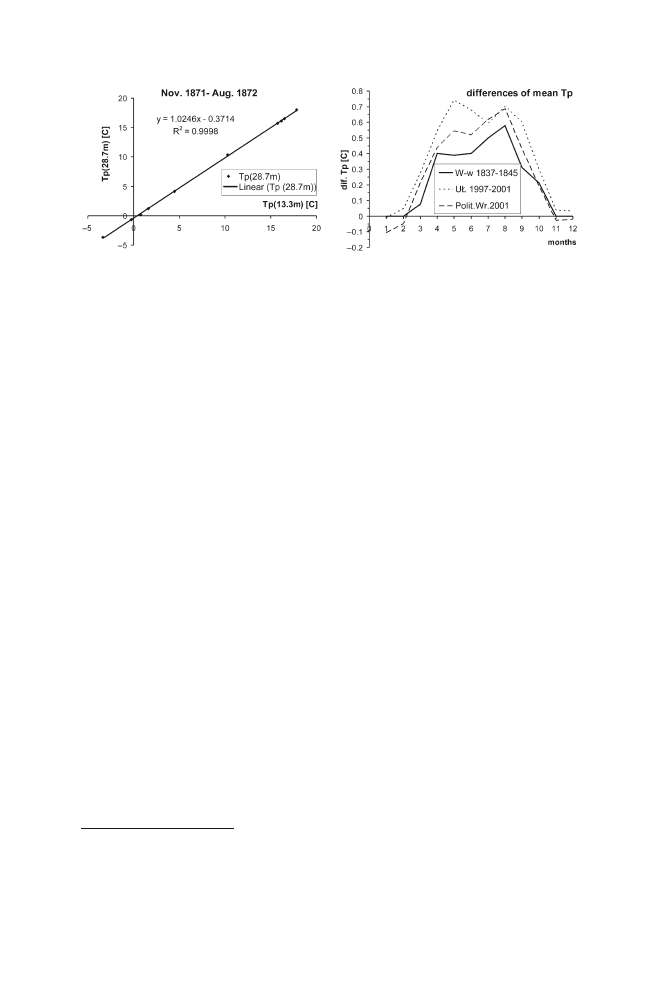
during the 31-year period of the nineteenth century (Fig.
). This correction had
the primary effect of decreasing the values supplied by Galle for the winter months
(on average of about 0.4°C), as the summer values were similar (within the limits of
0 to −0.1°C). Along with a later correction pertaining mostly to the years 1825–1845
(which will be explained below), this also resulted in an evident change in the
courses of the mean annual values.
The authors’ examples used as an empirical basis for correction are exhibited in
detail in Fig.
. On the left (the first example) we present the correlation of
monthly air temperature (Tp) values, measured between November 1871 and
August 1872 at a window on the second floor (at a height of 13.3 m over ground
level) of the Wrocław University building with Tp values from synchronous stan-
dard measures at a height of 28.7 m in the Breslau-Sternwarte Observatory (data
from: Galle
. The equation of linear regression was used for the purpose of
location correction in the years 1801–1834.
On the right of the Figure (the second example) we present the courses of the dif-
ferences (dif) between mean Tp values calculated according to two different types of
old-time standard terms which were used in Wrocław (W-w) in the first decades of
the nineteenth century, that is, the main observation times (6h, 14h and 22h) and an
episodic observation time used in the years 1837–1845 (6h, 9h, 12h, 15h and 21h).
The values for Wrocław in the years 1837–1845 were calculated on the basis of
equations of multiple regression deduced from relations of the Breslau-Sternwarte Tp
6
In the work cited earlier from 1857, Galle does not note location changes. However, he mentions
them in the later compilation (1879), where he only refers to the changes already mentioned
before 1852 (i.e., concerning the years 1801–1831). In these references he cites the results of the
simultaneous measurements on the second floor of the University building. More extensive
redecorations and renovations took place in the Mathematics Tower in the years 1854–1855 as
well as 1873–1874. A detailed calendar of location changes shows a connection between these
works and the transfer of only some of the thermometric measurements to the second floor. On
the basis of this and other inconsistencies with the quarter of all measurements mentioned earlier,
it may be stated that Galle was concerned with all of the measurements, not just the standard
thermometric measurements conducted in the Breslau-Sternwarte Observatory.
7
cites only the results of these measurements in the form of the Tp mean values from
the following unequal periods (lasting sometimes over ten days) in the years 1871–1872. At a
height of 13.3 m the Tp mean annual values (in both the described location situations) are about
0.3°C higher than at a height of 28.7 m. These results do not show considerable thermal distinc-
tions between the two locations analyzed on the second floor.
489
25 The First One Hundred Years (1791–1890) of the Wrocław Air Temperature Series
Fig. 25.1
Examples of some monthly air temperature (Tp) values calculated by Galle
,
chosen by the authors as the empirical basis for correction. Explanations – in the text below
with Tp measurements from other Silesian stations. The comparative, verifying cal-
culations were made by the authors for contemporary data (1997–2001) from Tp
measurements at a height of 26 m in Łód
ź (UŁ – University of Łódź) and Wrocław
(Politechnika Wrocławska – Technical University of Wrocław).
25.4 Other Corrections of the Wrocław Air
Temperature Series
Meteorological measurements taken in 1791–1875 and carried out at the Breslau-
Sternwarte Observatory
8
were probably lost in the archives of the University of
Wrocław as a result of the war, as well as a fire in the University archives in May
1945. We only have access to the results published by Galle
, most often
in the form of the mean daily or monthly values. The extant works enable us to verify
only the correctness of the mean monthly Tp derived from the mean daily values, as
well as to check the comparison of these mean monthly values with the mean Tp
values acquired by Galle
and with the measurements from other Silesian sta-
tions. Measurements either supervised or conducted by Galle in 1852–1875 were
analyzed and verified by him with greater attention to accuracy. In contrast to his
work from 1857, in which he limited himself to compiling the results of Silesian
meteorological measurements, in his later work in 1879 he focused more on meth-
odology and on data homogeneity. He recorded, among other things, important
8
Part of the archives of the University Library have not yet been properly catalogued or examined.
Perhaps there still exist some unrevealed secrets, significant for the history of meteorological
measurements in Wrocław. Such materials have not yet been discovered, despite multiple searches
conducted over several years initially by Pyka
, and then by the authors of this study.
490
K. Bry
ś and T. Bryś
information regarding the range of location changes and observation times (which
can be considered metadata) as well as the results of comparative, synchronically
conducted measurements taken at different observation times and in different loca-
tion conditions. As a result, it was possible not only to make the above-mentioned
correction for the years 1801–1831, but also to acknowledge that the Tp data from
1852 to 1875 published by Galle
are homogeneous and fully credible.
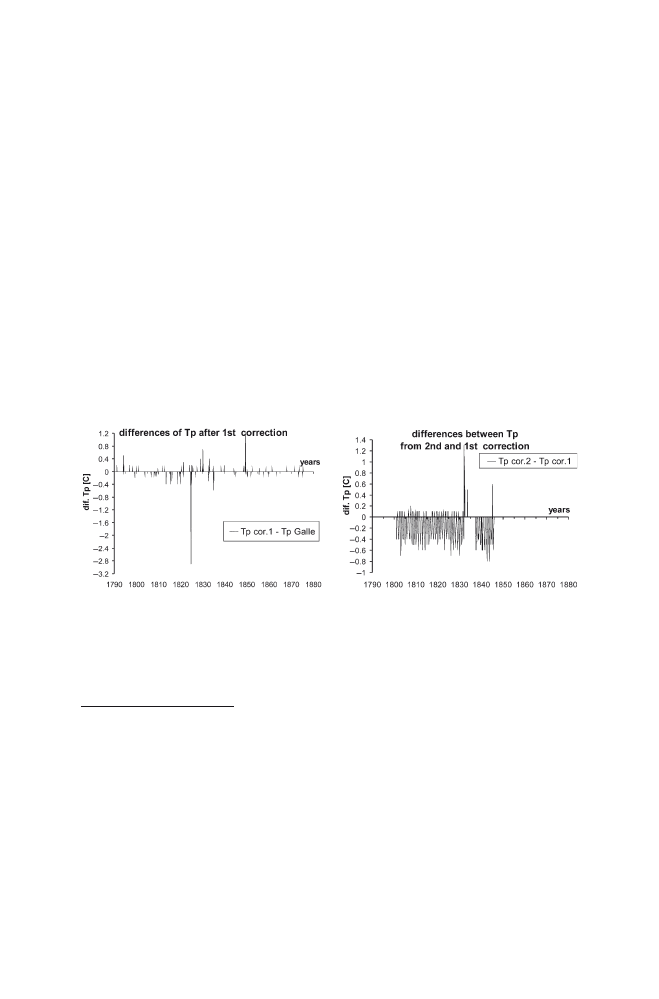
The state of the data from before 1852 is a different matter. Certain errors,
though (with the exception of 1824) not very considerable (Fig.
), were
revealed after comparing the mean Tp values calculated by Galle with their values
calculated according to his Tp mean daily values. More substantial discrepancies
were noted in the years 1825–1832, during a comparison of the mean monthly air
temperatures in Wrocław with notations from other Silesian stations. The cause
may be found in a note made by Galle
, wherein he stated that a certain part
of the measurements in these years were taken not by the main observer
9
but by his
assistant, who conducted them in another place, and, one can surmise, neither very
assiduously nor skillfully. On the basis of the regression equations derived for
Wrocław and the other different Silesian stations then in operation, an appropriate
9
Meteorological observations in the Breslau-Sternwarte Observatory were conducted from 1791
to 1831 by Prof. Jungnitz, director of the observatory, clergyman, and future president of Wrocław
University. From 1832 to 1851, Captain von Bogusławski, a professor, was in charge of the
observations, and these were taken over by Prof. J. Galle until the year 1897. Many co-researchers
and competent observers were connected with the observatory in that period, among others
W. Günther, R. Büttner, and H. von Rotkirch, who later conducted meteorological observations
(or calculated data from them) in other Silesian stations. In the years 1825–1831 Mr. Weiss
fulfilled the responsibilities of assistant-observer, performing only part of the observations – yet
it is unknown how many and in what range. Galle
only wrote that some of the observations
were carried out by Weiss on the third floor of the University building, although earlier (in the
same monograph) he stressed that meteorological observations (including air temperature mea-
surements) were conducted on the second floor from 1801 until the death of Jungnitz in 1831.
Fig. 25.2
The results of two correction steps (1st correction, 2nd correction) for monthly average
air temperature (Tp)values in the years 1791–1875 in Breslau-Sternwarte. Explanation: Tp cor. 1
– Tp Galle – differences (dif.) between values calculated by the authors from daily data and those
calculated by Galle
; Tp cor. 2 – Tp cor. 1 – differences between Tp values calculated
by the authors in the 2nd and 1st correction steps
491
25 The First One Hundred Years (1791–1890) of the Wrocław Air Temperature Series
correction of the mean monthly Tp values was made over this same 8-year period
for the Breslau-Sternwarte Observatory. This nearest comparative background was
considered to be the most representative and verifiable reference for the tempera-
ture in Wrocław. Additionally, thermal relations were also checked against another,
extra-regional climatic background comprised of outlying stations operative in that
same period such as Berlin, Cracow, Prague and Vienna. This allowed us, among
other things, to interpolate the missing monthly Tp value for January 1791 as tem-
perature measurements were not carried out then in Wrocław. In relation to Galle’s
data, the above-mentioned attempts at verification introduced a substantial correc-
tion not only of the monthly values, but also in the range of the mean annual tem-
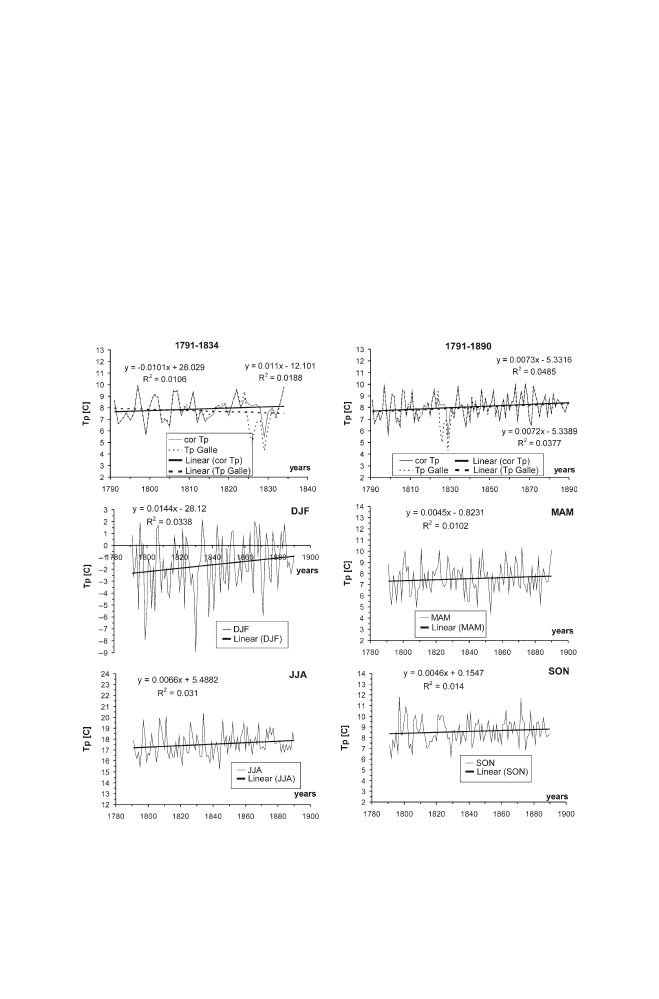
peratures, especially concerning 1824–1830 (Fig.
).
Fig. 25.3
The courses and linear trends of mean annual (upper graphs) and seasonal air tempera-
ture (Tp) in the years 1791–1890 in Breslau-Sternwarte: December–February (DJF), March–May
(MAM), June–August (JJA), September–November (SON). Explanation: cor Tp – corrected Tp
values; Tp Galle – uncorrected Tp values calculated by Galle

492
K. Bry
ś and T. Bryś
Another problem arose when we attempted to calculate the means for 1837–1845,
that is, for a period when observations were made at 6h, 9h, 12h, 15h and 21h.
The average Tp values calculated from these times for the period of March–October
are different from the mean values of 6h, 14h and 22h. The biggest differences
(0.5°C–0.8°C) at a height of 26 m (i.e., about 3 m lower than the measurements in
Sternwarte) were noticed in Łód
ź and Wrocław (Fig.
) between May and
September. The correction of Galle’s monthly means made by the authors of this
paper is similar but smaller. The mean correction values, calculated on the basis of
a multiple regression of values from other Silesian stations, were lower and
amounted to about 0.6°C in August, 0.5°C in July, and about 0.4°C from April to
June. The differences, which are presented in Fig.
, are linked not only with the
higher observation level in Sternwarte but also with the location of the Observatory
near the Oder River. This specific location was a crucial factor that determined the
lower values of the differences noted in Sternwarte compared with those noted in
other places mentioned above (Łód
ź and Wrocław). Therefore, the corrected values
have significant empirical support in the various analyses which have been made by
the authors and can thus be considered credible.
The data contained in Galle’s works (1857, 1879) relating to the years 1791–
1875 were further supplemented with the air temperature values from the years
1876–1890. The values for this later 15-year period, probably also compiled by
Galle, were collected from three different sources. The first source were the
Wrocław statistical annuals for the years 1876–1890 (Breslauer statistic 1876–
1890); the second, concerning the same years from 1879, are the meteorological
annuals of the Prussian meteorological service (Ergebnisse
–1890); and the
third source, containing data only in the form of mean monthly values for the years
1851–1930, were presented in Klimakunde
. Such an approach made it pos-
sible to carry out an independent verification of the applied temperature data.
25.5 Discussion of Results
Corrections of the Tp values made by the authors of this paper, contrary to those in
Galle’s data, show a rising tendency of mean annual temperature (Fig.
) as
early as the first decades of the nineteenth century. These changes did not yet sig-
nificantly influence the century-long trend between the years 1791 and 1890,
deduced by the authors on the basis of a compilation of unverified monthly values
of Tp given by Galle, and exhibiting a warming tendency in Wrocław of 0.69°C/100
years. After all these corrections, this trend remained for all intents and purposes at
an almost constant level of 0.73°C/100 years.
A decisive factor determining the direction of this centennial trend of mean
annual Tp was a strong trend in the increase of winter (DJF) air temperature, which
in the years 1791–1890 amounted to 1.47°C/100 years. The trends deduced for the
remaining seasons were not of statistical importance but they also exhibited an
increasing tendency (0.44°C/100 years for spring, 0.66°C/100 years for summer
and 0.44°C/100 years for autumn). The year 1799 marked a crucial change in the

493
25 The First One Hundred Years (1791–1890) of the Wrocław Air Temperature Series
winter temperature tendency. Earlier, probably over a period several times longer
than 20 years (as indicated in the published data collected in De Bilt, Berlin,
Vienna, Prague and Warsaw), Wrocław went through a period of decreased winter
temperatures, as did the whole of Central Europe. After 1799, a new tendency of
progressive increases in the Tp set in, rather weak at first until 1830 and then
increasingly stronger (a trend of 2.21°C/100 years from 1799). The period 1799–
1830 had an intermediate character for temperature changes in Wrocław, because
years of very cold winters and autumns alternated with very warm years. Thus the
first three decades of the nineteenth century were the final culmination of the Little
Ice Age in Wrocław, marking a transition to a new era of progressive warming.
Similar Tp courses were noted in Poland for Cracow (Trepi
ńska and Kowanetz
. Earlier, Lamb
had noted the transitional
character of the 1820s and 1830s in Europe.
The temperature series from Wrocław and other stations from Central Europe
show that the tendencies noted there and time of the most important temperature
variations generally agree with the course of climatic changes in whole of Europe
in the nineteenth century. The local differences in values of these trends are closely
connected with the location of the analyzed station and various human-induced
forcings. The influence of urban heat islands (Landsberg
role. These and other causes which also influence uncertainty estimates in regional
and global observed temperature changes (Lamb
; Brohan et al.
always taken into consideration.
Undoubtedly, the relatively infrequent instrumental air temperature measurements
taken in Central Europe in the eighteenth century and the first decades of the nine-
teenth century constitute important reference points for a precise reconstruction of
climate change (Flohn
; Lamb
. Difficulties in obtaining the Wrocław mea-
surements from the archives resulted in a decision to publish part of the mean daily Tp
values (1791–1800) cited by Galle
. In addition, we have included
in Table 25.3 a version, of the earliest century-long series (1791–1890) of Wrocław
mean monthly Tp values (Table
) corrected using the procedure described above,
as well as the longest Tp series from other Silesian stations (1805–1851).
25.6 Temperature Measurements in Other Silesian Stations
Temperature data sets from other Silesian stations permitted the authors to recon-
struct the Wrocław Tp series. Most important here were the results of the longest
measurements (i.e., those of over 10 years).
The first provincial series, taken from 1805 to 1851, was the Leobschütz series
(now Głubczyce near Opole).
10
Observations there were carried out from a northern
10
The first meteorological measurements in the Silesian region outside of Wrocław took place in
1717–1730 in Oława (then Ohlau) and were connected with the work of Kanold and Büchner
mentioned earlier (see: Note 2). The history of regular air temperature measurements, based on
the model of three observation times and location stability, originated in the Lower Silesian prov-
ince just 14 years after measurements were first begun in 1791 in the capital of Lower Silesia.

494
K. Bry
ś and T. Bryś
Table
25.1
A
verage
diurnal
air
temperature
(Tp)
values
[°C]
in
W
rocław
(Breslau-Sternwarte
Observatory)
in
the
years
1791–1800
d.
1791
I
II
III
IV
V
VI
VII
VIII
IX
X
XI
XII
1
*
*
1.5
2.1
15.6
16.4
20.9
24.4
15.9
7.5
−3.5
2.1
2
*
*
1.9
2.8
14.5
20.6
17.8
23.8
12.3
7.5
−2.9
3.6
3
*
*
4.4
5.0
7.9
17.1
18.1
18.0
14.4
8.6
−2.5
3.1
4
*
*
4.9
7.1
4.4
14.8
18.8
16.0
18.5
9.0
−0.9
3.1
5
*
*
6.3
9.6
4.4
16.0
16.9
17.3
16.5
8.9
−0.9
4.0
6
*
−5.4
7.0
9.4
3.6
17.5
17.3
19.1
14.4
9.9
−6.0
2.9
7
*
−4.1
4.3
9.9
2.8
17.5
16.5
20.6
14.9
10.5
−5.4
4.4
8
*
−2.1
1.5
9.0
5.5
17.8
18.1
22.5
16.6
12.3
−5.0
2.9
9
*
−2.9
1.4
10.3
6.8
17.3
17.1
18.0
17.1
9.3
−5.0
0.0
10
*
−1.3
3.6
12.6
10.0
14.6
14.9
17.3
16.1
10.6
−5.4
−1.6
11
*
−2.5
2.5
10.1
13.4
15.4
16.4
21.4
13.9
12.5
−1.8
−3.5
12
*
−0.4
1.8
11.4
13.0
10.0
18.1
23.1
13.6
13.8
−2.8
−3.8
13
*
2.5
4.6
6.4
14.0
11.4
14.0
22.9
14.6
14.1
−2.8
−3.3
14
*
2.8
4.5
6.3
14.5
13.0
13.1
23.0
15.5
14.1
−0.9
−0.4
15
*
4.0
6.4
8.0
13.0
15.3
15.0
21.4
12.9
14.0
2.1
−0.4
16
*
3.4
10.3
10.9
13.5
15.8
17.6
19.6
9.9
11.1
1.3
0.5
17
*
2.3
7.9
10.8
10.8
14.5
17.5
17.5
10.6
7.1
3.1
0.0
18
*
2.0
2.0
11.8
8.6
16.6
18.3
21.3
10.5
6.5
7.3
0.3
19
*
2.3
3.3
13.6
8.3
17.1
18.6
18.8
10.4
10.8
6.6
2.1
20
*
3.1
5.0
15.0
10.0
17.6
19.8
14.6
8.9
11.5
6.6
−1.3
21
*
4.8
4.9
15.6
13.1
13.8
18.8
18.5
10.3
13.4
5.0
−4.0
22
*
1.3
4.8
14.5
16.6
16.3
15.4
19.5
10.3
12.3
5.9
−6.3
23
*
0.3
5.0
14.5
17.9
16.3
18.1
18.4
9.6
10.9
5.6
−4.3
24
*
4.6
3.9
11.1
20.3
16.4
19.8
19.1
11.6
7.1
4.3
0.4
25
*
2.8
3.4
12.8
21.3
16.1
16.5
20.4
11.3
3.5
3.4
−2.3
26
*
1.6
1.9
9.4
14.6
16.8
20.9
17.1
10.1
3.4
5.3
−4.4
27
*
2.6
3.0
11.4
14.8
19.1
22.3
14.8
9.4
1.9
4.1
−1.0
28
*
4.0
4.0
10.8
17.4
20.3
20.9
16.8
9.1
−0.4
5.8
−3.0
29
*
4.8
13.5
15.9
21.0
19.3
15.4
9.4
−0.8
6.0
−0.6

495
25 The First One Hundred Years (1791–1890) of the Wrocław Air Temperature Series
30
*
6.0
14.4
12.9
22.5
22.1
14.0
8.8
−3.1
3.4
−0.4
31
*
1.9
13.1
22.6
13.5
−3.5
−1.5
d.
1792
I
II
III
IV
V
VI
VII
VIII
IX
X
XI
XII
1
−5.0
3.6
−9.9
7.1
15.3
17.3
15.0
17.9
16.0
8.4
7.9
−0.4
2
−0.3
4.3
−9.1
8.4
8.0
20.0
12.1
18.1
17.1
7.3
7.5
−6.6
3
−0.4
4.4
−4.1
7.6
6.1
19.0
13.8
17.5
16.3
5.4
6.5
−7.8
4
−3.0
2.4
0.6
6.9
6.3
16.6
15.9
16.3
16.5
4.8
1.3
−6.0
5
−4.1
0.6
4.6
6.0
10.4
15.0
16.5
17.1
17.8
4.8
1.5
0.9
6
−3.0
−0.5
0.4
4.9
6.5
17.1
16.0
16.6
15.6
4.1
1.0
1.9
7
−0.9
−1.6
0.4
3.5
9.1
19.6
14.1
15.6
12.6
4.3
3.1
4.4
8
−8.1
3.6
2.5
4.1
12.3
21.6
17.8
15.9
14.8
4.4
4.6
−0.4
9
−9.3
1.5
1.0
6.9
9.6
12.8
20.0
18.4
15.0
3.4
5.4
0.0
10
−1
1.5
0.5
−5.9
8.3
5.9
16.4
21.6
18.8
15.6
2.8
2.1
3.4
11
−6.8
1.6
−7.1
8.3
4.0
19.1
19.8
18.4
11.4
2.9
4.4
2.8
12
−2.8
2.4
−5.4
10.1
4.8
13.8
22.3
18.5
9.6
4.0
1.5
2.3
13
−8.3
−6.5
−3.9
11.3
7.1
14.0
20.3
18.4
9.5
6.3
1.5
−0.3
14
−1
1.1
−5.9
−3.0
4.0
6.0
16.9
18.5
17.5
10.9
7.8
2.5
−3.4
15
−7.1
−7.3
1.9
1.6
5.3
11.5
17.9
15.6
12.0
10.6
7.1
−0.4
16
−4.4
−17.9
2.1
2.5
8.1
12.6
17.3
14.4
7.3
10.0
3.3
−3.4
17
−3.8
−15.0
2.0
6.3
10.3
12.8
21.0
16.6
8.1
9.6
2.3
−2.8
18
−3.4
−10.1
4.9
8.4
12.5
14.8
23.3
15.6
7.8
10.0
2.8
0.3
19
−2.8
−9.3
6.5
2.9
9.8
16.6
23.1
16.3
7.1
6.8
2.6
2.3
20
−4.1
−6.3
2.3
1.0
13.5
13.1
22.0
13.9
8.5
5.0
−1.9
3.1
21
−5.0
−6.3
1.1
−0.9
16.3
12.8
24.1
14.1
10.9
7.1
−3.3
2.9
22
−7.1
−5.6
2.3
1.5
15.3
12.9
17.3
16.3
10.9
8.5
−3.1
1.0
23
−6.1
−9.0
3.8
7.1
7.6
14.8
15.9
16.3
9.1
8.5
−2.5
0.3
24
−1.6
−5.4
4.9
10.0
7.1
17.8
16.3
14.4
9.1
8.1
−2.3
−1.6
25
−1.8
−4.0
7.1
10.9
8.8
17.3
14.0
14.0
8.1
6.0
−1.0
−1.3
26
3.4
−4.8
10.8
9.4
10.1
12.3
15.3
17.1
8.5
1.3
−2.1
−1.0
(continued)

496
K. Bry
ś and T. Bryś
27
3.8
−8.4
7.4
10.4
11.9
10.9
17.9
20.6
8.8
1.0
−0.3
0.9
28
3.1
−8.4
6.1
10.9
10.9
14.6
21.3
20.6
6.6
0.4
−2.3
−0.4
29
3.5
−9.3
5.9
13.8
16.6
14.6
13.3
19.1
6.9
−2.3
−1.5
−1.6
30
1.4
5.8
14.8
19.1
19.6
14.1
14.8
7.5
0.1
−1.0
−3.4
31
1.5
6.0
20.0
15.9
14.4
4.8
−3.1
d.
1793
I
II
III
IV
V
VI
VII
VIII
IX
X
XI
XII
1
−3.1
−0.4
5.0
3.8
10.6
6.5
19.4
13.8
14.0
10.4
3.8
−0.4
2
−3.5
−0.6
5.0
0.4
10.0
5.9
20.6
15.9
18.8
12.1
3.8
4.1
3
−4.4
1.3
7.1
0.9
9.4
10.6
13.8
19.8
17.9
10.0
3.4
−3.8
4
−4.1
3.4
2.9
2.1
7.3
13.8
14.6
20.0
15.3
9.1
2.1
−6.3
5
−5.3
0.9
3.8
1.9
8.6
16.0
16.3
18.5
12.1
10.9
3.4
−5.9
6
−6.9
1.5
0.6
0.4
10.4
18.5
16.0
18.4
10.9
12.9
3.4
−5.4
7
−6.5
0.9
1.5
0.3
10.6
19.6
19.0
19.6
11.5
10.9
2.1
−0.4
8
−8.8
−0.4
−1.4
0.6
10.4
20.4
19.8
20.4
12.5
10.4
−0.9
−2.5
9
−15.3
−0.4
−1.5
2.4
12.1
18.8
16.3
18.5
13.8
11.3
0.0
−8.4
10
−16.0
−1.3
−3.5
3.4
16.3
14.6
15.9
17.1
14.6
11.3
1.3
−2.5
11
−1
1.9
−0.4
−4.6
5.4
18.5
17.9
16.0
17.8
12.9
10.9
5.4
−1.0
12
−5.6
0.1
−2.9
6.6
17.4
19.6
18.1
15.9
10.4
10.4
5.9
5.4
13
−5.9
−0.4
−1.0
7.9
17.3
17.9
18.1
16.6
11.6
12.5
3.8
−1.6
14
−6.0
−1.0
0.8
4.4
15.4
15.3
16.9
20.6
15.0
12.5
7.9
3.8
15
−5.6
−0.9
2.8
4.3
11.5
14.1
21.3
18.8
15.0
10.0
4.6
2.9
16
−7.3
−0.6
1.6
0.6
9.0
11.5
21.0
16.6
15.0
9.6
5.0
4.1
17
−7.3
0.0
2.1
2.9
9.1
14.6
25.4
14.6
12.1
6.6
4.6
5.6
18
−10.3
−1.0
3.8
2.3
10.9
9.0
29.0
16.6
11.3
6.3
5.0
2.1
19
−6.3
−1.6
4.6
5.9
8.8
8.4
26.3
14.1
10.9
7.9
3.8
3.9
20
−1.5
−0.8
1.6
3.4
10.0
11.3
19.8
15.1
5.4
7.9
1.6
2.1
21
−1.6
−1.4
0.3
3.0
10.9
9.6
16.5
13.4
3.8
7.9
0.4
1.4
22
0.3
−1.3
0.0
2.9
10.4
10.9
12.1
14.6
9.6
3.4
1.3
2.3
Table
25.1
(continued)
d.
1792
I
II
III
IV
V
VI
VII
VIII
IX
X
XI
XII

497
25 The First One Hundred Years (1791–1890) of the Wrocław Air Temperature Series
(continued)
23
1.0
−1.1
1.3
4.0
6.6
10.9
11.6
18.4
11.6
1.6
1.3
2.1
24
0.6
2.5
1.3
4.0
6.3
10.3
14.1
12.9
10.5
1.3
1.3
1.0
25
−0.6
4.0
0.9
7.3
6.4
11.3
16.9
12.1
10.9
3.4
1.6
1.3
26
−5.3
2.5
1.0
8.5
6.5
12.1
18.4
10.9
10.0
10.0
0.9
0.1
27
−2.1
2.9
−5.9
6.3
7.1
15.6
19.6
12.9
7.9
11.6
1.6
−1.3
28
−0.9
4.1
−3.1
10.5
9.6
19.1
19.6
14.0
7.5
8.8
1.3
−1.0
29
1.0
1.6
10.6
9.5
19.6
19.3
14.6
11.3
9.1
−0.9
−1.0
30
1.0
2.6
11.5
7.1
20.1
16.6
13.8
12.9
9.6
−0.9
0.4
31
0.4
4.0
6.5
15.3
17.9
7.9
0.5
d.
1794
I
II
III
IV
V
VI
VII
VIII
IX
X
XI
XII
1
−1.4
2.9
−6.5
1.4
13.8
10.9
17.5
21.6
14.8
8.5
4.0
1.3
2
−1.8
1.6
−2.9
−0.1
13.4
6.6
18.9
18.6
13.5
8.1
6.0
1.9
3
−1.4
0.3
−0.5
3.5
5.9
12.1
19.3
14.1
13.8
10.9
7.3
0.0
4
−1.8
−0.4
0.4
3.0
10.9
13.4
19.1
15.0
12.3
11.6
6.6
−0.4
5
−2.6
−1.6
5.4
3.1
14.6
12.1
16.4
14.8
10.5
9.9
6.9
−0.4
6
−6.3
−2.1
3.8
3.9
12.5
11.6
16.4
14.1
9.6
10.9
7.5
2.1
7
−7.1
−2.5
1.3
6.6
11.3
12.8
17.1
15.9
12.1
8.0
8.4
0.5
8
−2.8
−0.4
0.4
7.9
14.6
12.6
18.3
17.6
10.5
7.3
8.8
−0.4
9
−1.8
1.3
0.6
7.1
14.3
12.5
19.6
16.9
9.8
6.1
8.4
0.4
10
−1.0
2.3
1.3
7.5
13.8
11.6
18.0
14.6
8.4
6.0
6.1
0.5
11
−2.1
1.6
1.4
3.9
12.5
13.4
18.4
14.1
8.8
10.3
6.0
1.3
12
−1.3
1.3
3.4
5.0
16.3
17.1
17.9
13.9
9.6
11.0
4.4
1.5
13
0.5
0.3
3.8
4.9
11.6
16.6
18.0
12.5
10.0
9.1
3.1
−0.3
14
−0.9
1.3
3.1
7.5
9.6
18.0
18.8
13.1
9.6
9.6
3.0
−6.4
15
−0.4
2.5
5.0
9.6
13.0
16.6
17.9
13.4
7.9
8.9
2.1
−8.1
16
−1.0
2.5
7.8
8.5
13.4
16.3
16.8
14.6
8.4
7.1
1.3
−8.8
17
−0.6
0.0
8.0
7.9
11.8
17.1
19.6
15.4
10.3
6.0
−0.5
−9.4
18
1.3
0.3
8.9
7.9
12.1
20.0
18.4
16.4
12.5
7.5
−2.8
−1
1.8
19
0.3
−1.3
7.9
8.8
12.9
20.5
19.1
15.5
13.4
7.3
−2.3
−1
1.3

498
K. Bry
ś and T. Bryś
20
1.0
−4.1
8.4
9.1
15.4
19.8
20.4
15.5
15.6
6.3
−1.3
−10.9
21
0.4
1.6
7.5
10.9
10.4
19.8
19.1
12.5
11.0
5.3
−3.5
−7.3
22
−4.6
5.0
5.5
10.0
9.1
18.4
19.1
13.9
11.0
5.0
−0.9
−6.8
23
−3.5
7.5
6.9
10.0
8.4
16.8
24.1
14.1
13.0
4.8
−1.3
−12.1
24
1.3
7.1
4.9
10.4
8.6
21.3
23.4
15.5
14.9
7.8
−1.9
−13.5
25
0.0
6.3
3.4
11.6
8.4
23.4
20.9
15.5
12.0
8.6
0.9
−4.3
26
0.5
3.8
3.0
12.3
11.6
22.5
20.0
17.3
8.9
9.6
3.4
−1.8
27
0.4
−1.8
5.1
13.5
11.3
23.4
18.9
18.6
7.5
6.6
2.4
−1.9
28
1.0
−5.4
6.0
13.4
12.3
12.3
16.6
16.3
6.6
6.4
2.5
−4.3
29
−3.4
6.4
9.6
11.6
15.0
17.5
15.1
7.5
5.6
1.6
−5.3
30
−0.5
6.6
10.9
12.1
15.1
18.8
13.8
8.8
3.0
2.8
−4.0
31
0.9
6.6
9.3
22.1
15.9
3.9
−6.6
d.
1795
I
II
III
IV
V
VI
VII
VIII
IX
X
XI
XII
1
−8.4
−7.9
0.9
3.8
20.0
10.9
14.6
20.0
14.6
9.1
9.4
−8.1
2
−13.5
−7.3
−1.3
2.9
20.1
12.1
13.5
18.9
12.8
12.1
8.5
−3.5
3
−16.0
−3.8
−2.8
4.4
20.0
15.0
12.1
19.6
14.1
12.3
7.1
0.9
4
−14.6
−3.1
−1.0
5.0
17.1
16.6
15.0
17.9
16.0
12.3
2.5
3.8
5
−6.3
−1.4
−0.9
5.9
18.4
13.5
10.4
19.1
16.3
13.8
0.0
1.3
6
−1.8
−2.1
3.5
7.3
15.9
15.9
10.4
17.1
17.3
14.4
2.8
1.5
7
−1.0
−4.0
3.9
9.8
12.9
17.9
14.1
14.6
16.0
10.9
1.3
0.4
8
−1.3
−5.9
1.0
8.4
9.6
21.3
17.1
17.5
17.0
8.1
1.3
−0.9
9
−1.4
−0.9
−1.9
9.0
3.1
20.6
15.9
19.6
19.8
10.3
1.0
−1.0
10
−4.3
3.9
−1.8
10.0
3.9
22.3
18.4
14.6
18.5
12.8
−1.0
0.0
11
−7.3
4.9
1.3
9.1
7.1
22.3
15.9
14.6
18.8
9.6
0.6
−1.5
12
−6.5
2.5
0.5
9.0
5.1
19.6
17.9
14.9
14.8
8.4
−0.9
−1.5
13
−8.8
5.4
0.5
4.6
2.9
16.6
15.4
15.4
15.4
6.9
4.6
−1.0
14
−13.4
−1.6
−5.6
2.1
2.9
12.1
13.4
16.8
14.6
7.9
0.6
−1.6
15
−17.5
−5.1
−7.5
2.4
4.4
14.1
13.4
16.6
13.4
12.1
−1.3
3.8
16
−12.6
−4.1
−0.4
4.0
10.4
15.0
11.0
17.5
12.9
12.5
−0.6
3.4
Table
25.1
(continued)
d.
1794
I
II
III
IV
V
VI
VII
VIII
IX
X
XI
XII

499
25 The First One Hundred Years (1791–1890) of the Wrocław Air Temperature Series
(continued)
17
−10.6
−6.0
2.9
10.6
10.9
16.6
10.9
16.6
12.9
11.3
−2.1
2.1
18
−1
1.1
−8.9
0.0
9.6
15.1
18.8
11.3
15.4
9.0
9.1
−2.9
1.9
19
−1
1.3
−9.8
−2.1
10.4
18.4
13.8
10.5
14.1
9.8
12.9
1.5
1.6
20
−15.1
−6.8
−1.3
12.1
20.0
12.3
12.5
13.9
9.1
11.5
4.4
1.5
21
−16.3
−4.4
−0.4
10.5
13.8
12.1
16.3
16.8
7.1
15.4
3.4
5.9
22
−17.8
−4.4
0.4
11.3
14.1
11.6
12.9
15.9
8.0
13.4
0.4
6.5
23
−17.9
−1.6
1.5
12.8
11.6
13.8
18.4
13.4
7.1
13.4
2.4
2.3
24
−16.0
0.8
1.1
11.3
13.4
11.9
17.5
14.1
8.4
12.3
2.5
2.3
25
−12.3
1.5
3.4
11.1
9.1
13.4
16.6
15.9
9.1
12.5
4.0
2.3
26
−10.5
2.6
4.8
14.6
5.5
14.6
15.9
15.4
12.5
13.8
3.4
1.9
27
−6.5
0.4
5.5
14.0
5.1
12.1
14.1
16.3
8.8
11.6
1.3
−0.9
28
−2.1
2.5
3.4
16.6
8.0
13.4
14.1
17.1
7.5
10.6
−1.9
0.3
29
−1.3
3.4
16.8
8.0
15.4
18.8
15.4
8.4
9.8
−1.0
5.3
30
−5.5
2.1
18.5
9.8
14.8
20.4
15.3
7.9
8.5
−0.3
5.0
31
−7.9
5.4
9.6
22.9
17.9
6.9
4.8
d.
1796
I
II
III
IV
V
VI
VII
VIII
IX
X
XI
XII
1
4.1
9.4
−5.0
2.5
15.0
19.6
17.9
17.9
11.6
7.9
4.4
−2.9
2
3.4
7.5
−5.4
4.1
9.1
20.4
19.3
16.6
11.6
7.5
3.4
−4.8
3
3.8
6.6
−7.1
2.9
9.1
22.9
18.5
17.9
12.1
8.8
7.8
−9.1
4
1.9
4.1
−1
1.0
3.8
7.1
12.9
19.8
19.6
13.8
8.8
9.4
−4.6
5
3.5
5.0
−9.8
3.4
8.8
11.9
17.1
18.4
11.3
9.6
8.8
−5.3
6
4.8
4.0
−1
1.6
4.4
5.9
9.8
13.0
15.9
10.4
13.4
4.8
−3.8
7
4.6
3.1
−8.8
3.8
12.9
13.4
17.3
16.3
10.9
11.3
3.5
−2.8
8
2.1
2.1
−9.1
3.8
10.9
15.4
17.9
16.6
12.1
9.6
3.5
−2.9
9
0.9
4.0
−5.0
4.6
13.8
17.8
16.5
16.6
11.3
7.4
4.0
−3.8
10
1.3
2.3
−4.1
4.0
10.9
12.9
15.0
18.8
13.4
7.5
3.4
−4.0
11
4.1
0.6
−3.8
5.0
13.4
17.9
13.5
17.5
13.4
5.9
−0.6
−2.8
12
4.1
−2.1
−2.9
0.6
11.6
20.4
12.1
20.9
13.8
6.3
−1.0
−3.4
13
4.6
−1.6
−1.3
2.3
12.9
17.8
13.4
18.8
14.6
6.6
0.0
−3.1
14
5.0
0.3
−0.9
3.8
10.4
22.5
13.4
18.8
15.9
6.5
0.3
−2.5

500
K. Bry
ś and T. Bryś
15
5.6
−1.0
−1.3
6.0
11.6
18.4
15.4
18.4
16.3
10.6
−1.9
−3.8
16
5.0
0.6
0.0
4.1
15.0
11.3
21.3
16.6
16.3
7.8
−1.0
−7.1
17
3.8
−1.3
0.9
6.0
13.8
15.0
20.4
17.9
16.6
5.3
−0.6
−5.3
18
5.3
0.0
−0.4
4.8
14.0
16.6
20.0
16.6
20.0
5.3
−1.6
−4.4
19
6.3
−1.5
0.0
6.3
13.0
17.5
20.0
15.4
14.1
10.3
−1.9
1.5
20
5.3
−2.8
0.9
5.9
16.6
20.9
17.9
16.3
12.9
9.8
−2.3
3.4
21
6.6
−3.5
2.1
5.4
17.3
15.4
20.0
17.1
13.4
7.1
−2.3
−0.6
22
6.3
−3.4
1.6
5.4
18.8
15.9
20.9
15.9
12.9
7.8
−2.3
1.0
23
6.0
−4.6
−1.9
5.3
15.4
17.8
19.8
17.5
11.3
10.9
−2.5
1.6
24
5.0
−3.8
−2.5
6.3
16.6
17.9
16.6
18.8
10.4
9.0
−2.9
0.9
25
4.6
−2.8
−2.1
4.1
15.3
15.4
17.5
18.4
10.4
5.3
−2.8
−2.3
26
3.5
−7.3
−1.0
10.4
17.9
20.9
18.8
18.4
9.6
3.1
−3.8
−7.5
27
6.3
−8.8
−1.5
11.5
15.4
22.5
20.4
16.3
8.4
2.8
−4.8
−7.3
28
6.5
−9.6
−0.6
15.4
21.6
22.9
19.6
16.6
9.6
2.8
−2.9
−6.0
29
5.9
−8.4
−0.4
12.9
15.9
16.3
18.8
14.1
7.9
3.5
−2.9
−4.0
30
7.9
0.0
13.4
19.1
17.1
17.9
12.1
9.1
5.6
−2.9
−1.9
31
7.9
1.6
19.1
19.1
12.1
3.8
0.1
d.
1797
I
II
III
IV
V
VI
VII
VIII
IX
X
XI
XII
1
2.1
2.1
0.3
10.0
11.3
19.1
20.6
19.6
20.0
12.5
10.0
5.5
2
1.9
4.6
−1.5
9.0
12.3
18.4
21.8
20.0
18.8
12.1
9.0
6.1
3
1.6
4.8
0.4
9.1
13.4
18.8
19.6
20.6
18.8
11.6
8.8
4.0
4
−1.6
0.6
−0.4
7.1
12.8
19.6
20.1
20.4
16.6
11.8
8.4
3.1
5
−5.0
2.3
−0.9
9.9
12.3
18.0
20.4
20.3
16.6
11.6
7.9
2.5
6
−2.6
1.0
−0.3
9.1
11.9
20.5
15.9
20.6
16.3
12.0
7.5
2.3
7
−4.8
−0.9
−2.1
9.6
10.3
20.1
15.1
20.4
16.0
11.0
8.0
1.6
8
−4.4
−2.3
0.0
10.0
12.1
18.9
14.6
21.0
16.6
9.8
8.8
1.0
9
−4.8
−2.1
−1.5
11.6
13.8
20.9
15.5
21.5
16.5
10.3
8.0
1.9
10
−5.6
−1.5
−1.5
11.6
13.4
21.8
18.4
22.1
17.5
10.9
7.5
2.1
Table
25.1
(continued)
d.
1796
I
II
III
IV
V
VI
VII
VIII
IX
X
XI
XII

501
25 The First One Hundred Years (1791–1890) of the Wrocław Air Temperature Series
(continued)
11
−8.3
1.5
−2.3
12.5
14.6
21.3
21.4
22.5
18.1
10.0
7.4
2.5
12
−7.1
1.9
−2.5
10.9
14.4
16.8
22.6
24.4
18.1
10.4
8.8
2.6
13
−3.9
4.1
−1.6
9.0
14.6
18.8
23.4
23.4
18.1
11.9
9.0
2.1
14
0.1
3.8
−1.6
9.0
15.3
21.9
23.9
21.6
17.9
12.3
8.8
0.3
15
0.9
2.9
0.0
7.4
15.6
21.4
22.9
20.6
17.1
10.9
8.1
0.4
16
−0.9
−0.4
−2.8
7.1
12.5
19.1
23.1
21.6
17.8
11.6
7.3
0.8
17
−1.4
0.6
−0.6
4.1
11.3
11.4
24.4
19.0
18.5
10.9
6.6
0.8
18
−1.4
1.0
−4.1
1.6
12.3
13.4
22.5
20.0
18.5
10.0
6.9
0.4
19
−0.5
0.9
−2.5
0.3
12.5
18.4
24.1
21.0
19.1
9.8
6.9
−1.3
20
0.1
0.6
−7.5
−0.4
11.6
15.0
23.1
17.5
18.8
8.4
7.1
−1.3
21
2.1
2.1
−5.0
−1.3
12.8
15.0
23.3
17.1
16.0
8.1
7.9
−1.3
22
3.9
3.3
−3.1
0.4
12.8
15.9
20.6
17.5
16.9
8.1
8.1
−0.6
23
2.9
2.1
−0.9
3.5
12.1
17.1
21.3
15.0
16.3
8.8
7.8
−0.9
24
0.0
2.1
4.4
7.5
13.8
16.3
21.6
15.4
16.6
9.4
7.1
−2.4
25
1.6
3.1
6.9
11.3
15.0
18.1
23.4
16.6
17.3
10.0
6.3
−2.8
26
−0.3
2.3
7.5
12.9
15.9
18.4
17.9
17.1
16.9
10.9
6.0
−3.8
27
0.4
−1.6
10.3
13.8
16.3
19.0
19.1
18.1
16.3
11.0
6.0
0.4
28
−0.1
0.3
10.4
14.0
16.5
20.0
21.5
20.4
16.3
10.6
5.9
0.9
29
0.5
10.9
15.0
16.9
19.1
19.1
21.6
15.6
10.0
6.5
−0.9
30
0.4
8.8
14.4
17.3
20.0
18.4
21.3
14.8
10.6
7.3
0.6
31
0.0
9.0
18.1
20.0
20.6
10.9
−2.1
d.
1798
I
II
III
IV
V
VI
VII
VIII
IX
X
XI
XII
1
−0.9
0.9
0.4
0.6
10.3
15.9
20.9
19.8
14.1
10.9
4.6
4.0
2
−1.3
1.4
0.6
1.0
11.9
20.0
20.9
21.3
12.8
10.6
4.8
4.8
3
−0.6
3.9
2.8
2.3
12.8
20.6
18.4
20.4
12.3
11.5
7.8
4.6
4
−4.0
5.0
3.8
5.9
12.5
21.6
17.1
21.0
17.5
10.6
7.5
5.3
5
−4.8
0.1
6.5
6.3
11.9
19.8
19.6
22.8
21.5
9.6
6.3
3.8
6
−2.3
−3.0
2.6
10.6
12.9
20.3
20.4
19.6
20.4
10.0
6.0
0.4
7
−5.9
−3.0
0.3
10.9
13.4
20.3
20.3
15.9
19.8
9.4
6.6
0.4
8
−5.4
2.9
3.5
9.1
14.1
21.6
21.0
18.1
18.8
10.0
7.5
−5.3

502
K. Bry
ś and T. Bryś
9
−9.1
0.9
4.8
7.9
16.6
19.6
20.0
18.5
19.6
9.6
6.6
−5.9
10
−7.8
2.9
5.0
4.1
16.6
17.5
20.0
19.0
21.3
8.5
6.3
−6.0
11
−5.9
5.9
3.6
1.9
16.3
16.6
21.3
18.8
20.9
7.8
6.0
−7.1
12
−3.4
5.0
0.4
4.6
15.3
15.9
20.3
18.4
17.8
7.3
5.0
−9.0
13
−2.9
4.6
−4.6
6.5
14.4
16.6
17.5
19.0
13.5
6.0
5.3
−1
1.9
14
−0.6
4.1
−0.6
8.4
14.8
14.0
17.9
18.5
14.1
4.6
4.1
−7.3
15
1.5
4.8
2.9
10.3
17.5
15.3
19.1
16.3
15.9
4.5
4.4
−8.1
16
1.3
6.3
5.9
11.3
20.4
18.4
17.9
18.8
13.8
4.1
4.0
−14.0
17
2.5
2.8
6.3
12.1
19.6
17.8
18.4
17.5
14.4
4.5
2.8
−15.9
18
0.3
0.4
5.4
13.8
14.1
19.1
18.1
16.5
15.4
7.3
2.1
−19.1
19
2.3
−0.4
3.8
13.8
12.8
18.1
17.5
17.1
15.6
7.1
−0.4
−19.1
20
1.4
−1.6
3.9
10.3
13.8
19.1
19.1
17.3
15.4
8.8
−1.3
−16.3
21
1.6
−2.9
1.0
8.8
12.1
17.5
18.4
17.5
14.6
7.3
−5.0
−14.1
22
2.3
−6.4
1.0
7.9
9.0
17.1
23.1
17.9
14.1
6.0
−5.3
−16.6
23
1.5
−5.3
0.3
6.6
9.0
17.8
18.5
14.6
14.6
4.9
−6.5
−19.6
24
0.6
−0.3
−2.5
8.5
9.6
17.9
17.5
16.6
14.0
4.8
−4.8
−20.9
25
−0.4
3.5
−2.5
8.8
11.6
14.4
17.5
15.0
13.8
6.0
−4.0
−20.0
26
−1.0
1.3
−0.9
8.5
16.3
17.1
17.9
13.8
13.8
6.3
−1.5
−13.4
27
−1.9
0.9
1.3
9.3
16.6
15.9
19.1
12.5
13.8
6.5
−3.8
−12.1
28
−1.0
−3.8
0.0
10.9
17.5
14.0
18.5
14.1
12.9
5.3
−4.1
−10.0
29
−2.9
1.5
11.5
18.1
19.1
17.8
14.4
12.1
3.8
−3.5
−7.9
30
−1.6
−0.3
10.4
19.0
21.3
16.9
14.6
11.5
5.0
0.4
−3.8
31
−1.0
1.6
19.6
17.9
14.6
5.6
−5.4
d.
1799
I
II
III
IV
V
VI
VII
VIII
IX
X
XI
XII
1
−9.6
−8.8
1.6
−5.4
7.1
18.4
15.5
14.0
16.0
11.3
6.5
0.3
2
−1
1.6
−9.6
1.1
−4.6
4.1
17.3
17.6
15.1
15.8
11.5
8.1
1.5
3
−6.0
−3.3
1.8
−4.5
5.4
18.5
17.1
17.0
13.4
11.0
8.1
3.8
4
−5.4
−3.3
1.6
−3.5
7.1
17.0
16.5
17.4
12.8
11.6
8.4
2.3
Table
25.1
(continued)
d.
1798
I
II
III
IV
V
VI
VII
VIII
IX
X
XI
XII

503
25 The First One Hundred Years (1791–1890) of the Wrocław Air Temperature Series
(continued)
5
−5.6
−3.9
−0.3
−2.1
7.9
18.8
16.9
19.4
12.9
11.5
9.0
0.9
6
−5.8
−1
1.0
0.1
−1.0
8.6
14.0
17.9
19.6
12.9
10.9
4.6
1.6
7
−7.3
−18.9
−0.4
6.0
10.3
15.1
18.0
22.6
11.4
10.9
7.1
0.3
8
−7.1
−19.9
0.6
6.9
14.6
17.1
18.8
21.6
9.8
10.4
6.3
−1.9
9
−9.4
−19.8
−1.4
9.0
16.9
19.6
20.8
21.8
11.0
9.8
5.6
−2.3
10
−9.6
−18.0
−1.6
9.1
17.4
16.9
19.4
20.5
11.3
10.0
5.9
−2.3
11
−12.9
−15.0
−0.5
7.4
13.5
18.6
18.9
18.6
10.6
8.5
5.0
−3.1
12
−19.4
−7.9
−0.4
7.8
9.4
11.8
19.4
18.4
11.6
9.1
4.1
−4.1
13
−18.8
−13.3
0.8
7.5
11.1
11.5
17.6
16.5
11.9
6.0
5.9
−3.1
14
−15.4
−15.8
1.3
6.9
9.9
10.0
14.3
15.8
10.4
6.6
6.0
−5.4
15
−14.8
−6.1
2.6
9.4
10.3
10.3
14.6
16.5
12.1
7.8
5.0
−7.0
16
−10.3
−1.5
2.8
14.0
14.1
11.0
16.1
16.5
11.3
6.5
2.9
−9.8
17
−1
1.3
0.6
0.4
12.1
11.3
11.5
14.0
16.8
11.3
7.1
5.6
−5.4
18
−1
1.6
−4.1
0.4
11.3
9.1
12.9
13.0
17.1
11.5
5.9
5.6
−5.5
19
−12.1
−2.5
0.4
11.3
10.3
11.0
15.1
16.4
11.9
5.6
3.8
−12.0
20
−13.3
2.0
0.3
8.8
15.0
11.3
15.9
17.6
13.1
6.3
5.1
−15.0
21
−12.3
2.6
−1.3
9.6
17.1
13.8
13.1
18.0
12.8
5.4
6.0
−14.6
22
−1
1.3
4.1
−2.9
9.1
13.1
16.1
13.6
16.6
12.3
6.3
6.1
−10.6
23
−1
1.0
3.6
−0.3
8.1
10.9
14.4
14.9
16.3
12.1
7.9
3.8
−10.4
24
−9.4
1.5
−0.9
8.4
11.5
13.8
16.1
17.0
12.3
6.5
2.1
−8.4
25
−1.0
1.6
−2.5
10.0
12.9
9.4
15.6
14.4
11.9
8.5
0.9
−7.1
26
−1.3
1.3
−0.9
7.1
9.0
10.1
14.9
13.0
12.1
9.0
0.9
−7.6
27
0.3
1.3
0.0
6.5
10.9
12.4
15.8
13.5
12.1
7.9
4.1
−12.8
28
−0.8
1.6
1.3
5.4
11.6
14.5
16.6
14.4
12.1
5.4
0.6
−22.8
29
−2.8
−3.1
6.5
10.4
14.3
17.1
17.1
10.9
6.3
−1.5
−23.4
30
−5.3
−5.1
6.0
11.5
14.4
15.5
15.1
11.3
5.4
0.4
−17.9
31
−5.9
−5.6
15.0
12.5
14.1
5.9
−10.3
d.
1800
I
II
III
IV
V
VI
VII
VIII
IX
X
XI
XII
1
−9.8
4.0
−5.6
9.1
15.9
17.6
14.6
17.9
15.4
11.5
7.1
0.0
2
−8.9
3.4
−5.3
9.6
17.1
19.1
13.9
20.0
16.6
10.8
5.6
1.3

504
K. Bry
ś and T. Bryś
3
−12.0
3.4
−3.8
9.0
16.6
19.1
16.0
20.9
16.0
9.8
7.3
0.8
4
−10.5
3.8
−4.0
9.9
15.3
19.0
16.5
23.8
14.0
11.8
8.8
−0.4
5
−1
1.8
2.8
−4.4
10.9
12.1
20.4
18.6
17.3
17.3
10.8
7.6
−1.3
6
−1
1.4
0.6
−6.9
12.1
13.5
20.0
20.5
15.3
18.1
10.1
5.9
2.5
7
−1
1.6
−1.8
−9.0
11.3
15.3
17.9
19.6
15.3
18.6
12.6
4.6
4.0
8
−8.8
−2.3
−1
1.6
13.4
16.9
13.8
22.0
14.4
17.9
14.6
7.3
1.5
9
−10.6
−6.9
−8.1
16.4
17.5
15.3
24.8
15.4
16.4
15.4
11.9
0.0
10
−13.3
−6.9
−8.4
16.6
17.4
14.6
20.8
18.0
17.0
14.4
7.8
0.4
11
−1
1.9
−10.4
−8.8
14.4
6.6
13.4
13.5
16.1
16.1
10.3
6.6
2.9
12
−8.4
−12.8
−8.3
8.3
6.0
14.8
17.1
17.9
13.3
11.1
10.0
2.1
13
−6.6
−12.3
−7.9
9.1
10.9
13.5
16.6
20.0
12.5
10.5
6.8
2.5
14
−3.5
−7.9
−2.9
11.8
13.8
15.3
14.8
21.5
13.8
9.9
5.8
2.5
15
−2.5
−3.6
−3.1
13.9
10.3
13.5
13.4
22.5
14.3
9.6
3.4
−0.3
16
−1.9
−2.8
−4.9
13.1
12.8
11.3
11.6
21.0
15.5
9.3
5.6
−2.9
17
−2.4
−4.3
−6.4
16.6
15.3
10.3
14.3
18.8
15.6
5.8
6.8
−4.5
18
2.6
−5.9
−5.9
17.3
14.4
10.4
13.8
20.8
16.3
5.4
6.5
−7.5
19
3.4
−7.0
−4.4
14.6
14.1
11.3
16.0
19.1
18.4
8.5
5.9
−1
1.3
20
0.3
−8.1
−5.0
15.4
14.8
13.1
13.8
21.6
18.4
8.8
2.0
−8.8
21
0.4
−6.9
−4.3
16.5
20.0
15.3
12.5
21.0
17.9
9.1
0.9
−4.4
22
−1.3
−4.8
−10.3
18.9
17.5
16.3
12.9
19.4
16.6
7.9
1.1
0.9
23
−0.9
−0.4
−10.5
19.8
21.3
13.4
14.1
19.0
14.8
5.3
4.3
1.9
24
−1.6
−1.3
−6.3
19.0
23.8
13.8
15.9
20.1
12.4
3.3
4.3
1.3
25
−0.6
−7.9
1.1
18.8
23.1
14.6
17.1
18.1
12.4
2.9
6.6
0.0
26
0.6
−9.6
0.9
19.6
20.0
16.5
16.5
19.1
11.1
7.1
5.1
0.6
27
1.5
−10.0
1.9
21.0
20.6
17.1
16.0
17.3
11.1
8.3
5.5
0.4
28
0.5
−7.8
2.9
20.8
19.8
15.6
16.6
17.5
11.5
7.6
1.9
−0.1
29
1.5
5.0
21.6
20.9
16.5
15.4
15.9
10.1
7.5
1.6
−0.9
30
1.8
6.3
20.6
21.3
17.3
14.6
16.1
11.6
6.1
−1.6
4.1
31
3.0
7.9
20.0
16.3
14.3
5.8
−1.0
Explanation:
d.
=
days
per
month
for
the
year
in
question;
I,
II
…
XII
=
months;
*
lack
of
measurements;
bold
italics
indicate
estimated
values
Table
25.1
(continued)
d.
1800
I
II
III
IV
V
VI
VII
VIII
IX
X
XI
XII

505
25 The First One Hundred Years (1791–1890) of the Wrocław Air Temperature Series
Table
25.2
A
ve
ra
ge
m
on
th
ly
a
ir
te
m
pe
ra
tu
re
(T
p)
v
al
ue
s i
n
W
ro
cł
aw
(B
re
sl
au
-S
te
rn
w
ar
te
Observatory)
in
the
years
1791–1890
Y
ear
I
II
III
IV
V
VI
VII
VIII
IX
X
XI
XII
I–XII
1791
1.3
1.1
4.1
10.3
12.0
16.5
18.1
19.0
12.6
8.2
1.0
−0.4
8.7
1792
−3.4
−4.0
1.4
6.9
10.1
15.6
17.8
16.7
11.2
5.4
1.6
−0.6
6.6
1793
−4.8
0.4
1.0
4.3
10.3
14.1
18.2
16.3
11.9
9.0
2.6
0.1
7.0
1794
−1.3
1.1
4.0
7.7
11.8
16.0
18.9
15.4
10.7
7.6
3.0
−4.1
7.6
1795
−9.6
−2.3
0.6
9.3
11.2
15.3
14.9
16.4
12.6
11.2
1.7
1.2
6.9
1796
4.7
−0.4
−2.9
5.7
13.8
17.2
17.7
17.1
12.5
7.3
0.4
−3.1
7.5
1797
−1.1
1.4
0.6
8.3
13.7
18.4
20.6
20.0
17.3
10.6
7.6
0.8
9.9
1798
−1.6
1.1
1.9
8.1
14.5
18.0
19.0
17.4
15.7
7.2
1.9
−8.6
7.9
1799
−9.0
−5.8
−0.3
6.1
11.2
14.2
16.2
17.1
12.1
8.1
4.7
−6.8
5.7
1800
−4.3
−4.4
−4.2
15.0
16.3
15.3
16.1
18.6
15.0
9.1
5.4
−0.4
8.2
1801
−0.7
−2.5
5.2
8.1
16.6
15.4
17.8
16.3
16.6
10.9
5.1
−0.6
9.1
1802
−3.5
−1.4
3.3
9.6
11.7
16.7
18.4
20.2
13.6
11.3
5.4
0.7
8.9
1803
−12.5
−4.1
1.4
11.5
13.1
15.3
18.7
18.0
10.6
7.7
2.8
−2.8
6.7
1804
0.4
−3.1
−2.3
6.4
13.7
16.1
18.7
17.1
14.9
8.9
−1.8
−5.6
7.0
1805
−7.7
−3.1
0.8
5.7
11.6
14.6
17.0
16.0
15.3
4.4
0.0
0.9
6.3
1806
1.7
1.5
2.7
6.1
15.4
15.2
17.5
18.2
16.9
8.2
4.2
4.5
9.4
1807
−1.0
1.5
0.2
6.3
14.2
16.0
18.9
24.6
14.5
9.7
6.2
0.9
9.4
1808
−2.2
−2.5
−4.5
5.5
14.1
17.3
19.6
20.2
15.8
8.6
2.1
−6.5
7.3
1809
−6.4
1.9
0.2
5.1
14.5
16.8
18.1
19.0
14.9
7.1
3.6
2.6
8.1
1810
−3.7
−2.7
2.6
5.3
12.5
14.2
18.9
18.2
16.0
7.3
3.5
1.2
7.8
181
1
−7.3
−2.2
4.3
8.3
17.3
20.5
20.8
19.1
14.4
12.1
4.0
0.9
9.4
1812
−5.4
−1.2
2.5
3.5
13.7
16.5
17.1
16.7
13.1
11.5
1.3
−8.6
6.7
1813
−5.6
2.6
1.2
9.6
13.2
14.6
17.5
16.3
13.6
7.2
3.2
0.4
7.8
1814
−5.1
−8.8
−0.5
10.1
10.5
14.4
19.7
17.7
10.9
6.7
3.4
1.1
6.8
1815
−6.0
0.8
3.7
7.7
13.1
16.9
15.7
16.5
11.3
8.6
1.6
−4.0
7.2
1816
−0.4
−2.7
1.7
7.2
11.6
15.7
16.9
16.4
12.9
7.7
2.4
−1.4
7.4
1817
1.1
2.6
2.7
2.8
13.3
17.9
17.5
17.7
14.2
4.6
4.2
−2.0
8.1
1818
−0.4
−0.2
3.7
8.3
12.5
15.9
17.9
15.5
14.1
7.2
3.1
−2.2
8.0
(continued)

506
K. Bry
ś and T. Bryś
1819
−0.2
1.5
3.7
7.6
12.1
17.9
18.7
18.2
14.5
7.9
2.1
−4.8
8.3
1820
−6.7
0.1
1.8
9.0
14.2
13.8
16.1
19.8
13.1
8.5
1.4
−3.2
7.3
1821
−1.0
−3.3
1.4
11.0
13.5
13.4
15.8
17.4
15.0
9.1
6.4
2.5
8.5
1822
0.0
2.1
6.4
9.6
14.0
17.4
20.0
17.1
12.9
11.2
5.0
−2.5
9.5
1823
−1
1.3
−1.6
2.8
6.0
14.0
16.7
17.9
18.6
14.3
11.5
4.5
1.4
8.0
1824
−0.4
1.3
1.2
7.3
12.6
15.4
17.3
17.7
16.0
9.6
4.4
2.9
8.8
1825
−1.1
−1.8
−1.1
8.2
13.2
15.8
16.9
17.3
14.1
8.0
5.2
4.5
8.3
1826
−8.4
−0.8
3.0
6.8
11.8
17.0
21.1
20.3
14.2
9.9
2.4
0.8
8.2
1827
−3.1
−8.1
3.4
9.9
15.2
19.1
19.3
17.5
14.1
9.6
−0.2
1.3
8.3
1828
−5.3
−3.4
3.4
10.0
12.9
16.6
19.6
16.5
13.1
7.4
3.6
0.2
7.9
1829
−7.3
−5.7
0.2
7.9
11.6
15.3
18.7
16.8
14.6
6.2
−2.1
−1
1.2
5.5
1830
−9.8
−5.3
1.9
9.5
13.1
18.4
18.3
18.4
13.5
7.4
4.9
0.7
7.6
1831
−6.2
−1.7
1.8
11.0
12.8
15.8
19.5
17.5
13.1
11.3
1.6
−1.4
8.0
1832
−2.4
−1.0
1.9
6.8
11.1
15.5
15.2
18.4
12.2
8.6
2.4
−1.5
7.3
1833
−4.6
2.7
2.3
5.8
16.7
18.3
16.9
14.2
13.5
7.8
3.4
3.7
8.4
1834
2.1
0.3
2.1
6.8
15.7
18.3
22.6
20.1
15.5
9.0
3.2
0.8
9.8
1835
−0.5
1.7
2.6
6.7
13.2
16.8
18.6
16.4
15.0
7.9
−0.7
−2.5
8.0
1836
−2.4
0.8
8.0
8.0
9.5
16.6
16.6
15.9
13.4
10.5
1.9
0.8
8.3
1837
−1.9
−2.5
−0.5
6.3
11.3
15.6
15.5
18.4
12.0
8.6
3.9
−1.5
7.2
1838
−10.5
−5.9
2.6
6.1
13.5
15.7
16.6
15.1
14.9
7.2
0.9
−0.9
6.3
1839
−1.8
−0.1
−0.6
4.1
13.0
17.9
19.1
16.4
15.9
9.4
5.2
−2.0
8.1
1840
−1.7
−1.3
−1.7
6.8
11.3
15.3
17.2
15.9
14.1
6.1
6.1
−8.1
6.7
1841
−2.3
−6.0
3.6
9.1
15.9
16.3
17.1
17.6
14.4
11.9
4.4
2.7
8.8
1842
−5.8
−1.5
3.0
4.7
13.8
15.8
16.9
20.2
14.2
6.5
0.5
2.4
7.6
1843
−0.7
3.6
1.2
7.9
10.9
15.6
17.2
18.0
11.8
8.3
3.3
3.2
8.4
1844
−2.3
−2.3
0.5
7.4
13.1
16.0
14.9
14.9
13.8
9.6
4.6
−5.2
7.1
1845
−0.1
−6.8
−4.5
8.2
11.7
11.7
19.0
16.4
12.5
9.1
5.9
1.6
7.6
Table
25.2
(continued)
Y
ear
I
II
III
IV
V
VI
VII
VIII
IX
X
XI
XII
I–XII

507
25 The First One Hundred Years (1791–1890) of the Wrocław Air Temperature Series
1846
−0.6
1.6
6.0
9.7
12.3
17.9
20.2
21.0
14.4
12.6
2.1
−3.2
9.5
1847
−3.9
−1.3
1.9
5.9
15.1
14.8
17.9
19.3
12.1
7.4
3.9
−0.9
7.7
1848
−10.6
2.3
5.4
11.5
13.4
19.1
18.6
17.2
13.1
11.0
3.5
0.7
8.8
1849
−3.2
2.0
1.3
7.5
14.6
16.7
17.3
16.2
12.2
7.9
2.9
−5.0
7.6
1850
−8.6
2.8
0.0
8.4
14.4
18.2
18.3
18.2
12.2
7.9
4.5
0.9
8.1
1851
−0.8
−0.3
3.4
10.3
10.6
16.1
17.8
17.7
12.6
11.7
1.7
0.2
8.5
1852
2.6
0.9
0.3
4.4
14.7
18.6
20.5
19.4
14.7
8.8
5.2
4.0
9.5
1853
1.2
−1.9
−3.3
4.4
12.4
17.2
19.1
17.6
13.6
9.8
1.6
−5.1
7.3
1854
−1.5
−1.2
2.3
7.0
14.5
15.4
18.9
16.6
12.9
9.3
0.6
1.6
8.1
1855
−3.4
−9.0
0.9
6.0
12.1
18.0
18.5
18.2
12.8
12.0
2.5
−7.1
6.9
1856
−0.3
0.5
0.0
9.9
12.8
17.3
16.5
17.0
13.2
10.2
−0.2
0.6
8.1
1857
−2.3
−1.2
2.1
8.3
12.6
16.9
18.6
19.0
14.9
11.8
0.7
2.0
8.7
1858
−4.0
−7.5
0.3
6.6
12.4
19.1
18.7
18.0
15.2
9.9
−2.4
−1.1
7.2
1859
0.6
2.9
5.7
7.5
13.2
17.1
21.0
20.2
13.0
9.4
3.0
−3.3
9.2
1860
0.8
−2.2
1.2
8.1
14.0
17.5
16.0
17.5
14.2
7.3
0.8
−2.4
7.8
1861
−6.7
2.7
5.0
5.5
10.6
18.8
19.7
18.7
13.7
9.1
4.7
−0.5
8.5
1862
−3.8
−2.4
5.1
9.3
15.4
16.4
18.3
17.5
14.7
11.1
1.9
−2.0
8.5
1863
2.6
2.4
5.1
7.9
13.9
17.1
16.9
19.9
14.9
11.9
4.8
1.9
10.0
1864
−6.3
0.0
4.8
5.1
9.1
17.7
16.4
15.7
13.9
7.7
2.0
−5.0
6.8
1865
−0.6
−6.7
−0.5
9.2
17.0
14.2
21.5
17.3
14.1
8.9
5.4
0.6
8.5
1866
2.7
2.8
1.9
10.1
11.1
20.2
17.6
17.0
17.5
6.3
4.1
1.7
9.4
1867
−0.7
3.4
0.7
8.2
11.9
16.5
17.6
18.5
14.2
9.0
2.1
−2.9
8.2
1868
−2.2
3.1
3.6
8.0
16.9
18.6
19.5
20.2
16.4
9.9
2.2
3.5
10.0
1869
−2.5
4.5
1.4
10.6
14.8
14.7
19.7
16.9
15.5
7.4
3.2
0.8
8.9
1870
−1.3
−8.8
−0.1
7.3
13.9
15.9
18.9
16.7
12.4
8.0
5.1
−6.7
6.9
1871
−7.3
−3.5
4.2
6.3
9.5
14.9
18.7
18.1
13.7
5.9
1.5
−4.4
6.5
1872
−0.5
−0.3
4.9
10.2
15.8
15.9
18.6
16.5
15.3
11.9
7.4
2.0
9.8
1873
2.2
−1.2
4.7
6.6
9.8
16.8
20.0
19.8
13.4
10.7
5.0
0.9
9.2
1874
0.2
−0.5
2.2
8.8
9.7
16.8
20.8
16.4
16.8
10.7
0.6
−1.5
8.5
(continued)

508
K. Bry
ś and T. Bryś
1875
−0.6
−6.7
−1.1
6.6
13.3
19.6
18.5
19.2
13.2
6.4
1.2
−4.2
7.2
1876
−5.2
0.3
4.0
9.8
9.3
18.3
18.6
18.3
13.6
10.3
0.4
0.2
8.2
1877
1.8
1.3
1.3
5.9
10.7
19.2
18.4
19.3
11.2
7.2
6.3
−0.5
8.5
1878
−0.9
1.8
2.6
9.6
13.6
17.4
16.6
18.8
16.1
10.8
4.2
−1.3
9.1
1879
−3.3
1.0
0.8
7.1
12.0
18.0
16.6
18.1
15.8
8.0
0.6
−7.8
7.3
1880
−2.2
−0.4
2.3
10.0
11.4
17.0
19.3
17.2
14.6
8.4
4.3
2.9
8.8
1881
−5.8
−1.0
1.5
4.8
13.5
16.1
19.6
17.5
12.4
5.2
4.7
0.6
7.5
1882
1.0
1.8
7.3
8.4
12.5
14.6
19.5
16.2
15.7
8.8
3.7
0.1
9.2
1883
−1.3
0.7
−1.9
5.1
12.7
17.1
18.6
16.7
14.3
9.6
4.6
0.2
8.1
1884
2.3
2.6
3.9
5.2
13.4
14.5
19.2
16.5
15.2
7.9
1.1
2.4
8.7
1885
−3.4
2.0
3.3
10.2
11.7
18.6
18.4
15.4
14.0
9.1
2.7
−0.2
8.5
1886
−1.4
−4.1
−0.9
9.8
14.1
15.7
17.5
17.9
15.9
8.6
5.2
1.0
8.3
1887
−3.3
−2.0
1.5
8.2
12.0
15.2
20.1
16.9
14.6
6.7
4.8
−0.7
7.9
1888
−3.1
−3.4
1.0
7.1
13.7
17.0
17.0
17.0
13.8
8.0
2.5
0.8
7.6
1889
−4.2
−2.2
−0.4
8.8
18.4
20.5
18.3
17.2
11.4
9.8
3.4
−2.0
8.3
1890
1.8
−2.5
5.8
8.9
15.6
15.0
18.1
20.2
13.8
8.0
3.1
−6.7
8.5
Key:
abbreviations
I,
II,
III,
etc.
mean
January
, February
, March,
etc.
Table
25.2
(continued)
Y
ear
I
II
III
IV
V
VI
VII
VIII
IX
X
XI
XII
I–XII

509
25 The First One Hundred Years (1791–1890) of the Wrocław Air Temperature Series
window on the first floor of a school at 6h, 14h and 21h. The mean monthly Tp values
from the period March 1805–April 1849, calculated by Günther (see Note 9), were
published by Galle
. The Tp values given in Celsius degrees and cited below
(see electronic version), are the result of a simple calculation from the
Réaumur scale, according to which temperature measurements were recorded in
Silesia until the end of the 1870’s. Apart from the correction of several monthly Tp
values which turned out to be largely erroneous in contrast with the simultaneous
values acquired from the Tp measurements taken elsewhere in Silesia, the rest of the
values were established as correct and credible for the comparisons conducted.
Of significant comparative value (also taken into consideration in Table
) are
the temperature values taken over a 28-year period from October 1823 to June 1851
(except for January 1841) in the meteorological station run by Petzeld – the head-
master of the school in Nysa (then Neisse). The measurements, probably taken on
the premises of the school, were conducted at the same times as those in Wrocław,
that is at 6h, 14h and 22h. The results of these measurements were compiled in the
form of mean monthly values by von Rotkirch (Galle
, an observer at
the Breslau-Sternwarte Observatory. Verification of these data produced only a few
errors which were corrected in a similar manner as the data from Głubczyce.
The next long series presented in Table
refers to the mean monthly Tp
values from Kluczbork (then Kreuzburg) the period April 1823–December 1849
and was calculated from time values measured by the pharmacist Lehmann and
then compiled by Günther (Galle
, an academic researcher at the Observatory.
As had been the case in Wrocław and Nysa, the Kluczbork observations were con-
ducted at three times 6h, 14h and 22h. Air temperature measurements were taken
on the northern wall of the second floor of the pharmacy.
The Tp data for 1823–1838 taken at the Ksi
ęginice Małe (Klein-Kniegnitz) sta-
tion near Sobótka (Zobten) are also significant for the interpolation of the values
from Wrocław. They were obtained by pastor Leopold in the northern window of an
unheated room on the second floor of his house. Their comparative value is highest
for the winter period as the observations were carried out during that season at 8h,
14h and 21h. Galle
stated that these observations were compiled by Büttner.
Büttner also
11
compiled meteorological data resulting from observations and
measurements conducted in the period 1825–1837 in Syców (Polnisch-Wartenberg)
by a local physician, Dr. Hofrichter. The temperature measurements were carried
out at a height of approximately 4 m above street level in a south-west window of
the building in which the observer was working. From March to September inclu-
sively, the observations were conducted at 6h, 14h and 22h, and in the remaining
months at 7h, 14h and 22h. The data are complete apart from small gaps in the years
1835 and 1837.
11
The monthly Tp values from Lewin Brzeski (Löwen) compiled by Büttner (Galle
from the
years 1840–1849 were not used in the paper. However, all the observations were conducted there
according to the three daily readings model which, except for the morning observation, differed
from those at the other Silesian stations as they were performed at 6h, 12h and 18h.

510
K. Bry
ś and T. Bryś
Table
25.3
A
verage
monthly
air
temperature
(Tp)
values
in
the
most
important
Silesian
meteorological
stations
outside
W
rocław
(i.e.,
those
with
the
longest
published
measurement
series)
in
the
years
1805–1851
Month
I
I
I
I
I
I
I
II
II
II
II
II
II
II
Y
ear
Głub
Klucz
Nysa
Szas
Syc
M.Ksg.
N.Rud.
Głub
Klucz
Nysa
Szas
Syc
M.Ksg.
N.Rud.
1805
*
*
*
*
*
*
*
*
*
*
*
*
*
*
1806
1.6
*
*
*
*
*
*
2.2
*
*
*
*
*
*
1807
–1.2
*
*
*
*
*
*
1.3
*
*
*
*
*
*
1808
–1.5
*
*
*
*
*
*
–2.3
*
*
*
*
*
*
1809
–4.1
*
*
*
*
*
*
1.4
*
*
*
*
*
*
1810
–3.0
*
*
*
*
*
*
–1.6
*
*
*
*
*
*
181
1
–6.4
*
*
*
*
*
*
–1.3
*
*
*
*
*
*
1812
–4.4
*
*
*
*
*
*
0.0
*
*
*
*
*
*
1813
–4.3
*
*
*
*
*
*
2.2
*
*
*
*
*
*
1814
–3.9
*
*
*
*
*
*
–7.3
*
*
*
*
*
*
1815
–4.5
*
*
*
*
*
*
1.2
*
*
*
*
*
*
1816
0.0
*
*
*
*
*
*
–1.5
*
*
*
*
*
*
1817
1.3
*
*
*
*
*
*
2.7
*
*
*
*
*
*
1818
–0.1
*
*
*
*
*
*
0.8
*
*
*
*
*
*
1819
0.8
*
*
1.5
*
*
*
2.9
*
*
0.4
*
*
*
1820
–5.4
*
*
–5.9
*
*
*
1.1
*
*
–2.7
*
*
*
1821
0.5
*
*
0.4
*
*
*
–1.9
*
*
–1.0
*
*
*
1822
0.4
*
*
1.8
*
*
*
2.1
*
*
3.9
*
*
*
1823
–10.3
*
*
–10.3
*
–10.9
–13.8
–1.4
*
*
0.9
*
–0.3
–4.1
1824
–1.1
–0.3
–0.2
0.3
*
0.3
*
1.1
1.2
1.2
1.8
*
1.5
*
1825
–0.4
–0.9
–0.2
1.8
0.2
1.7
*
–1.6
–1.0
–1.9
0.0
–1.7
–0.3
*
1826
–7.7
–8.0
–7.3
–8.4
–8.8
–7.8
–7.8
–0.8
–0.9
–0.2
0.1
–1.3
0.5
–1.1
1827
–2.5
–2.7
–2.1
–2.8
–2.4
–2.7
–3.2
–6.4
–7.8
–7.3
–8.4
–6.7
–7.3
–8.4
1828
–4.0
–5.0
–4.0
–5.2
–4.6
–3.4
–4.4
–3.0
–3.4
–3.0
–2.7
–3.0
–2.6
–3.9
1829
–6.9
–6.7
–6.9
–8.0
–6.2
–7.2
–6.2
–5.6
–5.7
–4.5
–7.0
–5.1
–4.5
–6.4
1830
–9.5
–9.0
–9.9
–10.7
–8.7
–9.7
–9.1
–5.6
–5.0
–4.5
–6.5
–4.6
–4.5
–4.7

511
25 The First One Hundred Years (1791–1890) of the Wrocław Air Temperature Series
1831
–6.8
–6.2
–5.0
*
–5.6
–5.0
–6.6
–1.7
–1.1
–1.1
*
–0.2
0.9
–2.0
1832
–4.0
–2.0
–2.8
*
–2.2
–2.4
–3.9
–1.6
–0.6
–0.3
*
–0.4
0.0
–1.4
1833
–5.7
–4.3
–5.0
*
–4.3
–4.2
–7.0
2.4
2.2
3.4
*
2.4
3.6
1.0
1834
1.1
1.6
2.7
*
1.9
2.9
0.5
0.8
0.4
0.3
*
–0.1
0.7
–2.4
1835
–0.9
–1.0
–0.2
*
–0.3
–0.1
–2.8
0.3
1.3
1.8
*
1.8
1.9
–1.0
1836
–3.4
–3.3
–2.6
*
–2.7
–1.4
–5.3
–0.1
0.7
1.3
*
0.8
1.3
–1.4
1837
–3.3
–2.3
–1.3
*
–1.5
–1.1
–3.3
–3.5
–2.9
–2.6
*
–2.1
–2.4
–4.8
1838
–1
1.1
–9.8
–10.6
*
*
–1
1.0
–1
1.3
–6.2
–5.7
–4.6
*
*
–5.4
–8.3
1839
–2.5
–2.4
–1.5
*
*
*
–4.1
–0.7
–0.5
0.2
*
*
*
–2.6
1840
–2.8
–2.7
–1.4
*
*
*
–4.9
–1.8
–1.3
–1.4
*
*
*
–3.0
1841
–2.8
–2.3
–2.4
*
*
*
–4.8
–6.2
–6.0
–6.6
*
*
*
–7.5
1842
–6.5
–5.3
–5.9
*
*
*
–7.2
–1.7
–1.2
–1.4
*
*
*
–5.6
1843
–0.9
–0.4
–0.3
*
*
*
–2.7
5.0
5.0
5.3
*
*
*
3.1
1844
–3.7
–2.9
–1.8
*
*
*
*
–3.1
–2.6
–1.4
*
*
*
*
1845
0.6
0.4
0.8
*
*
*
*
–6.3
–6.9
–5.8
*
*
*
*
1846
–0.6
–0.8
–0.5
*
*
*
*
1.8
1.7
2.1
*
*
*
*
1847
–3.3
–3.8
–3.7
*
*
*
*
–1.8
–2.0
–1.0
*
*
*
*
1848
–10.3
–10.1
–10.8
*
*
*
*
1.6
2.0
3.3
*
*
*
*
1849
–3.3
–3.6
–2.9
*
*
*
*
2.1
1.4
1.8
*
*
*
*
1850
*
*
–8.8
*
*
*
*
*
*
3.3
*
*
*
*
1851
*
*
–0.4
*
*
*
*
*
*
0.0
*
*
*
*
(continued)

512
K. Bry
ś and T. Bryś
Month
V
III
III
III
III
III
III
IV
IV
IV
IV
IV
IV
IV
Y
ear
Głub
Klucz
Nysa
Szas
Syc
M.Ksg.
N.Rud.
Głub
Klucz
Nysa
Szas
Syc
M.Ksg.
N.Rud.
1805
0.7
*
*
*
*
*
*
4.9
*
*
*
*
*
*
1806
3.2
*
*
*
*
*
*
6.1
*
*
*
*
*
*
1807
0.2
*
*
*
*
*
*
6.0
*
*
*
*
*
*
1808
–3.9
*
*
*
*
*
*
5.7
*
*
*
*
*
*
1809
0.5
*
*
*
*
*
*
4.9
*
*
*
*
*
*
1810
2.7
*
*
*
*
*
*
5.3
*
*
*
*
*
*
181
1
4.3
*
*
*
*
*
*
8.2
*
*
*
*
*
*
1812
2.6
*
*
*
*
*
*
3.8
*
*
*
*
*
*
1813
1.6
*
*
*
*
*
*
9.3
*
*
*
*
*
*
1814
0.2
*
*
*
*
*
*
9.8
*
*
*
*
*
*
1815
4.0
*
*
*
*
*
*
7.4
*
*
*
*
*
*
1816
2.4
*
*
*
*
*
*
7.3
*
*
*
*
*
*
1817
2.6
*
*
*
*
*
*
3.1
*
*
*
*
*
*
1818
4.1
*
*
*
*
*
*
9.0
*
*
*
*
*
*
1819
5.2
*
*
3.1
*
*
*
8.7
*
*
8.1
*
*
*
1820
1.7
*
*
–0.7
*
*
*
9.0
*
*
8.2
*
*
*
1821
1.4
*
*
1.9
*
*
*
10.8
*
*
12.8
*
*
*
1822
6.4
*
*
8.0
*
*
*
9.6
*
*
11.7
*
*
*
1823
2.6
*
*
5.2
*
3.9
–1.0
6.6
6.3
*
7.9
*
7.1
2.4
1824
2.4
1.3
1.6
3.2
*
3.0
*
7.4
7.7
7.3
7.4
*
7.7
*
1825
–0.7
–0.8
–0.3
–0.1
–1.2
–0.7
*
8.1
7.9
9.0
8.6
7.3
9.4
*
1826
3.3
3.0
3.5
3.8
2.4
4.0
2.7
7.2
6.6
7.6
7.4
6.6
7.7
6.5
1827
4.3
3.5
3.8
4.7
3.7
5.0
3.7
10.2
9.6
10.4
10.1
10.5
10.3
9.2
1828
3.9
3.3
4.2
2.7
3.6
4.3
2.8
10.0
9.8
10.2
8.6
9.7
10.5
8.4
1829
0.3
0.4
1.3
0.7
0.9
1.0
–1.4
7.7
7.9
9.2
6.7
8.6
8.9
6.4
1830
1.6
1.8
2.8
1.9
2.6
3.9
1.1
9.0
9.3
10.2
*
10.1
10.7
8.5
Table
25.3
(continued)

513
25 The First One Hundred Years (1791–1890) of the Wrocław Air Temperature Series
1831
1.8
1.9
3.2
*
2.4
3.1
1.6
10.4
11.1
11.4
*
12.0
11.7
8.8
1832
1.4
2.0
2.9
*
2.3
2.9
1.1
7.3
6.6
7.5
*
7.6
7.9
5.4
1833
2.3
2.5
3.5
*
2.9
2.9
1.3
5.4
5.6
6.6
*
6.3
6.5
4.2
1834
1.0
1.1
2.6
*
2.2
2.6
–0.3
5.6
6.7
7.0
*
7.2
7.3
4.8
1835
1.9
2.5
3.8
*
2.9
2.9
0.5
5.7
6.1
7.2
*
7.2
7.9
4.8
1836
7.1
7.7
8.2
*
8.4
8.9
5.8
7.1
8.2
8.4
*
9.0
8.8
6.5
1837
–1.0
–0.5
–0.8
*
0.5
0.0
–2.6
6.2
6.5
6.9
*
7.5
6.7
3.5
1838
2.1
2.5
2.9
*
*
3.0
0.3
6.2
6.1
7.7
*
*
6.7
3.6
1839
–1.3
–0.8
–0.7
*
*
*
–2.4
3.2
4.1
4.1
*
*
*
1.8
1840
–2.3
–2.2
–1.7
*
*
*
–4.9
6.5
6.6
6.5
*
*
*
4.8
1841
3.7
3.3
3.9
*
*
*
1.5
9.3
9.4
9.3
*
*
*
7.5
1842
2.5
2.6
3.3
*
*
*
0.6
5.0
4.7
5.4
*
*
*
3.5
1843
0.8
1.1
1.4
*
*
*
–2.0
7.9
7.8
8.2
*
*
*
4.9
1844
1.3
0.1
0.4
*
*
*
*
8.1
7.0
8.0
*
*
*
*
1845
–3.9
–4.4
–3.6
*
*
*
*
8.2
7.9
10.0
*
*
*
*
1846
6.1
5.6
6.6
*
*
*
*
9.7
9.4
10.4
*
*
*
*
1847
1.7
1.8
2.5
*
*
*
*
6.2
5.7
6.3
*
*
*
*
1848
4.7
5.1
6
*
*
*
*
11.5
11.4
11.8
*
*
*
*
1849
1.6
1.0
1.9
*
*
*
*
7.7
7.6
7.8
*
*
*
*
1850
*
*
0.6
*
*
*
*
*
*
8.7
*
*
*
*
1851
*
*
3.8
*
*
*
*
*
*
10.5
*
*
*
*
(continued)

514
K. Bry
ś and T. Bryś
Month
V
V
V
V
V
V
V
VI
VI
VI
VI
VI
VI
VI
Y
ear
Głub
Klucz
Nysa
Szas
Syc
M.Ksg.
N.Rud.
Głub
Klucz
Nysa
Szas
Syc
M.Ksg.
N.Rud.
1805
10.8
*
*
*
*
*
*
14.0
*
*
*
*
*
*
1806
14.8
*
*
*
*
*
*
14.5
*
*
*
*
*
*
1807
13.4
*
*
*
*
*
*
14.8
*
*
*
*
*
*
1808
13.4
*
*
*
*
*
*
16.1
*
*
*
*
*
*
1809
13.9
*
*
*
*
*
*
15.5
*
*
*
*
*
*
1810
12.5
*
*
*
*
*
*
14.1
*
*
*
*
*
*
181
1
16.7
*
*
*
*
*
*
19.5
*
*
*
*
*
*
1812
13.1
*
*
*
*
*
*
16.1
*
*
*
*
*
*
1813
13.1
*
*
*
*
*
*
14.0
*
*
*
*
*
*
1814
10.4
*
*
*
*
*
*
13.9
*
*
*
*
*
*
1815
12.9
*
*
*
*
*
*
16.8
*
*
*
*
*
*
1816
12.6
*
*
*
*
*
*
15.7
*
*
*
*
*
*
1817
13.2
*
*
*
*
*
*
17.7
*
*
*
*
*
*
1818
12.6
*
*
*
*
*
*
15.6
*
*
*
*
*
*
1819
12.0
*
*
13.9
*
*
*
17.4
*
*
19.2
*
*
*
1820
14.5
*
*
13.5
*
*
*
14.3
*
*
13.4
*
*
*
1821
13.9
*
*
14.6
*
*
*
13.2
*
*
15.0
*
*
*
1822
14.3
*
*
16.2
*
*
*
17.7
*
*
18.3
*
*
*
1823
14.0
13.6
*
14.4
*
14.8
8.9
17.0
16.4
*
17.5
*
17.1
11.7
1824
11.7
12.4
11.6
12.0
*
12.0
*
15.5
15.2
15.7
15.3
*
15.5
*
1825
13.2
13.1
13.9
12.9
12.1
13.4
13.7
15.3
15.9
16.7
15.7
15.3
15.9
15.6
1826
12.2
11.9
12.2
12.0
11.8
11.9
10.7
17.2
17.1
17.9
17.0
17.4
17.1
16.1
1827
15.6
14.9
15.3
15.1
16.4
16.0
13.9
19.1
19.0
20.1
18.1
20.3
19.4
17.1
1828
12.9
12.7
13.1
11.7
13.0
13.2
10.8
17.2
16.6
16.7
16.0
18.2
17.1
15.0
1829
10.6
11.5
12.2
11.0
12.6
12.2
10.4
14.8
15.2
15.3
15.1
16.3
15.9
13.7
1830
13.6
13.1
13.8
*
14.1
13.8
12.0
18.6
18.2
18.9
*
19.2
18.7
16.1
Table
25.3
(continued)

515
25 The First One Hundred Years (1791–1890) of the Wrocław Air Temperature Series
1831
12.9
13.1
13.7
*
13.8
13.8
10.7
15.2
15.4
16.6
*
16.0
16.1
13.1
1832
10.9
11.0
12.2
*
11.8
12.1
9.5
15.4
15.4
16.4
*
16.5
16.1
13.0
1833
17.0
16.3
16.9
*
17.0
17.6
13.9
18.6
18.5
18.1
*
19.2
18.7
16.0
1834
15.9
16.0
16.5
*
16.7
16.8
13.7
18.2
18.5
19.0
*
19.0
19.0
15.7
1835
13.1
13.5
14.8
*
14.3
14.2
11.7
16.4
16.6
17.6
*
18.0
17.4
15.0
1836
9.1
9.7
10.4
*
11.0
10.2
8.3
16.6
16.7
17.8
*
18.2
17.7
14.6
1837
11.2
11.3
12.0
*
12.9
11.8
9.1
15.5
15.4
16.5
*
17.3
16.3
13.5
1838
13.0
13.7
13.8
*
*
14.0
11.6
15.6
15.9
15.9
*
*
16.3
13.1
1839
12.2
13.3
12.7
*
*
*
10.5
18.4
18.1
18.8
*
*
*
15.7
1840
11.4
10.9
11.4
*
*
*
9.6
15.6
15.2
16.7
*
*
*
12.7
1841
15.7
16.4
15.8
*
*
*
14.3
16.6
16.8
15.6
*
*
*
14.0
1842
13.2
13.9
13.8
*
*
*
12.2
16.3
16.1
15.9
*
*
*
13.9
1843
11.1
10.7
11.1
*
*
*
9.5
15.4
15.9
15.3
*
*
*
12.4
1844
12.7
13.5
12.9
*
*
*
*
16.7
16.1
16.2
*
*
*
*
1845
11.7
12.0
13.6
*
*
*
*
17.7
18.2
19.6
*
*
*
*
1846
12.8
12.4
12.7
*
*
*
*
18.6
17.4
17.3
*
*
*
*
1847
15.2
15.0
14.9
*
*
*
*
14.2
14.9
14.4
*
*
*
*
1848
12.5
13.3
12.5
*
*
*
*
19.1
19.7
18.8
*
*
*
*
1849
14.2
14.6
14.2
*
*
*
*
16.8
17.0
16.7
*
*
*
*
1850
*
*
14.5
*
*
*
*
*
*
17.9
*
*
*
*
1851
*
*
10.6
*
*
*
*
*
*
15.8
*
*
*
*
(continued)

516
K. Bry
ś and T. Bryś
Month
VII
VII
VII
VII
VII
VII
VII
VIII
VIII
VIII
VIII
VIII
VIII
VIII
Y
ear
Głub
Klucz
Nysa
Szas
Syc
M.Ksg.
N.Rud.
Głub
Klucz
Nysa
Szas
Syc
M.Ksg.
N.Rud.
1805
15.9
*
*
*
*
*
*
15.0
*
*
*
*
*
*
1806
16.4
*
*
*
*
*
*
16.9
*
*
*
*
*
*
1807
17.8
*
*
*
*
*
*
22.1
*
*
*
*
*
*
1808
17.8
*
*
*
*
*
*
18.3
*
*
*
*
*
*
1809
17.7
*
*
*
*
*
*
17.9
*
*
*
*
*
*
1810
17.7
*
*
*
*
*
*
16.4
*
*
*
*
*
*
181
1
20.0
*
*
*
*
*
*
18.2
*
*
*
*
*
*
1812
16.2
*
*
*
*
*
*
15.6
*
*
*
*
*
*
1813
16.9
*
*
*
*
*
*
15.4
*
*
*
*
*
*
1814
18.3
*
*
*
*
*
*
17.2
*
*
*
*
*
*
1815
15.2
*
*
*
*
*
*
16.5
*
*
*
*
*
*
1816
16.7
*
*
*
*
*
*
16.1
*
*
*
*
*
*
1817
17.8
*
*
*
*
*
*
17.1
*
*
*
*
*
*
1818
17.3
*
*
*
*
*
*
15.0
*
*
*
*
*
*
1819
18.1
*
*
19.7
*
*
*
17.0
*
*
18.7
*
*
*
1820
16.2
*
*
16.7
*
*
*
19.7
*
*
19.5
*
*
*
1821
16.1
*
*
17.8
*
*
*
16.2
*
*
18.2
*
*
*
1822
20.1
*
*
21.0
*
*
*
17.1
*
*
18.0
*
*
*
1823
17.9
17.7
*
17.2
*
17.6
12.9
19.4
18.2
*
18.7
*
18.8
14.8
1824
17.6
17.4
18.6
17.2
*
18.2
*
18.4
17.3
17.7
17.0
*
18.4
*
1825
17.1
16.9
17.7
17.2
16.6
17.7
15.7
17.8
17.2
17.3
16.7
17.0
17.6
15.8
1826
21.2
21.1
21.3
20.9
21.3
21.4
19.8
20.6
19.9
20.5
19.7
19.7
20.7
18.9
1827
19.9
18.9
19.5
18.7
20.0
20.1
17.7
17.9
17.5
17.5
17.3
18.7
18.0
16.5
1828
20.3
19.5
19.7
18.4
20.2
20.3
17.8
17.3
16.2
16.9
15.1
17.3
17.1
14.1
1829
19.6
18.5
19.4
17.8
19.9
19.1
16.9
17.3
16.4
17.3
15.7
17.5
17.2
14.2
1830
18.9
18.0
19.0
*
18.7
18.8
16.6
18.4
18.0
18.7
*
18.6
18.6
16.5
Table
25.3
(continued)

517
25 The First One Hundred Years (1791–1890) of the Wrocław Air Temperature Series
1831
18.9
19.5
18.9
*
20.0
19.5
16.1
17.4
17.0
17.3
*
18.1
17.9
14.6
1832
15.4
14.8
16.2
*
15.8
15.8
13.2
18.8
17.8
17.9
*
18.6
18.7
15.4
1833
16.5
16.8
16.5
*
17.5
17.7
15.0
14.1
13.8
13.8
*
14.5
15.0
11.0
1834
22.4
22.8
22.4
*
23.4
23.0
19.7
20.2
19.9
20.6
*
20.9
20.3
17.9
1835
18.3
18.5
19.4
*
19.9
19.5
16.2
16.5
15.9
17.6
*
17.3
17.4
15.2
1836
16.4
16.3
18.1
*
18.1
17.6
14.8
16.1
15.6
17.6
*
17.5
17.1
13.8
1837
15.6
15.3
16.2
*
16.5
16.6
13.6
18.8
18.5
19.3
*
19.8
19.6
16.3
1838
17.3
17.1
17.1
*
*
17.9
14.2
15.6
15.2
15.8
*
*
16.2
13.1
1839
19.2
19.6
19.4
*
*
*
16.6
16.4
16.3
17.1
*
*
*
13.9
1840
17.4
17.5
17.2
*
*
*
15.5
16.3
15.8
15.7
*
*
*
14.3
1841
17.5
17.6
17.3
*
*
*
15.5
17.8
18.1
17.6
*
*
*
16.4
1842
17.6
16.9
17.0
*
*
*
15.0
19.9
20.3
19.6
*
*
*
18.1
1843
17.3
17.5
17.1
*
*
*
14.5
17.5
17.9
17.8
*
*
*
15.2
1844
15.1
15.1
15.4
*
*
*
*
15.5
15.2
15.8
*
*
*
*
1845
18.3
19.3
20.6
*
*
*
*
16.5
16.4
18.2
*
*
*
*
1846
19.7
19.9
19.8
*
*
*
*
20.1
20.7
20.1
*
*
*
*
1847
17.7
17.5
18.2
*
*
*
*
19.1
19.2
18.5
*
*
*
*
1848
18.1
18.9
18.3
*
*
*
*
17.7
17.1
17.6
*
*
*
*
1849
*
17.0
16.8
*
*
*
*
*
16.2
16.1
*
*
*
*
1850
*
*
18.0
*
*
*
*
*
*
18.5
*
*
*
*
1851
*
*
*
*
*
*
*
*
*
*
*
*
*
*
(continued)

518
K. Bry
ś and T. Bryś
Month
IX
IX
IX
IX
IX
IX
IX
X
X
X
X
X
X
X
Y
ear
Głub
Klucz
Nysa
Szas
Syc
M.Ksg.
N.Rud.
Głub
Klucz
Nysa
Szas
Syc
M.Ksg.
N.Rud.
1805
14.7
*
*
*
*
*
*
4.0
*
*
*
*
*
*
1806
16.4
*
*
*
*
*
*
7.8
*
*
*
*
*
*
1807
13.9
*
*
*
*
*
*
8.9
*
*
*
*
*
*
1808
15.2
*
*
*
*
*
*
7.6
*
*
*
*
*
*
1809
14.3
*
*
*
*
*
*
6.6
*
*
*
*
*
*
1810
15.4
*
*
*
*
*
*
7.0
*
*
*
*
*
*
181
1
13.8
*
*
*
*
*
*
11.8
*
*
*
*
*
*
1812
12.5
*
*
*
*
*
*
10.6
*
*
*
*
*
*
1813
13.0
*
*
*
*
*
*
7.2
*
*
*
*
*
*
1814
10.4
*
*
*
*
*
*
7.3
*
*
*
*
*
*
1815
10.7
*
*
*
*
*
*
8.6
*
*
*
*
*
*
1816
12.5
*
*
*
*
*
*
7.7
*
*
*
*
*
*
1817
13.6
*
*
*
*
*
*
5.4
*
*
*
*
*
*
1818
13.6
*
*
*
*
*
*
8.1
*
*
*
*
*
*
1819
13.8
*
*
14.2
*
*
*
8.6
*
*
7.4
*
*
*
1820
13.1
*
*
12.0
*
*
*
9.4
*
*
6.1
*
*
*
1821
15.3
*
*
16.2
*
*
*
9.9
*
*
10.9
*
*
*
1822
13.6
*
*
13.5
*
*
*
11.8
*
*
12.5
*
*
*
1823
14.0
13.8
*
13.8
*
14.3
*
11.9
11.4
11.8
10.4
*
11.4
*
1824
16.8
16.1
16.2
15.8
*
16.8
*
10.6
10.1
10.2
10.1
*
11.0
*
1825
14.2
13.8
14.4
14.0
13.9
14.9
13.4
9.3
8.1
8.9
8.1
7.5
9.3
7.0
1826
14.3
13.8
14.4
13.3
13.6
15.0
13.6
10.6
10.0
10.7
9.7
9.6
10.7
9.8
1827
14.1
13.8
14.0
14.0
15.0
14.9
12.7
10.6
10.0
9.6
9.2
10.0
10.2
8.7
1828
13.0
12.5
13.5
12.0
13.9
14.2
12.1
8.6
7.3
8.1
7.2
8.1
8.0
6.8
1829
14.7
14.5
15.1
13.6
15.1
14.8
12.9
7.0
6.2
7.2
5.3
6.7
7.2
5.4
Table
25.3
(continued)

519
25 The First One Hundred Years (1791–1890) of the Wrocław Air Temperature Series
1830
13.1
13.3
13.7
*
14.2
14.0
12.1
7.1
7.3
8.5
*
7.8
8.6
6.7
1831
12.6
12.6
13.2
*
13.5
13.4
11.0
10.6
11.1
11.8
*
11.1
12.3
10.0
1832
11.7
11.4
13.5
*
12.7
13.3
10.2
8.1
8.4
9.9
*
8.7
9.5
6.8
1833
13.4
13.6
13.3
*
14.3
13.7
12.0
8.2
7.8
8.2
*
8.3
8.3
6.0
1834
15.0
15.1
15.8
*
16.0
16.9
13.5
8.2
8.6
10.2
*
8.5
9.9
6.8
1835
14.0
14.4
15.2
*
15.4
15.7
12.5
7.6
8.0
8.7
*
8.7
8.6
6.6
1836
13.5
13.0
14.1
*
13.9
14.1
11.1
10.7
10.7
11.3
*
11.5
11.2
9.1
1837
11.8
11.9
13.3
*
13.5
13.0
9.8
8.4
8.6
9.3
*
9.1
9.3
6.5
1838
14.5
14.9
15.1
*
*
*
12.6
7.0
7.4
7.4
*
*
*
5.8
1839
15.6
15.9
15.9
*
*
*
13.1
9.2
9.5
9.9
*
*
*
7.8
1840
14.5
14.3
14.3
*
*
*
11.8
5.9
6.0
6.9
*
*
*
4.7
1841
14.1
14.7
13.9
*
*
*
13.2
12.0
12.0
12.7
*
*
*
11.0
1842
13.9
14.1
14.3
*
*
*
12.7
6.6
6.4
7.2
*
*
*
4.6
1843
11.5
11.5
12.4
*
*
*
9.4
8.7
8.4
9.5
*
*
*
5.9
1844
13.7
13.8
14.3
*
*
*
*
9.6
9.8
10.3
*
*
*
*
1845
12.5
12.4
12.9
*
*
*
*
9.4
9.0
10.2
*
*
*
*
1846
14.8
14.0
14.6
*
*
*
*
12.4
12.5
13.0
*
*
*
*
1847
11.9
11.7
12.9
*
*
*
*
7.3
7.0
8.3
*
*
*
*
1848
12.9
12.8
13.2
*
*
*
*
11.2
11.1
11.2
*
*
*
*
1849
*
12.3
12.7
*
*
*
*
*
7.9
8.6
*
*
*
*
1850
*
*
12.3
*
*
*
*
*
*
8.8
*
*
*
*
1851
*
*
*
*
*
*
*
*
*
*
*
*
*
*
(continued)

520
K. Bry
ś and T. Bryś
Month
X
I
X
I
X
I
X
I
X
I
X
I
X
I
X
II
X
II
X
II
X
II
X
II
X
II
X
II
Y
ear
Głub
Klucz
Nysa
Szas
Syc
M.Ksg.
N.Rud.
Głub
Klucz
Nysa
Szas
Syc
M.Ksg.
N.Rud.
1805
0.1
*
*
*
*
*
*
0.7
*
*
*
*
*
*
1806
4.2
*
*
*
*
*
*
3.4
*
*
*
*
*
*
1807
6.2
*
*
*
*
*
*
0.9
*
*
*
*
*
*
1808
2.2
*
*
*
*
*
*
–5.3
*
*
*
*
*
*
1809
2.6
*
*
*
*
*
*
2.5
*
*
*
*
*
*
1810
3.1
*
*
*
*
*
*
0.7
*
*
*
*
*
*
181
1
3.7
*
*
*
*
*
*
0.4
*
*
*
*
*
*
1812
2.1
*
*
*
*
*
*
–6.5
*
*
*
*
*
*
1813
2.9
*
*
*
*
*
*
–0.1
*
*
*
*
*
*
1814
4.0
*
*
*
*
*
*
1.3
*
*
*
*
*
*
1815
1.9
*
*
*
*
*
*
–3.8
*
*
*
*
*
*
1816
3.1
*
*
*
*
*
*
–1.4
*
*
*
*
*
*
1817
4.4
*
*
*
*
*
*
–0.6
*
*
*
*
*
*
1818
3.7
*
*
*
*
*
*
–1.1
*
*
*
*
*
*
1819
3.6
*
*
0.6
*
*
*
–3.0
*
*
–6.7
*
*
*
1820
3.0
*
*
1.7
*
*
*
–2.4
*
*
–7.4
*
*
*
1821
6.5
*
*
7.5
*
*
*
2.9
*
*
3.9
*
*
*
1822
5.8
*
*
5.8
*
*
*
–1.1
*
*
–1.5
*
*
*
1823
4.6
4.7
5.2
4.5
*
4.5
*
1.2
1.4
1.7
1.5
*
1.9
*
1824
4.8
4.9
4.7
6.0
*
6.3
*
3.1
3.6
3.2
4.9
*
4.8
*
1825
5.7
5.0
5.9
5.4
4.6
6.0
5.3
4.9
4.7
5.2
4.3
3.5
5.0
4.5
1826
3.1
2.7
3.7
2.7
2.3
3.0
2.7
1.3
0.8
1.5
1.0
0.5
1.2
0.5
1827
–0.3
0.2
0.6
–0.5
0.4
0.3
–1.1
1.8
1.5
1.6
1.1
1.9
2.6
0.3
1828
4.5
3.7
3.7
2.2
4.0
4.1
3.2
0.6
0.3
1.5
–0.1
0.9
1.6
0.3
1829
–2.0
–1.8
–0.5
–2.4
–1.1
–0.8
–2.3
–1
1.1
–10.5
–10.9
–12.6
–10.6
–10.3
–9.5
Table
25.3
(continued)

521
25 The First One Hundred Years (1791–1890) of the Wrocław Air Temperature Series
1830
4.5
5.2
5.5
*
5.5
5.9
4.1
–0.5
1.2
1.0
*
0.9
0.6
–0.4
1831
0.8
1.8
2.5
*
2.2
2.5
0.7
–1.7
–0.7
0.1
*
0.1
0.4
–1.9
1832
1.2
2.3
2.9
*
2.1
2.5
0.9
–2.6
–2.1
–1.4
*
–1.6
–0.8
–3.7
1833
3.1
3.0
4.2
*
3.3
3.9
1.3
1.9
2.9
3.9
*
3.4
3.9
1.5
1834
2.4
2.7
4.3
*
3.4
3.6
1.1
–0.1
0.4
1.3
*
0.9
1.3
–1.4
1835
–2.0
–0.9
–1.3
*
–0.4
–0.4
–2.7
–3.2
–3.0
–1.1
*
–2.2
–1.4
–4.7
1836
1.3
1.3
2.5
*
1.7
2.5
0.2
1.0
0.6
2.3
*
0.9
1.6
–0.7
1837
3.4
3.6
4.4
*
4.0
4.2
1.4
–2.5
–1.9
–1.6
*
–1.4
–1.4
–4.1
1838
0.6
1.4
2.1
*
*
*
–0.9
–2.0
–1.4
–1.0
*
*
*
–3.4
1839
4.9
5.3
5.9
*
*
*
3.6
–1.6
–1.9
–1.3
*
*
*
–1.6
1840
6.0
5.7
6.8
*
*
*
4.7
–7.6
–8.3
–7.7
*
*
*
–1
1.7
1841
4.3
4.0
5.2
*
*
*
3.4
3.1
3.2
3.8
*
*
*
0.6
1842
0.7
0.6
1.6
*
*
*
–0.9
1.9
2.1
3.4
*
*
*
–0.1
1843
2.8
3.3
4.3
*
*
*
*
2.4
2.8
3.3
*
*
*
*
1844
4.4
4.5
5.3
*
*
*
*
–5.8
–4.7
–4.4
*
*
*
*
1845
6.1
5.6
6.7
*
*
*
*
1.6
1.3
1.9
*
*
*
*
1846
2.4
1.9
2.7
*
*
*
*
–3.3
–2.9
–2.5
*
*
*
*
1847
4.1
3.5
5.0
*
*
*
*
–0.7
–1.0
0.2
*
*
*
*
1848
3.2
3.3
4.0
*
*
*
*
0.6
0.7
0.2
*
*
*
*
1849
*
3.1
3.5
*
*
*
*
*
–5.0
–5.0
*
*
*
*
1850
*
*
5.2
*
*
*
*
*
*
0.8
*
*
*
*
1851
*
*
*
*
*
*
*
*
*
*
*
*
*
*
E
xp
la
na
ti
on
:
G
łu
=
G
łu
bc
zy
ce
(L
eo
bs
ch
ut
z)
,
K
lu
cz
=
K
lu
cz
bo
rk
(K
re
uz
bu
rg
),
N
ys
a
(N
ei
ss
e)
,
Sz
as
=
S
za
sz
or
ow
ic
e
(Z
ap
pl
au
),
Sy
c
=
S
yc
ów
(P
ol
ni
sc
h
W
artenber
g),
M.Ksg.
=
Ksi
ęginice
Małe
(Klein–Kniegnitz),
N.Rud.
=
Nowa
Ruda
(Neurode);
bold
italics
indicate
corrected
or
interpolated
values;
*
lack
of
measurements.
Other
explanations
as
in
Table
25.2

522
K. Bry
ś and T. Bryś
The observations carried out by Lorenz, a construction master, on an estate in
Szaszorowice (Zapplau) near Góra (Gurhau) for a period of over 5 years differed
significantly from the measurement regime applied at the other stations in Silesia.
From January 1819 to March 1825, three daily temperature readings were taken in
the morning, noon/early afternoon and late evening, though not at set times.
Depending on the season and situation (and the changing rhythm of other activities
and household chores), the morning observation occurred between 3h and 9h, the
noon observation took place between 12h and 15h, and the evening one between
21h and 24h. Hence the mean monthly values for Zapplau calculated by Büttner are
questionable for these years and they can represent real values only in approxima-
tion. However, the Tp values from April 1825 to the end of March 1830 are reliable
as the measurements during that period were taken at strictly defined times: 6h, 14h
and 22h for the spring–summer months (March–September) and 7h, 14h and 22h
for the autumn–winter months (October–February).
Meteorological observations were also conducted in Sudetenland.
12
One from
the longest Tp series (1822–1847) is from Nowa Ruda (Neurode)
13
and includes
monthly values for the period January 1823–October 1843, calculated by Günther
(Galle
. The Tp measurements (except for an interval from September 1823
to April 1825), and the unpublished periods of 1822 and November 1843–1847,
have only two gaps, that is, August–September 1828 and March 1831. Observations
and measurements were conducted by Rohde, a shift master at a coal mine, and
the pharmacist Lauterbach. In the years 1823–1831 measurements were taken at
7h, 14h and 22h, and then, beginning in 1832, at 6h, 14h and 21h. The values
were used in the paper only for comparisons and an additional verification some
Tp data from Wrocław.
Apart from the above-mentioned stations situated in Silesia in the first half of
the nineteenth century, there were over ten other meteorological stations operating
12
The beginnings of meteorological observations in Sudetenland can most probably be traced back
to a brief measurement episode of about 6 months (the data was never published), which took
place in Wałbrzych (Waldenberg) from July to December 1821. The next year saw the beginning
of long-term observations in Kłodzko (Glatz), Nowa Ruda (Neurode) and Duszniki Zdrój
(Reinerz). The latter ones lasted from October 1822 until the end of 1833, but they were neither
compiled nor published. Matters were different in Kłodzko – meteorological observations
performed there were interrupted for several years from the year 1822 to 1847 (Galle
.
13
Long-term meteorological observations in Sudetenland were also conducted in Bystrzyca
Kłodzka (Habelschwerdt) in the years 1823–1849, but the results were probably not published.
From among the stations outside the Kłodzko region, Galle
presented the results of obser-
vations in Kamienna Góra (Landshut) lasting from 1836 to 1847, as well as the results of observa-
tions from 1836 to 1850 in Miedzianka (Kupferberg) and in Rudawy Janowickie (Landeshuter
Kamm). Galle’s monograph also contained a 5 year record (August 1836 – March 1842) of the
monthly Tp values and other meteorological observations performed in Złoty Stok (Reichenstein).
The first measurements taken high in the mountains on the peak of
Śnieżka (Schneekoppe) in the
Karkonosze Mountains (Riesengebirge) are important in the history of the Sudetenland measure-
ments. They were recorded in different summer months in the years 1824–1834 by Sibenhaar.
These observations, also including results of air temperature measurements, were compiled by
Günther (Galle

523
25 The First One Hundred Years (1791–1890) of the Wrocław Air Temperature Series
for periods of a couple of years to more than 10 years at a time (Galle
Those stations which were important for the reconstruction of the Silesian climate
were located at Zittau (the measurements from 1828), Görlitz (from 1836),
Legnica (Liegnitz) (1836–1844), Opole (Oppeln) (1837–1848), Racibórz (Ratibor)
(1842). However the data from these stations are unpublished. Only some of these
stations continued their activity (sometimes with short intervals) into the second
half of the nineteenth century or into the twentieth century. Apart from Wrocław,
these were Görlitz and Racibórz (Hellmann
, but such continuous
activity was very often connected with location changes of the original station.
Whether the data and information published in this compilation will result in a
better future reconstruction of the climatic changes in Lower Silesia, especially in
the spatial and long-term secular dimension, is open to discussion. This depends to
a large extent on the results of further archival research and the outcome of searches
for lost original materials. Difficulties arise from the fact that many archives as well
as collections of old Silesian prints were destroyed or stolen either in the course of
the war or shortly thereafter.
25.7 Conclusions
The reconstruction that was carried out in this work, of the 100 year period (1791–
1890) of the Wrocław Tp series, taking into consideration relations with the other
Silesian stations (Fig.
), constitutes an essential starting point for the recon-
struction of the series in its entirety (i.e., up to 2007) which is the subject of a sepa-
rate study (Bry
. This study discussed the reconstruction difficulties
related to the lack of homogeneity of the measurements in the nineteenth century.
Lack of access to original materials in the form of observation diaries makes it
impossible to achieve a more precise and accurate verification of the existing data.
This is of particular relevance with reference to daily data. Various uncertainties
remain that are connected with location changes and observation times, though
these are insignificant for the data reconstructed in the form of mean monthly val-
ues. Possible errors in the notation of the Tp monthly values for Wrocław should
not exceed the value of plus or minus 0.2°C.
It would be worthwhile investigating, a partial reconstruction of some longer or
episodic temperature series from various Silesian stations (including those in
Sudetenland) published by Galle
. This further reconstruction, feasible only
if further sources are located in the archives, would not only be helpful in terms of
recreating the climatic background of the areas surrounding Wrocław, but in the
future would allow researchers to reconstruct widespread climate changes in the
region of Lower Silesia and its outskirts in a longer dimension than the secular one.
This would be of great significance for the construction of more reliable climatic
models as well as climatic change scenarios.
Acknowledgments
This work has been partly supported by the grant N 30507332/2594 for
2007–2009 financed by the Ministry of Science and Higher Education – MNSW (Poland).

524
K. Bry
ś and T. Bryś
The Authors would like also to thank Prof. Rudolf Brázdil (Institute of Geography, Masaryk
University, Brno) for temperature data (1771–2005) from Prague (Praha-Klementinum) and for
discussions about the homogeneity of Wrocław temperature data; Prof. Fortuniak (Department of
Meteorology and Climatology, University of Łód
ź) for the use of temperature data from measure-
ments made by him and his collaborators from the Department of Meteorology and Climatology
from 1997 to 2001 at a height of 26 m on a building at the University of Łód
ź.
References
Breslauer statistic (1876, 1877, …1890), Breslau
Brohan P, Kennedy JJ, Harris I, Tett SFB, Jones PD (2006) Uncertainty estimates in regional and
global observed temperature changes: a new dataset from 1850. J Geophys Res 111:D12106.
doi:10. 1029/ 2005JD006548
Bry
ś K, Bryś T (2010) Reconstruction of the 217-year (1791-2007) Wrocław air temperature and
precipitation series. UMK Toru
ń, Bull Geogr – Phys Geogr Ser 3, (in print).
Ergebnisse der meteorologischen Beobachtungen im Jahre 1879 (1880, 1881…1890), Königlich
Preussischen Meteorologischen Instituts, Berlin
Flohn H (1993) Climatic evolution during the last millennium; what can we learn from it? In: Eddy
JA, Oeschger H (eds) Global changes in the perspective of the past. Wiley, Chichester, pp 295-316
Galle JG (1857) Grundzüge der Schlesischen Klimatologie. Josef Max & Komp. Breslau, p
XXIII + 128
Galle JG (1879) Mittheilungen der Königlichen Universitäts-Sternwarte zu Breslau. Maruschke
und Berendt, Breslau
Hellmann G (1883) Repertorium der deutschen Meteorologie. Leistungen der Deutchen in
Schriften, Erfindungen und Beobachtungen auf dem Gebiete der Meteorologie und des
Erdmagnetismus von den ältesten Zeiten bis zum Schlusse des Jahres 1881. W. Engelmann,
Leipzig
Hellmann G (1887) Geschichte des Königlich Preussischen Meteorologischen Instituts von seiner
Gründing im Jahre 1847 bis zu seiner Reorganisation im Jahre 1885. Asher, Berlin
Hellmann G (1914) Die Vorläufer der Societas Meteorologica Palatina. Beiträge zur Geschichte
der Meteorologie, Berlin 273 (Bd. 1, H. 2):139–147
Klimakunde des Deutschen Reiches, Bd. II, Tabellen (1939) Berlin
Körber HG (1997) Die Geschichte des Preussischen Meteorologischen Instituts in Berlin. DWD,
Offenbach/Main
Lamb HH (1995) Climate, history and the modern world. Routledge, London
Landsberg HE (1981) The urban climate. Academic, New York
Landsberg HE (1983) The early Wroclaw (Breslau) temperature observations 1710–1721. Institute
of Physical Science Technology, Techical note BN-1003, p 16
Lorenc H (2000) Studia nad 220-letni
ą (1779–1998) serią temperatury powietrza w Warszawie
oraz ocena jej wiekowych tendencji. Mat Bad IMGW, Ser Meteorologia 31:3–104
Munzar J (2003) Contribution of the Wrocław (Breslau) meteorological network from the years
1717–1730 to a better knowledge about weather conditions in Central Europe. Acta Univ
Wratisl 2542, Studia Geogr 75:23–30
Pyka J (2003) Meteorological observations and measurements in Wrocław. Acta Univ Wratisl
2542, Studia Geogr 75:11–22
Trepi
ńska J, Kowanetz L (1997) Wieloletni przebieg średnich miesięcznych wartości temperatury
powietrza w Krakowie (1792–1995). In: Trepi
ńska J (ed) Wahania klimatu w Krakowie
(1792–1995), Kraków
Document Outline
- Chapter 25
- The First One Hundred Years (1791–1890) of the Wrocław Air Temperature Series
- 25.1 Introduction
- 25.2 The Beginnings of the Wrocław Air Temperature Series
- 25.3 The Correction of the Influence of Location Changes on Air Temperature Measurements in Wrocław in the Nineteenth Centu
- 25.4 Other Corrections of the Wrocław Air Temperature Series
- 25.5 Discussion of Results
- 25.6 Temperature Measurements in Other Silesian Stations
- 25.7 Conclusions
- References
- The First One Hundred Years (1791–1890) of the Wrocław Air Temperature Series
Wyszukiwarka
Podobne podstrony:
One Hundred Years of Solitude Extensive Analysis of?te
Harding One Hundred Years Ago Chess in 1903 Chess café
Analysis of the Hundred Years War
(eBook PDF Sex) The Top One Hundred Lovemaking Techniques Of All Time
Marihuana The First Twelve Thousand Years
15 Wojna Stuletnia 11092008 The Hundred Years War
The Military Revolutions of the Hundred Years War
History of medical researches begins hundreds years ago when
Woziwoda, Beata; Kopeć, Dominik Changes in the silver fir forest vegetation 50 years after cessatio
Schiffman 25 The Most Dangerous Sales Myths
25 The 26 Qualities Of Devote (C)
25 The 26 Qualities Of A Devote(1)
Episode 25 The water Woda
Dr Who BBC Eighth Doctor 25 Interference Book One (v1 0) # Lawrence Miles
One Hundred Dollars
E C Tubb Dumarest 25 The Terridae
więcej podobnych podstron