
Politechnika Łódzka, ul. Żeromskiego 116, 90-924 Łódź, tel. (042) 631 28 83
www.kapitalludzki.p.lodz.pl
„Innowacyjna dydaktyka bez ograniczeń - zintegrowany
rozwój Politechniki Łódzkiej - zarządzanie Uczelnią,
nowoczesna oferta edukacyjna i wzmacniania zdolności
do zatrudniania osób niepełnosprawnych”
Prezentacja multimedialna współfinansowana przez
Unię Europejską w ramach
Europejskiego Funduszu Społecznego w projekcie pt.
„SIGNAL PROCESSING”
Projekt współfinansowany przez Unię Europejską
w ramach Europejskiego Funduszu Społecznego
2
Signal Processing
Analysis of Random signals
Projekt współfinansowany przez Unię Europejską
w ramach Europejskiego Funduszu Społecznego
3
Signal Processing
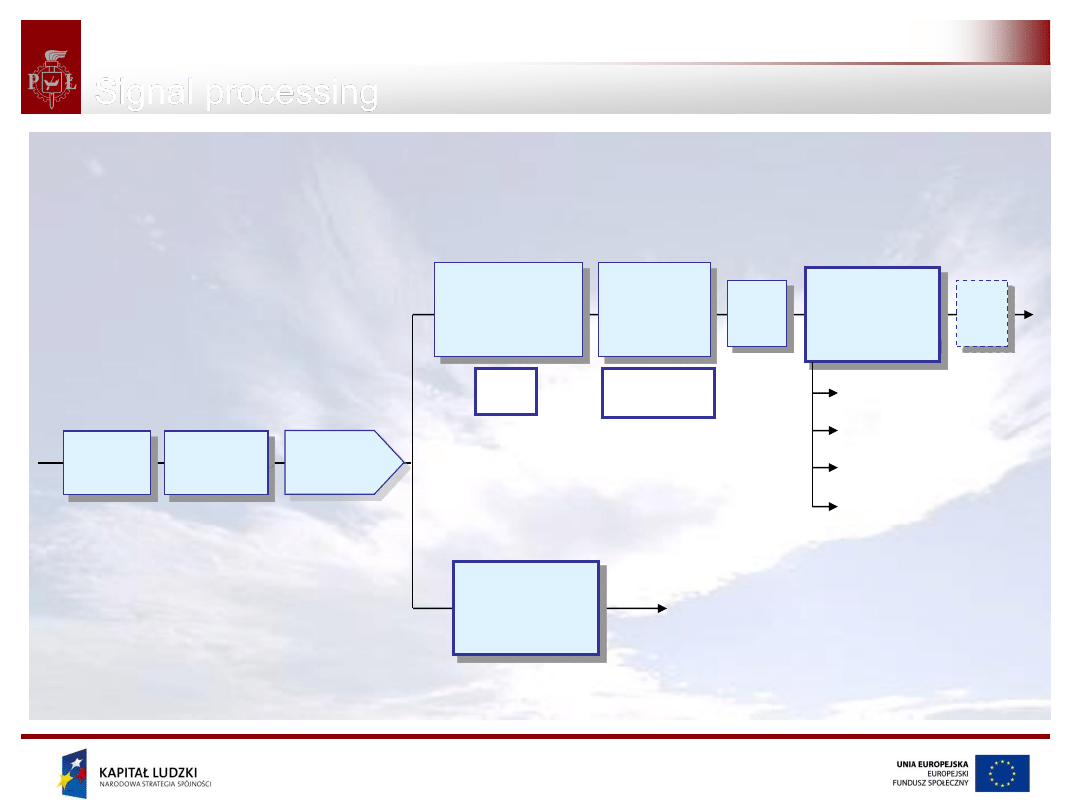
analog
(anty-aliasing)
filtering
A/D
sampling
M
f
M
s
f
f
2
D/A
Analog
processing
Digital
processing
sensor
Sprectral methods
Correlation methods
Filtering
Compressing
transducer
Amplifier
Signal processing
Projekt współfinansowany przez Unię Europejską
w ramach Europejskiego Funduszu Społecznego
4
Signal Processing
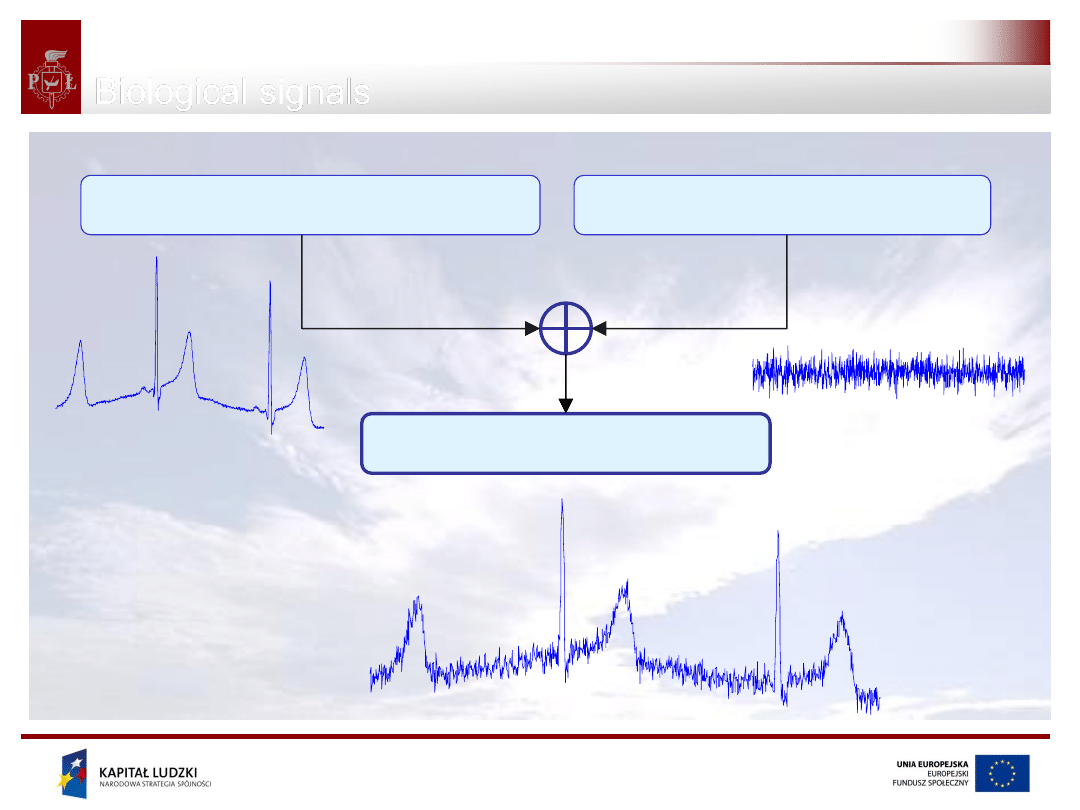
Biological signals
t
s
t
n
t
n
t
s
t
x
Biological signals
Deterministic models
Stochastic models
ECG
EMG noise
(artifacts)
Projekt współfinansowany przez Unię Europejską
w ramach Europejskiego Funduszu Społecznego
5
5
Signal Processing
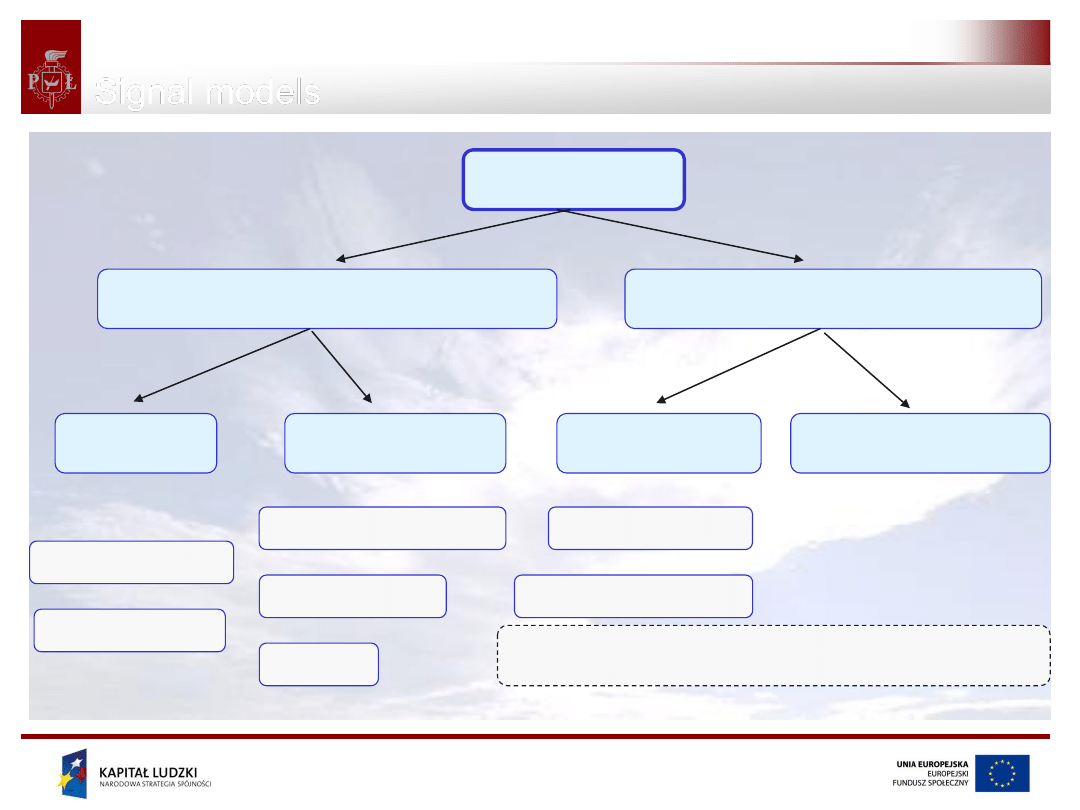
Signals
Deterministic
Stochastic
Stationary
Non-stationary
Harmonic
Non-periodic
Periodic
Compound
Quasi-periodic
Transient
others
Ergodic
Non-ergodic
Deterministic chaos models
nT
t
x
t
x
Signal models

Projekt współfinansowany przez Unię Europejską
w ramach Europejskiego Funduszu Społecznego
6
6
Signal Processing
Stationary signals
Signal models
Ergodic signals
Statistical moments (e.g. mean, variance) of a stochastic signal
do not change with time.
Statistical properties of a signal
(e.g. mean, variance)
can be
deduced from a limited, but sufficiently long, fragment of a signal
(process).
It means in practice we can deduce parameters of the process by
temporal computations of the moments.
Projekt współfinansowany przez Unię Europejską
w ramach Europejskiego Funduszu Społecznego
7
Signal Processing
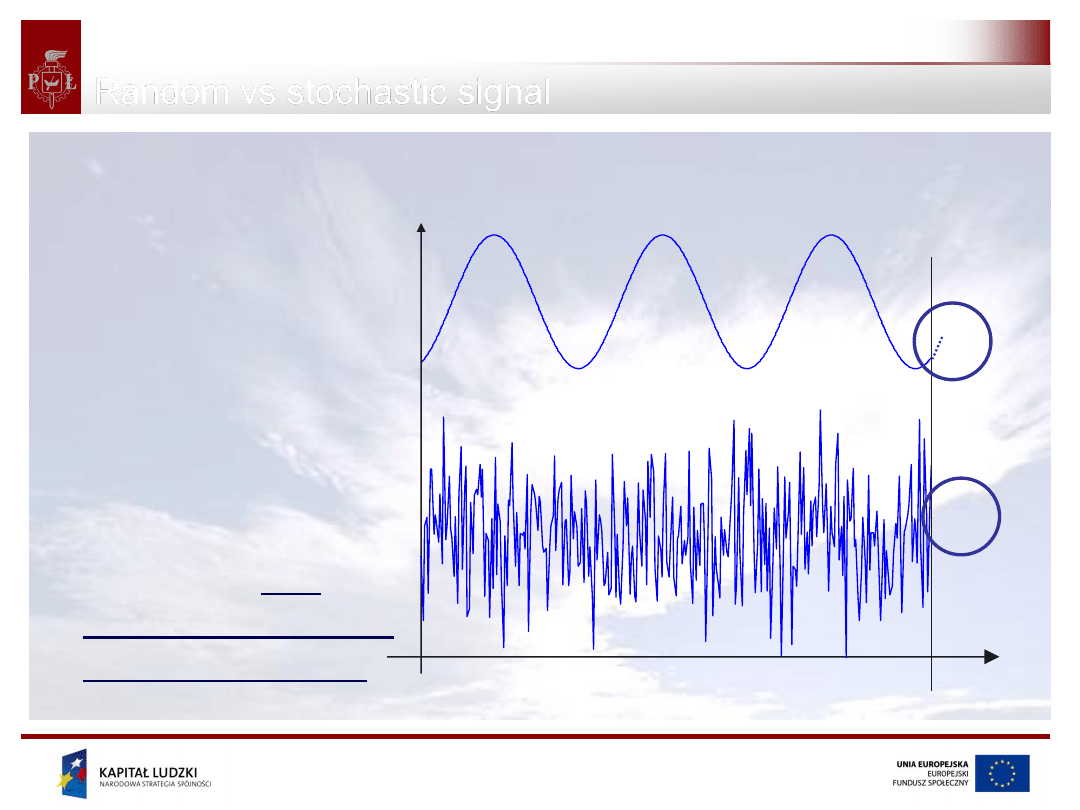
deterministic
(samples may be
predicted with high
accuracy)
random
(unpredictable values
of samples, only
statistical parameters
may be established)
?
t=t
0
t
0
Random vs stochastic signal

Projekt współfinansowany przez Unię Europejską
w ramach Europejskiego Funduszu Społecznego
8
Signal Processing
Random signal (parameters)
- exact values unpredictable
- can be interpreted as random variable
(and expressed in terms of the following parameters):
- expected value (mean)
- variance and standard deviation
- autocorrelation function
For stationary random signals these parameters are time invariant.
Projekt współfinansowany przez Unię Europejską
w ramach Europejskiego Funduszu Społecznego
9
Signal Processing
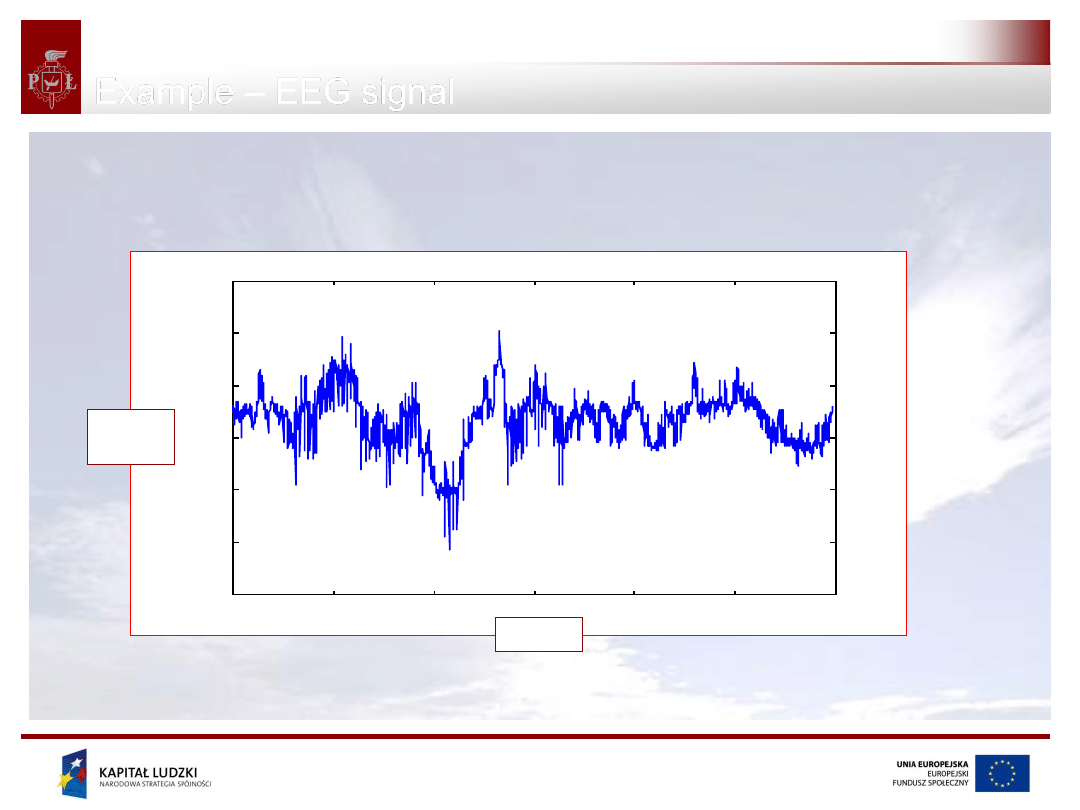
Example
– EEG signal
Stochastic model may be applied to electroencephalografic signal (EEG)
EEG is a result of electric activity of large amount * of neurons.
*)
It is being proven that neural perception is based on synchronization of
specialised populations of neurons
0
2
4
6
8
10
12
-30
-20
-10
0
10
20
30
Czas [s]
Time [s]
Electric
activity
Projekt współfinansowany przez Unię Europejską
w ramach Europejskiego Funduszu Społecznego
10
Signal Processing
10
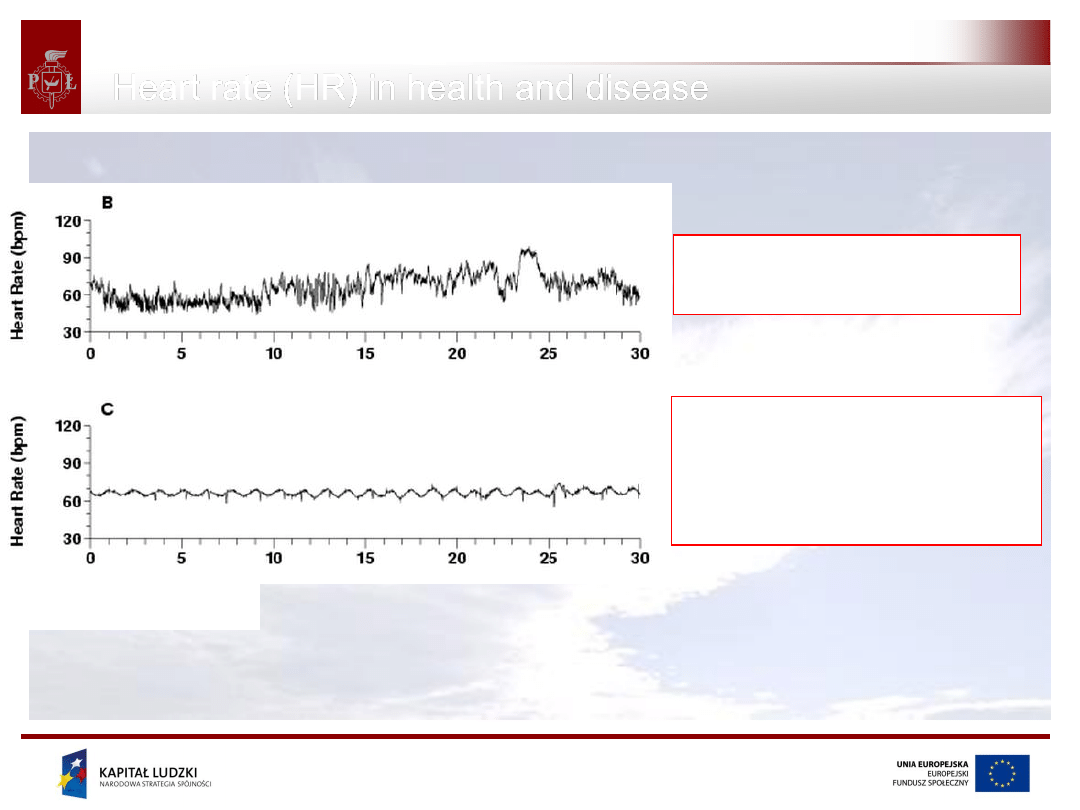
HR in severe congestive heart
failure (periodic oscillations
presents (~1/min) due to
Cheyene-Stokes breathing)
Normal sinus rhythm
(nonstationarity, „fractality”)
Heart rate (HR) in health and disease
www.physionet.org
Projekt współfinansowany przez Unię Europejską
w ramach Europejskiego Funduszu Społecznego
11
Signal Processing
11
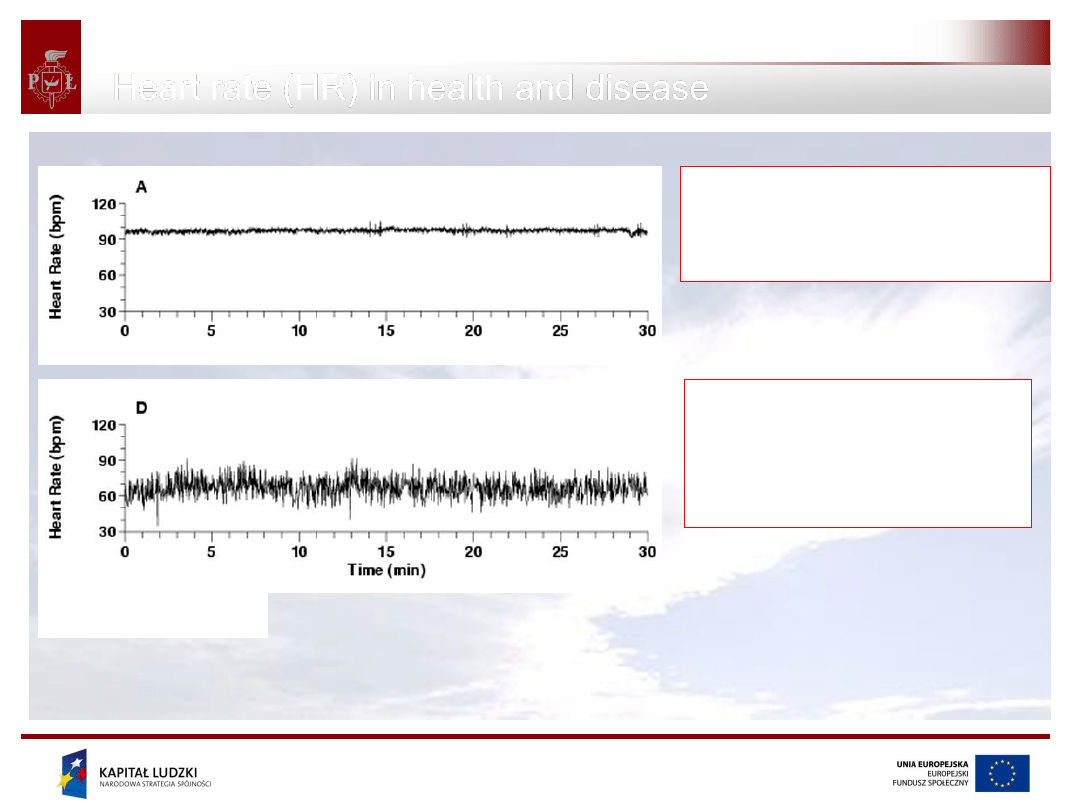
HR in severe congestive heart
failure – excessive regularity
of the heart rate
HR at cardiac arrhythmia,
(atrial fibrillation),
uncorrelated randomness
present
Heart rate (HR) in health and disease
www.physionet.org

Projekt współfinansowany przez Unię Europejską
w ramach Europejskiego Funduszu Społecznego
12
Signal Processing
Continuous signal:
x
dx
x
xp
t
x
E
x
n
x
N
n
p
n
x
n
x
E
N
n
N
n
N
n
N
n
1
2
1
Discrete signal:
#Python
#see also random?
x=random.randn(1000)
expected=x.mean()
successive samples are
equally probable
Random signal
– expected value

Projekt współfinansowany przez Unię Europejską
w ramach Europejskiego Funduszu Społecznego
13
Signal Processing
Random signal - variance
Variance- square mean of deviations from the expected value
Continuous signal:
dx
x
p
x
t
x
x
t
x
E
2
2
2
2
2
2
2
1
2
1
1
2
1
x
n
x
N
x
n
x
N
N
n
N
n
N
n
N
n
Disrete signal:
#Python
x=random.randn(1000)
std_dev=x.std()
Variance=x.var()
Projekt współfinansowany przez Unię Europejską
w ramach Europejskiego Funduszu Społecznego
14
Signal Processing
Continuous signal:
dt
t
x
t
x
R
n
n
m
n
x
n
x
m
R
#Python
x=random.randn(1000)
R=correlate(x,x,mode=‘full’)
plot(R)
Don’t forget to remove the mean from the signal!
Discrete signal:
Random signal
– autocorrelation function
Projekt współfinansowany przez Unię Europejską
w ramach Europejskiego Funduszu Społecznego
15
Signal Processing
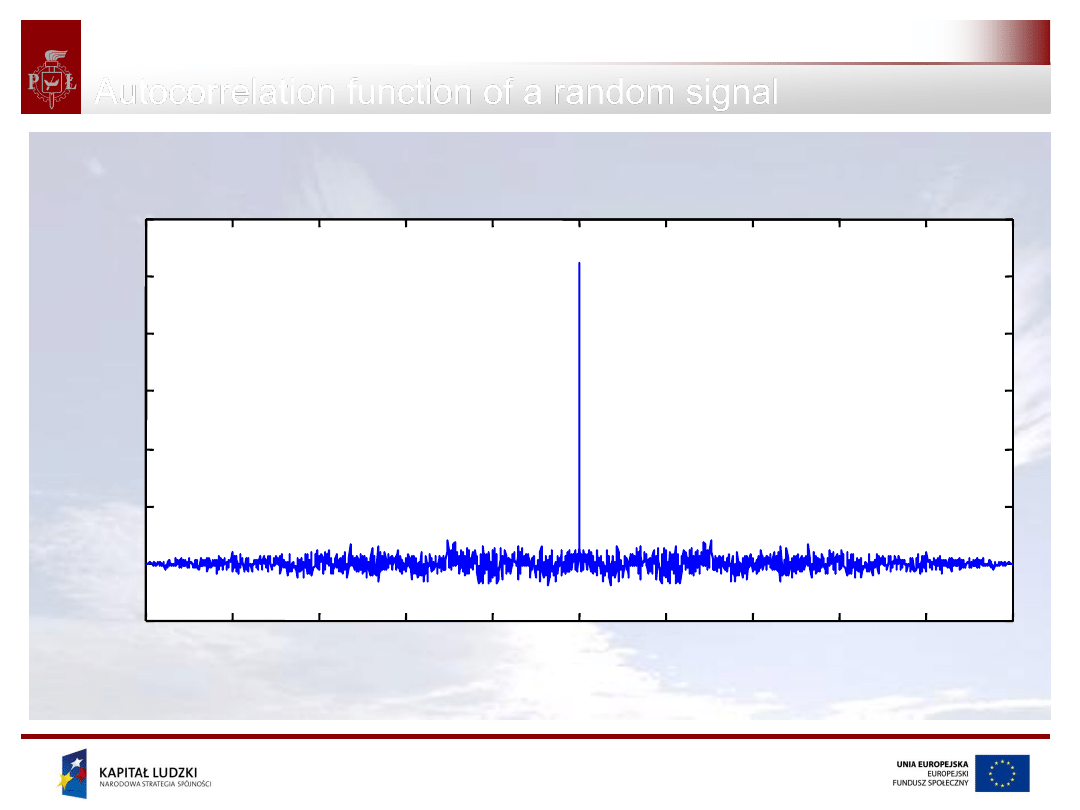
- time lag
-5
-4
-3
-2
-1
0
1
2
3
4
5
-200
0
200
400
600
800
1000
1200
(Gauss N(
,
)=N(0,1))
Autocorrelation function of a random signal
Projekt współfinansowany przez Unię Europejską
w ramach Europejskiego Funduszu Społecznego
16
Signal Processing
-5
-4
-3
-2
-1
0
1
2
3
4
5
x 10
4
-6000
-4000
-2000
0
2000
4000
6000
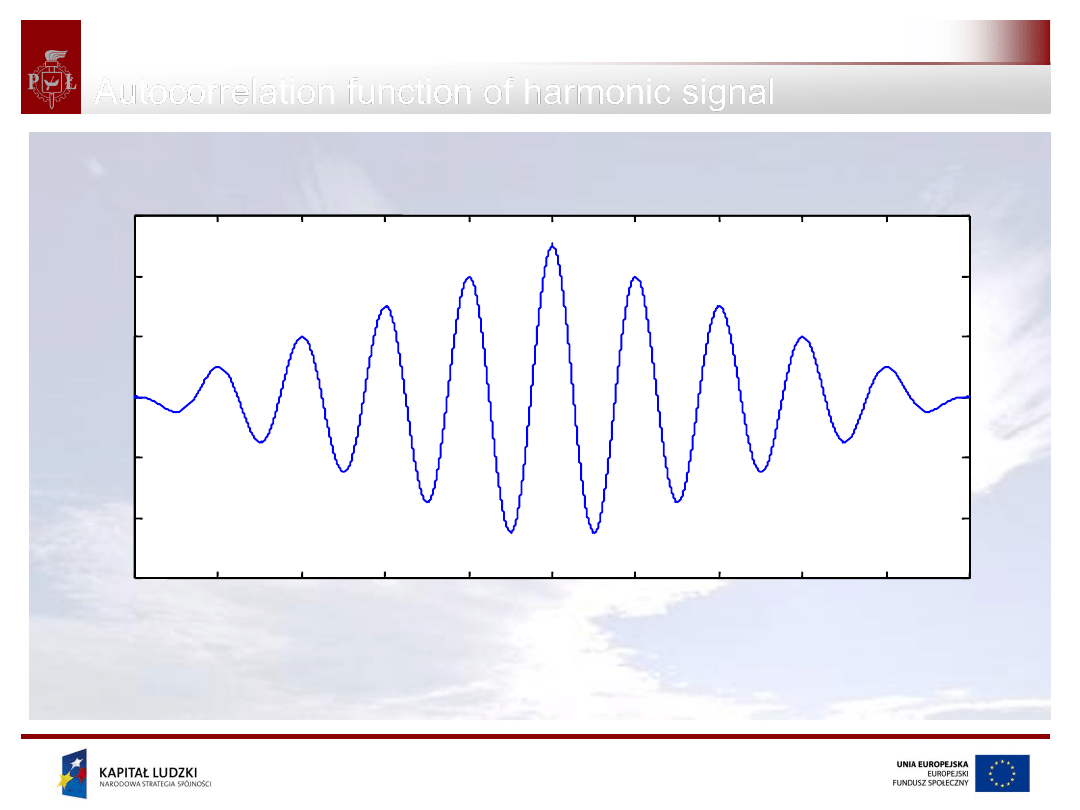
Autocorrelation function of harmonic signal
- time lag

Projekt współfinansowany przez Unię Europejską
w ramach Europejskiego Funduszu Społecznego
17
Signal Processing
1.
Compare the length of the signal with the lenght of
autocorrelation function.
2.
What properties of autocorrelation can you notice?
3.
What can be the application of autocorrelation function?
Autocorrelation function
– open questions
Projekt współfinansowany przez Unię Europejską
w ramach Europejskiego Funduszu Społecznego
18
Signal Processing
-15
-10
-5
0
5
10
15
-1
0
1
2
3
4
5
6
x 10
6
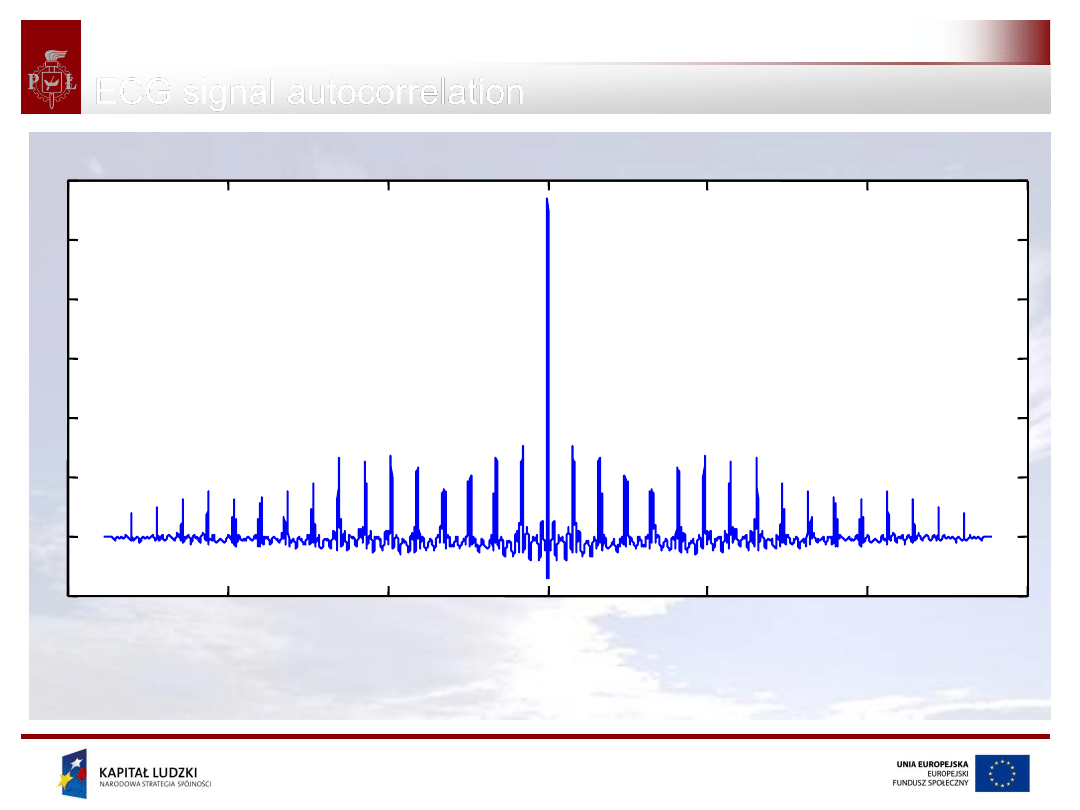
ECG signal autocorrelation
- time lag [s]
Projekt współfinansowany przez Unię Europejską
w ramach Europejskiego Funduszu Społecznego
19
Signal Processing
Continuous signals:
dt
t
y
t
x
R
xy
Discrete signals:
n
n
xy
m
n
y
n
x
m
R
Don’t forget to remove the mean from the signal!
Cross-correlation function
Projekt współfinansowany przez Unię Europejską
w ramach Europejskiego Funduszu Społecznego
20
Signal Processing
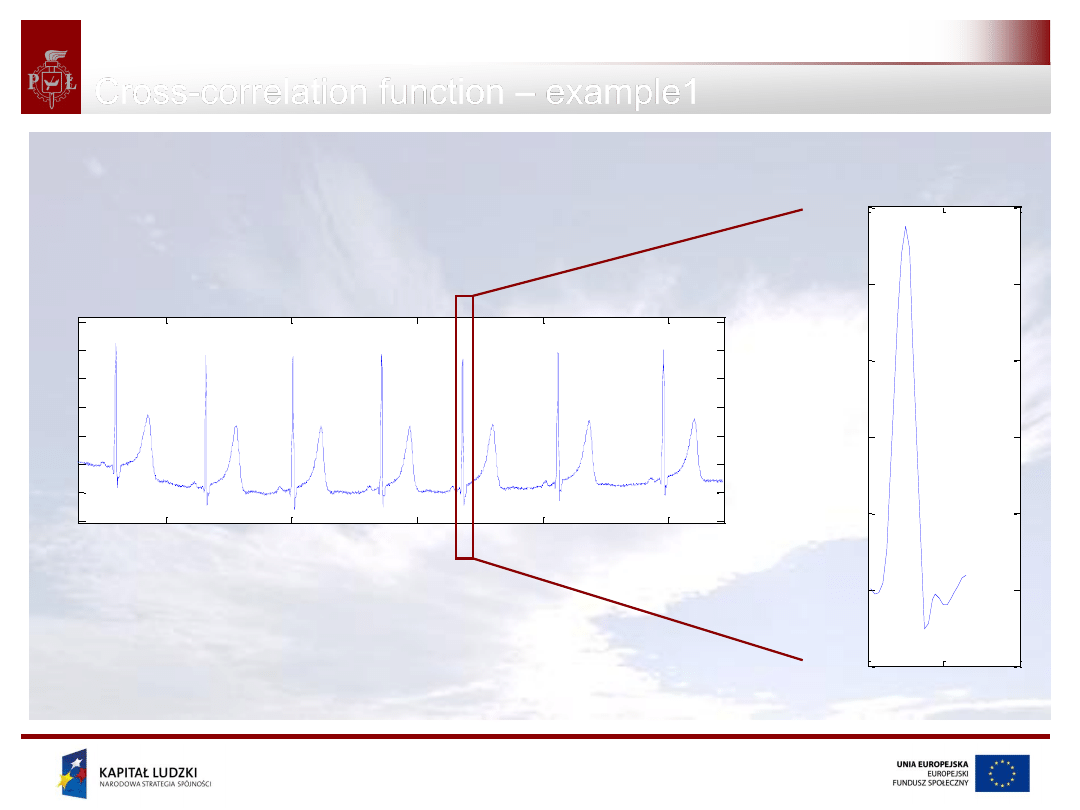
QRS detection by correlation with QRS pattern
1.
Determine the QRS pattern of the sample ECG signal.
2.
Use the pattern to detect other QRS comlexes
3.
Keep the results in order to compare them with the other
detection methods
Cross-correlation function
– example1
Projekt współfinansowany przez Unię Europejską
w ramach Europejskiego Funduszu Społecznego
21
Signal Processing
Cross-correlation function
– example1
0
20
40
-200
-100
0
100
200
300
400
QRS pattern
sample
1000
1500
2000
2500
3000
800
900
1000
1100
1200
1300
1400
1500
ECG signal
sample
Projekt współfinansowany przez Unię Europejską
w ramach Europejskiego Funduszu Społecznego
22
Signal Processing
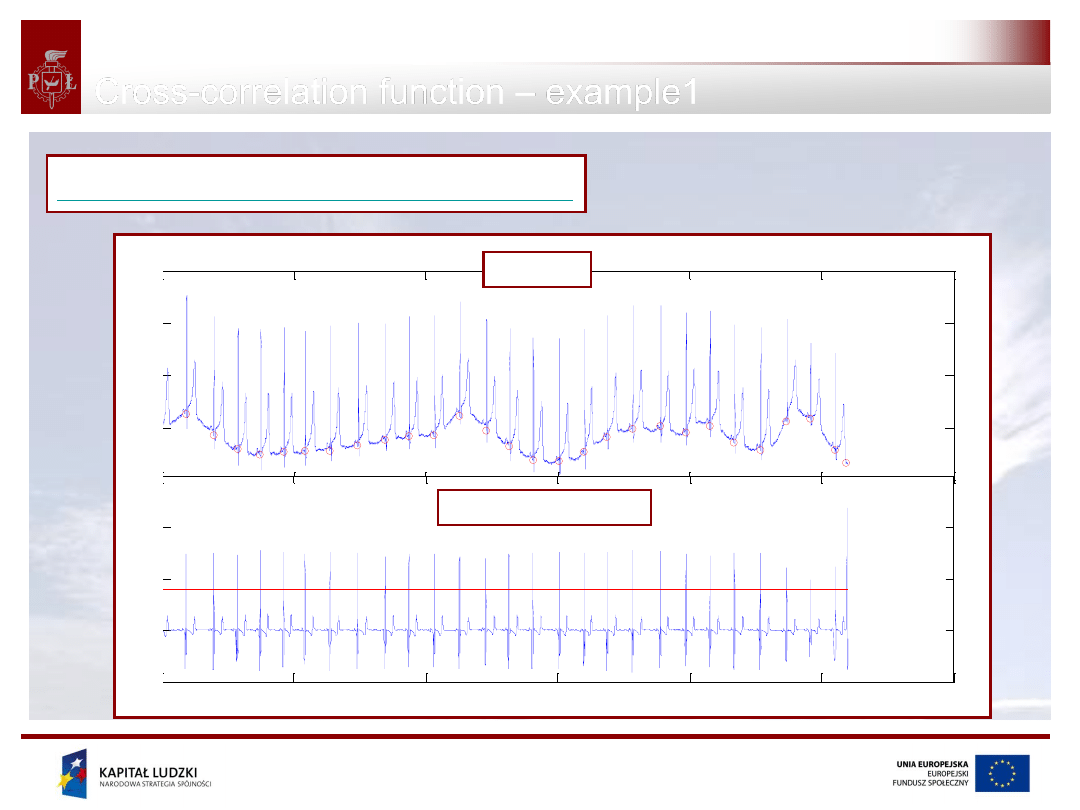
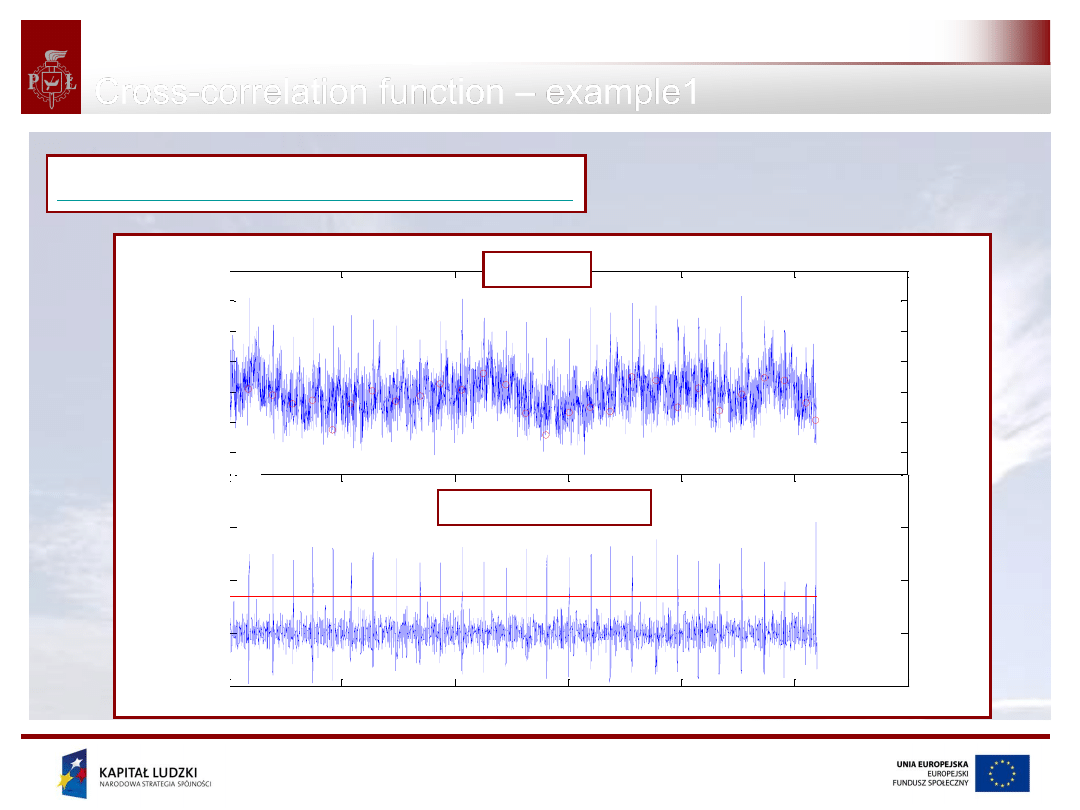
Cross-correlation function
– example1
0
2000
4000
6000
8000
10000
12000
800
1000
1200
1400
1600
kor=xcorr(ECGsignal,QRSpattern);
0
2000
4000
6000
8000
10000
12000
-5
0
5
10
15
x 10
5
ECG signal
Cross correlation function
Projekt współfinansowany przez Unię Europejską
w ramach Europejskiego Funduszu Społecznego
23
Signal Processing
0
2000
4000
6000
8000
10000
12000
400
600
800
1000
1200
1400
1600
1800
0
2000
4000
6000
8000
10000
12000
-5
0
5
10
15
x 10
5
Cross-correlation function
– example1
kor=xcorr(ECGsignal,QRSpattern);
ECG signal
Cross correlation function
Projekt współfinansowany przez Unię Europejską
w ramach Europejskiego Funduszu Społecznego
24
Signal Processing
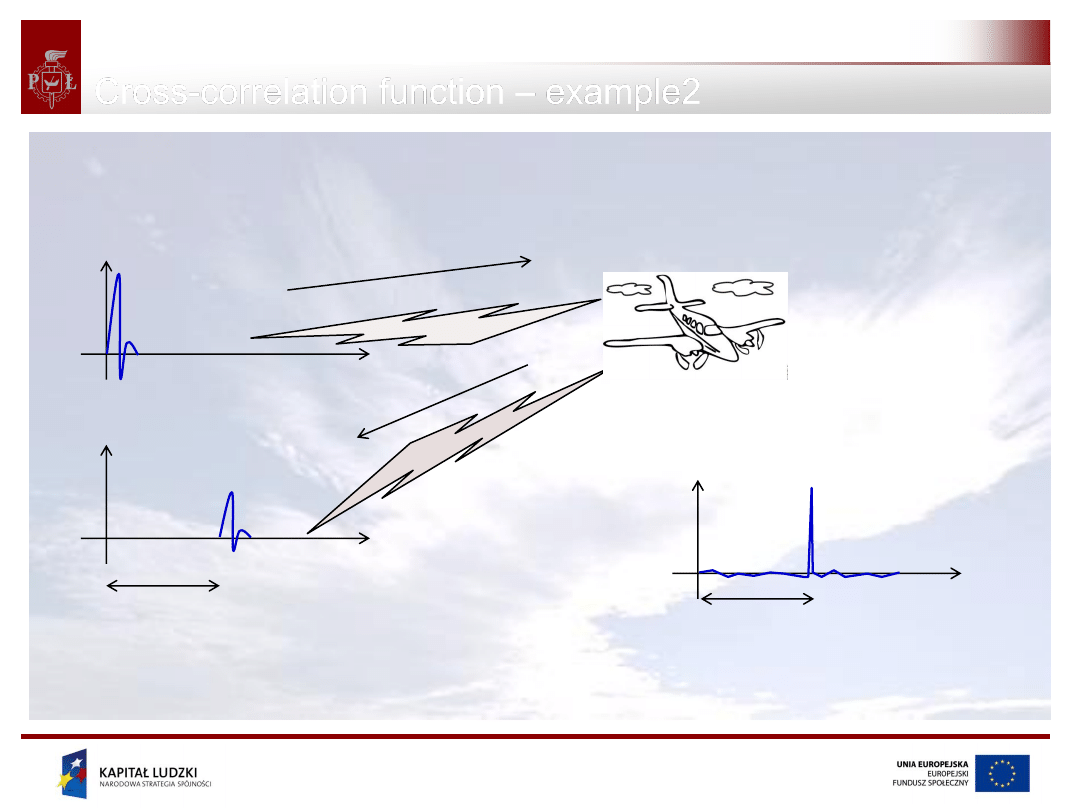
Cross-correlation function
– example2
Delay estimation of radar signals:
t
X(t)
t
Y(t)
T
t
r
xy
(t)
T

Projekt współfinansowany przez Unię Europejską
w ramach Europejskiego Funduszu Społecznego
25
Signal Processing
• Autocorrelation function of a random signal is
deterministic => its Fourier spectrum may be computed
2
j
X
j
X
j
X
R
FT
xx
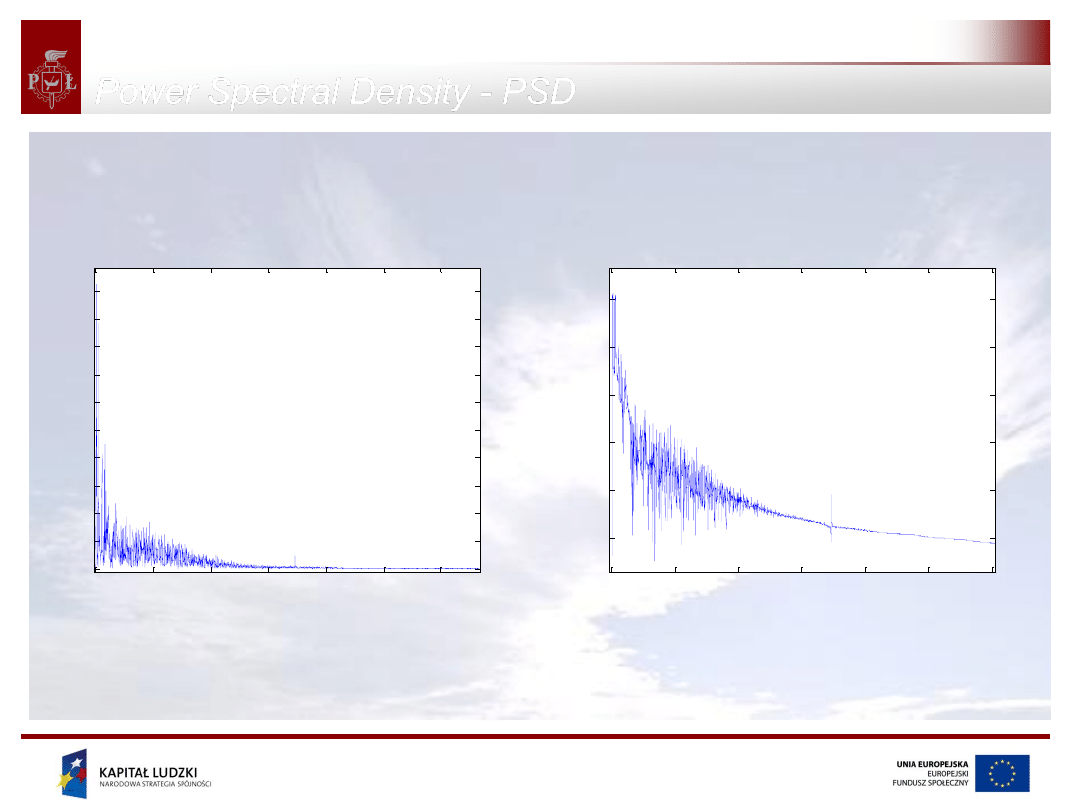
Power Spectral Density - PSD
Projekt współfinansowany przez Unię Europejską
w ramach Europejskiego Funduszu Społecznego
26
Signal Processing
0
500
1000
1500
2000
2500
3000
0
0.2
0.4
0.6
0.8
1
1.2
1.4
1.6
1.8
2
x 10
5
0
500
1000
1500
2000
2500
3000
350
400
450
500
550
600
Power Spectral Density - PSD
FFT coefficients
PSD coefficients
Projekt współfinansowany przez Unię Europejską
w ramach Europejskiego Funduszu Społecznego
27
Signal Processing
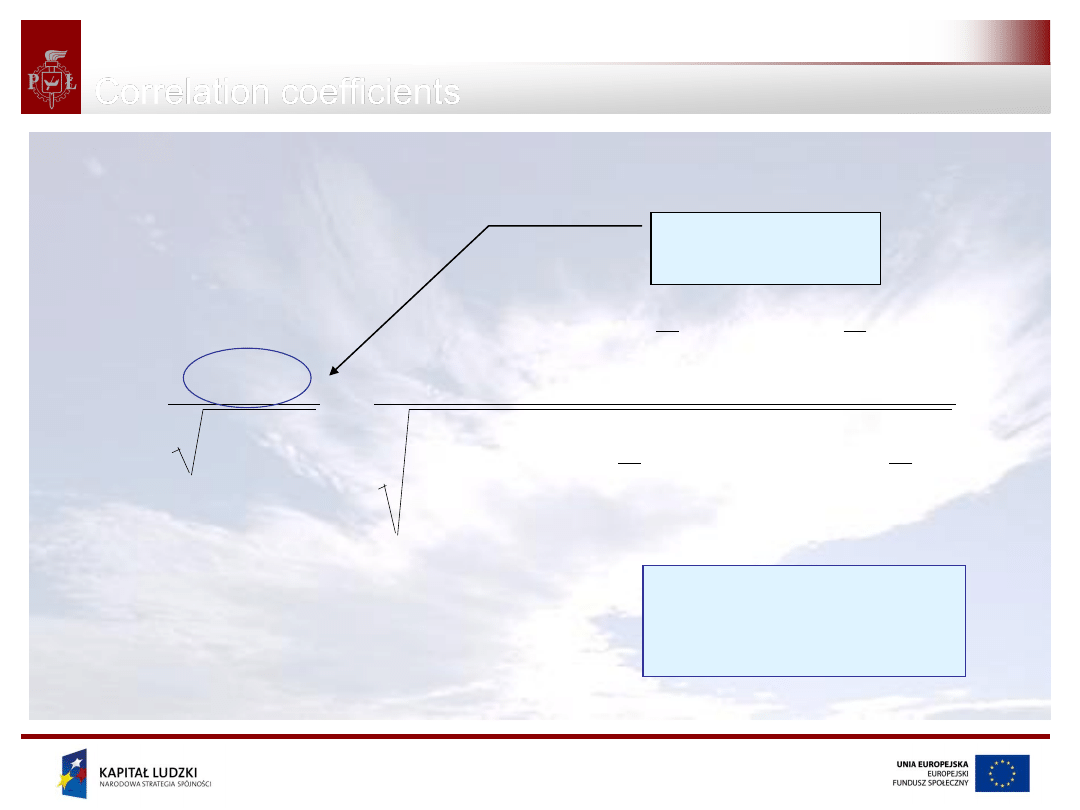
Similarity of two signals may be assessed with correlation coefficients.
N
n
N
n
N
n
y
x
xy
xy
y
n
y
x
n
x
y
n
y
x
n
x
r
1
1
2
2
1
covariance
-1
r
xy
1
#Python
corrcoef?
Correlation coefficients
Projekt współfinansowany przez Unię Europejską
w ramach Europejskiego Funduszu Społecznego
28
Signal Processing
Compute correlation coefficient between signals a and b:
6934
.
0
xy
r
Correlation coefficient - example
]
2
,
4
,
3
[
]
3
,
2
,
1
[
b
a
N
n
N
n
N
n
xy
y
n
y
x
n
x
y
n
y
x
n
x
r
1
1
2
2
1

Projekt współfinansowany przez Unię Europejską
w ramach Europejskiego Funduszu Społecznego
29
Signal Processing
EXERCISE:
Create 3 vectors:
1.
Vector x
1
whose elements are heights of the members of the
group in meters
2.
Vector x
2
– the weights in the same order as in x
1
(do not
cheat!)
3.
Vector x
3
– shoe size
Determine correlation coefficients of the vectors and point
the most correlated pair of vectors.
Correlation coefficients
Projekt współfinansowany przez Unię Europejską
w ramach Europejskiego Funduszu Społecznego
30
Signal Processing
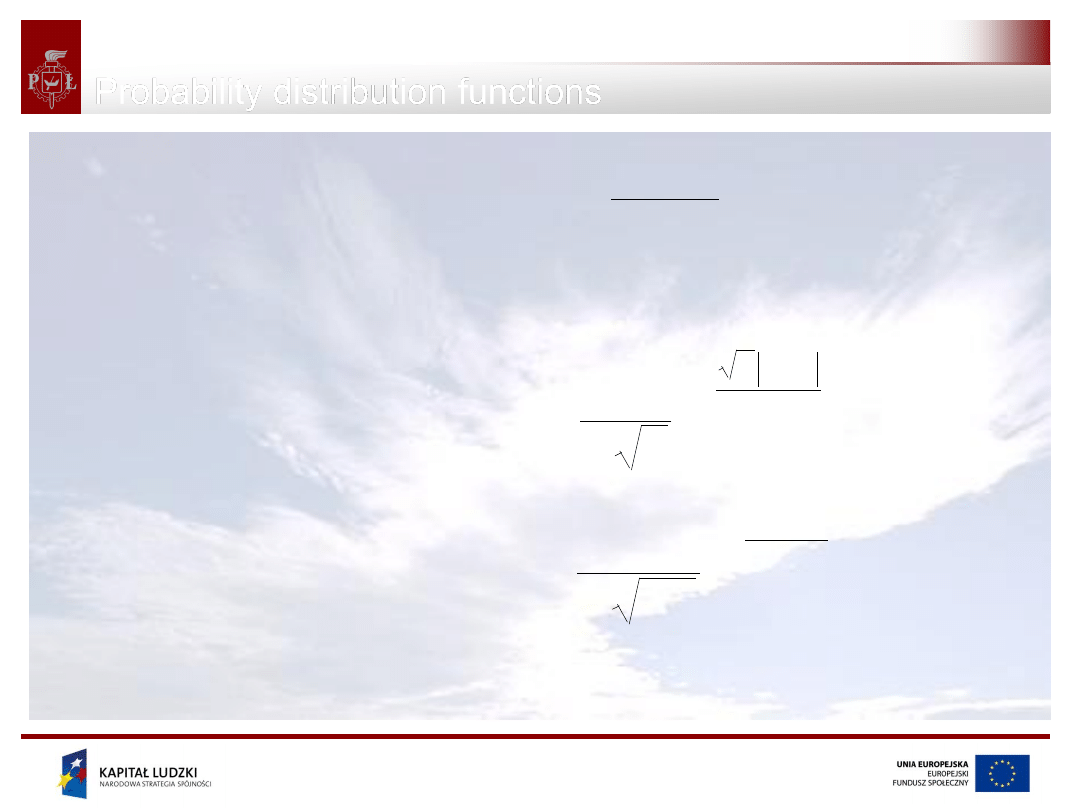
Uniform:
Laplace:
Normal (Gauss):
x
other
for
x
x
x
for
x
x
x
p
1
0
0
1
0
1
2
2
2
2
1
x
e
x
p
x
e
x
p
2
2
1
Probability distribution functions
Projekt współfinansowany przez Unię Europejską
w ramach Europejskiego Funduszu Społecznego
31
Signal Processing
-5
-4
-3
-2
-1
0
1
2
3
4
5
0
0.1
0.2
0.3
0.4
0.5
0.6
0.7
0.8
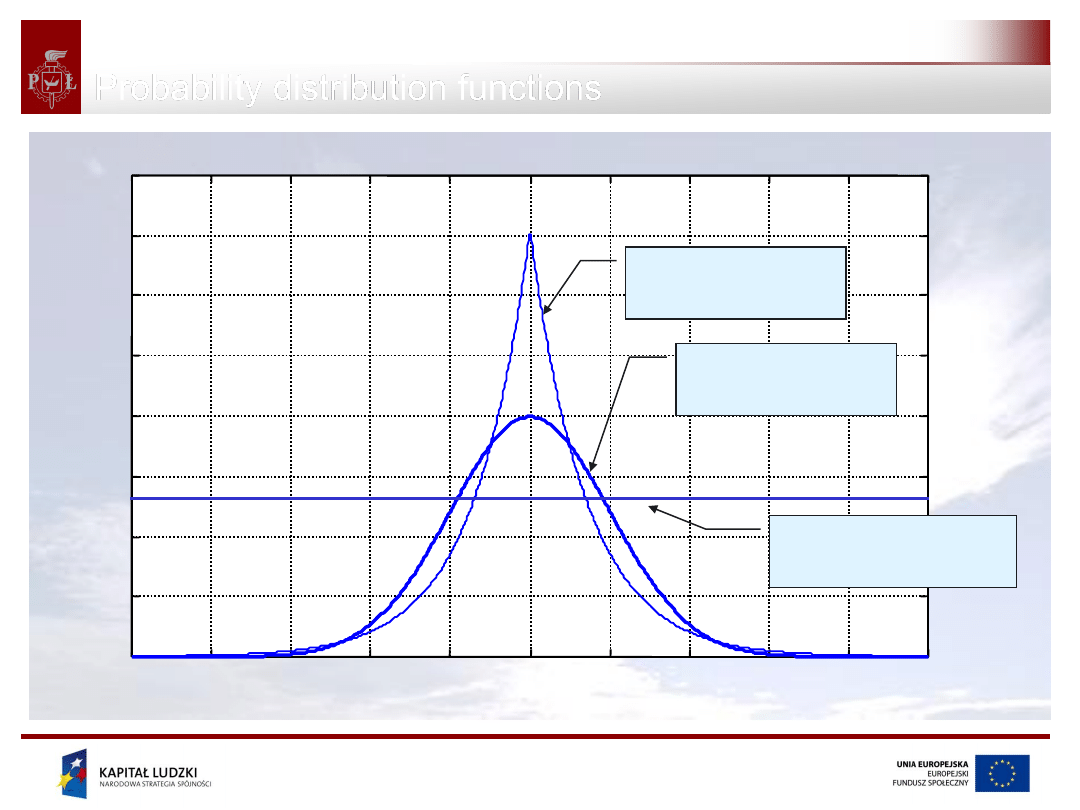
Laplace
Gauss
uniform
Probability distribution functions
Projekt współfinansowany przez Unię Europejską
w ramach Europejskiego Funduszu Społecznego
32
Signal Processing
0
100
200
300
400
500
600
700
800
900
1000
-4
-2
0
2
4
1
,
0
x
-4
-3
-2
-1
0
1
2
3
4
0
20
40
60
80
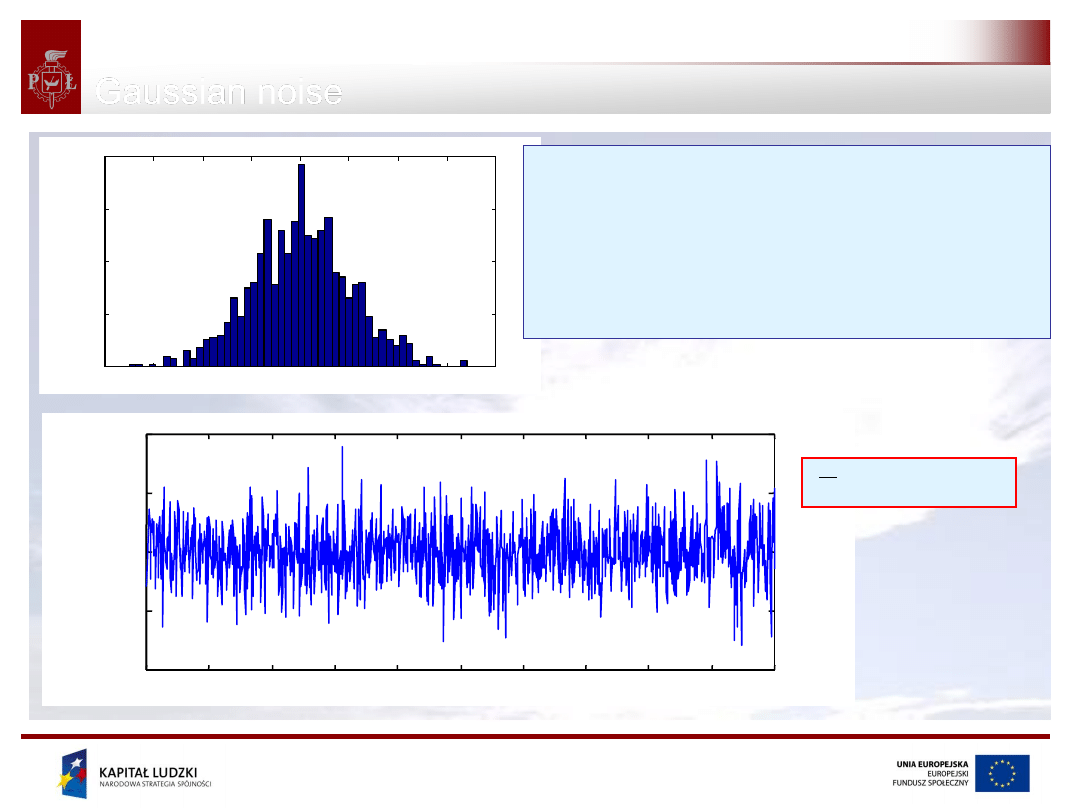
#Python
sigma=1
x=sigma*random.randn(1000)
bins=linspace(-5,5,50)
hist(x,bins, normed=‘True’)
Gaussian noise
Projekt współfinansowany przez Unię Europejską
w ramach Europejskiego Funduszu Społecznego
33
Signal Processing
0
100
200
300
400
500
600
700
800
900
1000
0
0.2
0.4
0.6
0.8
1
!
5
.
0
x
0
0.1
0.2
0.3
0.4
0.5
0.6
0.7
0.8
0.9
1
0
5
10
15
20
25
30
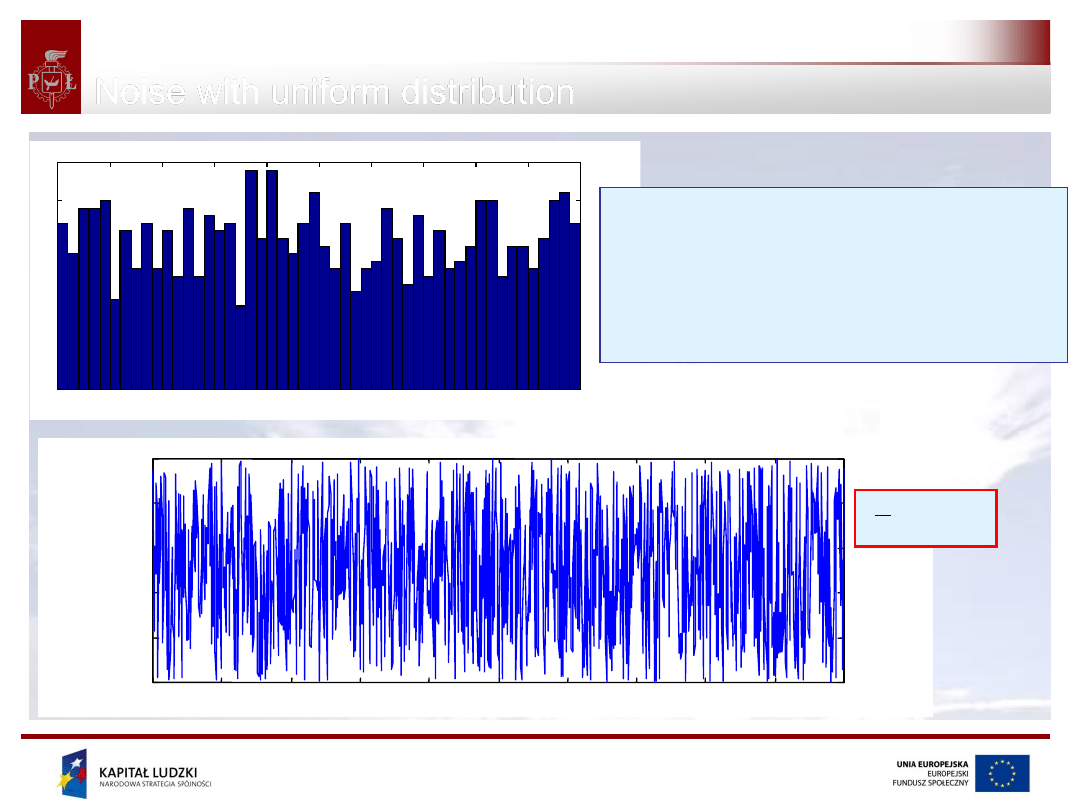
Noise with uniform distribution
#Python
range=1
y=range*random.rand(1000)
bins=linspace(-1,1.5,50)
hist(y,bins, normed=‘True’)
Projekt współfinansowany przez Unię Europejską
w ramach Europejskiego Funduszu Społecznego
34
Signal Processing
Poisson distribution is applied in observations of independent
phenomena with low probability of success (eg radioactive
decay)
Probability of j events in time
t:
where
is a mean number of events in
t.
Application:
RR intervals modeling, EMG signal, neural impulses, quality control
0
,
e
!
j
t
j
t
Z
p
t
j
Z
E
Z
D
2
Poisson discrete distribution
Projekt współfinansowany przez Unię Europejską
w ramach Europejskiego Funduszu Społecznego
35
Signal Processing
0
5
10
15
0
0.05
0.1
0.15
0.2
0.25
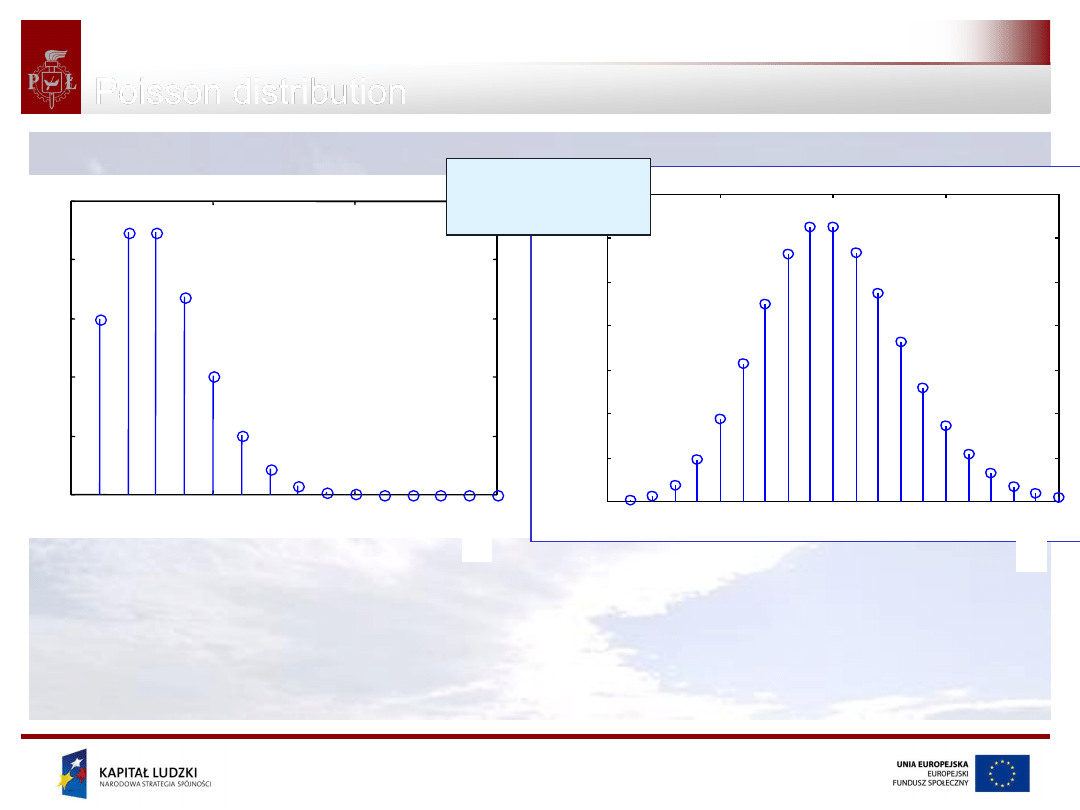
Poisson distribution
0
5
10
15
20
0
0.02
0.04
0.06
0.08
0.1
0.12
0.14
=3
=10
j
t
Z
p
Poisson process describes so called memoryless process, where
the number of events in time is independent on the past.
j
j

Projekt współfinansowany przez Unię Europejską
w ramach Europejskiego Funduszu Społecznego
36
Signal Processing
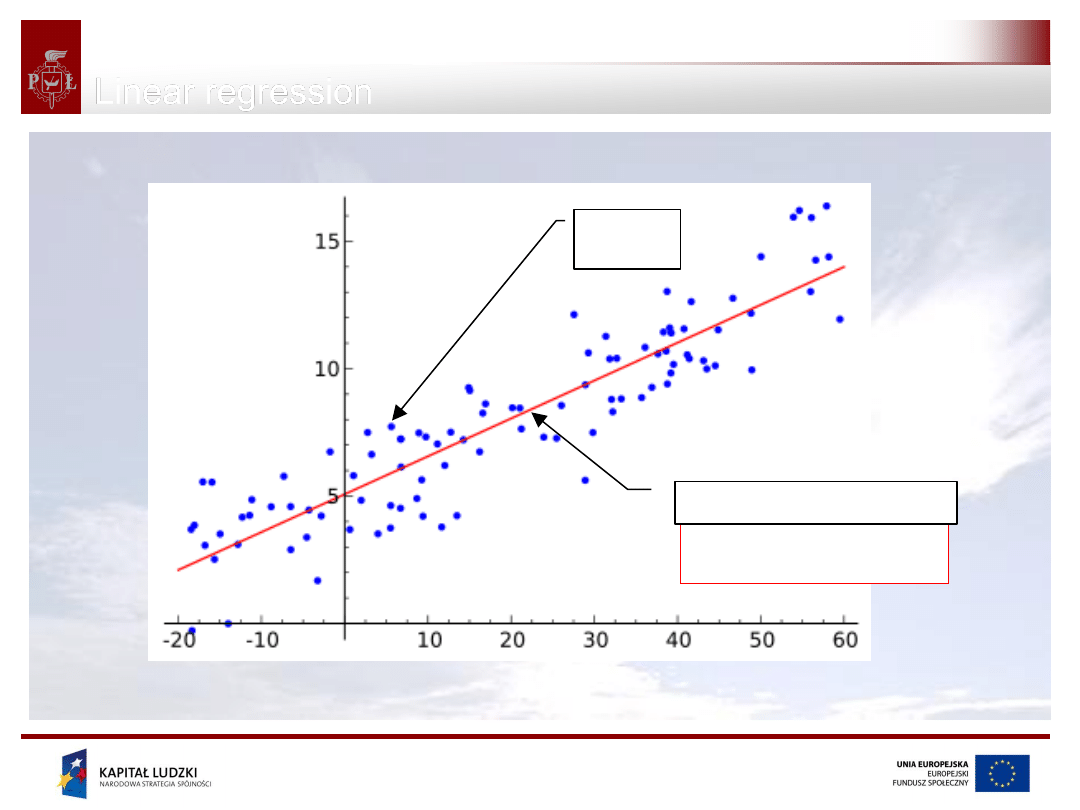
Let’s consider:
where:
x
– independent variable,
y
– dependent variable,
- noise (eg. measurement error),
0
,
1
– regression coefficients.
x
y
1
0
Linear regression
Projekt współfinansowany przez Unię Europejską
w ramach Europejskiego Funduszu Społecznego
37
Signal Processing
Linear regression
(y
i
, x
i
)
x
y
1
0
Best regression line?
Projekt współfinansowany przez Unię Europejską
w ramach Europejskiego Funduszu Społecznego
38
Signal Processing
Aim:
Suppose P observations (x
1
, y
1
), (x
2
, y
2
), ..., (x
P
, y
P
) are given.
Determine
0
,
1
, which most accurately relate variables x i y.
Solution:
Estimates of the coefficients may be derived by means of the least
square method.
i
i
i
i
y
y
x
y
ˆ
)
(
1
0
observation
Linear regression model
Linear regression - estimation

Projekt współfinansowany przez Unię Europejską
w ramach Europejskiego Funduszu Społecznego
39
Signal Processing
summed squared error - SSE
According to the idea of least squares method
proposed by Gauss in XIX-th century.
The mininum of the function is to be established.
2
1
1
0
1
2
)
ˆ
ˆ
(
P
i
i
i
P
i
i
x
y
SSE
Linear regression - estimation
Projekt współfinansowany przez Unię Europejską
w ramach Europejskiego Funduszu Społecznego
40
Signal Processing
0
ˆ
ˆ
ˆ
ˆ
)
(
1
2
1
0
0
0
P
i
i
i
x
y
SEE
0
ˆ
ˆ
ˆ
ˆ
)
(
1
2
1
0
1
1
P
i
i
i
x
y
SEE
So called normal
set of equations
The minimum is determined by setting the
partial derivatives to zero.
Linear regression - estimation
Projekt współfinansowany przez Unię Europejską
w ramach Europejskiego Funduszu Społecznego
41
Signal Processing
The solution to the normal set of equations:
x
y
1
0
ˆ
ˆ
P
i
i
P
i
i
i
x
x
y
y
x
x
1
2
1
1
ˆ
Linear regression - estimation
Projekt współfinansowany przez Unię Europejską
w ramach Europejskiego Funduszu Społecznego
42
Signal Processing
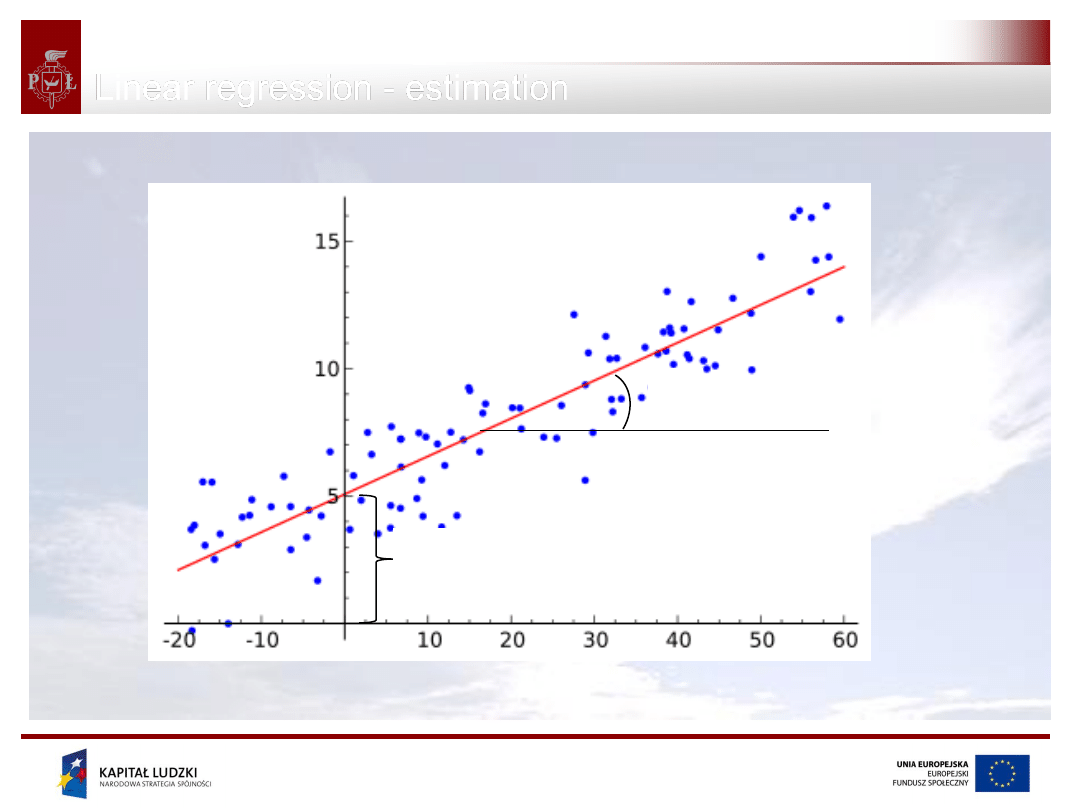
Source: Wikipedia
0
ˆ
1
ˆ
Linear regression - estimation

Projekt współfinansowany przez Unię Europejską
w ramach Europejskiego Funduszu Społecznego
43
Signal Processing
Higher order regression:
Analogous solution:
(N+1 equations with N+1 variables)
P
i
x
x
x
y
iN
N
i
i
i
,
,
1
,
1
1
1
1
0
P
i
x
y
N
j
ij
j
i
,
,
1
,
1
0
N
j
SEE
j
,
0
,
0
ˆ
)
(
Linear regression
Projekt współfinansowany przez Unię Europejską
w ramach Europejskiego Funduszu Społecznego
44
Signal Processing
Polynomial regression:
Nonlinear regression:
P
i
x
x
x
y
N
iN
N
i
i
i
,
1
,
2
2
1
1
1
1
0
i
i
i
x
i
x
i
x
i
e
y
y
e
y
1
0
1
0
0
1
1
Other regression models
Projekt współfinansowany przez Unię Europejską
w ramach Europejskiego Funduszu Społecznego
45
Signal Processing
Exercise:
1. For vectors x
1
, x
2
, x
3
with antropometric data determine linear
regression parameters
2. Is linear regression a proper model for all examined
dependances?
Linear regression - estimation

Projekt współfinansowany przez Unię Europejską
w ramach Europejskiego Funduszu Społecznego
46
Signal Processing
State variables representing the rules that describe the given
phenomenon.
t
v
t
v
t
v
t
d
,
,
,
2
1
v
o
t
g
dt
d
v
v
v
v
0
,
These rules may be described by means of differential equation:
And the set of state vectors that are its solution is called the trajectory
of a dynamic system.
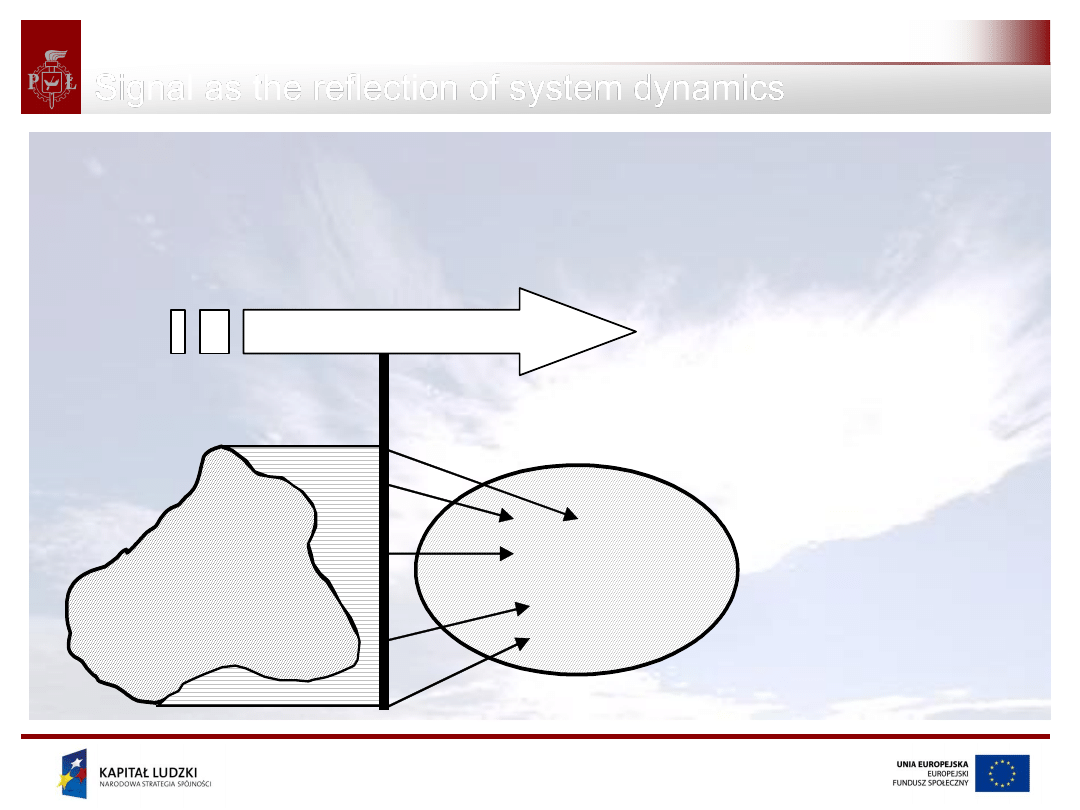
Signal as the reflection of system dynamics
Projekt współfinansowany przez Unię Europejską
w ramach Europejskiego Funduszu Społecznego
47
Signal Processing
Projection of state space
of the varibles of the given system into
the set of the signals
.
system
Set of signals
Projection
:
t
t
y
v
Signal as the reflection of system dynamics

Projekt współfinansowany przez Unię Europejską
w ramach Europejskiego Funduszu Społecznego
48
Signal Processing
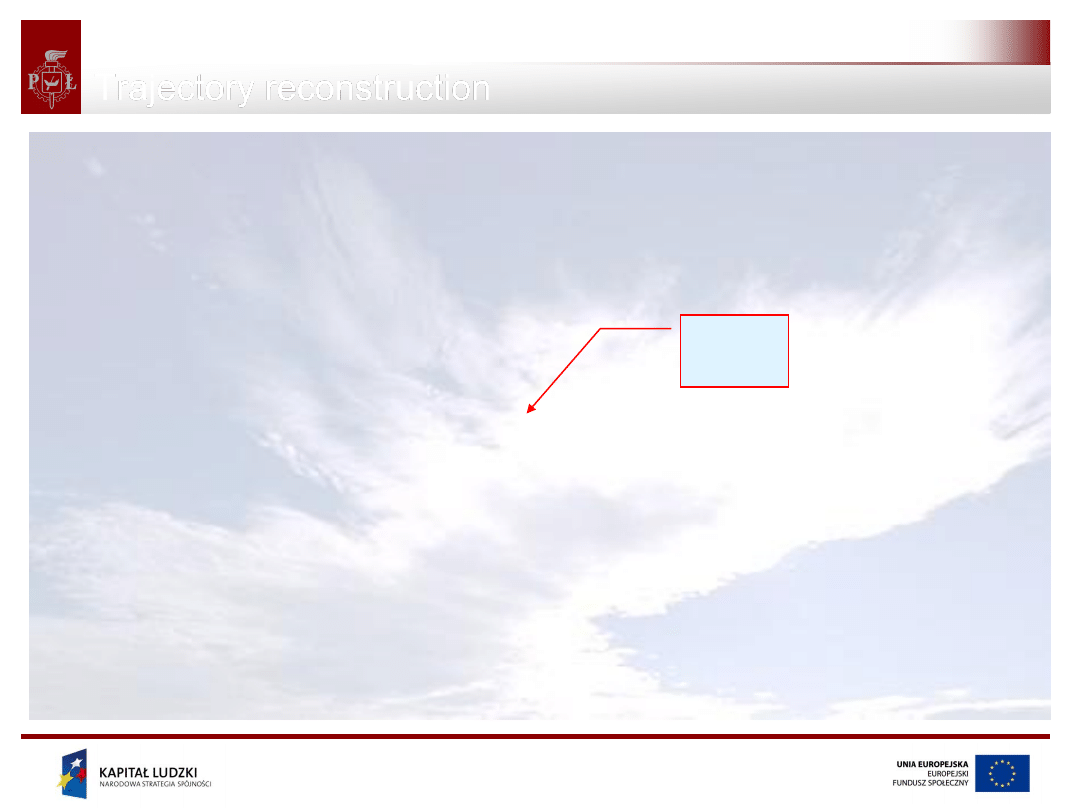
Takens (1981) proved, the properties of the trajectories of the
dynamic system may be reconstructed from the samples of a 1-
dimensional registration of the activity of the given system.
T
t
D
k
y
t
k
y
k
y
k
1
,
,
,
y
For the appropriate length D of the vector y(k) (time delay embedding)
Trajectory reconstruction
Projekt współfinansowany przez Unię Europejską
w ramach Europejskiego Funduszu Społecznego
49
Signal Processing
In practice Takens theorem means that there exists a dependance:
due to which it is possible to forecast the sample y(k+1)
t of the signal
reflecting the behaviour of the given system.
k
F
t
1
k
y
y
?
Trajectory reconstruction
Projekt współfinansowany przez Unię Europejską
w ramach Europejskiego Funduszu Społecznego
50
Signal Processing
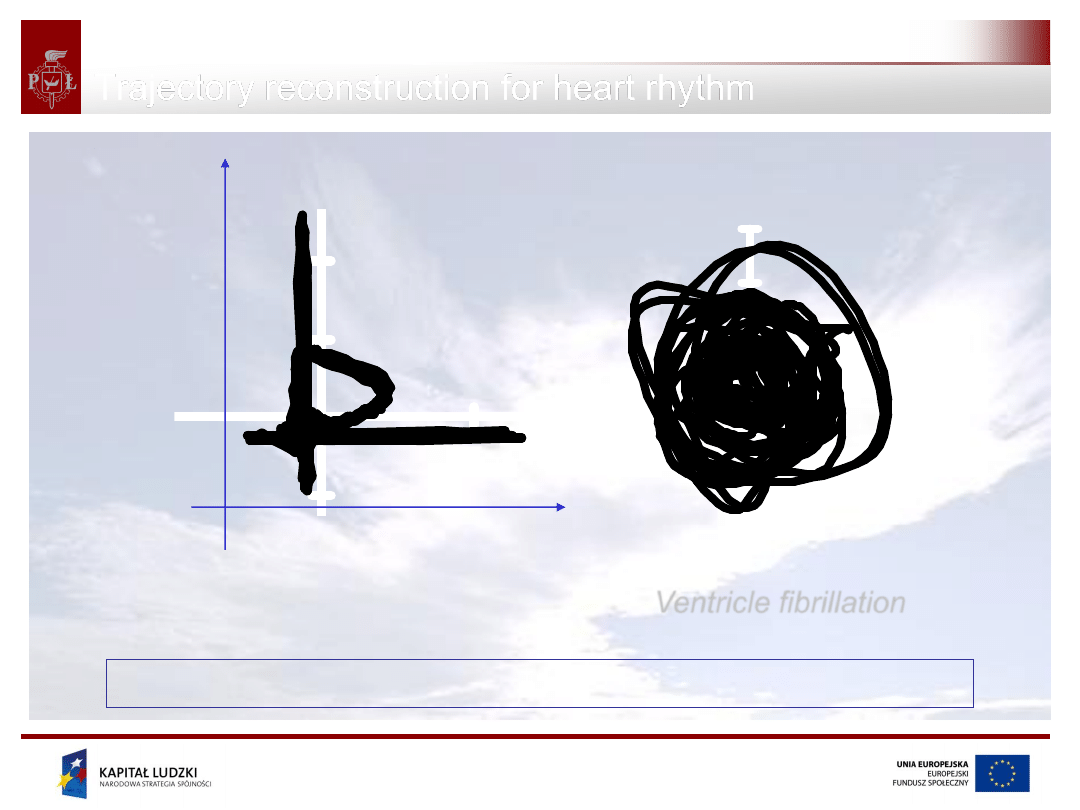
Normal heart rhythm
ms
40
t
Ventricle fibrillation
ms
t
70
t
1
k
x
t
k
x
t
– first zero of the autocorrelation function of the series y(k)
Trajectory reconstruction for heart rhythm

Projekt współfinansowany przez Unię Europejską
w ramach Europejskiego Funduszu Społecznego
51
Signal Processing
Consider the simple dynamic system:
n
x
n
ax
n
x
1
1
Simulating the change of number of population x in limited environment.
This number is normalized to
0,1
, therefore the value of parameter
a
belongs to
0,4
.
This is the, so called, logistic equation.
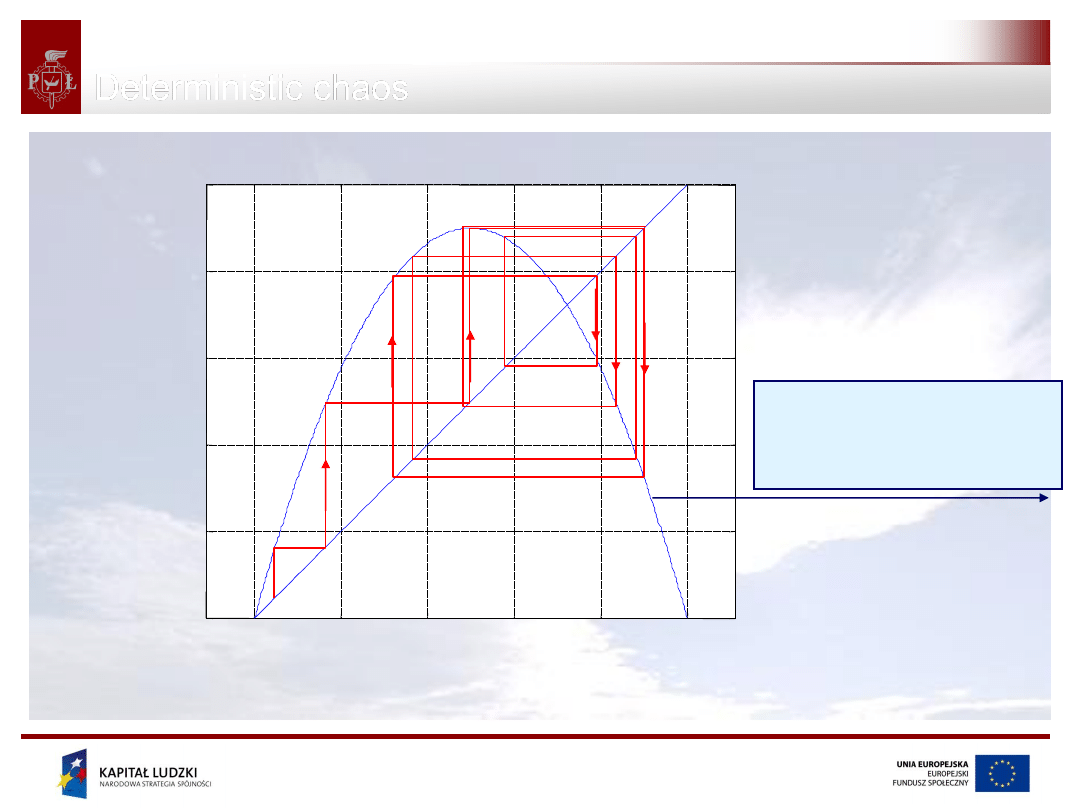
Deterministic chaos
Projekt współfinansowany przez Unię Europejską
w ramach Europejskiego Funduszu Społecznego
52
Signal Processing
n
x
n
x
n
x
1
6
.
3
1
0
0.2
0.4
0.6
0.8
1
0
0.2
0.4
0.6
0.8
1
0
1
0
1
So called „square
projection”
x(n)
x(n+1)
Deterministic chaos
Projekt współfinansowany przez Unię Europejską
w ramach Europejskiego Funduszu Społecznego
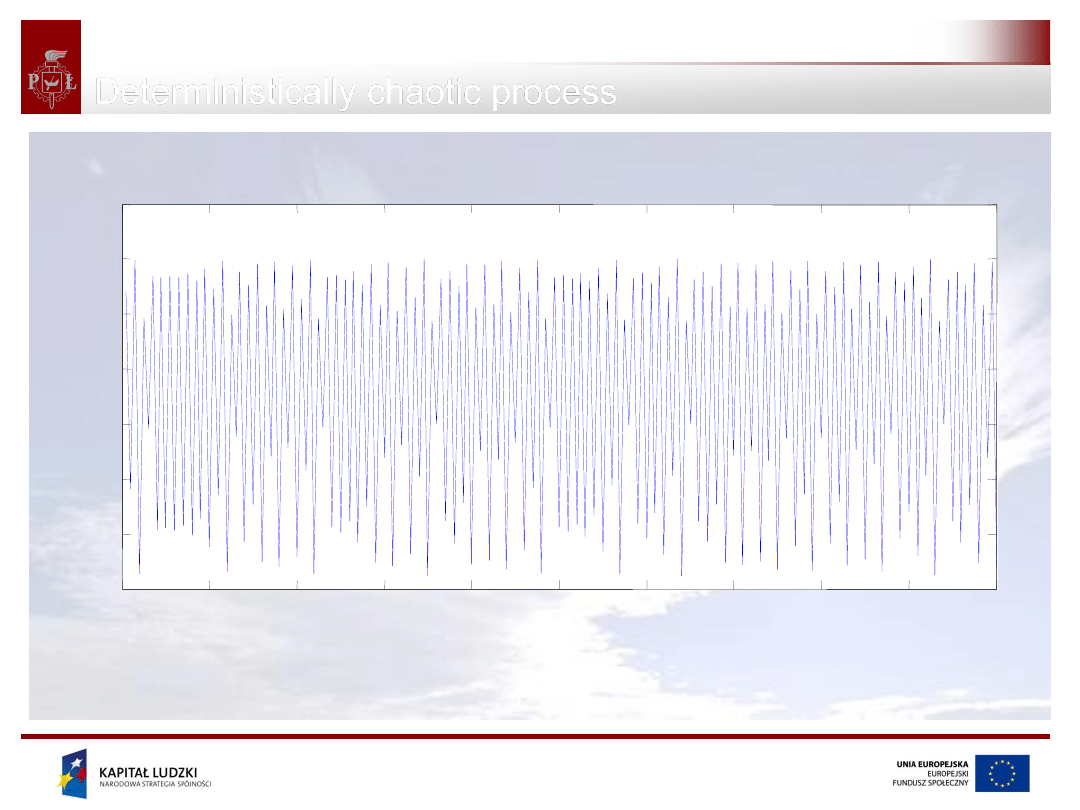
Deterministically chaotic process
53
Signal Processing
0
20
40
60
80
100
120
140
160
180
200
0.4
0.5
0.6
0.7
0.8
0.9
1

Projekt współfinansowany przez Unię Europejską
w ramach Europejskiego Funduszu Społecznego
54
Signal Processing
The properties of the deterministic, chaotic processes:
may be generated by simple dynamic systems *,
the dynamics has „unpredictable” random character (so called
strage attractors
) demo Matlab
Dynamics highly dependent on the initial conditions („
butterfly
effect
”)
Deterministic chaos
*)
R, May: „ … life would be easier if it was taken into account, that simple
dynamic systems not always lead to simple dynamic evolution
”

Projekt współfinansowany przez Unię Europejską
w ramach Europejskiego Funduszu Społecznego
55
Signal Processing
1.
Deterministic vs stochastic signals
2.
Mean, variance, standard deviation
3.
Autocorrelation function
4.
Cross-correlation function
5.
Correlation coefficient
6.
Power Spectral Density
7.
Distributions
8.
System dynamics
Analysis of random signals - summary

Politechnika Łódzka, ul. Żeromskiego 116, 90-924 Łódź, tel. (042) 631 28 83
www.kapitalludzki.p.lodz.pl
„Innowacyjna dydaktyka bez ograniczeń - zintegrowany
rozwój Politechniki Łódzkiej - zarządzanie Uczelnią,
nowoczesna oferta edukacyjna i wzmacniania zdolności
do zatrudniania osób niepełnosprawnych”
Prezentacja multimedialna współfinansowana przez
Unię Europejską w ramach
Europejskiego Funduszu Społecznego w projekcie pt.
„SIGNAL PROCESSING”
Wyszukiwarka
Podobne podstrony:
MT st w 06
Kosci, kregoslup 28[1][1][1] 10 06 dla studentow
06 Kwestia potencjalności Aid 6191 ppt
06 Podstawy syntezy polimerówid 6357 ppt
06
06 Psych zaburz z somatoformiczne i dysocjacyjne
GbpUsd analysis for July 06 Part 1
Probl inter i kard 06'03
06 K6Z4
06 pamięć proceduralna schematy, skrypty, ramyid 6150 ppt
Sys Inf 03 Manning w 06
Ustawa z dnia 25 06 1999 r o świadcz pien z ubezp społ w razie choroby i macierz
06 ZPIU org prod
06 Testowanie hipotez statystycznychid 6412 ppt
więcej podobnych podstron