
Cultural theory and risk perception: a proposal
for a better measurement
SUSANNE RIPPL*
University of Technology Chemnitz, Department of Sociology, 09107 Chemnitz, Germany
Abstract
In the 1980s, social and cultural perspectives become increasingly important in the eld
of risk research. In current empirical research on the inuence of social and cultural
factors on risk perception, the cultural theory (CT) of Douglas and Wildavsky (Risk
and Culture: An Essay on Selection of Technological and Environmental Dangers,
Berkeley: California University Press, 1982) is the most inuential approach. In 1990
Dake introduced a measurement instrument that is used broadly in quantitative studies
on cultural theory and risk. In the discussion of Dake’s work, two questions have
emerged as most controversial. First, can Douglas and Wildavsky’s theoretical concept
be tested on the basis of data obtained from individuals, as is done by Dake and many
other authors? Second, does the instrument introduced by Dake (Journal of Cross-
Cultural Psychology, 22, 61–82, 1991) show sufcient validity, in the sense that
hypotheses which could be derived from CT hold true when Dake’s scales are used?
Both questions are addressed here. A new instrument and strategies to test the validity
are introduced, which address criticisms of Dake’s work.
1. Introduction
The eld of risk research is currently dominated by two approaches: the so-called
psychometric paradigm, which is rooted in psychology and decision theory, and
the cultural theory of Douglas and Wildavsky (1982). The psychometric paradigm
focuses predominantly on cognitive factors that inuence individuals’ perception of
risk. On the basis of empirical work, Slovic and his colleagues in particular (Slovic
et al.
1980; Slovic 1987, 1992) found that two main cognitive factors dominate indi-
viduals’ perception of risk: the dread risk factor and the unknown risk factor.
1
They
replicated the signicance of these two factors in various studies and different cultural
contexts.
Despite these interesting results, the psychometric perspective neglects social and
cultural inuences on risk perception. Although Slovic and his colleagues found this
two-factor structure in different contexts, this approach cannot explain differences in
levels of risk perception among social and ethnic groups. Such differences were found
by other researchers in subsequent studies (e.g. Vaughan and Nordenstam, 1991; Flynn
Journal of Risk Research
5 (2), 147–165 (2002)
Journal of Risk Research
ISSN 1366-9877 print/ISSN 1466–4461 online © 2002 Taylor & Francis Ltd
http://www.tandf.co.uk/journals
DOI: 10.1080/1366987011004259 8
* Author to whom correspondence should be addressed: E-mail: susanne.rippl@phil.tu-chemnitz.de
1
The so-called dread risk factor includes characteristics such as calm–dread, voluntary–involuntary, control-
lable–uncontrollable, and catastrophic-not catastrophic. The unknown risk factor includes characteristics such as
known–unknown to the individual, known–unknown to science, and new–old.

et al.
, 1994; Rohrmann, 1994). Cognitive variables could not answer questions such as
‘Why is one technology feared in one society or social context and not in another?’
In the 1980s, however, cultural theory developed by anthropologists and sociologists
entered the eld. Researchers began to analyse social and cultural inuences on risk
perception. The theoretically most highly elaborated approach dealing with the impact
of such inuences is the so-called cultural theory (CT) developed by Douglas and
Wildavsky (1982). This approach has been adopted and developed by other authors
(Thompson et al., 1990; Rayner, 1992). Dake, in collaboration with Wildavsky, tried to
test the theory empirically, using a quantitative approach (Dake, 1990, 1991, 1992;
Wildavsky and Dake, 1990).
In discussions of Dake’s work, two questions have emerged as most controversial
(Sjöberg, 1995; Marris et al., 1996, 1998). The rst is whether Douglas and Wildavsky’s
theoretical concept can be tested on the basis of data obtained from individuals, as is
done by Dake (1991, 1992) and many other authors (e.g. Marris et al., 1996; Peters and
Slovic, 1996; Grendstad and Selle, 1997; Ellis and Thompson, 1997; Coughlin and
Lockhart, 1998). The second question is whether the instrument introduced by Dake
(1990) shows sufcient construct validity: that is, whether the measurement instrument
holds true when subjected to an empirical test according to hypotheses that could be
derived from CT, concerning the relations between the four constructs (the four cultural
types) and relations to other constructs (Schnell et al., 1989, p. 154). Both questions
are addressed in this paper. In particular, a new instrument and a new approach using
structural equation modelling are presented as a more appropriate method of testing
the complex, interconnected structure of the four cultural types.
2. The cultural theory
In the early 1980s Douglas and Wildavsky (1982) started a discussion about the impact
of values and cultural settings on the perception of risks (Johnson and Covello, 1987;
Dake, 1991; Stern et al., 1995). In their view, risk perception and concern about envi-
ronmental or social issues are socially and culturally framed. This means that the values
and worldviews of certain social or cultural contexts shape the individual’s perception
and evaluation of risks. Douglas and Wildavsky (1982) stress that individuals are
embedded in a social structure and that the social context of individuals shapes their
values, attitudes, and worldviews. In this way, socialized cognitive patterns work like
lters in the evaluation of information about risks (Stern et al., 1995, p. 726).
According to this perspective, the most important predictors for selecting what people
fear or do not fear are not individual cognitive processes such as the perception of
threats to health or feelings of uncontrollability (as stated in psychometric research),
but socially shared worldviews – so-called cultural biases that determine the individual’s
perceptions (Wildavsky and Dake, 1990, Dake, 1992). An overview of international
studies on risk perception showed, for example, that there is almost no relationship
between individual knowledge and concern (Wildavsky, 1993, pp. 193ff). This result can
be interpreted as an indication of the relevance of socialized cognitive schemata that
work like a lter in evaluating information. In this sense, values frame the interpreta-
tion of information. Therefore individuals with environmental values, for example, will
evaluate a given piece of information about the probability of accidents in nuclear
power plants totally differently than supporters of nuclear power. Ellis and Thompson
148
Rippl
(1997) argued that concern (e.g., for environmental issues) is embedded in broader
sociocultural orientations and is not merely a function of information about the safety
of particular technologies.
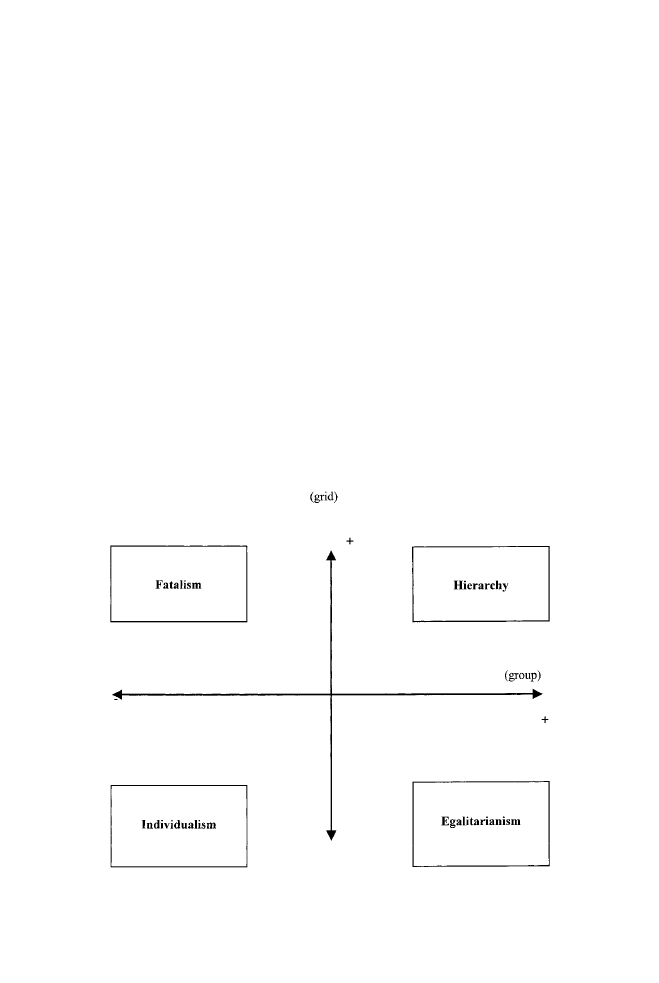
Cultural theory proposes that individuals choose what they fear in relation to their
way of life-that is, in relation to the ‘culture’ they belong to (Douglas and Wildavsky,
1982; Thompson et al., 1990; Douglas, 1997). To identify different types of cultures
Douglas and Wildavsky developed the so-called grid/group typology, which suggests
four prototypical patterns: Each consists of a characteristic behavioural pattern (pattern
of social relations), accompanied by a justicatory cosmology (or cultural bias). The
behavioural pattern includes concrete observable social relations and actions as well as
the social structure. Cosmology refers to a cognitive system that includes attitudes and
values (Gross and Rayner, 1985, p. 14): ‘Grid-group analysis treats ideas and values as
both reecting and constituting the experience both of belonging to a social organiza-
tion and of social differentiation within the organization’.
Douglas and Wildavsky (1982) developed the four prototypical cultural types using
two central dimensions of sociality: control (grid) and social commitment (group). (See
Fig. 1.)
Egalitarians, for example, have high interest and high identication regarding group
relations, but they dislike social relations that are shaped by social differences or hier-
archic structures. In their view, social relations are open to negotiation. In this way,
each type is a combination of both dimensions. Diagonally opposed groups show differ-
ences on both dimensions (grid and group), while neighbouring groups show similarities
Cultural theory and risk perception
149
Fig. 1. Typology of ‘ways of life’ using the grid/group-dimension.

on one dimension but differences on the other. For example, individualists have both
low sympathy for hierarchic structures and low sympathy for group attachment. Fatalists,
as the neighbouring category, also have low sympathy for group attachment, but a
different relation to the grid dimension: they accept externally ascribed social positions
and they recognize constraint by others, although they do not feel that they are part
of any social collective.
For each of the four types, cultural theory offers clear hypotheses about modes of
risk perception. Persons with hierarchic orientations are assumed to accept risks as long
as decisions about those risks are justied by governmental authorities or experts. They
fear risks that threaten the social order, however. Egalitarians are assumed to oppose
risks that will inict irreversible dangers on many people or on future generations. They
distrust risks that are forced on them by the decisions of a small elite of experts or
governmental authorities. Fatalists have a strong orientation toward socially assigned
classications, but without a group identication. They try not to know and not to worry
about things that they believe they can do nothing about. Individualists perceive risk
as opportunity. New technologies, for example, are viewed more as possibilities and
less as dangers (see Thompson et al., 1990, pp. 62f). They fear risks that could limit
their freedom.
3. The measurement concept
In dealing with measurement concepts for the cultural types described above, different
approaches can be distinguished. One approach focuses on the analyses of ‘small’ orga-
nizations or cultural groups (e.g., Gross and Rayner, 1985). Here can be used (for
example) observational methods of concrete social behaviour, such as sociometric
measures (e.g., number of contacts, positions, types of interactions) combined with atti-
tude measures, to record a highly comprehensive picture of a social unit. This approach
is not applicable to large populations, however. For the analysis of larger units, cultural
aspects can be inferred in two ways; rst, for example, from various cultural products
such as folk tales, typical methods of formal and informal learning, or legal systems.
Second, cultural aspects also can be inferred by aggregating individuals’ attitudes and
value priorities.
In the following discussion the latter approach is concentrated on through the devel-
opment of survey instruments for studies of larger populations. This approach, which
is used predominantly with attitude measures, dominates quantitative research on CT
today (e.g., Dake, 1991, 1992; Palmer, 1996; Peters and Slovic, 1996; Grendstad and
Selle, 1997; Ellis and Thompson, 1997; Marris et al., 1998; Coughlin and Lockhart, 1998).
Dake (1990, 1991) developed a measurement instrument for survey research,
containing 46 items, to assess the cultural biases. He took items from several instru-
ments that originally were developed to measure personal attitudes such as condence
in institutions, patriotism, authoritarianism, and law and order. A modied version was
used in several studies by (among others) Marris et al. (1996, 1998), Peters and Slovic
(1996), Palmer (1996), and Grendstad and Selle (1997).
Dake’s approach addresses only one aspect of what, in cultural theory, constitutes a
cultural type: cosmologies or cultural biases. He works in the usual paradigm of atti-
tude measurement, which is well established in the social sciences; the aspect of social
relations or behavioural patterns is disregarded. In this sense, attitude measures are
150
Rippl

used as indirect indicators of the more complex latent construct ‘cultural type’. In addi-
tion, the idea of shared values is not explicitly operationalized but is regarded as an
aggregate quality of individual values.
4. Individual-level data, cultural-level data, and cultural theory
In the literature is found a contentious discussion about whether it is possible to measure
‘culture’ with individual-level data. Referring to approaches in the research on values,
it could be argued critically that culture is not merely an aggregate phenomenon but
has an emergent quality as well. It is therefore not possible to measure culture with
individual-level data. On the other hand, it is possible to be attracted by the argument
of Hofstede (1980) or Schwartz and Ros (1995), who accept the possibility to infer
cultural aspects from individual-level data. They ‘view individual value priorities as a
product both of shared culture and of unique individual experiences’ (Schwartz and
Ros, 1995, p. 94). In a cultural group, a pattern of shared values plus individual vari-
ation will be encountered. ‘However, the average priorities . . . reect the central thrust
of their shared enculturation. Hence, the average priorities point to the underlying,
common cultural values’ (Schwartz and Ros, 1995, p. 94). Nevertheless, as Nauck and
Schönpug (1997) comment, the total equivalence of individual and cultural values is
imaginable only in a strictly functional conception of society.
Thompson (1996, pp. 4ff) focuses on this problem from another perspective when he
argues that CT includes an antidualistic conception of the individual; he points out the
relational character of this perspective. This idea is not contradictory to the presented
view if a ‘weaker’ relational approach is considered whereby individual preferences do
not depend totally on patterns of social relations; they are not altogether functionally
interconnected. Only from this perspective it is useful to measure cultural biases on the
individual level.
An individual-level approach is claimed not to measure culture directly, but to measure
products of relational processes. In the words of Schwartz and Ros (1995), individual
preferences are a product of unique individual experiences and shared enculturation.
Empirical evidence for the inuence of ‘culture’ is found in social (in contrast to indi-
vidual or random) variations in value preferences in different segments (groups) of
society, which are based on distinctly different experiences according to their position in
the social structure (e.g., Kohn, 1977). Similarities in value preferences often correlate
with similarities in social background (e.g., family structure, preferred social relations).
This ‘weak’ relational perspective also can be used to analyse tensions that develop if
individual preferences come into conict with social relations that the individual is forced
to observe. Therefore it makes sense to keep the individual and society as separate levels
of analysis. From this viewpoint it is possible learn about social processes from individual-
level analyses. Thus a measurement on the level of individuals is not a direct measure of
culture but a measure of processes that are connected to culture.
5. The validity of survey instruments for measuring cultural theory:
a measurement theory
In the previous section we elaborated on the idea that the measurement of cultural biases
on the individual level produces an indirect measure of cultural types – specically,
Cultural theory and risk perception
151

of ‘products’ of cultural contexts. From there we turn to problems of measurement.
Most authors (Dake, 1991, 1992; Marris et al., 1996; Peters and Slovic, 1996; Palmer, 1996;
Grendstad and Selle, 1997) composed the scales largely in the tradition of classical test
theory, assuming unidimensionality of constructs. The reliability of the scales is tested
mostly with parameters such as Cronbach’s alpha; the validity of the scales is rarely
tested, however.
The theoretical approach of cultural theory outlined above implicitly involves
numerous hypotheses concerning a measurement theory; this theory, however, is not
used explicitly in the actual quantitative research. The term measurement theory refers
here to hypotheses that could be derived from CT, and that give instructions in how
to measure the four cultural types (e.g., grid and group aspects of the scales, or the
internal rationale for distinguishing the four types). In contrast, a structural theory or
structural hypotheses include assumptions about the relations of the cultural types to
external criteria or other constructs. Although it may be possible to argue about the
measurement theory that is proposed here (see next section), this approach is an
advance in the actual survey research on CT: in contrast to approaches with a more or
less arbitrary use of measurement instruments, it explicates testable hypotheses for
proving validity that are derived theoretically from cultural theory.
Thus, as a rst step, a measurement theory is explicated. As a rst clue regarding
the validity of the scales, the relationships between the cultural biases should be tested
in a way suggested by the rationale for the typology of cultural theory. Each cultural
bias is constructed according to a certain scheme using the grid/group dimensions. The
cultural biases that show no similarity on one of the two dimensions should have signif-
icant negative correlations. Neighbouring cultural biases should show a weak
correlation; whether this is negative or positive depends on whether the grid or the
group aspect is more dominant in the formulation of items.
Hypothesis 1
: Individualism and hierarchy should yield a signicant negative correlation.
Hypothesis 2
: Fatalism and egalitarianism should yield a signicant negative correlation.
Hypothesis 3
: Individualism and egalitarianism should not be correlated signicantly or
should yield only a weak correlation at either sign.
Hypothesis 4
: Individualism and fatalism should not be correlated signicantly or should
yield only a weak correlation at either sign.
Hypothesis 5
: Hierarchy and egalitarianism should not be correlated signicantly or
should yield only a weak correlation at either sign.
Hypothesis 6
: Hierarchy and fatalism should not be correlated signicantly or should
yield only a weak correlation at either sign.
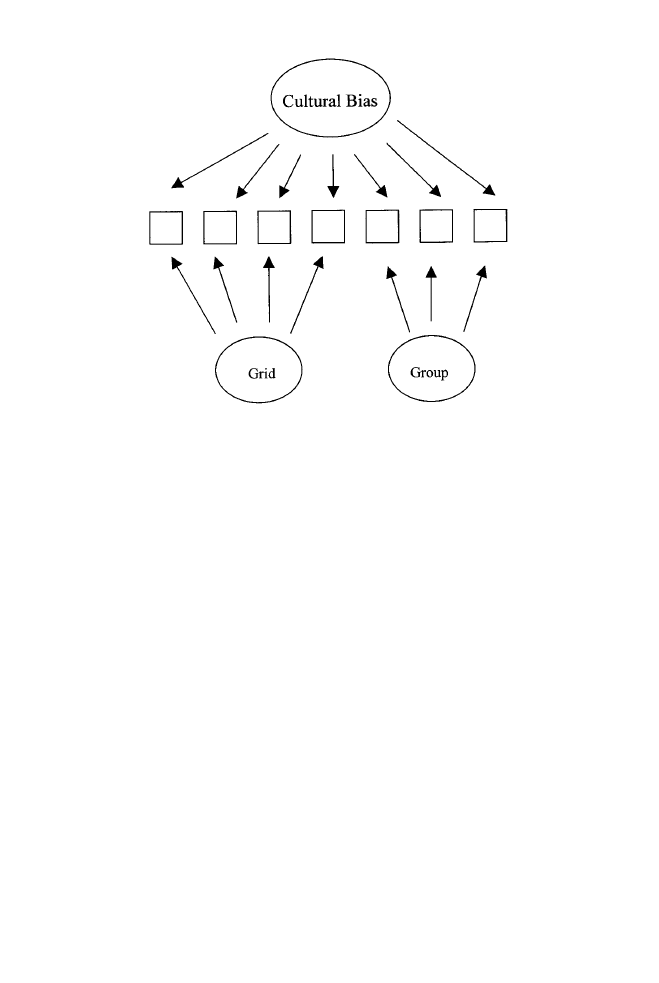
The typology also implies that each type includes a certain attitude regarding both
grid and group aspects. Thus it should be possible to nd items that could be identi-
ed a priori as grid or group while also having variation in common. The model given
in Fig. 2 illustrates this idea.
Hypothesis 7
: The items that are used to measure a cultural bias should be clearly iden-
tied as ‘grid’ or ‘group’ items.
152
Rippl
6. An empirical test of validity
To test Hypotheses 1–6 the work began by using the instruments of Dake that had
been implemented in different studies. A comparison of the results of Dake (1991), of
Marris et al. (1996), and of a small pretest study conducted in Chemnitz, a mid-sized
city in eastern Germany, in spring 1997 was made. The data were collected from 106
sociology students during regular classes in which the professors were willing to take
time for the research. In this study the scales used by Marris et al. (1996) were modi-
ed slightly to make them more reliable. Items with an item-total correlation coefcient
of less than 0.30 were disregarded.
2
Item sum totals were computed for each scale to
make the results comparable with those of Dake and of Marris et al. Scale intercorre-
lations are presented in Table 1.
In all the studies correlations were found that do not conform to the theoretical
assumptions of cultural theory. In particular, the strong positive correlation between
hierarchy and individualism – opposite cultural biases in Douglas and Wildavsky’s
typology, with dissimilarity on both the grid and the group dimension – indicates an
invalid operationalization and violates Hypothesis 1. Both constructs seem to measure
a very similar construct. Also, egalitarianism and fatalism do not show the expected
signicant negative relation (Hypothesis 2). Equally inadequate in this context are the
strong negative correlations between egalitarianism and hierarchy (Hypothesis 5) and
between egalitarianism and individualism (Hypothesis 3). Egalitarianism has one dimen-
sion in common with each of these cultural biases.
Cultural theory and risk perception
153
Fig. 2. Measurement model regarding the grid/group aspect.
2
The items in Dake’s British version and the items used here can be found in the appendix.

To summarize these results, it is concluded that central assumptions of the measure-
ment theory are violated and that Dake’s instruments, in their published form, are
inadequate measures of cultural theory.
This problem of nonconformity of correlations between cultural bias measures is
addressed in nearly every study that works quantitatively with cultural theory; yet no
consequences are drawn. Coughlin and Lockhart (1998, pp. 40ff) even describe the
special relational structure of the four types with a ‘sharing of ideological grounds’
between neighbouring types. On the level of measurement, they also draw no conse-
quences regarding the invalid measurement instruments
Without a clear prediction as to how the four types should correlate, the measure-
ment of cultural theory becomes arbitrary. Therefore theoretically deduced hypotheses
are proposed that can be tested empirically. As long as there is no commonly accepted
measurement theory (in the sense of testable hypotheses), the validity of the measures
remains questionable, and empirical studies are not based on solid ground.
In light of these considerations and results, a new instrument was constructed using
items from Dake’s scales and new items. Items were formulated that reect the
grid/group dimensions. Therefore each scale should be composed of a number of state-
ments addressing the grid and a number of items addressing the group dimension.
Examples for individualism are as follows:
I don’t join clubs of any kind (group).
My ideal profession would be an independent business (grid).
Thus each item is clearly identied a priori as a grid or a group item.
As argued above, a further peculiarity of the measurement is the similarity of neigh-
bouring types. A respondent who ts (for example) the fatalist type (which is next to
the individualist type on the group dimension) could agree with the group item but
154
Rippl
Table 1. Dake’s measurement instrument: scale intercorrelations in different samples.
Individualism
Hierarchy
Egalitarianism
Hierarchy
1. Dake (1991)
0.54**
2. Replication of Dake by Marris et al. (1996)
0.65**
3. Modied Scales (Marris et al.,1996)
0.53**
4. Replication in Germany (1997)
0.62**
Egalitarianism
–0.30**
–0.28**
–0.45**
–0.37**
–0.42**
–0.16
–0.44**
–0.30**
Fatalism
–
1
–
–
0.38**
0.28**
–0.12
0.25**
0.21
0.07
0.28**
0.21**
0.03
Source
: Dake, 1991; Marris et al., 1996 and own data.
1
Dake does not report the results of the fatalism scale.

would reject the grid item of the measurement for individualism. As formulated
by Couglin and Lockhart (1998), each type shares some ideological ground with its
neighbour.
The logic of the items thus formulated departs from traditional classical test theory.
This approach was adopted because it is more appropriate for the assumptions of
cultural theory. The construction of the cultural biases on the basis of two dimensions
(grid and group) implies that each cultural bias includes these two dimensions; there-
fore the classical test theory assumption of unidimensionality is not adequate in this
case. For this reason it was also necessary to use statistical procedures other than
classical test theory to test the reliability and the validity of the instruments.
The new measurement were tested instruments with a new data set from a sample of
475 German sociology students, collected in fall 1997 in Chemnitz and Hildesheim
(Rippl, 1999). Both are mid-sized cities, one in eastern Germany and one in the western
part of the country.
3
The data were collected during regular classes in which the profes-
sors were willing to take time for the research. The response rate in the classes that
participated was very high: Only 1% of the prospective respondents in the selected
classes refused to participate.
The nonprobability of the sample places a serious limitation on the generalizability
of the ndings. In this case, however, the sample seems acceptable because we do not
present distributions of variables. In this paper we focus primarily on theoretical and
measurement hypotheses that should hold true in any sample.
4
For the analyses structural equation modelling (SEM) employing LISREL 8.1.4 was
used. With SEM, it is possible to test a priori specied hypotheses about the under-
lying structure (Bollen, 1989). Hypotheses related to the measurement of latent
constructs and related to the analysis of structural relations between latent constructs
can be tested, controlling for random measurement error. Only SEM allows a simul-
taneous conrmatory factor analysis testing the conceptually proposed interrelations of
all four latent constructs (the four cultural biases). SEM allows double loadings. This
violates the classical test theory criterion of unidimensionality, but in the case of cultural
theory it must be viewed as an adequate reection of the measurement concept we
explicated above.
5
This measurement concept does not include the assumption of unidimensionality. On
the contrary, it postulates that each construct incorporates two dimensions (grid/group)
and that neighbouring types have one of the dimensions in common. Thus double load-
ings of several items in the present case reect the similarities between cultural types
that are adjacent in the typology. Weede and Jagodzinski (1977) point out that this
procedure is possible and permissible in conrmatory factor analysis, and that it is espe-
cially useful if one works with indicators that depend on different factors.
The following test strategy was used. The work commenced with 31 items and a
model tested that reproduces the correlation structure which is implied in Hypotheses
Cultural theory and risk perception
155
3
In the analyses, no signicant differences between the two samples were found.
4
CT imposes no limitations regarding to its application to any kind of population.
5
Therefore Cronbach’s alpha will not be present as a criterion for the quality of the scales; this criterion is impor-
tant only if scales are used that are based on sum totals or additive indices. Here full measurement instruments are
included in the estimation of structural relations between different constructs; the quality of the measurement instru-
ments will be considered in the estimation of structural parameters. In addition, factor loadings of the measurement
instruments are presented.
1–6. In this step 13 items were excluded for which the modication indices
6
proposed
loadings that did not conform to the measurement concept (Hypotheses 1–6), so that
a measurement model could be established with an acceptable model t that conforms
to the hypotheses. Hypothesis 7 was tested using the remaining 18 items. Because of
identication problems, it was not possible to estimate all seven hypotheses simulta-
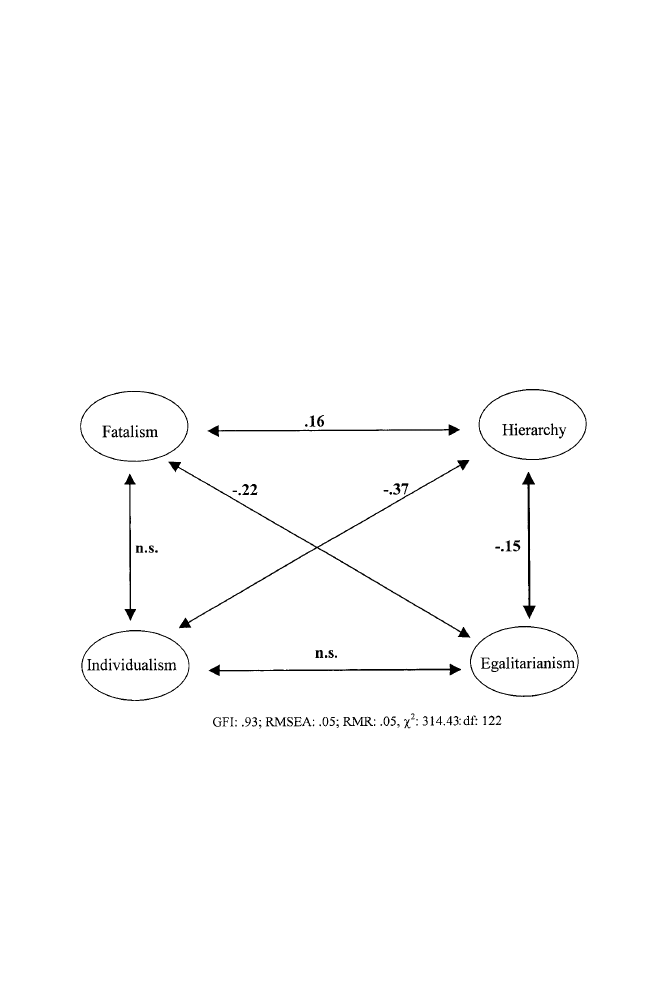
neously; therefore the analyses was divided into two parts. The test of Hypotheses 1–6
is presented in Fig. 3 and Table 2, the test of Hypothesis 7 in Table 3.
The analyses were based on correlation matrices produced by PRELIS2. In the
LISREL analyses the maximum-likelihood estimation method was used. First
Hypotheses 1–6 were tested; the results are presented in Fig. 3
7
and Table 2.
As Fig. 3 shows, the proposed pattern of relations between the four cultural biases
can be found (see Hypotheses 1–6). Although the relationships between egalitari-
anism/hierarchy and hierarchy/fatalism are slightly too strong, they are still within
acceptable boundaries. Obviously an overrepresentation of items reecting the grid
dimension is responsible for the slightly oversized correlations.
Furthermore, following the rationale of grid/group typology, each type (apart from its
special relations to the other types) includes both grid and group aspects (Hypothesis 7).
156
Rippl
6
Modication indices are used in LISREL for model modications. In the case of a strict theory testing strategy –
as done here – these indices indicate differences between model specication and empirical covariances.
7
It is tested if the specied model ts the empirical covariance matrix. One speaks of a model’s acceptable t when
the t indices reach the following values. The goodness-of-t index (GFI) should have a value > 0.90; the standard-
ized root mean square residual (standard RMR) should be 0.05; the root mean square error of approximation
(RMSEA) should be < 0.08 (see Jaccard and Wan, 1996, pp. 86ff). The value of chi-square should be as small as
possible, but it increases automatically with the sample size (see Bollen, 1989, pp. 263ff). Therefore it is suggested that
one use the relationship of chi-square to degrees of freedom (df) as the criterion. Different relationships are accepted
in the literature: Some authors demand a ratio of 2:1; others accept a ratio of 5:1 (see Bollen, 1989, pp. 278).
Fig. 3. Intercorrelations of the four cultural biases.

Cultural theory and risk perception
157
Table 2. A new measurement instrument for cultural biases – item wording and factor loadings.
Hierarchy Egalitarianism Individualism Fatalism
v6c
I would not participate in civil
0.22
–
–
0.48
action groups. The ones in power
do only allow what they like.
v6e Important questions for our
–
0.36
–
–
society should not be decided
by experts but by the people.
v6f
A person is better off if he or
–
–
–
0.65
she doesn’t trust anyone.
v6g In a family adults and children
–
0.43
–
–
should have the same inuence
in decisions.
v6h It is important to me that in the
–
0.55
–
–
case of important decisions at my
place of work everybody is asked.
v6j
We have to accept the limits in
0.41
–
–
0.17
our life if we want or not.
v6m There is no use in doing things
–
–
–
0.68
for other people – you only get it
in the neck in the long run.
v6n Firms and institutions should be
–
0.83
–
–
organized in a way that everybody
can inuence important decisions.
v7a It is important to preserve our
0.37
–
–
–
customs and cultural heritage.
v7b I don’t join clubs of any kind.
–
–
0.17
0.33
v7c
The freedom of the individual
–
0.25
0.23
–
should not be limited for reasons
for preventing crime.
v7g My ideal job would be an
–
0.33
–
–
independent business.
v7k The police should have the right
0.34
–
–
–
to listen to private phone calls
when investigating crime.
v7l
When I have problems I try to
–
–
0.54
–
solve them on my own.
v7n I prefer tasks where I work
–
–
0.47
–
something out on my own.
v7o Order is a probably unpopular
0.65
–
–
–
but a important virtue.
V7p I prefer clear instruction from
0.44
–
–
–
my superiors about what to do.
v7q An intact family is the basis of
0.54
–
–
–
a functioning society.
p
< 0.01; the presented analyses are based on the German version of this items.

This means that all of the items should possess variation because of their commonality
in one type and their differences in the aspects that represent grid and group. To address
the assumption that each cultural bias contains both the grid and the group aspect, how
far each item expresses the culture-specic attitude of one of these two basic dimensions
should be tested. This further test criterion makes the measurement theory more strin-
gent and falsication more probable.
To test these assumptions, again conrmatory factor analysis was conducted, in this
case, for each cultural bias separately. The items were assigned a priori to the grid or
the group dimension. Only the items that had been left in the previous step of analysis
were included, and the pattern given in Table 3 was found.
For hierarchy and fatalism constructs consisting of both grid and group items have
been balanced with signicant factor loadings. For individualism there is one grid item;
item v7b ts fatalism better. Egalitarianism is measured only by grid items. Thus a clear
identication of the items in regard to the grid or the group dimension is found. Because
of the exclusion of items in the rst step of the analysis, which concentrates on the
correlation pattern between the four cultural biases, the scales for individualism and
especially for egalitarianism are not yet balanced for both dimensions. This solution
regarding the correlation pattern was accepted as the more important aspect.
Nevertheless, in future research, grid items should be added to the scale for individu-
alism, and group items to the scale for egalitarianism.
For a further validation of the measurement concept in the sense of construct validity,
the theory was scanned for further hypotheses about relations of the four cultural biases
to other concepts. Cultural biases are dened as a pattern of attitudes and values
concerning the functioning of society and environment (Dake, 1992, p. 62; Thompson
et al.
, 1990, pp. 29ff); therefore they should be connected to attitudes that deal with
these aspects.
Thompson et al. (1990) argue that the four cultural biases are connected to special
myths about the functioning of nature. They distinguish four such myths. In nature
benign
, the world is forgiving and always nds its way back to an equilibrium. Essentially
this laissez-faire attitude should be found in individualists. Nature ephemeral is the oppo-
site: small changes made by human beings could lead to a collapse. This myth will be
cherished primarily by egalitarians. In nature tolerant, nature forgives events to a certain
point; experts are needed to show the boundaries. This should be the favourite myth
of hierarchically oriented persons. Nature capricious is the myth of a random world in
which human beings, even experts, can control almost nothing. This view will be held
by fatalists (see Thompson, 1990, pp. 26ff). A German translation of the items employed
by Marris et al. (1996) was used.
In the same validation logic – seeing cultural biases as ideas about the functioning
of the world – a so-called fairness scale was included. This scale measures how far indi-
viduals think the principle of fairness should dominate public decisions and how far
the public should be involved in decisions about global risk taking (item 1). Another
item consists of the question ‘Is it acceptable to decide about risks that could endanger
further generations?’ (item 2). Here reference is made to the idea of cultural theory
whereby (for example) the perception of risk and the perception of other social orien-
tations are used as metaphors (Marris et al., 1996, pp. 11) for a view of society, which
institutions are trusted, and what is understood to be meant by the terms fairness and
justice
.
158
Rippl

The relations between these myths, the fairness scale, and cultural bias measures are
shown in Table 4. Again a SEM analyses was conducted using the specications
described above so that the proposed pattern of intercorrelations between the four
cultural biases is part of each tested model. All correlations were tested simultaneously.
Acceptable t indices were found for this model: chi-square: 720, 05; df: 307; GFI: 0.90;
RMSEA: 0.05; RMR: 0.05.
The empirically discovered relationships t closely with previous assumptions. Only
in the case of individualism was no clearly corresponding myth about nature found.
Cultural theory and risk perception
159
Table 3. Conrmatory factor analyses of grid/group dimensions for each cultural bias.
grid
group
Hierarchy: x
2
: 41,95; df: 13; RMSEA: 0.07; RMR: 0.04; GFI: 0.98
v6c
I would not participate in civil action groups. The ones in
0.38
–
power do only allow what they like.
v6j
We have to accept the limits in our life if we want or not.
0.56
–
v7a It is important to preserve our customs and cultural heritage.
–
0.42
v7k The police should have the right to listen to private phone
0.44
–
calls when investigating crime.
v7o Order is a probably unpopular but a important virtue.
–
0.70
v7p I prefer clear instruction from my superiors about what to do.
0.40
–
v7q An intact family is the basis of a functioning society.
–
0.53
Egalitarianism: x
2
: 9,7; df: 5; RMSEA: 0.04; RMR: 0.03; GFI: 0.96
v6e Important questions for our society should not be decided by
0.38
–
experts but by the people.
v6g In a family adults and children should have the same inuence
0.46
–
in decisions.
v6h It is important to me that in the case of important decisions at
0.57
–
my place of work everybody is asked.
v6n Firms and institutions should be organized in a way that
0.78
–
everybody can inuence important decisions.
v7c
The freedom of the individual should not be limited for reasons
0.28
–
for preventing crime.
Individualism: x
2
4,4; df: 5; RMSEA: 0.00; RMR: 0.02; GFI: 1.00
v7b I don’t join clubs of any kind.
–
0.08
v7c
The freedom of the individual should not be limited for reasons
1.00
–
for preventing crime.
v7g My ideal job would be an independent business.
–
0.40
v7l
When I have problems I try to solve them on my own.
–
0.43
v7n I prefer tasks where I work something out on my own.
–
0.68
Fatalism: x
2
: 15,5; df: 4; RMSEA: 0.07; RMR: 0.03; GFI: 0.99
v6c
I would not participate in civil action groups. The ones in power
0.83
–
do only allow what they like.
v6f
A person is better off if he or she doesn’t trust anyone
–
0.65
v6j
We have to accept the limits in our life if we want or not.
0.33
–
v6m There is no use in doing things for other people – you only get
–
0.69
it in the neck in the long run.
v7b I don’t join clubs of any kind.
–
0.31

In a further step, a variable was taken that reects behavioural rather than cognitive
aspects as a criterion for validation. Information about memberships in certain institu-
tionalized groups was used that can be viewed as manifestations of the social relations
aspect. To obtain this information, the respondents were asked about memberships in any
kind of clubs, associations, unions, and the like.
8
According to cultural theory, individuals
with a low score on the group dimension should participate in such groups to a lesser
degree than others. The results show that individualists (–0.46; p < 0.01) and fatalists
(–0.10; p < 0.05) tend to reject such memberships, as proposed by the theory. For egali-
tarians and persons with hierarchic orientations we found nonsignicant correlations.
In a nal step the four central assumptions of cultural theory about the connection
of cultural biases to perception of risk were analysed (Douglas and Wildavsky, 1982;
Rayner, 1992; Thompson et al., 1990). As stated above, the perception of risks is socially
framed in the light of cultural theory.
For our analyses four different types of risks have been taken into account . Ecological
risks were measured as a latent variable encompassing various aspects: ozone depletion,
nuclear power, genetic engineering, shortage of natural resources.
9
Dangers to the social
order also were measured as latent construct including crime, demonstrations, conicts
between social groups, and civil disobedience.
10
Becoming infected with AIDS was
measured by only one indicator, as was unemployment. The cultural biases were spec-
ied as independent variables, the risks as dependent variables.
In the analyses two models were tested. In one model, ecological risks and dangers
to the social order were the dependent variables; in the other, becoming infected with
AIDS and the personal risk of unemployment were the dependent variables. The gamma
coefcients are presented in Table 5.
For the model that includes risks to ecology and social order as dependent constructs,
an acceptable t was found: chi-square, 629,33; df, 275; GFI, .91; RMSEA, .05; RMR,
0.05. The perception of ecological risks and risks to the social order correlated at 0.36.
AIDS and unemployment also were tested simultaneously, and here an acceptable
model t was also found: chi-square, 354, 33; df, 150; GFI, 0.93; RMSEA, 0.05; RMR,
0.05. The perception of the risk of being infected with AIDS and the personal risk of
becoming unemployed correlated at 0.33.
160
Rippl
Table 4. Myths of nature and cultural biases – phi-coefcients.
Hierarchy
Egalitarianism
Individualism
Fatalism
Nature tolerant
0.34
–0.21
–
–
Nature ephemeral
–
0.43
–
–
Nature benign
–
–
–
–
Nature capricious
–
–
–0.26
0.70
Fairness
–
0.47
–
–
* In cells without coefcient we found no signicant correlations; p < 0.01
8
The variable regarding memberships is coded as a dummy variable: yes (2) or no (1).
9
These four aspects loaded in the following pattern on the factor ‘ecological risks’: ozone depletion 0.47, nuclear
power 0.76, genetic engineering 0.56, shortness of natural resources 0.51.
10
These four aspects loaded in the following pattern on the factor ‘social order’: crime 0.53, demonstrations 0.74,
conicts between social groups 0.47 and civil disobedience 0.79.

Regarding ecological risks, the assumptions of cultural theory are conrmed. Egali-
tarians tend to show a higher perception of risk than all others; persons with hierarchic
orientations show the lowest perception. For disturbance of the social order, persons with
hierarchic orientations were found to express the strongest perception of risk. Fatalists
show a higher risk perception with regard to individual dangers such as personal unem-
ployment and becoming infected with AIDS; this result is also found for egalitarians.
Individualists show the lowest level of perception for all types of risks. This nding
possibly implies strong self-condence and perception of individual control.
11
7. Conclusion
In this article two questions have been addressed. First, is cultural theory testable by
individual-level data that emerge from quantitative studies? Second, are the measure-
ment instruments that are used in this quantitative paradigm valid?
The rst question is answered on a theoretical level. An individual-level measure-
ment is not a measure of culture but a measure of processes that are connected to
culture. Thus the instruments discussed here present ‘only’ indirect measures of cultural
types, but they are connected to a cultural level. Relecting this ‘limitation’ it is possible
to measure culture with individual-level data. To test this idea empirically it should be
possible to show their correlations to structural variables such as family structure or
preferred social contexts.
The second question must be answered empirically. In this article it is argued for
the necessity to formulate a measurement theory to establish a valid measurement of
CT. Furthermore, a strategy for developing a measurement instrument is demonstrated.
To test the validity of the instrument a clear measurement theory was explicated
from cultural theory. The usefulness of structural equation modelling (SEM) when it
is necessary to work with a complex measurement concept is shown, as in this case. As
a result, it is concluded that the measurement instruments presented by Dake (1990,
1991) have been improved. In reference to the theoretically proposed interrelations of
the four cultural biases, a model is developed that is consistent with these assumptions.
Also regarding the approaches to validate instruments acceptable results were found.
In this sense the approach is a contribution to better measurement: it overcomes the
restrictions and contradictions of a more or less arbitrary use of diverse measurement
instruments in survey research on cultural theory.
Using the approach presented, it is possible to refute the criticism regarding the
ability to measure the concepts of cultural theory quantitatively. The overall ‘poor’
Cultural theory and risk perception
161
Table 5. Cultural biases and risk perception – gamma-coefcients.
Ecology
Social order
Unemployment
Aids
hierarchy
–0.29
0.27
n.s.
n.s.
egalitarianism
0.29
n.s.
0.23
0.16
individualism
n.s.
–0.26
–0.14
–0.14
fatalism
n.s.
n.s.
0.22
0.12
n.s. Not signicant, all other coefcients are signicant p < 0.01
11
Further analyses especially the relation to coping styles are documented in Rippl (1999).

power of cultural biases for explaining risk perception (Sjöberg, 1995) was not improved
by using more valid instruments. Nevertheless, the results of this study prove that a
theoretically conforming measurement of cultural biases is possible.
In respect to deductive theory development, further work on this theory would be
fruitful even when the explanatory power of inductively discovered variables is greater
(such as the variables used in the psychometric approach). The argument of explana-
tory power is relative regarding variables that are not embedded in a broader theory;
such variables hardly increase the understanding of complex social contexts. In contrast
to the psychometric approach, cultural theory uses very basic theoretical concepts, such
as values, to explain a special phenomenon (risk perception). In this sense, the argu-
ment imputing poor explanatory power fails.
12
Acknowledgement
The research for this paper was supported by Grant DFG: RI 858/1-1 from the German
Research Council. For helpful comments I would like to thank Klaus Boehnke, Christian
Seipel and Claudia Stromberg.
References
Bollen, K.A. (1989) Structural Equations With Latent Variables, New York: Wiley.
Coughlin, R.M. and Lockhart, C. (1998) Grid-group theory and political ideology. A considera-
tion of their relative strengths and weaknesses for explaining the structure of mass belief
systems, Journal of Theoretical Politics
10, 33–58.
Dake, K. (1990) Technology on trial: Orienting dispositions toward environmental and health
hazards. Doctoral dissertation. University of California at Berkeley.
Dake, K. (1991) Orienting dispositions in the perception of risk: an analysis of contemporary
worldviews and cultural biases, Journal of Cross-Cultural Psychology, Special Issue on Risk
and Culture
22, 61–82.
Dake, K. (1992) Myths of nature – culture and the social construction of risk, Journal of Social
Issues
4, 21–37.
Douglas, M. (1997) The depoliticization of risk, in R. J. Ellis and M. Thompson (eds) Culture
Matters: Essays in Honor of Aaron Wildavsky
. Boulder, CO: Westview Press.
Douglas, M. and Wildavsky, A. (1982) Risk and Culture: An Essay on Selection of Technological
and Environmental Dangers
, Berkeley: California University Press.
Ellis, R.J. and Thompson, F. (1997) Culture and the environment in the Pacic Northwest,
American Political Science Review
91, 885–97.
Flynn, J., Slovic, P.and Mertz, C.K. (1994) Gender, Race, and Perception of Environmental Health
Risks.
Grendstad, G. and Selle, P. (1997) Cultural Theory, postmaterialism and environmental attitudes,
in R.J. Ellis and M. Thompson (eds) Culture Matters: Essays in Honor of Aaron Wildavsky.
Boulder, CO: Westview Press, pp. 151–68.
Gross, R. and Rayner, S. (1985) Measuring Culture. A Paradigm for the Analysis of Social
Organization, New York: Columbia University Press.
Hofstede, G. (1980) Culture’s Consequences: International Differences in Work-related Values,
Beverly Hills, CA: Sage.
Jaccard, J. and Wan, C. K. (1996) LISREL Approaches to Interaction Effects in Multiple Regression,
162
Rippl
12
For a similar argument, see Marris et al. (1996); Ellis and Thompson (1997).

Sage University Paper series on Quantitative Applications in the Social Sciences, series
no. 07–114. Thousand Oaks, CA: Sage.
Johnson, B.B. and Covello, V.T. (1987) The Social and Cultural Construction of Risk: Essays on
Risk Selection and Perception
, Dordrecht: Reidel Publishing.
Kohn, M. (1977) Class and Conformity. A Study in Values, Chicago: Chicago University Press.
Marris, C., Langford, I. and O’Riordan, T. (1996) Integrating Sociological and Psychological
Approaches to Public Perceptions of Environmental Risks: Detailed Results from a Question-
naire Survey
, Norwich: University of East Anglia.
Marris, C., Langford, I. and O’Riordan, T. (1998) A quantitative test of the cultural theory of
risk perceptions: comparisons with the psychometric paradigm, Risk Analysis
18(5), 635–48.
Nauck, B. and Schönpug, U. (1997) Familien in verschiedenen Kulturen, in B. Nauck and
U. Schönpug (eds) Familien in verschiedenen Kulturen, pp. 1–21. Stuttgart: Enke.
Palmer, C.G.S. (1996) Risk perception: an empirical study of the relationship between worldview
and the risk construct, Risk Analysis
5, 717–23.
Peters, E. and Slovic, P. (1996) The role of affect and worldviews as orienting dispositions in the
perception and acceptance of nuclear power, Journal of Applied Social Psychology
5, 1427–53.
Rayner, S. (1992) Cultural theory and risk analysis, in S. Krimsky and D. Golding (eds) Social
Theories of Risk
, pp. 83–115. Westport: Praeger Publishers.
Rippl, S. (1999) Umweltrisiken als Stressoren. Stresserleben und die Bedeutung geteilter Werthal-
tungen im jungen Erwachsenenalter, Zeitschrift für Soziologie der Erziehung und Sozialisation
19, 354–68.
Rohrmann, B. (1994) Risk perception of different societal groups: Australian ndings and cross
national comparisons, Australian Journal of Psychology
46(3), 150–63.
Schnell, R., Hill, P. and Esser, E. (1989) Methoden der Empirischen Sozialforschung, München
and Wien: Oldenbourg.
Schwartz, S. and Ros, M. (1995) Values in the West: a theoretical and empirical challenge to the
individualism-collectivism cultural dimension, World Psychology
2, 91–122.
Slovic, P. (1987) Perception of risk, Science
236, 280–85.
Slovic, P. (1992) Perception of risk: reections on the psychometric paradigm, in S. Krimsky and
D. Golding (eds) Social Theories of Risk, pp. 117–52. Westport: Praeger Publishers.
Slovic, P., Fischhoff, B. and Lichtenstein, S. (1980) Facts and fears: understanding perceived risk,
in R. C. Schwing and W. A. Albers, Jr. (eds) Societal Risk Assessment; How Safe is Safe
Enough
, pp. 181–214. New York-London: Plenum Press.
Sjöberg, L. (1995) Explaining risk perception: an empirical and quantitative evaluation of cultural
theory, Rhizikon: Risk Research Reports, No. 22, Center of Risk Research.
Stern, P.C., Dietz, T. and Guagnano, G.A. (1995) The new ecological paradigm in social-
psychology context, Environment and Behavior
27, 723–43.
Thompson, M., Ellis, R., Wildavsky, A. (1990) Cultural Theory. Boulder: Westview Press.
Vaughan, E. and Nordenstam, B. (1991) The perception of environmental risks among ethnically
diverse groups in the United States, in G. Svetkovich (ed.) Journal of Cross-Cultural
Psychology, Special Issue on Risk and Culture
22, 11–28.
Weede, E. and Jagodzinski, W. (1977) Einführung in die konrmatorische Faktorenanalyse,
Zeitschrift für Soziologie
3, 315–33.
Wildavsky, A. and Dake, K. (1990) Theories of risk perception: who fears what and why?
Daedalus
4, 41–60.
Wildavsky, A. (1993) Vergleichende Untersuchung zur Risikowahrnehmung: ein Anfang, in
Bayerische Rück (ed.) Risiko ist ein Konstrukt, pp. 191–211. München: Bayerische Rück.
Cultural theory and risk perception
163

Appendix
CULTURAL BIAS ITEMS USED BY DAKE
Hierarchy (15 items)
I think there should be more discipline in the youth of today. +
I would support the introduction of compulsory National Service. +
I am more strict than most people about what is right and wrong.
We should have stronger armed forces than we do now. +
The police should have the right to listen to private phone calls when investigating
crime.+
Those in power often withhold information about things which are harmful to us.
One of the problems with people is that they challenge authority too often. +
It is important to preserve our customs and heritage. +
I think it is important to carry on family traditions. +
In my household, family members have their own places at the dinner table.
I always sort out clothes into separate categories before washing. +
I value regular routines highly. +
I think being on time is important. +
My time-tabling of meals is haphazard. (score reversed)
I like to plan carefully so that nancial risks are not taken. +
Individualism (9 items)
In a fair system people with more ability should earn more. +
A free society can only exist by giving companies the opportunity to prosper. +
If a person has the get-up-and-go to acquire wealth, that person should have the right
to enjoy it. +
It is just as well that life tends to sort out those who try harder from those who don’t. +
Continued economic growth is the answer to improved quality of life. +
This country would be better off if we didn’t worry so much about how equal people
are. +
Making money is the main reason for hard work.
I don’t join clubs of any kind. (score reversed)
I tend to be sceptical of health food fads.
Egalitarianism (11 items)
If people in this country were treated more equally we would have fewer problems.
The government should make sure everyone has a good standard of living. +
Those who get ahead should be taxed more to support the less fortunate. +
I would support a tax change that made people with large incomes pay more. +
The world could be a more peaceful place if its wealth were divided more equally
among nations. +
Social Security tends to stop people from trying harder to get on. (score reversed)
Racial discrimination is a very serious problem in our society.
What this country needs is a ‘fairness revolution’ to make the distribution of goods
more equal. +
Most of the meals I eat are vegetarian.
164
Rippl

Health requirements are very important in my choice of foods.
I prefer simple and unprocessed foods.
Fatalism (11 items)
There is no use in doing things for other people – you only get it in the neck in the
long run. +
Cooperating with others rarely works.
The future is too uncertain for a person to make serious plans. +
I have often been treated unfairly.
A person is better off if he or she doesn’t trust anyone. +
I don’t worry about politics because I can’t inuence things very much. +
Most people make friends only because friends are useful to them.
I feel that life is like a lottery. +
Even if you work hard you never know if that will help you do better. +
It seems to me that, whoever you vote for, things go on pretty much the same. +
I have few nancial investments.
Only items with ‘+’ worked well in Germany.
Cultural theory and risk perception
165

Wyszukiwarka
Podobne podstrony:
6 Kulturowa teoria ryzyka ppt
Teoria kultury - Socjologiczna teoria kultury, Kulturoznawstwo, Teoria kultury - notatki z wykładów
Nycz Antropologia literatury kulturowa teoria literatury poetyka doświadczenia
Teoria ryzyka - zadania, STUDIA
Teoria ryzyka
Teoria ryzyka popr
Anusiewicz J Kulturowa teoria języka
KULTUROWA TEORIA LITERATURY, LITERATUROZNAWSTWO, TEORIA LITERATURY - poetyka opisowa, poetyka histor
kulturowa teoria literatury (1), filologia polska - metodologia badań humanistycznych
Teoria ryzyka Dodatek E
KULTUROWA TEORIA LITERATURY GŁÓWNE POJĘCIA I PROBLEMY OPRACOWANIE ZBIOROWE
Pytania egzaminacyjne Milosz ekonomia teoria ryzyka
Pytania, kulturoznawstwo - teoria kultury, filozofia kultury, gender
teoria ryzyka finansowego2
Kulturowa teoria literatury Główne pojęcia i problemy
więcej podobnych podstron