
1
INTRODUCTION
There is a move world wide to remote or telemetric
monitoring of mine atmosphere conditions. Robust,
suitable and as required, intrinsically safe instru-
ments are available for measurement of, for instance,
gas concentrations, air velocity and air pressure.
These are often tied to extensive mine monitoring
and communication systems.
One approach to establishing air quantity through
a ventilation branch is through measurement of dif-
ferential pressure across an opening or regulator.
Mathematical relationships are available to relate
(with some qualification) pressure drop and quantity
through a regulator orifice placed symmetrically in a
round flow conduit. However these can, at best, only
be used to approximate mine regulator behavior due
to:
The irregularity of mine regulators in shape and
symmetry and their positioning in normally
roughly square or rectangular mine airways,
The construction of the mine regulator opening
which may result from, for instance, the opera-
tion of louvres, a sliding door, window or cur-
tain or placement of drop boards, and
Uncontrolled air leakage through the regulator
or adjacent bulkhead.
The study describes efforts to characterize or
mathematically model regulators. It then describes
how this information is used in the development of a
computerized monitoring and simulation system to
provide immediate or real time information on each
branch within an underground mine ventilation net-
work through linking of sensors to the ventilation
network simulation software. Software has been de-
veloped to link real time information generated by
mine ventilation monitoring sensors into the network
program to undertake network simulations and allow
interpretation of key system data and operational
changes.
The outcome of the project is an online system
which can report changes in the mine ventilation
system, allow causes of changes to be isolated and
rectified and improve balancing of available air
throughout the mine, It is envisaged that in time the
real time model will be an integral part of a real time
mine wide planning, monitoring and control soft-
ware platform and will be updated in real time along
with the mine plan.
The main steps involved in examination and
modeling of regulators, software modification and
considerable mine site testing and optimizing activi-
ties are described.
2
THEORY OF REGULATORS
A regulator is an artificial resistance (in the form of
shock loss) introduced into an airway to control air-
flow.
Measurement of airflow through regulators and real time integrated
monitoring
A. D. S. Gillies, H. W. Wu, T. I. Mayes & A. Halim
University of Queensland, Brisbane, Australia
Published as: A.D.S. Gillies, H.W. Wu, T.I. Mayes and A. Halim, Measurement of Airflow through Regula-
tors and Real Time Integrated Monitoring, Mine Ventilation - Proceedings North American
Ninth US Mine Ventilation Symposium, De Souza (Ed), Balkema, The Netherlands, 301-308
June 2002.
ABSTRACT: The mathematical modeling of airflow through operating mine regulators is discussed. Results
are used in the development of a computerized monitoring and simulation system to provide immediate or
real time data on air behavior within each branch within an underground mine ventilation network through
linking of sensors to the ventilation network simulation software. Software has been developed to link real
time information generated by mine ventilation monitoring sensors into the network program to undertake
network simulations and allow interpretation of key system data and operational changes. The outcome of the
project is an online system which can report changes in the mine ventilation system, allow causes of changes
to be isolated and rectified, improve balancing of available air throughout the mine and dispense with much of
the labor used for underground ventilation measurement. The main work activities involved in the research
program have involved examination and modeling of regulators, software modification and considerable mine
site testing and optimizing activities.
2.1
Derivation of regulator equation
A regulator can be described as a large thin plate in-
stalled in a fluid conduit with an orifice. When a dif-
ference in pressure exists between the two sides
fluid flows in the pattern shown in Figure 1. On the
low pressure side the fluid issues as a converging jet
in line with the centre of the orifice. The jet con-
verges to its smallest area at a distance of about half
the orifice diameter (Le Roux, 1979). This area is
called the “vena contracta” (A
c
at Fig. 1). The ratio
between vena contracta and orifice area is the “coef-
ficient of contraction”, C
c
(A
c
/A
r
at Fig. 1).
Figure 1. Airflow pattern through an orifice (after Burrows et
al, 1989).
McElroy (1935) found that the C
c
value is a relation
between the ratio of the orifice and airway cross sec-
tional area, N (A
r
/A at Fig. 1), and Z, which is an
empirical factor designated as the contraction factor,
which is expressed as:
(1)
Values of Z vary according to the edge shape of
the orifice. Since most regulators are square edged, a
Z value of 2.5 is most commonly used in calculating
C
c
. Bernoulli’s equation can be applied to both sides
of the orifice as shown in Figure 1 in order to calcu-
late the velocity and hence the airflow quantity.
A correction must be made for the contraction of
the jet at the vena contracta. Since the orifice is lar-
ger than the vena contracta, orifice velocity is lower
than in the vena contracta. The velocity equated
based on Bernoulli’s equations is the velocity at the
vena contracta. Therefore, the velocity at the orifice
can be obtained with the following equation:
2
2
1
1
2
N
P
C
V
s
c
−
∆
=
ρ
(2)
where C
c
is the coefficient of contraction, as de-
scribed before. Since airflow quantity through regu-
lator
r
A
V
Q
2
=
, it follows that:
r
s
c
A
N
P
C
Q
2
1
1
2
−
∆
=
ρ
(3)
where A
r
is orifice opening area in m
2
.
3
FIELD TESTS OF REGULATORS
Field tests were conducted at the University of
Queensland Experimental Mine (UQEM) to verify
air behavior in flow through regulators. Parameters
measured were airflow quantity and pressure drop
across the regulator. From pressure drop measure-
ments, airflow quantity through the regulators can be
calculated with Equation 3. Results of this calcula-
tion can be compared with measured values and the
reasons for significant differences investigated.
3.1
UQEM tests
The UQEM regulator is the drop board type. Results
of this test are summarized in Table 1. Based on
∆P
s
measured, predicted airflow quantity through the
regulator, Q, was then calculated with Equation 3.
Values of Q were compared with the measured
quantity, Q
m,
as set down in Table 1 and Figure 2. It
can be seen from both the table and figure that the
measured quantity is consistently larger than pre-
dicted. There are several possible reasons as follows.
Table 1. Results of UQEM test.
Condition
∆P
s
Pa
Q
m
m
3
/s
Q
m
3
/s
Difference
%
Fully closed
1 board off
2 boards off
3 boards off
4 boards off
5 boards off
6 boards off
7 boards off
8 boards off
9 boards off
10 boards off
11 boards off
12 boards off
13 boards off
14 boards off
163
125
96
73
58
47
36
30
25
21
19
15
12
10
7
2.05
2.53
3.02
3.33
3.35
3.46
3.62
3.75
3.82
3.85
3.86
4.00
3.90
3.85
3.89
0.00
0.82
1.44
1.89
2.27
2.58
2.74
2.96
3.14
3.31
3.58
3.59
3.61
3.69
3.46
n/a
209.8
109.6
76.0
47.7
34.3
32.0
26.6
21.5
16.3
7.8
11.2
8.1
4.2
12.4
Figure 2. Comparison between measured and predicted quan-
tity.
A
V
1
P
1
A
r
V
2
P
2
A
c
0.00
0.50
1.00
1.50
2.00
2.50
3.00
3.50
4.00
4.50
0
5
10
15
Number of boards removed
A
ir
fl
o
w
q
u
an
ti
ty
(
m
3
/s
)
Measured quantity
Predicted quantity
2
2
1
N
ZN
Z
C
c
+
−
=
3.1.1
Error during measurement
It is common for operator induced errors to occur
during mine drift measurement especially in small
cross sectional airways. The authors experienced dif-
ficulty when measuring air velocity by continuous
traversing because of limited space to move freely.
Also, an author’s body provided a significant obsta-
cle to the airflow.
3.1.2
Non-symmetrical condition and shape
Equation 3 was derived based on a circular orifice in
the middle of a regulator plate. The UQEM regulator
opening is located on the upper side and opening is
rectangular leading to distorted air patterns.
3.1.3
Leakage
Leakage occurs due to the presence of gaps between
boards and between the regulator frame and the air-
way walls. The leakage quantity depends on regula-
tor construction and the differential pressure drop
across the opening.
An approach is proposed to model the difference
as air leakage since measurement error and the non-
symmetrical condition were difficult to quantify.
Therefore, the airflow quantity through the regulator
can be expressed as:
l
r
s
c
Q
A
N
P
C
Q
+
−
∆
=
2
1
1
2
ρ
(4)
where Q
l
is the leakage quantity. Thus Q
l
needs to be
quantified. An approach to this modelling is devel-
oped.
3.2
Relationship between airflow quantity and
regulator resistance
The regulator can be treated as a set of two parallel
airways namely:
1.
The regulator opening and
2.
The leakage paths, that is passages through and
around the regulator other than the regulator ori-
fice itself.
This can be illustrated as in Figure 3.
Figure 3. Airflow paths in regulator.
Therefore, the total resistance of regulator (R
t
) can
be modeled to consist of the regulator opening resis-
tance (R
o
) and the leakage path resistance (R
l
).
When the regulator is in a fully closed condition, the
air flows through the leakage path only.
Airflow quantity through the regulator opening is
calculated using the basic square law (
∆P
s
=RQ
2
).
Based on this equation and Equation 3, the relation-
ship between R
o
and A
r
can be established as fol-
lows.
=
∆
o
s
R
P
r
s
c
A
N
P
C
2
1
1
2
−
∆
ρ
r
s
c
o
s
A
N
P
C
R
P
2
1
1
1
2
1
−
∆
=
∆
ρ
2
)
1
(
1
2
N
A
C
R
r
c
o
−
=
ρ
2
2
2
2
)
1
(
r
c
o
A
C
N
R
−
=
ρ
,
Since
A
A
N
r
=
, thus
2
2
2
2
2
2
A
C
A
C
R
c
r
c
o
ρ
ρ
−
=
)
1
1
(
2
2
2
2
A
A
C
R
r
c
o
−
=
ρ
(5)
where A is the airway cross sectional area. Since this
equation does not take leakage into account, the ac-
tual regulator resistance will be different to the one
calculated by Equation 5. Thus actual resistance is
R
t
. R
t
is made up of R
o
and R
l
in parallel configura-
tion and so the relationship between them can be es-
tablished. Since R
o
has been quantified by Equation
5, R
l
has to be quantified also to allow R
t
to be cal-
culated. Thus based on the measured pressure drop,
the airflow quantity through the regulator can be de-
termined.
Table 2. UQEM regulator resistances.
Condition
R
t
Ns
2
/m
8
R
o
Ns
2
/m
8
R
l
Ns
2
/m
8
A
r
m
2
Fully closed
1 board off
2 boards off
3 boards off
4 boards off
5 boards off
6 boards off
7 boards off
8 boards off
9 boards off
10 boards off
11 boards off
12 boards off
13 boards off
14 boards off
38.65
19.46
10.56
6.58
5.17
3.93
2.75
2.13
1.71
1.42
1.28
0.94
0.79
0.68
0.46
∞
186.77
46.39
20.39
11.29
7.08
4.80
3.42
2.53
1.92
1.48
1.16
0.92
0.73
0.59
38.65
42.43
38.61
35.31
49.52
60.21
46.76
48.32
54.71
72.25
246.09
91.92
140.23
415.53
37.87
0
0.09
0.18
0.27
0.36
0.45
0.54
0.63
0.72
0.81
0.90
0.98
1.07
1.16
1.25
To do this, R
o
is first calculated using Equation 5,
and then the total resistance is calculated using the
square law based on the measured pressure drop and
the measured airflow quantity. R
l
then can be calcu-
Regulator opening
Leakage path
lated using the parallel airways resistance relation-
ship. Table 2 shows the calculated resistance of the
regulator tested at the UQEM.
To quantify R
l
a plot against regulator opening
area was made, as shown in Figure 4. It was found
that
Ar
l
e
R
1631
.
1
734
.
32
=
. Therefore, the total regula-
tor resistance, R
t
could be calculated from:
l
o
t
R
R
R
1
1
1
+
=
(6)
)
1
1
(
2
2
2
2
A
A
C
R
r
c
o
−
=
ρ
(7)
Ar
l
e
R
1631
.
1
734
.
32
=
(8)
Therefore, the total regulator resistance, R
t
could be
calculated. The airflow quantity was then re-
calculated using the square law based on the new R
t
.
Results of this was then compared with measured
values, Q
m
, as summarized in Table 3 and Figure 5.
Figure 4. Quantification of resistance for leakage paths.
Table 3. Comparison between measured and new predicted
quantity.
Condition
Q
m
m
3
/s
New R
t
Ns
2
/m
8
New Q
m
3
/s
Difference
%
Fully closed
1 board off
2 boards off
3 boards off
4 boards off
5 boards off
6 boards off
7 boards off
8 boards off
9 boards off
10 boards off
11 boards off
12 boards off
13 boards off
14 boards off
2.05
2.53
3.02
3.33
3.35
3.46
3.62
3.75
3.82
3.85
3.86
4.00
3.90
3.85
3.89
32.73
17.49
10.80
7.27
5.18
3.84
2.93
2.28
1.81
1.45
1.17
0.95
0.78
0.63
0.52
2.23
2.67
2.98
3.17
3.35
3.50
3.51
3.63
3.72
3.81
4.03
3.97
3.93
3.97
3.68
-8.0
-5.2
1.1
5.1
0.0
-1.1
3.1
3.4
2.7
1.0
-4.3
0.6
-0.8
-3.1
5.7
It can be seen from both the table and the graph that
the difference is at all times less than 10 percent
which is well within practical underground meas-
urement tolerance and therefore this new equation is
sufficiently reliable to be employed for further
analysis.
The relationship between the regulator opening
area and total resistance can be derived as shown in
Figure 6. Based on this, pressure and airflow quan-
tity relationships (of the form P=RQ
2
) can be calcu-
lated from mine regulator impedance characteristic
curves. These can be drawn for different mine con-
figurations as shown in Figure 7. The three curves
shown illustrate relationships from Table 3 for one,
three and five boards removed from the regulator.
Figure 5. Comparison between measured and new predicted
quantity.
Figure 6. Relationship between new total resistance and regula-
tor opening area.
Figure 7. UQEM regulator characteristic curves.
0.00
2.00
4.00
0
5
10
15
No. of board rem oved
A
ir
fl
ow
q
u
an
ti
ty
(
m
3
/s
)
Measured quantity
Predicted quantity
R
t
= 0.9998A
r
-1.3746
R
2
= 0.9567
0.00
5.00
10.00
15.00
20.00
25.00
30.00
0.00
0.50
1.00
1.50
Regulator opening area (m
2
)
T
o
ta
l r
e
s
is
ta
n
ce
(
N
s
2
/m
8
)
R
l
= 32.734e
1.1631Ar
R
2
= 0.3993
0.00
50.00
100.00
150.00
200.00
250.00
300.00
350.00
400.00
450.00
0
0.5
1
1.5
Regulator opening area (m
2
)
P = -5.4536Q
2
- 48.117Q + 284.74
P = 17.490Q
2
P = 7.27Q
2
P = 3.84Q
2
0
20
40
60
80
100
120
140
160
0.00
1.00
2.00
3.00
4.00
5.00
Airflow quantity (m
3
/s)
P
re
s
s
u
re
d
ro
p
a
cr
o
s
s
r
e
g
u
la
to
r
(P
a)
An investigation was conducted to check on whether
the test method maintained accuracy with less meas-
urement data. It was found that with half the number
of measurements taken (removing two boards at one
time instead of one board) differences remained
mostly less than 10 percent and the method was still
considered reliable.
4
UQEM REAL TIME MINE VENTILATION
SYSTEM
The aim of this mine ventilation research was to de-
velop a computerised monitoring system to provide
immediate or real time simulated information on
each branch within an underground ventilation net-
work. The system measures airflow or air pressure
changes in selected ventilation branches and simu-
late flows through all other branches. This new ap-
proach to ventilation provides improved understand-
ing of airflows through all mine sections. The
popular ventilation simulation modeling program
Ventsim has been used as a simulation engine within
the system. This software has been altered to accept
real time information generated by underground
mine ventilation monitoring sensors, undertake net-
work simulations and interpret key system data and
operational changes. Once the simulation program
has updated readings it can remodel the whole mine
system, report the flows in all branches and compare
individual branch readings with expected values.
The UQEM was used to test the integration of a
telemetry system into the Ventsim network analysis
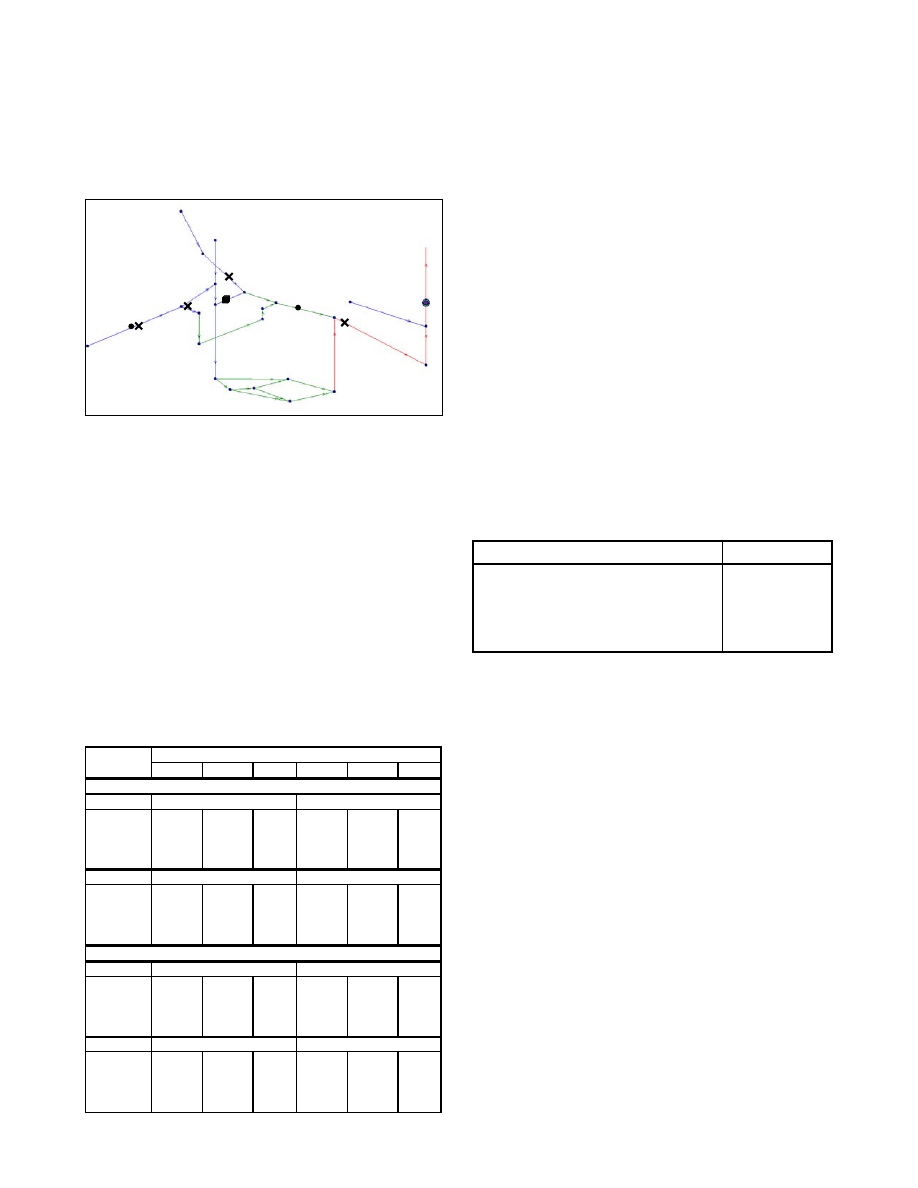
environment. An isometric plan of the UQEM is
shown in Figure 8.
The mine airflow monitoring sys-
tem included consisted of one El-Equip “Flosonic”
and two vortex shedding Sieger BA5 air velocity
sensors. The FloSonic air velocity sensor is an ultra-
sonic anemometer measuring the average air veloc-
ity value across a drift with very good accuracy
Figure 8. Plan of UQEM showing location of doors and sen-
sors.
(Casten et al, 1995 & McDaniel et al, 1999). The ini
tial aim of this testing was to use the system to
monitor changing ventilation conditions, to establish
airflow characteristics within the UQEM and to ob-
serve the resimulated network results.
Achievement of the main research aim was facili-
tated with the development of a real time solution
requiring data communication links between the
various system components. These components in-
cluded the UQEM telemetry monitoring system, the
telemetry control software, the developed data ma-
nipulation applications, a File Transfer Protocol
(FTP) application and a modified real time version
of Ventsim. Details of the integration of the UQEM
real time ventilation monitoring system including
Ventsim modification have been described by Gil-
lies et al (2000).
5
TRIALS OF THE UQEM SYSTEM
The performance of the modified airflow real time
ventilation monitoring system at UQEM was evalu-
ated. Parameters examined in this trial were:
1.
The ability of the system to detect changes in the
mine ventilation system.
2.
The accuracy of airflow quantity prediction in
unmonitored branches within the mine ventila-
tion network based on the number of sensors
linked to the system.
3.
Constraints limiting performance of the system.
5.1
Test results
Four trial scenarios were implemented in the evalua-
tion tests:
I.
The inclined shaft door was open, and the regu-
lator in 116’ level set on fully open.
II.
The inclined shaft door was open, and the regu-
lator was set 1/5 open with 12 boards on.
III.
The inclined shaft door was open, and the regu-
lator set on fully closed.
IV.
The inclined shaft door was closed, and the
regulator was set on fully open.
For the purpose of the tests the main shaft and the
double doors on the 140’ level were closed and the
door on the 154’ level was removed to increase air-
flow through the 116’ adit and inclined shaft. During
the tests field measurements using a calibrated vane
anemometer and pressure transducer were conducted
at the 116’ adit, 116’ regulator, inclined shaft and
ventilation drive on the 140’ level past the Dead
Man’s Pass as shown in Figure 9 and referenced as
Station 26-11. Results of these measurements were
then compared with predicted values generated from
the real time Ventsim models. The aim here was to
evaluate the accuracy of airflow quantity prediction
in unmonitored branches. The real time Ventsim
models were run with one to three real time airflow
Regulator
Doors
BA5 sensors
FloSonic sensor
sensors link to the software and reporting to the
Ventsim program as “Fixed Quantity” branch quan-
tity values. Theoretically more sensors linked to the
system should give greater accuracy as real meas-
urements from a greater mine geographic area and
representing more realistic conditions of the mine
are available.
Figure 9 Schematic diagram of UQEM ventilation system.
Due to the electrical sensing problems encountered
with the BA5 vortex-shedding sensor installed in
116 Adit, it was decided that the outputs from that
sensor would not be included in the tests. A sum-
mary of the results is shown in Table 4.
It can be seen that the UQEM real time Ventsim
monitoring system performs with reasonable accu-
racy, although some differences in quantities were
larger than 10 percent as shown in the table. For ex-
ample, the quantities through inclined shaft when the
door connected to inclined shaft in 140’ level was
closed. However, this is acceptable, since the quan-
tities predicted (ranging around 0.8-0.9m
3
/s) and
measured (around 0.6m
3
/s) in these cases were low.
Table 4 Summary of trial results at UQEM.
Results in Table 4 indicate that the system can pre-
dict changes within the mine ventilation system. The
system predicted decrease in the regulator quantity
as the regulator opening decreased. It also predicted
decrease in quantity through the inclined shaft as the
door was closed.
Within these tests no significant difference be-
tween the accuracy of one and two sensors linked to
the system was observed. However, it cannot be
concluded that this would be the case in a large op-
erating mine since the location of the sensors will
also have an important influence.
5.2
Constraints of the system
As described before, one aim of these tests was to
identify constraints that might limit performance of
the system. One major point of interest is the delay
time or transient period between the instant of a
change and when the system detects the change. The
results of some changes are summarized in Table 5.
The transient period in UQEM is short and there-
fore is not of great significance in interpreting the
network system. However, in large-scale mines, the
period can be up to 10 minutes.
Table 5 Summary of the transition time observed.
Changes
Time
Regulator fully open to 12 boards
Regulator 12 boards to fully closed
Regulator fully closed to fully open
Inclined shaft door open to closed
Inclined shaft door closed to open
70 seconds
36 seconds
84 seconds
72 seconds
75 seconds
What this means is that reliance cannot be placed
completely on “real time” airflow readings being in-
stantaneously correct as reported for all branches
within a mine ventilation simulated network. There
is nothing that can be done to eliminate this charac-
teristic as it is representative of the nature of airflow
within underground mines. A change which leads to
a hazardous condition may go unreported for time
interval of this transient period. Of course changes in
mine ventilation systems measured manually are
rarely immediately picked up but the limitations of
an automatically reporting real time system should
be recognized.
5.3
Updating of Ventilation Network Simulation
Models
From these trial results there is confidence that the
computerized monitoring system is capable of pro-
viding immediate or real time simulated information
on each branch within an underground ventilation
network, is able to detect changes in the ventilation
system monitored and is also able to predict flow
within the unmonitored braches with reasonable ac-
curacy.
116’ Adit
Main Shaft
Inclined Shaft
Vent Shaft
154’ Winze
228’ Level
Dead Man’s
Pass
D
DD
Reg
94’ Adit
BA5
Sensor
Flo
sonic
BA5
Sensor
D Vent doors
X Measuring Stations
Scenario
Predicted Measured Diff (%) Predicted Measured Diff (%)
Regulator
116' adit
I
3.1
2.8
-9.7
3.9
4.1
5.0
II
2.2
2.1
-2.9
3.8
3.8
-0.4
III
1.7
1.3
-22.0
3.7
3.7
0.2
IV
3
2.8
-6.7
4.9
5.3
8.4
Inclined shaft
Station 26-11
I
2.8
2.8
-0.4
9.1
9.1
-0.1
II
2.7
2.8
4.3
8.9
9.0
1.2
III
2.7
2.8
2.7
8.8
8.7
-0.9
IV
0.9
0.6
-38.7
8.8
9.0
1.9
Regulator
116' adit
I
3.1
2.8
-9.7
3.9
4.1
5.0
II
2.2
2.1
-2.9
3.8
3.8
-0.4
III
1.7
1.3
-22.0
3.7
3.7
0.2
IV
2.8
2.8
0.0
4.9
5.3
8.4
Inclined shaft
Station 26-11
I
2.8
2.8
-0.4
9.1
9.1
-0.1
II
2.7
2.8
4.3
8.9
9.0
1.2
III
2.7
2.8
2.7
8.8
8.7
-0.9
IV
0.8
0.6
-31.0
8.8
9.0
1.9
Quantity (m
3
/s)
One sensor linkage
Two sensors linkage

The system has also been seen to have the ability
to update the mine ventilation network model and
keep this mine planning tool current. Mine ventila-
tion models are normally static simulation models
that are accurate when calibrated after a mine venti-
lation survey. Even with care in frequent updating
models will tend to lose accuracy. The real time ap-
proach allows the model to be seen as a dynamic en-
tity that can be tested for its accuracy at any time
without the effort of undertaking a full ventilation
survey.
In a typical mine operation, any ventilation
change must be authorized before the change is
made. Alternative options are evaluated through
computer network simulation or manual calculations
in the planning phases. Once the “ best achievable”
alternative is determined, authorization is gained and
necessary adjustments to some of the system regula-
tors made. Underground ventilation measurements
may at some time be conducted to verify the effects
of the change.
A real time ventilation monitoring system can re-
duce or eliminate the need for numerous under-
ground measurements necessary to verify the effects
of ventilation system changes. The real time sensors
installed in strategic locations will pick up airflow
changes and subsequently make prediction of quan-
tities in all other airways. However, the real time
Ventsim models after detection of the changes
should be modified to form an updated system
model representative of the changes that has taken
place and ready for future planning exercises.
The data collected during the trial was re-
examined as an exercise to demonstrate the impor-
tant and necessity of modification of the real time
simulation models after the imposition of changes,
The first three scenarios used the regulator settings:
fully open, 1/5 open and fully closed were re-
examined with two real time airflow sensor link un-
derground. Table 6 summarizes the results of this
exercise.
The second column in Table 6 shows the pre-
dicted air quantities at various UQEM locations
based on the outputs from the original Ventsim
model without activated real time sensors inputs.
The values were obtained by varying the regulator
resistances using values obtained from the drop
board regulator tests undertaken at UQEM as shown
in Table 2 and then running the network simulation
for prediction in the “planning phase”. These values
serve as guidance for what air quantities will be ex-
pected if regulator settings have been changed.
Once these values are obtained, mine ventilation
personnel can make preliminary evaluations foll-
lowed by regulator adjustments to see what air quan-
tity flows in key branches. As mentioned, under-
ground ventilation measurements are conducted to
verify the effects of the change made.
Table 6 Comparisons of quantity and pressure predictions and
underground measurements
The fourth column corresponds to the predicted val-
ues from real time Ventsim simulation models with
inputs from real time airflow sensors as fixed quanti-
ties. These values are those that been displayed on
the real time UQEM ventilation monitoring and
simulation system during the trial. They were pre-
dicted without changing the resistance values of
regulator in the Ventsim model. These air quantities
compared well with the actual measured values as
indicated in the eighth column of the table.
Based on the air quantities obtained from the real
time UQEM monitoring and simulation system, it
seems that it is not necessary to make adjustment to
the regulator resistance value in the real time Vent-
sim model, as % error in the three locations (as
shown in the fifth column of the table) is no more
than 5 percent. However, when comparing the pre-
dicted pressure drops across regulators for the three
scenarios, significant need for adjustment was
found. Without changing the resistance values of
regulators in the computer model, pressure drops
predicted by the model were far off from the actual
pressure drops measured across the regulator.
Therefore, it is necessary to change the resistance
values of the regulator in the real time Ventsim
model after the detection of the changes in the venti-
lation system. The sixth column in Table 6 repre-
sents the outputs from the real time model after up-
dating the Ventsim model for changes made in the
setting of the drop board regulator during the trial.
These values when compared with the measured
values are more accurate than values shown in the
second and fourth columns.
Scenario
Predicted
original
Ventsim R
changed
%
error
with
mea-
sured
Predicted
realtime
Ventsim R
un-
changed
%
error
with
mea-
sured
Predicted
realtime
Ventsim R
changed
%
error
with
mea-
sured
Mea-
sured
I
3.1
10.7
3.1
10.7
3.0
7.1
2.80
II
2.5
17.1
2.2
3.0
2.1
-1.7
2.14
III
1.6
21.5
1.8
36.7
1.5
13.9
1.32
I
4.9
25.0
4.4
12.2
4.4
12.2
3.9
II
45.2
50.7
2.4
-92.0
28.7
-4.3
30.0
III
98.4
44.7
1.6
-97.6
91.7
34.9
68.0
I
3.9
-4.7
3.9
-4.7
3.8
-7.2
4.09
II
3.8
0.4
3.8
0.4
3.7
-2.2
3.79
III
3.7
-0.2
3.8
2.5
3.6
-2.9
3.71
I
2.8
0.4
2.8
0.4
2.9
4.0
2.79
II
2.7
-4.1
2.7
-4.1
2.8
-0.5
2.82
III
2.8
0.9
2.7
-2.7
2.9
4.5
2.77
I
9.1
0.1
9.1
0.1
9.1
0.1
9.09
II
9.0
-0.1
8.9
-1.2
8.9
-1.2
9.01
III
8.8
0.9
8.8
0.9
8.8
0.9
8.72
Station 26-11 Quantity (m
3
/s)
Regulator Quantity (m
3
/s)
Regulator Pressure (Pa)
116' adit Quantity (m
3
/s)
Inclined Shaft Quantity (m
3
/s)

It should be noted that the real time model is not
fully useful then without frequent updating to reflect
changes in the mine from ongoing mining activities.
From the monitoring system it should also be possi-
ble to monitor historical trends and identify patterns
corresponding to mining cycles. From this it should
be possible to flag situations where it has been estab-
lished that subsequent to a significant mining step
the model will require this significant update. Venti-
lation systems change gradually over time but also
in step changes when a cut through or cross cut is
formed or a new panel opened up.
It is concluded that while the real time ventilation
monitoring and simulation system is able to detect
change in a mine ventilation system and make air-
flow prediction with reasonable accuracy, it is still
necessary to modify the real time simulation model
following and because of changes to gain better ac-
curacy. It is noted that when solely relying on the
use of airflow sensors based on the “Fixed Quantity”
simulation principle, it is necessary to check the
pressure drops across the regulators in the system to
determine whether to modify the real time model or
not. This can be done through the use of differential
pressure sensors. The main advantage is this ap-
proach allows continuous updating of the Ventsim
model and checking of its accuracy as the mine ven-
tilation system is extended and evolves.
6
CONCLUSIONS
Efforts to characterize or mathematically model a
number of operating mine regulators have been de-
scribed. Underground measurements have indicated
that theoretical calculations to predict airflow quan-
tity through practical mine regulators based on
measured pressure drop are inadequate. The theo-
retical approaches are limited as they are based on
prediction of fluid flow through a circular orifice in
the middle of a plate whereas most mine regulators
have a rectangular non-symmetrically positioned ori-
fice. Also, most importantly, there is air leakage
through the regulator bulkhead frame and gaps that
increase actual quantity compared to that predicted.
The way to overcome this difference is to quan-
tify the resistance of the leakage path based on regu-
lator opening area and then recalculates the total re-
sistance of the regulators. The relationship between
leakage path resistance and regulator opening area
varies, but the resistance should increase along with
an increase in opening area. Based on measured
pressure difference, the airflow quantity can be pre-
dicted accurately using the basic square law. It re-
quires field measurement to quantify the leakage
path resistance of each regulator, since each regula-
tor has its own leakage characteristic (size and num-
ber of gaps, etc.). This is a tedious work, since the
regulators can be set with many opening areas.
However, it was found that with limited measure-
ment data, prediction results are still accurate within
acceptable tolerance appropriate to understanding
mine airflows.
The aim of the study was to gain greater under-
standing of a computerized monitoring system to
provide immediate or real time simulated informa-
tion in each branch of an underground ventilation
network. The system measures airflow in selected
ventilation branches and simulates flows through all
other branches. An investigation was undertaken as
to whether the UQEM Real Time Airflow Monitor-
ing system can detect changes within the mine venti-
lation system, examine accuracy of the system and
identify constraints that will limit performance of the
system. As a result of trials, it was demonstrated that
the system was able to detect changes occurring
within the mine ventilation system and was also able
to predict the changes accurately. Limitations caused
by transient period delays have been examined. Up-
dating of simulation models from use of real time
data has also been discussed. It is envisaged in the
future that the ventilation model would be an inte-
gral part of a real time mine wide planning, monitor-
ing and control software platform from which the
model would be updated in real time.
ACKNOWLEDGEMENT
The support of the University of Queensland and a
number of operations within the Australian mining
industry in funding this study are acknowledged.
REFERENCES
Burrows, J, Hemp, R., Holding, W. & Stroh, R.M., 1989. Envi-
ronmental Engineering in South African Mines, 2nd edition,
pp 66-70 Mine Vent. Soc. South Africa, Johannesburg.
Casten, T., Mousset-Jones, P., and Calizaya, F., 1995. Ultra-
sonic Anemometry in Underground Excavations, Proc 7th
US Mine Vent Sym, Lexington, Kentucky, 1995, pp 429-
434. Ed A.M. Wala. SME, Littleton, Colorado, USA.
Gillies, A.D.S., Mayes, T.I., Wu, H.W., Kizil, M. & Wang, N.,
2000. The Development of a Real Time Airflow Monitor-
ing and Control System, Proc 1st Mine Envirn and Vent
Sym, Dhanbad, India, 2000, pp 255-264. Ed D.C. Panigrahi.
A.A. Balkema, Rotterdam.
Kingery, D.S., 1960. Introduction to Mine Ventilating Princi-
ples and Practices, US Bureau of Mines Bul 589, pp 89 (US
Bureau of Mines, Washington DC).
Le Roux, W.L., 1979. Mine Ventilation Notes for Beginners,
3rd edition, pp 131-133 Mine Vent. Soc. South Africa, Jo-
hannesburg.
McDaniel, K., Duckworth, I.J., and Prosser, B.S., 1999.
Evaluation of Different Airflow Sensors at the WIPP Facil-
ity, Proceedings of 8th US Mine Vent Sym, Rolla, Missouri,
1999, pp 519-525. Ed J.C. Tien. SME, Littleton, Colorado,
USA.
McElroy, G.E., 1935. Engineering Factors in Ventilating Metal
Mines, US Bureau of Mines Bull 385, pp 55-68 (US Bureau
of Mines, Washington DC).
Wyszukiwarka
Podobne podstrony:
REAL TIME
Embedded Linux Ready For Real Time Montavista
Real time pcr, pomoce naukowe, biotechnologia
Continuous real time data protection and disaster recovery
REAL TIME PCR czarus1
REAL TIME PCR genotypowanie
Podstawy techniki real time PCR
Zero hour, Real time Computer Virus Defense through Collaborative Filtering
Revealing the Form and Function of Self Injurious Thoughts and Behaviours A Real Time Ecological As
A Model for Detecting the Existence of Unknown Computer Viruses in Real Time
Facebook tworzenie aplikacji real time updates
[Filmmaking Technique] The virtual cinematographer a paradigm for automatic real time camera contr
2001 12 Real Time Os with a Pre Emptive Kernel
Implement a QoS Algorithm for Real Time Applications in the DiffServ aware MPLS Network
EARQ Energy Aware Routing for Real Time and Reliable Communication in Wireless Industrial Sensor Net
więcej podobnych podstron