
TERRITORY
ENVIRONMENT
POPULATION
HEALTH
LIVING CONDITIONS
JUSTICE
CULTURE
EDUCATION
LABOUR MARKET
WELFARE
ECONOMY
PRICES
EXTERNAL TRADE
AGRICULTURE
INDUSTRY AND SERVICES
TOURISM
20
12
Providing users with the tools to deepen
knowledge of Italy's social, economic and
environmental phenomena at various levels
of geographical detail. This is the mission
Istat is pursuing through accurate analyses
and investigations.
Divided into 16 themes, Italy in figures synthetically describes the main
economic, demographic, social and territorial aspects of Italy as well
as some basic habits and behaviours of its population.
In-depth sections, glossaries and brief methodological notes allow
even a non-expert public to take advantage of the information wealth.
Distributed to the international and domestic institutions, media and
opinion leaders, a free copy may be obtained from Istat Statistical
Information Centres in any region or autonomous province or upon
request to the Dissemination and Communication of Statistical
Information Directorate.
Alternatively, users may download its full version or browse each
chapter from the website homepage www.istat.it, where all data
produced by our Institute are available.
STATISTICAL INFORMATION:
A WEALTH TO THE COMMUNITY
Italy
in
figures

Italian National Institute of Statistics
Via Cesare Balbo, 16
00184 Rome - Italy
ph. +39 06 46731
website: http://www.istat.it
Dissemination and Communication
of Statistical Information Directorate
ph. +39 06 4673.2243/2244
fax +39 06 4673.2239/2240
email: comunica@istat.it
Printed by
Rubbettino srl - Soveria Mannelli (Catanzaro)
Geographical areas:
■
North: Piemonte, Valle d’Aosta, Liguria, Lombardia, Trentino-
Alto Adige, Friuli-Venezia Giulia, Veneto, Emilia-Romagna
■
Centre: Toscana, Lazio, Umbria, Marche
■
South and the Islands: Abruzzo, Molise, Campania, Basilicata,
Puglia, Calabria, Sicilia, Sardegna
ITALY'S NUMBERS
Main territorial and demographic data
TERRITORY
1
key points
Latitude North
47° 06'
Latitude South
35° 30'
Longitude West
-5° 50'
Longitude East
6° 04'
Maximum span (km)
1,200
Territorial area (km)
301,336
Total area of woods (km
2
)
68,571
Total length of coastline (km)
7,810
High seismic risk area (km
2
)
28,026
Protected areas (km
2
)
63,167
Highest mountain – Monte Bianco (m)
4,810
Longest river - Po (km)
652
Railway network (km)
16,704
Road network (km)
180,549
Regions
20
Provinces
110
Municipalities
8.092
Resident population
60,626,442
Resident foreigners
4,570,317
Number of households
25,175,793
Households' average members
2.4
Population density (inhab./km
2
)
201
39
416
197
157
268
175
298
332
163
167
107
125
72
211
429
59
133
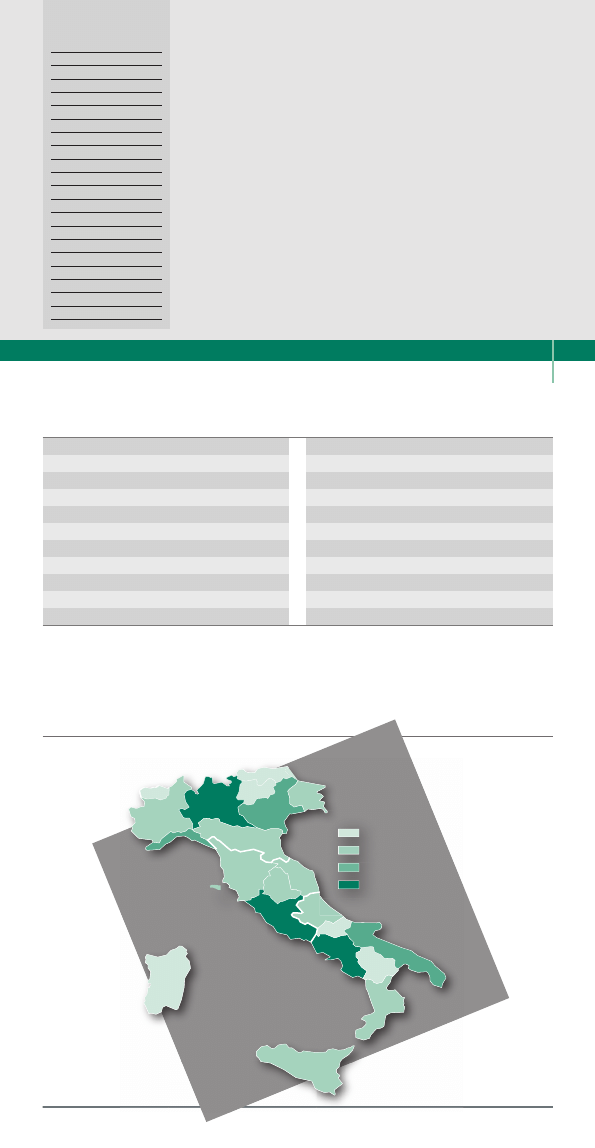
Up to 100
From 101 to 200
From 201 to 300
Over 300
70
196
85
69
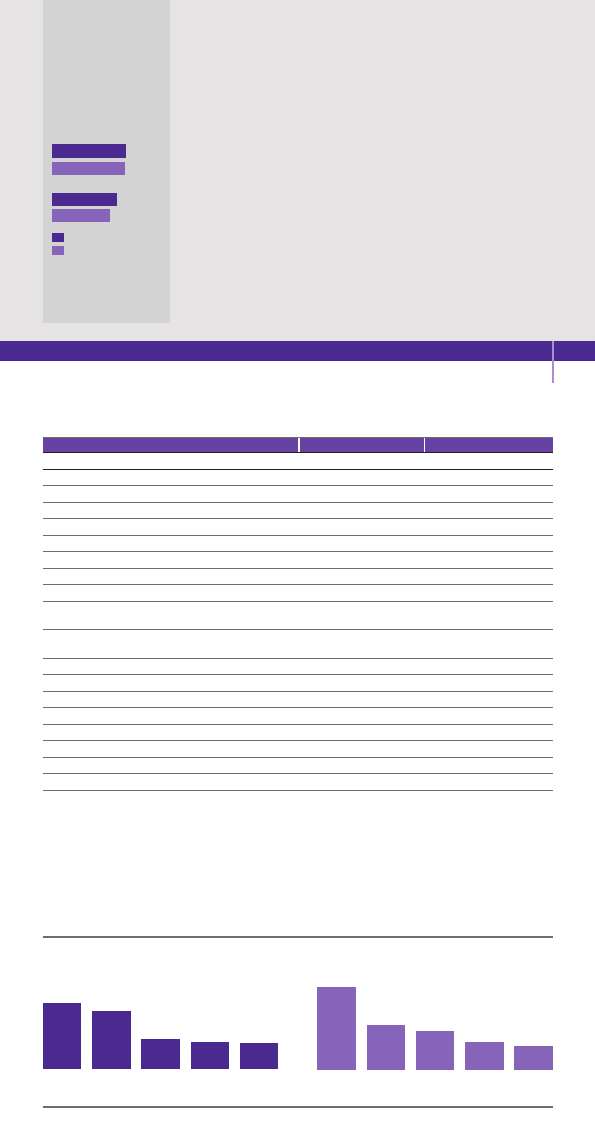
ITALIAN AVERAGE
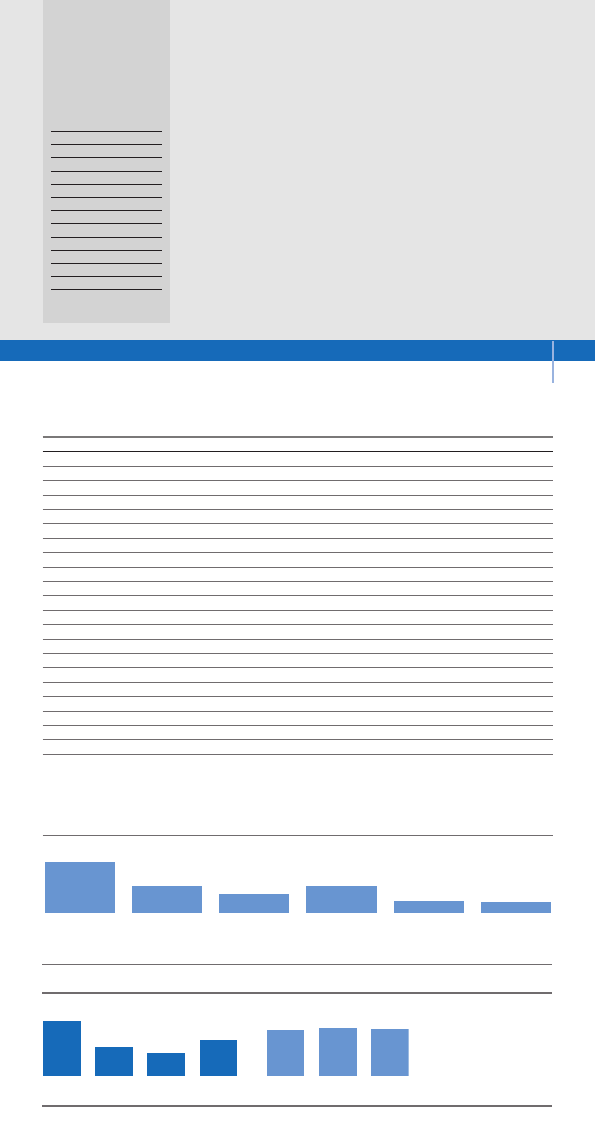
201
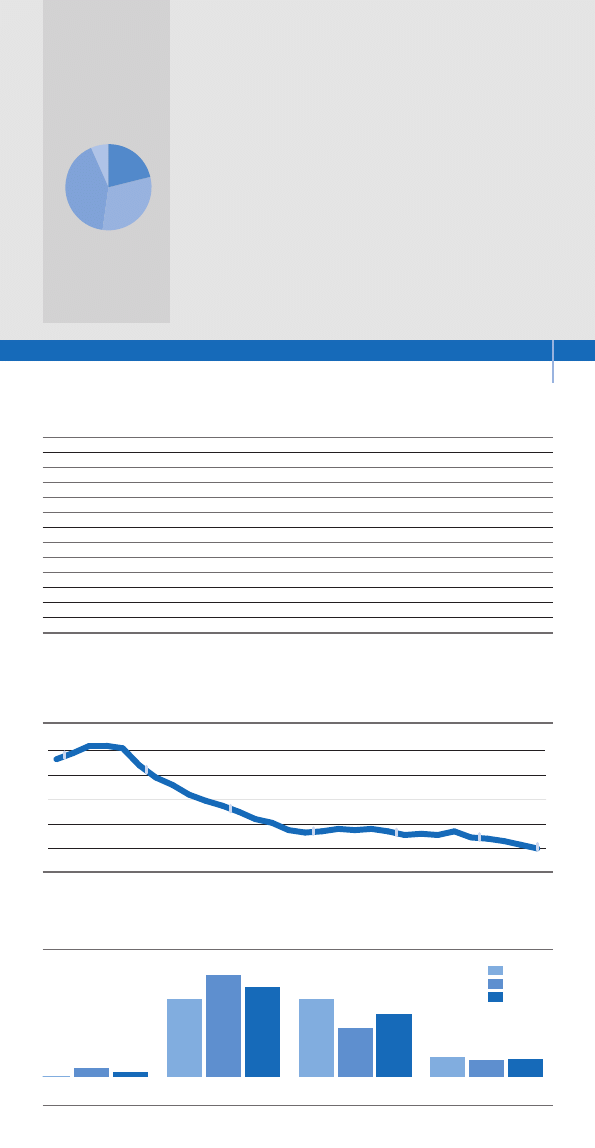
RESIDENT POPULATION DENSITY
1 January 2011, inhabitants per km
2
Piemonte
1,206
Valle d'Aosta
74
Liguria
235
Lombardia
1,544
Trentino-Alto Adige
333
Veneto
581
Friuli-Venezia Giulia
218
Emilia-Romagna
348
Marche
239
Toscana
287
Umbria
92
Lazio
378
Campania
551
Abruzzo
305
Molise
136
Puglia
258
Basilicata
131
Calabria
409
Sicilia
390
Sardegna
377
MUNICIPALITIES PER REGION
IN 2011
TERRITORY
2
North
5,543,922
Centre
South and the Islands
2,293,908
4,188,135
1,564,180
3,703,106
537,852
3,502,908
6,544,884
2,254,706
Mountain
Hill
Plain
TERRITORIAL AREA BY LOCALITY
2001 and 2011, percentage of inhabited localities on territorial area and percentage changes
Census 2001
Census 2011*
% change 2001-2011
Inhabited localities**
Inhabited localities**
Inhabited localities**
%
of which:
%
of which:
%
of which:
inhabited settlements
inhabited settlements
inhabited settlements
%
%
%
North
8.1
7.1
8.7
7.7
8.2
7.5
Centre
6.3
5.5
6.8
5.9
8.2
6.5
South and the Islands
4.3
3.7
4.7
4.0
10.2
6.9
Italy
6.2
5.4
6.7
5.8
8.8
7.1
* provisional data ** include inhabited settlements, inhabited and production localities
TERRITORIAL AREA BY ALTITUDE AND GEOGRAPHICAL AREA
2010, hectares
Altitude areas:
■
mountain: it reaches a height of at least 600 metres in the
Northern regions and at least 700 metres in the Central and
Southern regions
■
hill: it does not exceed a height of 600 metres in the Northern
regions, 700 metres in the Central and Southern regions
■
plain: low and flat, it is characterised by the absence of
masses
Inhabited settlement: characterized by neighbouring or contiguous
buildings – spread over street and squares – and commercial buil-
dings and facilities, as well as a gathering place with a clearly reco-
gnizable form of of social life
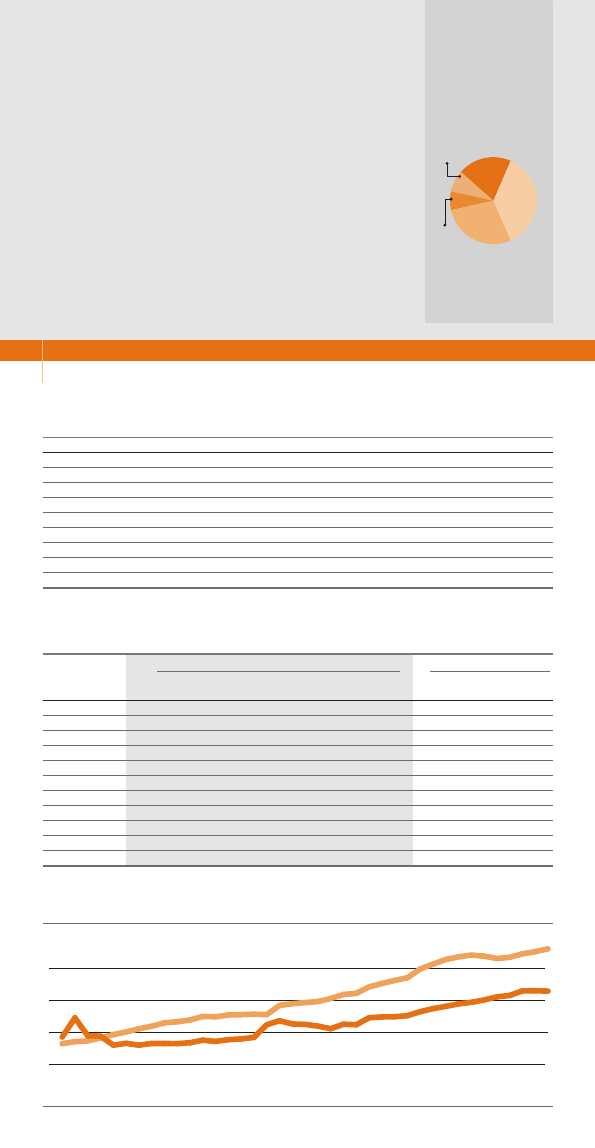
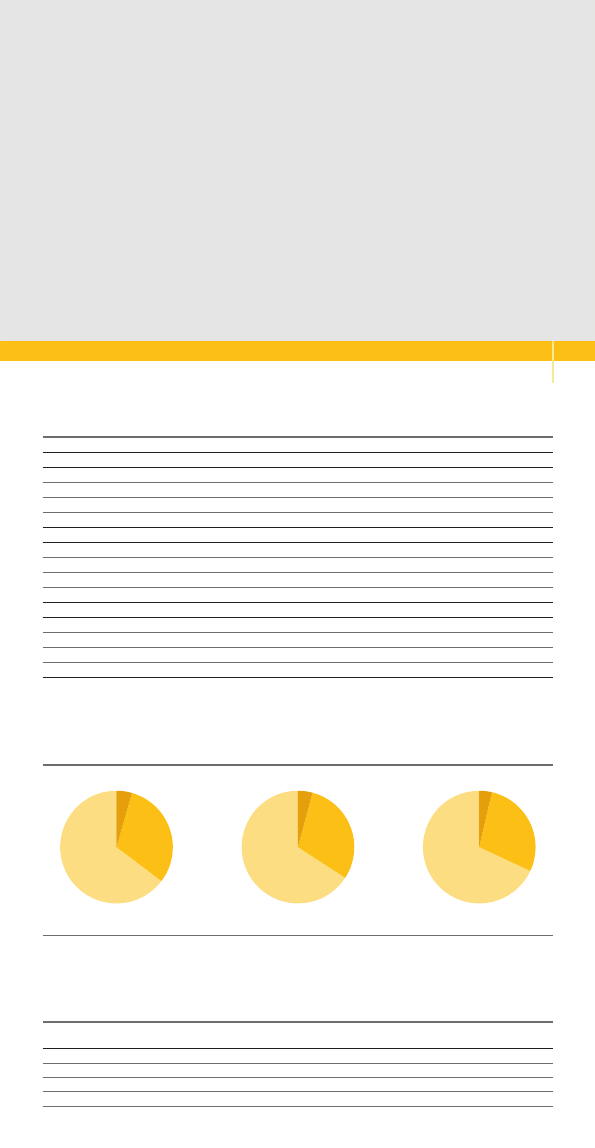
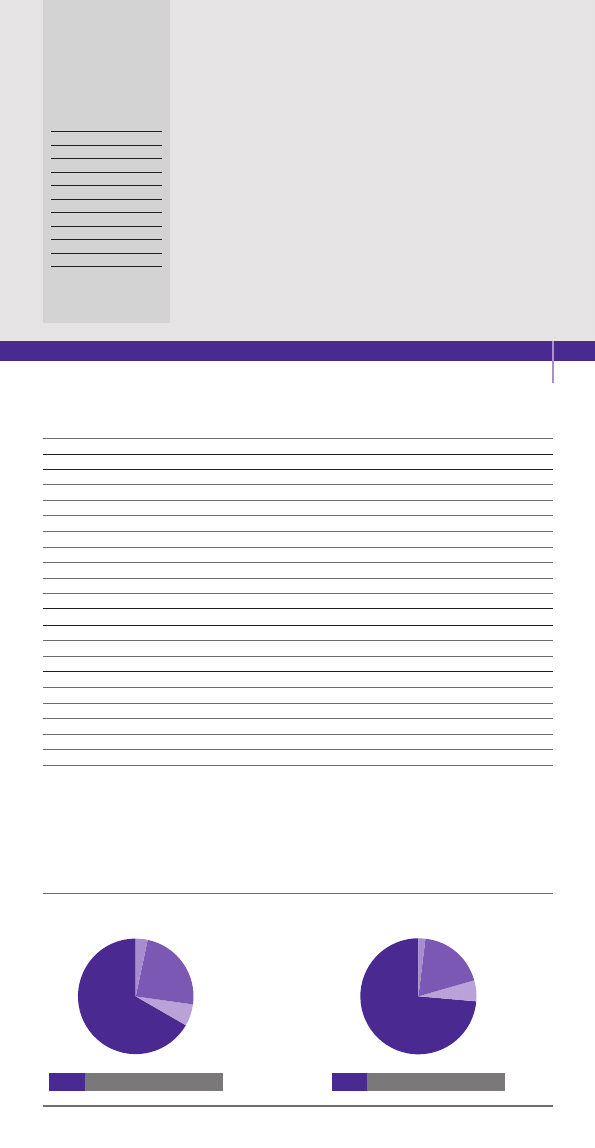
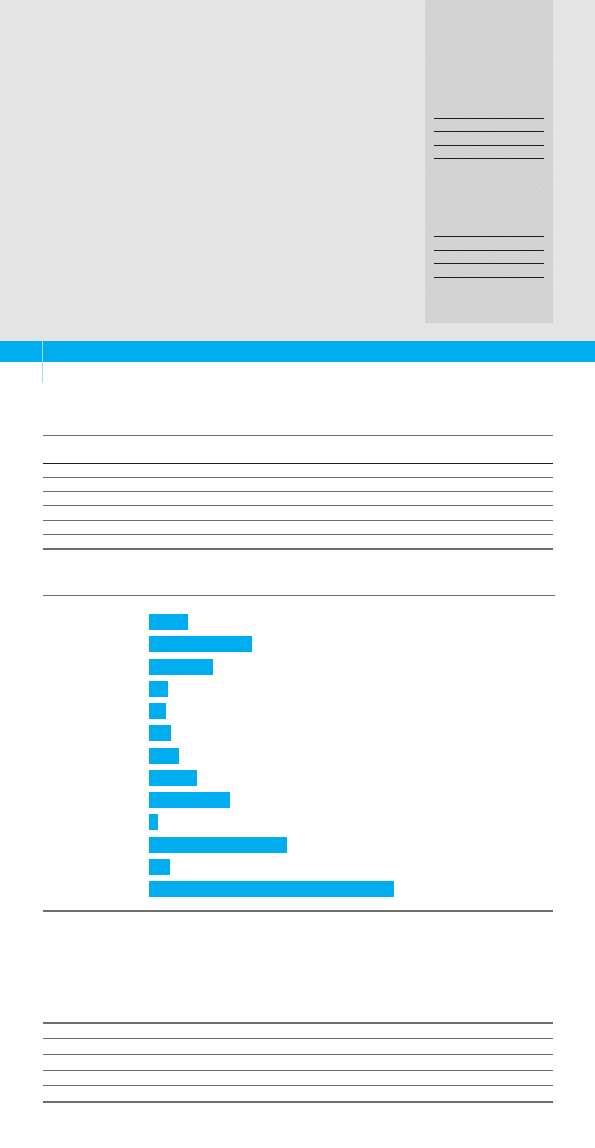
55.3%
44.7%
70.8%
29.2%
Bathing
1992
2010
Non-bathing
BATHING AND NON-BATHING
COAST
percentage composition
FOREST FIRES AND FOREST AREA AFFECTED BY FIRE
1974-2010, hectares
Number
Area affected by fire
of fires
wooded
not wooded
total
average
1974
5,055
66,035
36,909
102,944
20.4
1978
11,052
43,331
84,246
127,577
11.5
1982
9,557
48,832
81,624
130,456
13.7
1986
9,398
26,795
59,625
86,420
9.2
1990
14,477
98,410
96,909
195,319
13.5
1994
11,588
47,099
89,235
136,334
11.8
1998
9,540
73,017
82,536
155,553
16.3
2002
4,601
20,218
20,573
40,791
8.9
2006
5,643
16,422
23,524
39,946
7.1
2010
4,884
19,357
27,180
46,537
9.6
ENVIRONMENT
key points
3
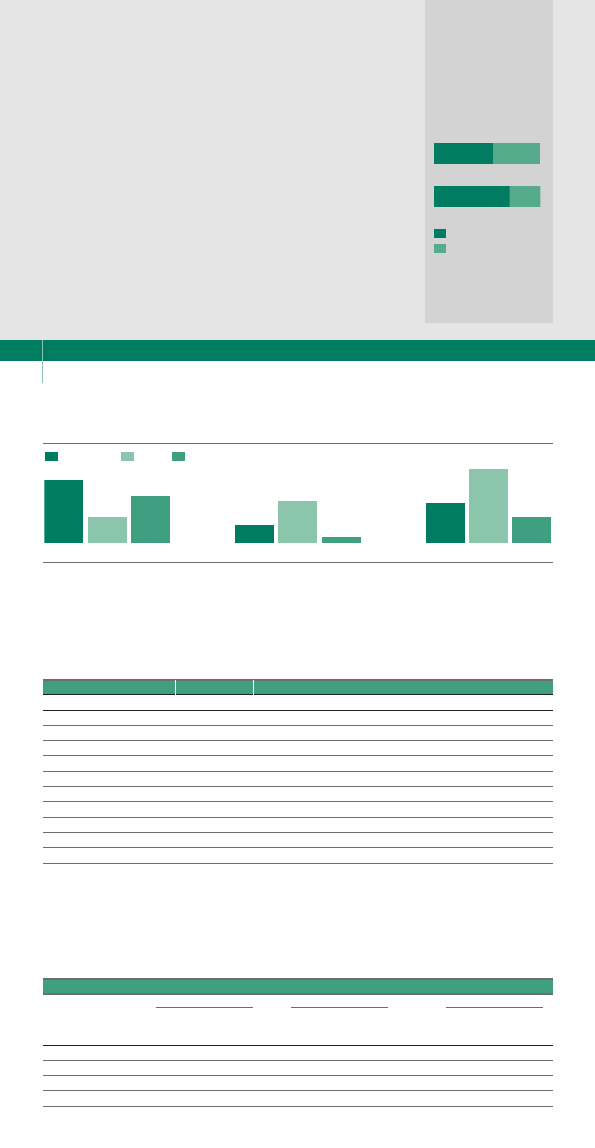
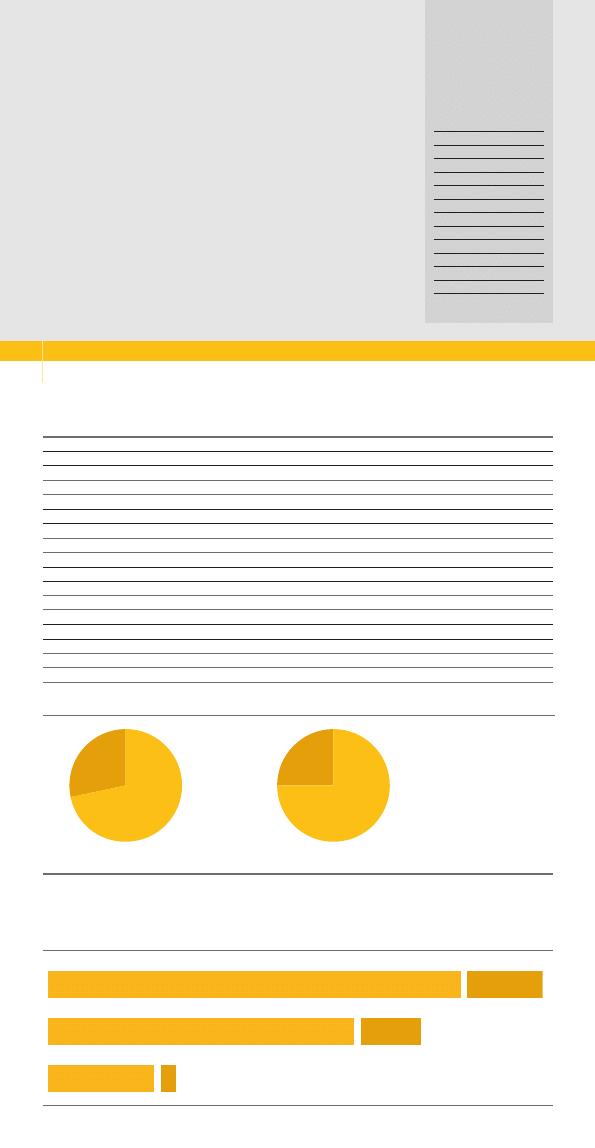
MUNICIPAL WASTE COLLECTION BY GEOGRAPHICAL AREA
2010, percentage composition
Mixed
Separate
Bulky
Total
Kg/
collection
collection
waste
(tons)
inhabitant
North
48.4
49.1
2.5
14,808,248
535.3
Centre
71.7
27.1
1.1
7,323,097
614.3
South and the Islands
78.6
21.2
0.2
10,347,766
495.2
Italy
63.3
35.3
1.5
32,479,111
537.0
Paper
Glass
Plastic
Organic waste
Other
1,308.0
3,062.7
2000 2010
758.8
1,778.5
174.7
648.6
1,292.7
4,186.8
646.3
1,776.0
SEPARATE WASTE
COLLECTION
2000 and 2010,
thousands of tons
ENVIRONMENTAL INDICATORS IN REGIONAL CAPITALS
2010
Parks and gardens
Cars
Water
Air
% of
per 1.000
litres consumed
air-monitoring
municipal
m
2
per
inhabitants
per day
stations
area
inhabitant
per inhabitant
per 100 km
2
Torino
14.4
20.7
599.3
210.3
4.6
Aosta
5.0
30.2
1,938.8*
180.1
18.7
Milano
11.9
16.4
544.5
227.9
4.4
Bolzano - Bozen
3.9
19.9
517.8
164.7
7.6
Trento
15.4
210.4
572.0
162.1
1.3
Venezia
2.5
37.8
408.7
168.5
1.9
Trieste
3.9
16.2
525.0
168.7
10.7
Genova
10.3
41.0
466.0
174.3
8.2
Bologna
10.0
37.0
518.8
161.6
1.4
Firenze
7.5
20.7
555.7
151.8
4.9
Perugia
1.2
33.5
681.8
147.3
0.7
Ancona
28.1
338.0
607.3
156.4
3.2
Roma
27.5
130.7
692.4
234.3
1.0
L'Aquila
43.4
2,793.8
731.9
147.0
0.2
Campobasso
1.5
16.8
673.4
147.4
5.4
Napoli
24.2
29.5
577.5
162.2
6.8
Bari
4.0
14.5
566.3
150.5
6.9
Potenza
0.9
22.2
706.2
138.0
2.3
Catanzaro
4.5
54.2
631.4
225.5
1.8
Palermo
32.1
77.8
597.4
156.7
3.8
Cagliari
16.0
87.5
646.6
182.2
8.2
* data are influenced by a lesser taxation for new cars registration
KILOMETRES OF CYCLE
TRACKS IN 2010
Torino
134.4
Aosta
29.0
Milano
41.1
Bolzano-Bozen
95.5
Trento
29.1
Venezia
24.3
Trieste
23.1
Bologna
65.7
Firenze
49.7
Perugia
1.3
Ancona
2.7
Roma
9.6
Campobasso
11.6
Bari
6.5
Catanzaro
8.5
Palermo
13.3
Cagliari
2.3
per 100 km² of municipal area
Municipal waste:
■
household waste, including bulky ones
■
non-hazardous waste similar to municipal waste in type and
quantity
■
waste from street cleaning
■
vegetable waste from parks and gardens
■
waste from cemeterial activities
Separate waste collection: consists in municipal waste (inclu-
ding wet organic waste) being segregated by waste type for reuse,
recycling and reclamation of materials. It regards paper, glass,
plastic, organic waste, metals, bulky recyclable waste, textile and
others. Wet organic waste is collected separately by means of
either reusable collection containers or certified biodegradable
sacks
POPULATION
Natural increase: difference between the number of live births and
the number of deaths among the resident population occurred both
in Italy and abroad
Net migration: difference between the number of new registrations
and cancellations in population registers due to transfers of residen-
ce from/to another Italian municipality or transfers from/to abroad;
or other reasons
Residence permits: documents issued by the Italian police authori-
ties which give foreigners the right to legally stay in Italy (usually
minors are recorded in their parents’ permit). Since 1 January 2008
European citizens no longer need to obtain it, in compliance with the
regulation n° 2004/38/EC on the right of citizens of the Union to move
and reside freely within the territory of the Member States
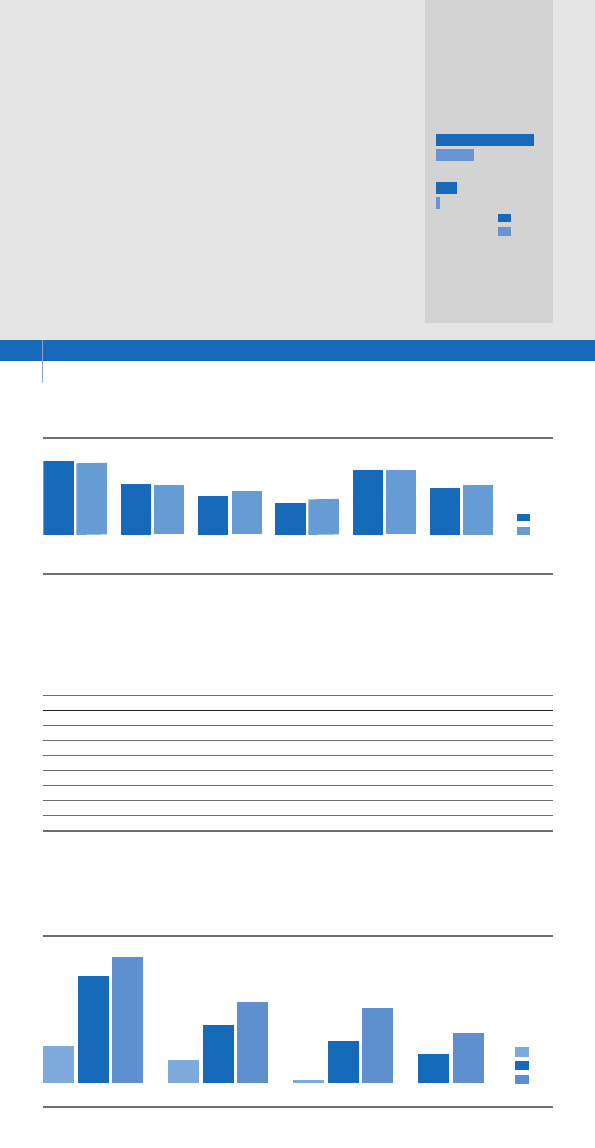
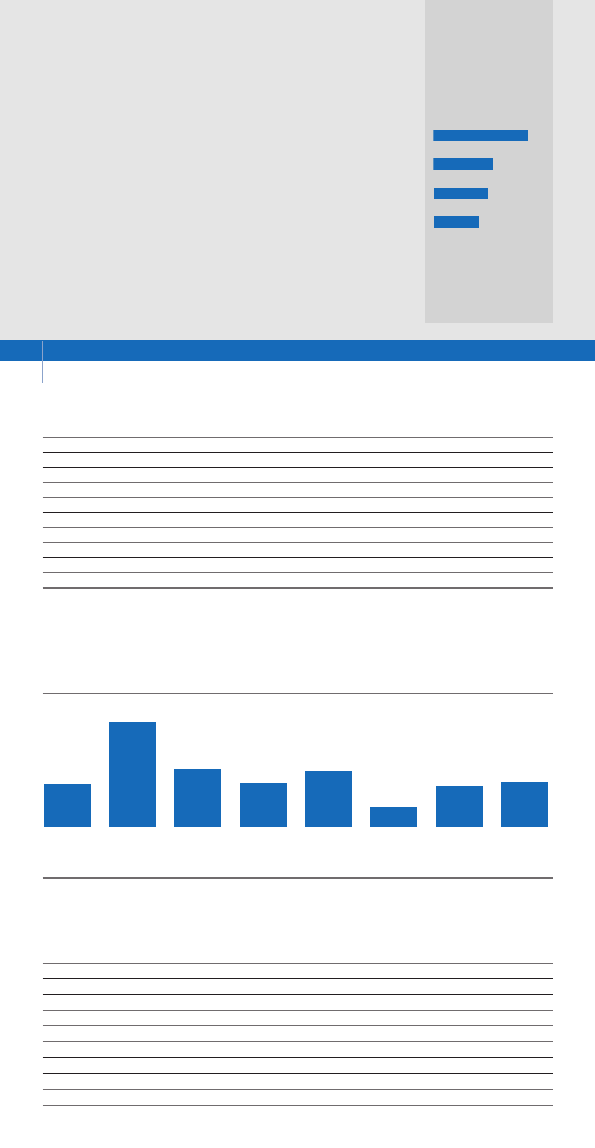
RESIDENCE PERMITS
ON 1 JANUARY 2011
North
2,339,174
Centre
786,998
South
and the Islands
409,890
Italy
3,536,062
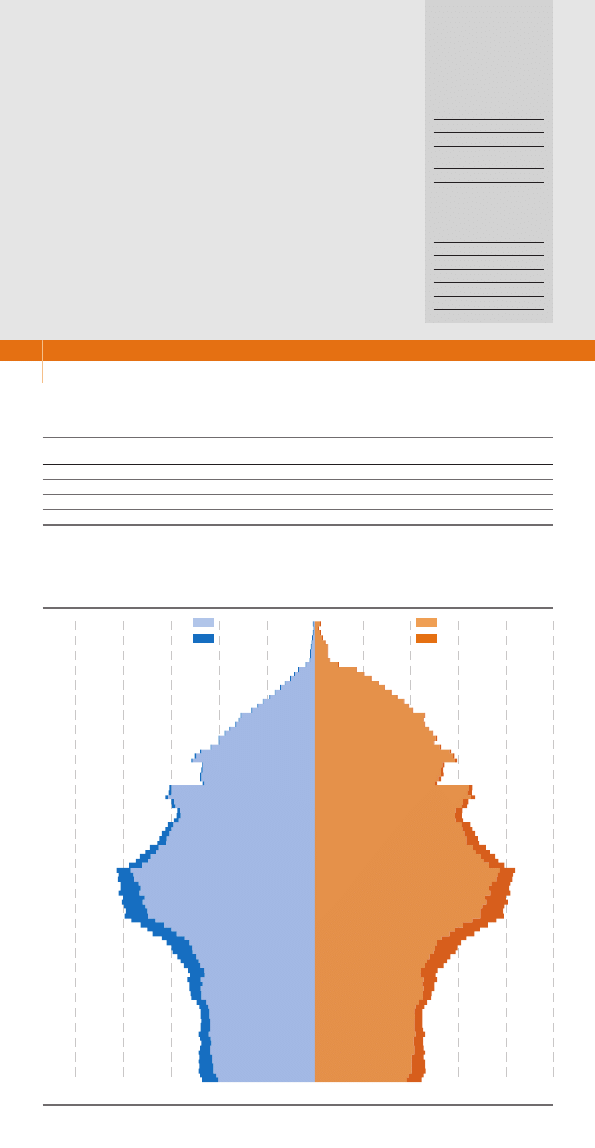
RESIDENT POPULATION PYRAMID BY SEX AND CITIZENSHIP
1 January 2011, % values
RESIDENT POPULATION AND POPULATION CHANGE BY GEOGRAPHICAL AREA
Population on 1 January 2011 and changes in year 2010
Resident
Natural
Net
population
increase
migration
North
27,763,261
-17,429
194,121
Centre
11,950,322
-12,517
90,509
South and the Islands
20,912,859
4,402
27,028
Italy
60,626,442
-25,544
311,658
4
FOREIGN RESIDENTS
IN ITALY
Census 1961
62,780
Census 1971
121,116
Census 1981
210,937
Census 2001
1,334,889
1 January 2011
4,570,317
0.0
0.2
0.4
0.6
0.8
1
-1
-0.8
-0.6
-0.4
-0.2
5
10
15
20
25
30
35
40
45
50
55
60
65
70
75
80
85
90
95
100 and over
A
ge
Italian males
Foreign males
Italian females
Foreign females
BIRTHS PER 1,000 RESIDENTS
1961
18.3
1981
11.1
2001
9.4
2011 (estimate)
9.1
2030 (projection)
8.1
AVERAGE NUMBER
OF CHILDREN PER WOMAN
1961
2.41
1981
1.60
2001
1.25
2011 (estimate)
1.42
2030 (projection)
1.49
Life expectancy at birth: average number of years a new-born is
expected to live
Resident population: people having their usual residence in a
municipality, even if they were absent on the considered day
because they were abroad or in another municipality
Ageing ratio: ratio of population aged 65 and over to population
aged 0-14, per 100
Dependency ratio: ratio of non-working age population (0-14; 65
and over) to working age population (15-64), per 100
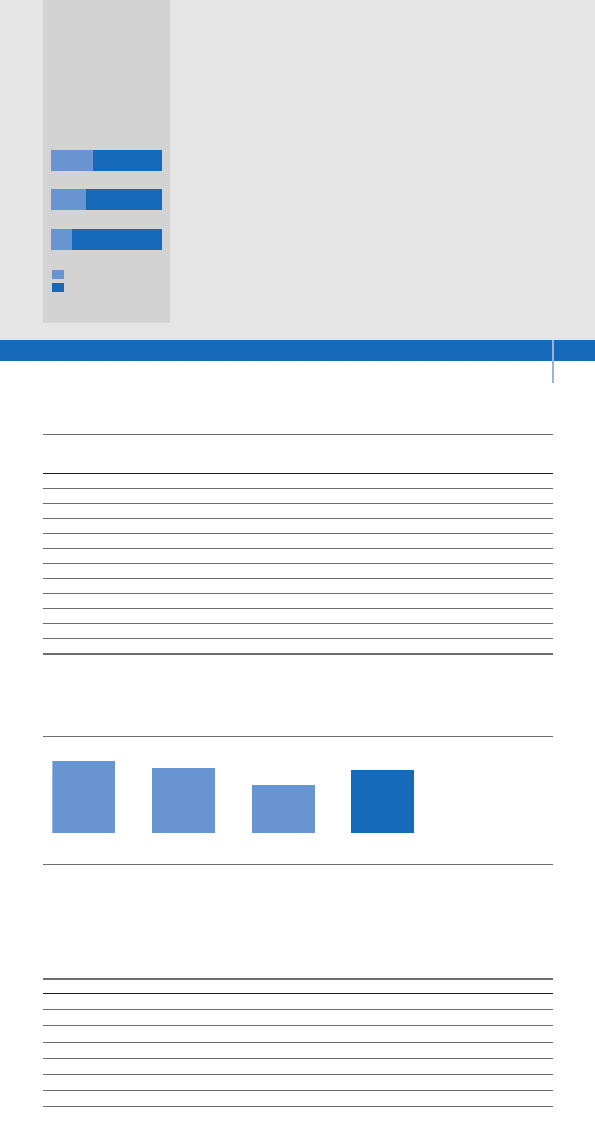
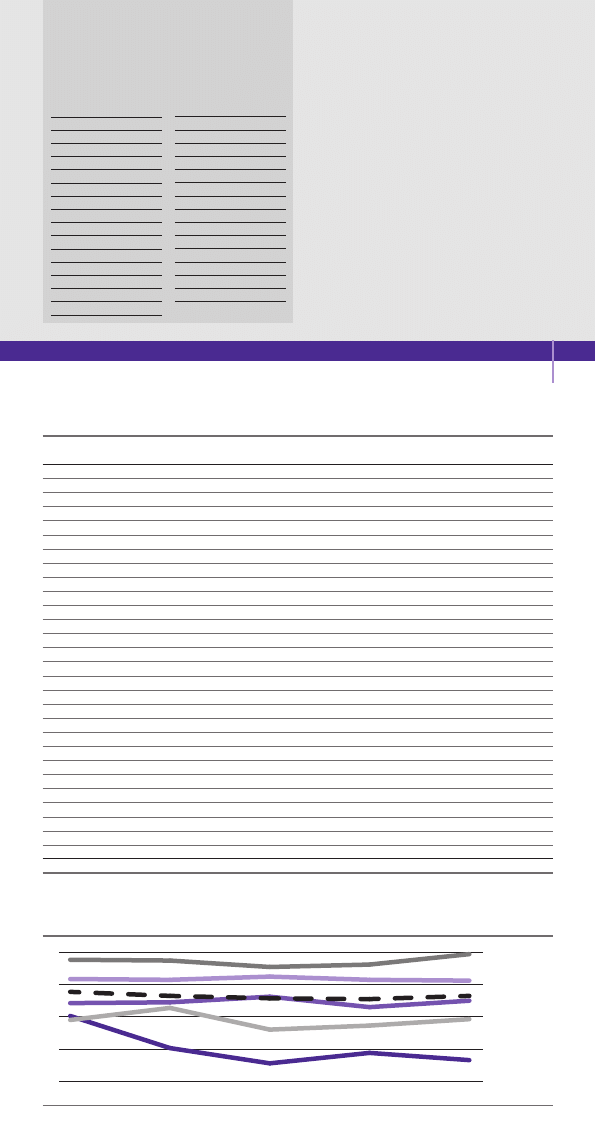
LIFE EXPECTANCY AT BIRTH BY SEX
1961-2065
DEMOGRAPHIC INDICATORS
Censuses 1961-2001 and 1 January 2009-2065
Females
Males
2001
1981
1991
1971
2030**
2065**
1961
2010*
2009
2011*
67.2 72.3
74.9
77.9
80.3
82.8
84.1
84.3
84.5
87.7
91.5
69.0
71.1
73.8
77.0
79.0
79.1
79.4
82.8
87.7
55.5
1971
53.1
1981
45.7
1991
82.8
257.9
2065*
51.9
2009
52.2
2010
48.4
2001
52.3
2011
51.6
1961
DEPENDENCY RATIO
63.2
207.1
2030*
46.1
1971
61.7
1981
92.5
1991
2065*
2009
143.4
2010
143.9
2001
127.1
2011
144.5
38.9
1961
AGEING RATIO
2030*
POPULATION
key points
* estimate ** projection
5
* projection
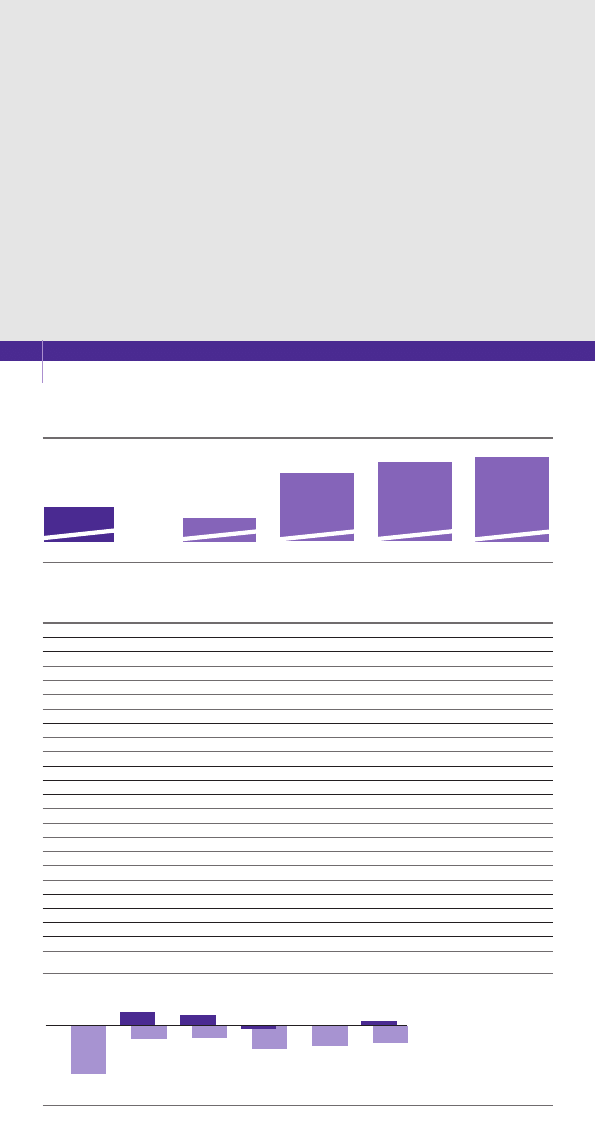
RESIDENT POPULATION PROJECTIONS
2015-2065, thousands
2065
2060
2055
2050
2045
2040
2035
2030
2025
2020
2015
61,637
62,497
63,081
63,483
63,750
63,889
63,846
63,546
61,305
62,964
62,169
Marriages: data refer to marriages celebrated in Italy during the
year regardless of the couple’s residence. They include marriages
between two non-residents in Italy or between one resident and
one non resident in Italy
Household: a group of people linked by ties of marriage, kinship,
affinity, adoption, guardianship or affection, sharing the same
house and with usual residence in the same municipality.
Households can also consists of one member only
SEPARATIONS AND DIVORCES
1971-2010
LIVE BIRTHS OF PRESENT POPULATION BY SEX
1931-2011
Males
Females
Total
1931
525,385
500,812
1,026,197
1941
481,599
455,947
937,546
1951
441,542
419,456
860,998
1961
477,219
452,438
929,657
1971
465,832
440,350
906,182
1981
320,321
302,782
623,103
1991
289,984
272,803
562,787
2001
272,288
256,588
528,876
2011*
277,895
262,574
540,469
* provisional data
1971
1975
1980
1985
1990
1995
2000
2005
2010
Divorces
11,796
19,132
10,618
29,462
35,162
15,650
44,018
52,323
27,682
27,038
71,969
37,573
82,291
47,036
88,191
54,160
Separations
17,134
11,844
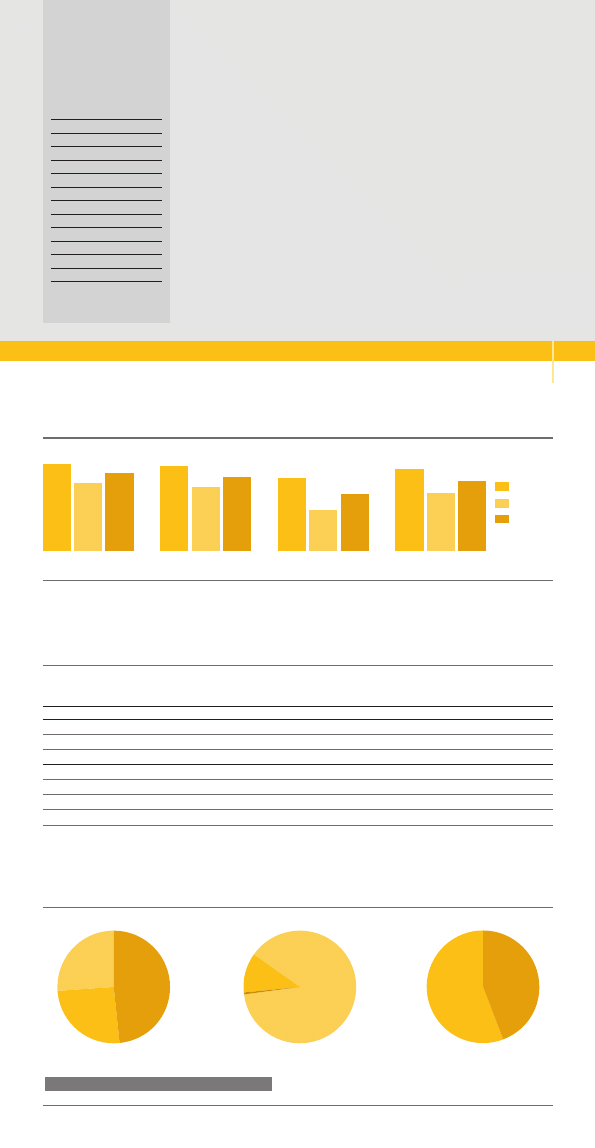
37%
28%
7%
8%
20%
Couples
without children
Singles
Others
Single
parents
Couples
with children
MAIN HOUSEHOLD TYPES
IN 2009-2010
percentage composition
POPULATION
6
MARRIAGES AND AVERAGE AGE OF SPOUSES
2000-2010
MARRIAGES
AVERAGE AGE OF SPOUSES
Total
of which
with at least one
per 1,000
Males
Females
civil
foreign partner inhabitants
2000
284,410
24.7
7.0
4.9
32.1
28.9
2001
264,026
27.1
8.1
4.6
32.5
29.2
2002
270,013
28.9
9.5
4.7
32.9
29.6
2003
264,097
29.4
10.5
4.6
33.2
29.9
2004
248,969
31.9
12.3
4.3
33.6
30.3
2005
247,740
32.8
13.3
4.2
34.0
30.7
2006
245,992
34.0
14.0
4.2
34.0
30.6
2007
250,360
34.6
13.8
4.2
34.2
31.0
2008
246,613
36.7
15.0
4.1
34.5
31.3
2009
230,613
37.2
13.9
3.8
34.8
31.5
2010
217,700
36.5
11.5
3.6
35.1
31.8
Hospitals of National Health Service (NHS): include public
hospitals and credited private clinics
Hospitalisation rate: ratio of in-patients to resident population
(yearly average), per 1,000
Average length of stay in hospital: ratio of days of stay to in-
patients
General practitioners: the contract of general practitioners sets
a maximum limit of 1,500 patients each. In 2009 the national
average value was 1,129 patients per general practitioner
key points
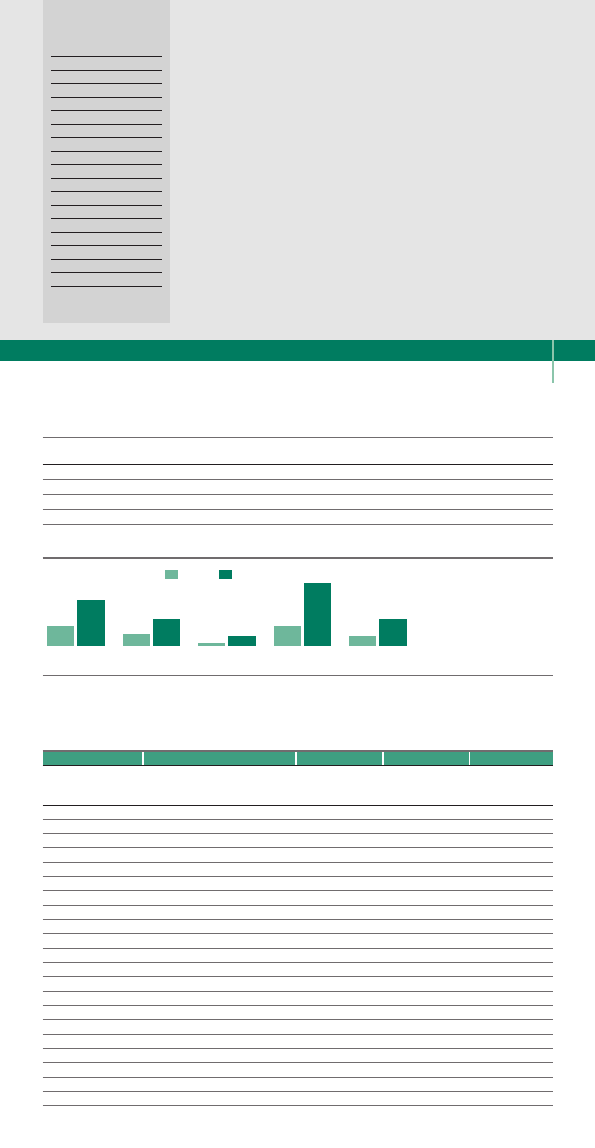
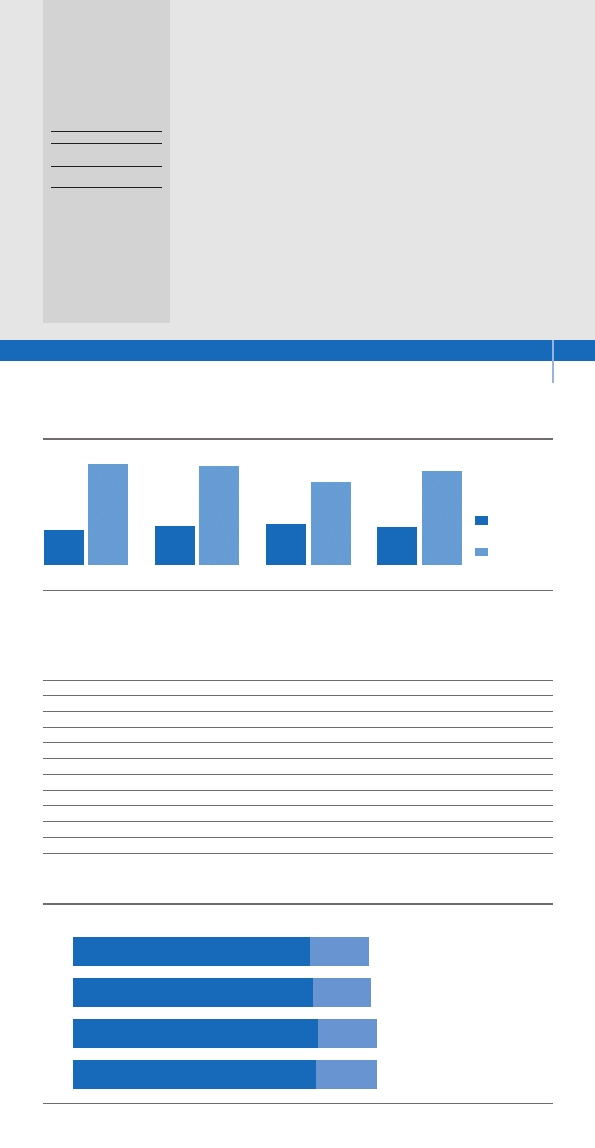
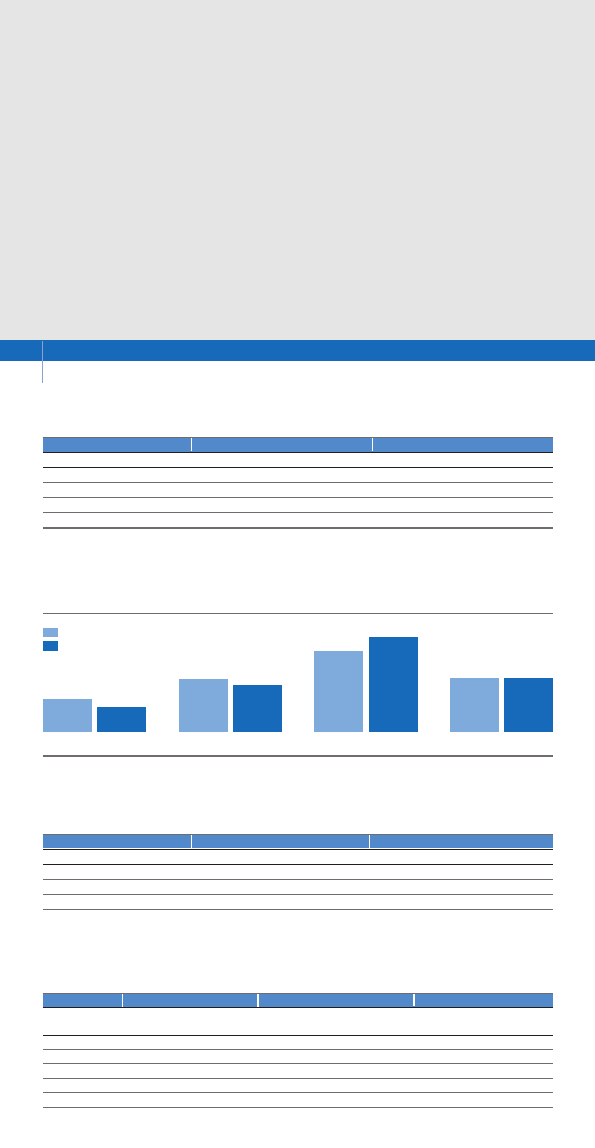
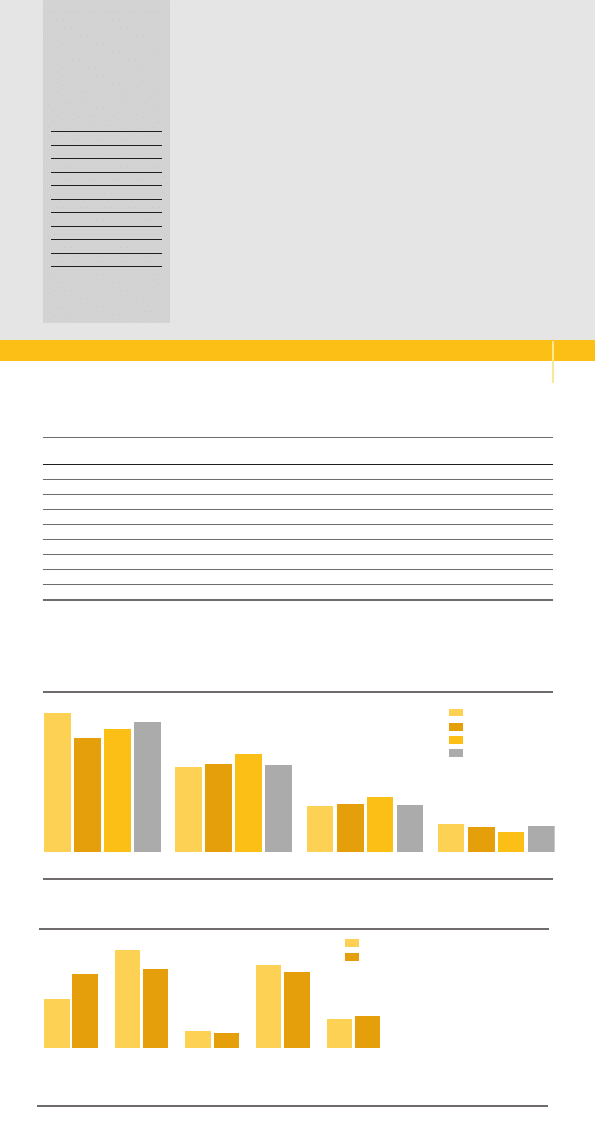
NATIONAL HEALTH SERVICE STAFF BY GEOGRAPHICAL AREA
2009, per 10,000 inhabitants
North
Centre
South and the Islands
Italy
16.5
47.0
18.4
45.8
19.3
38.6
17.8
43.9
Doctors
and dentists
Nurse staff
NATIONAL HEALTH SERVICE INDICATORS
2009
North
Centre
South and the Islands
Italy
General practitioners
19,711
9,863
16,635
46,209
General practitioner rate*
7.2
8.3
8.0
7.7
Patients per general practitioner
1,214
1,047
1,078
1,129
National Health Service paediatricians
3,189
1,495
3,011
7,695
National Health Service paediatrician rate**
8.6
9.5
9.6
9.1
Patients per paediatrician (under 14)
900
832
824
857
Non-emergency medical on-call services
782
418
1,754
2,954
On-call physicians
3,128
1,950
7,281
12,359
Local Health Authorities
74
29
45
148
Unified booking centres
64
29
41
134
* per 10,000 inhabitants ** per 10,000 children aged 0-14
MEDICAL TECHNOLOGY
EQUIPMENT OUTSIDE
HOSPITALS IN 2009
Ecotomographies
5.0
Computerized axial
tomographies
0.7
Magnetic resonance
imaging units
0.8
per 100,000 inhabitants
HEALTH
7
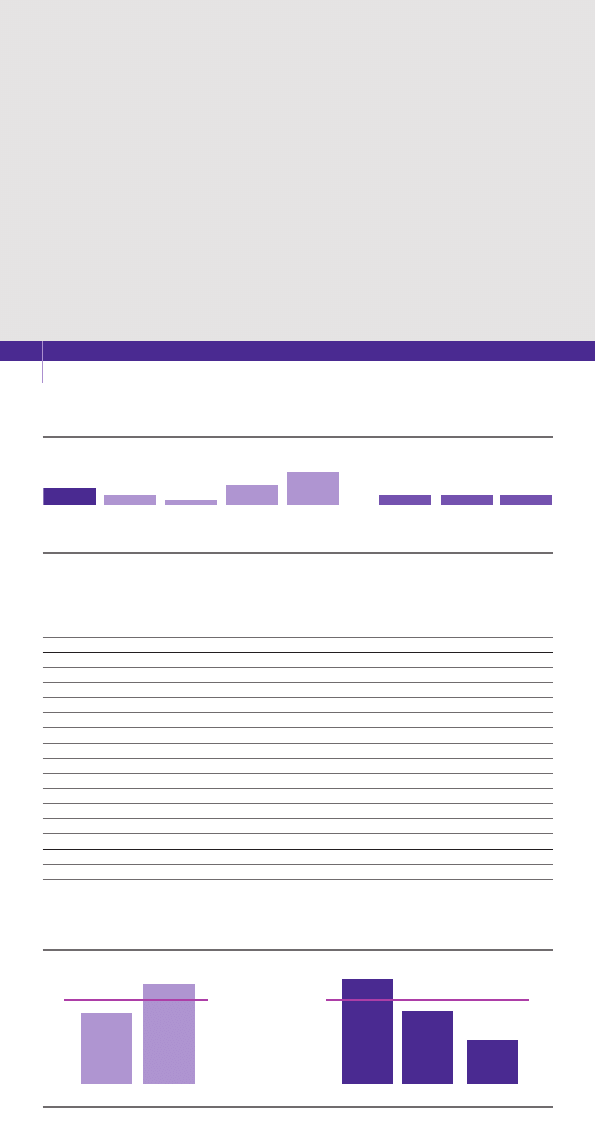
HEALTH EXPENDITURE
BY SECTOR
2008-2011,
billions of euro
at current prices
Private sector
108.9
27.2
2008
136.1
110.5
26.7
2009
137.2
112.7
2010
27.3
140.0
2011
112.0
140.0
28.0
Public sector
TOTAL
HOUSEHOLD EXPENDITURE
FOR HEALTHCARE GOODS
AND SERVICES IN 2010
Hospitalisations
282
Check-ups
119
Dentist
383
Auxiliary health services 186
Diagnostic tests
58
X-rays/ultrasound scans
75
Glasses/contact lenses
160
Drugs
79
Thermometers/syringes
35
euro
HEALTH CONDITIONS AND REPORTED CHRONIC DISEASES
2011, per 100 people
Good health
71.1
Diabetes
4.9
Hypertension
15.9
Osteoporosis
7.2
Osteoarthritis,
arthritis
17.1
Hearth
diseases
3.6
Allergic
diseases
10.3
Neurological
diseases
4.0
112.9
1931
1941
115.2
1951
66.6
1961
40.7
1971
28.5
1981
14.1
1991
8.1
2001
4.4
2009
3.6
INFANT MORTALITY PER 1,000 LIVE BIRTHS
DRUG CONSUMERS* BY AGE
1993-2011, thousands of people
1993
1998
2005
2007
2009
2011
Up to 14
1,524
1,396
1,482
1,557
1,372
1,234
15-34
2,753
2,626
2,773
2,834
2,926
2,620
35-64
7,317
7,687
8,941
9,694
9,997
9,871
65 and over
5,986
6,933
8,460
9,008
9,509
9,607
Total
17,580
18,643
21,656
23,091
23,807
23,331
* in the two days preceding the interview
HEALTH
8
DEATHS BY SOME CAUSES
1931-2009, per 100,000 inhabitants
75.6
1931
1971
2009
Neoplasms
190.4
290.2
188.5
Diseases of the
circulatory system
446.0
373.5
261.4
Diseases of the
respiratory systems
76.9
66.4
224.9
Diseases of the
digestive system
57.6
39.4
218.2
Infectious and
parasitic diseases
15.9
15.0
Infant mortality: includes deaths in the first year of age before the
first birthday, including those died before the registration of birth
key points
Induced abortion: there has been a sharp reduction since Law n°
194/78 made induced abortions legal in Italy. 1982 and 1983 were
the peak years, with a number of interventions exceeding
230,000 per year and an abortion rate of 16.7 and 16.4 respecti-
vely per 1,000 resident women aged 15-49. From that moment
on, the number of induced abortions and the abortion rate pro-
gressively reduced to 8 per 1,000
Body Mass Index (BMI): determined dividing the body weight in
kilograms by the squared height in meters. A BMI under 18.5 is
considered underweight, one of 18.5-24.99 is considered a
healthy weight, one of 25-29.99 is overweight and one of 30 or
more is obese
PERSONS BY BODY MASS INDEX
2010, per 100 persons aged 18 and over
SMOKERS AND NON-SMOKERS BY SEX
1980-2011, per 100* persons aged 14 and over
1980
1983
1991
1995
2000
2005
2011
MALES
Smokers
54.3
45.6
37.8
33.9
31.5
28.3
28.4
Former-smokers
9.9
13.5
21.0
27.4
26.5
30.4
30.5
Never smoked
35.7
40.9
41.2
37.4
38.4
39.0
39.4
FEMALES
Smokers
16.7
17.7
17.8
17.2
17.2
16.2
16.6
Former-smokers
1.4
2.3
16.4
13.1
13.4
15.0
16.7
Never smoked
81.9
80.0
75.9
68.5
66.2
66.4
65.1
TOTAL
Smokers
34.9
31.1
27.4
25.3
24.1
22.0
22.3
Former-smokers
5.5
7.7
13.4
20.0
19.8
22.4
23.4
Never smoked
59.6
61.2
59.2
53.5
52.8
53.2
52.7
* due to non-response some totals do not add up to 100
0.6
Males
Females
Total
Underweight
4.9
2.8
44.0
Healthy weight
57.9
51.2
44.3
Overweight
27.6
35.6
11.1
Obese
9.6
10.3
LEGAL INDUCED ABORTIONS
1980-2009, per 1,000 resident women aged 15-49
15.3
1
14.8
11.5
9.3
9.4
8.9
8.0
2005
2009
2000
1995
1990
1985
1980
HEALTH
9
More than 20
11-20
6-10
Up to 5
21.3%
6.4%
41.3%
31%
SMOKERS BY NUMBER
OF DAILY CIGARETTES
SMOKED IN 2010
percentage composition
CONSUMERS OF SOME FOOD AT LEAST ONCE A DAY
2000 and 2010, per 100 persons aged 3 and over
Bread, pasta
and rice
Milk
Greens
Vegetables
Fruit
84.9
87.3
60.2
58.9
46.7
50.9
38.1
42.1
76.8
76.2
Fish*
55.5
59.2
2000
2010
Sport practice: in 2011 21.9% of population aged 3 and over prac-
tised one or more sports with continuity, while 10.2% did it discon-
tinuously. People who did not do any sport but claimed to perform
some physical activity (such as walking, swimming or cycling)
amounted to 27.7%. The sedentary, namely those who did not
either do any sport or perform any physical activity, were 39.8%:
44.4% of women and 35.0% of men.
Sport was the most widespread leisure activity among the young:
children aged 6-17, in particular males aged 11-14 (59.3%) practi-
sed sport with continuity, while 18.4% of males aged 20-24 did it
occasionally
DAILY CONSUMERS OF
ALCOHOLIC DRINKS IN 2010
TECHNOLOGICAL GOODS OWNED BY HOUSEHOLDS
1997-2011, per 100 households
27.3
1997
2003
2011
Mobile phone
78.2
91.6
16.7
Personal computer
42.7
58.8
2.3
Internet access
30.7
54.5
Satellite dish
21.1
36.4
Wine
Beer
Males
Females
7.5
13.7
35.3
1.3
per 100 persons aged 11 and over
of the same sex
* at least some times during the week
MEANS OF TRANSPORT USED TO TRAVEL TO WORK
1993-2011, per 100 persons employed aged 15 and over that travel to work
1993
1996
1999
2002
2005
2008
2011
Train
2.4
2.3
2.4
2.4
2.6
2.9
2.8
Tram, bus
5.6
5.0
5.5
5.1
5.0
4.9
5.0
Underground
1.7
1.7
1.9
2.1
2.2
2.5
2.8
Coach
1.2
3.3
3.3
3.1
3.0
2.9
2.7
Car
69.0
70.9
72.0
73.2
76.4
75.7
75.5
Motorcycle, motorbike
3.2
4.3
4.7
4.4
4.2
4.6
4.2
Bicycle
3.1
3.0
2.6
3.0
2.9
3.1
3.2
Walking
14.0
12.7
11.8
11.1
11.1
11.1
11.8
LIVING CONDITIONS
10
Average monthly expenditure: average consumption expenditure
incurred by resident households each month. It is calculated by
dividing the total expenditure by the number of households
Average actual expenditure for purchase of goods: is calculated
by dividing the households’ total expenditure for a good (or serv-
ice) by the number of households that have purchased the same
good (or service)
Reference person: the family head as recorded in the Register
Office
key points
AVERAGE MONTHLY EXPENDITURE BY HOUSEHOLD TYPE AND CHAPTER
2010, percentage composition to total expenditure
Average
Food
Clo
thing
Hou
sing Transport
Lei
sure Others
monthly
exp. (
2)
Single person under 35
16.8
6.7
37.2
16.9
5.6
16.8
1,898
Single person 35 to 64
16.7
5.5
40.9
16.1
4.7
16.1
2,001
Single person 64 and over
21.3
2.8
53.4
7.0
3.6
11.9
1,446
Couple without children with r.p. under 35
13.9
6.3
37.0
21.1
4.7
17.0
2,908
Couple without children with r.p. 35-64
16.5
5.2
38.2
18.1
4.8
17.2
2,858
Couple without children with r.p. 65 and over
21.7
3.6
45.8
11.6
3.9
13.4
2,213
Couple with 1 child
18.2
6.6
36.8
17.2
5.9
15.3
2,922
Couple with 2 children
19.0
7.2
33.1
18.7
6.7
15.3
3,131
Couple with 3 or more children
20.3
7.8
32.2
17.7
7.7
14.3
3,298
Single parent
20.2
5.7
39.2
14.1
6.2
14.6
2,308
Other types
21.2
5.7
38.3
15.8
5.1
13.9
2,644
Total households
19.0
5.8
39.1
15.8
5.5
14.8
2,453
r.p.= household reference person
AVERAGE ACTUAL EXPENDITURE FOR DURABLES BY GEOGRAPHICAL AREA
2010, euro
North
Centre
South and the Islands
Italy
Dishwasher
527
500
561
523
Air conditioner
1,549
1,301
775
1,293
Television
370
497
434
388
Personal computer
502
239
619
505
Mobile phone
130
140
120
130
Camera
549
707
602
595
New car
16,498
14,891
11,899
15,927
LIVING CONDITIONS
11
AVERAGE MONTHLY
EXPENDITURE
BY GEOGRAPHICAL AREA
2010, euro
North
2,796
Centre
2,539
South and the Islands
1,882
Italy
2,453
2010
1980
Food
Non food
19.0
81.0
31.6
68.4
37.4
62.6
1968
AVERAGE MONTHLY
EXPENDITURE
BY CHAPTER
percentage composition
Civil case: proceeding aimed at settling a
controversial juridical relationship. It deals
with the settlement of disputes relating to
labour law, land, social security and welfare
Criminal case: proceeding aimed at ascertai-
ning and sanctioning the criminal responsibi-
lity for an offence. Data refer to filed and clo-
sed proceedings handled by all first and
second instance legal offices during the
various procedural stages. Hence, each pro-
ceeding could be counted more than once
based on the office that handled it
Average duration: ratio of pending cases (ini-
tial+ending) and filed and closed cases,
per 365
Litigation rate: ratio of first instance civil
cases filed in the year to average resident
population, per 1,000
LITIGATION RATE BY GEOGRAPHICAL AREA
2000 and 2010
2000
2010
North
13.9
10.6
Centre
22.2
19.9
South and the Islands
34.2
39.9
Italy
22.8
22.5
CIVIL CASES BY LEVEL OF COURT
2000 and 2010
2000
2010
first instance
second instance
first instance
second instance
Filed
1,317,544
89,221
1,360,827
168,910
Closed
1,558,089
103,968
1,364,740
139,745
Pending at the end of the year
3,185,181
244,131
2,761,588
500,227
Average duration in days
839
950
740
1,149
CRIMINAL CASES BY LEVEL OF COURT
2000 and 2010
2000
2010
first instance
second instance
first instance
second instance
Filed
6,137,367
71,308
6,705,576
106,347
Closed
6,136,970
94,602
6,612,777
85,515
Pending at the end of the year
5,588,120
108,221
5,013,462
224,413
STAFF OF THE JUDICIARY*
2011
Magistrates
Technical and administrative staff
Justices of the Peace
establishment
occupied
establishment
occupied
establishment
occupied
plan posts
posts
plan posts
posts
plan posts
posts
North
3,185
2,776
13,759
11,455
1,597
308
Centre
1,745
1,553
8,314
7,151
803
170
South and the Islands 4,185
3,598
19,383
17,865
2,290
605
Central offices**
490
373
2,666
2,095
-
-
Total***
9,605
8,300
44,122
38,566
4,690
1,083
* excluding those without ordinary judicial functions ** national offices: High Court for public water; Antimafia national department; Supreme Court and General
Attorney of Supreme Court ***values of the staff refer to the staff distributed in the offices of interest on a total of 10,151 set by law
JUSTICE
12
1936
129.1
1956
68.2
1976
53.2
1996
84.5
2009
107.4
2011**
110.0
2010
112.1
* minors not included ** provisional data
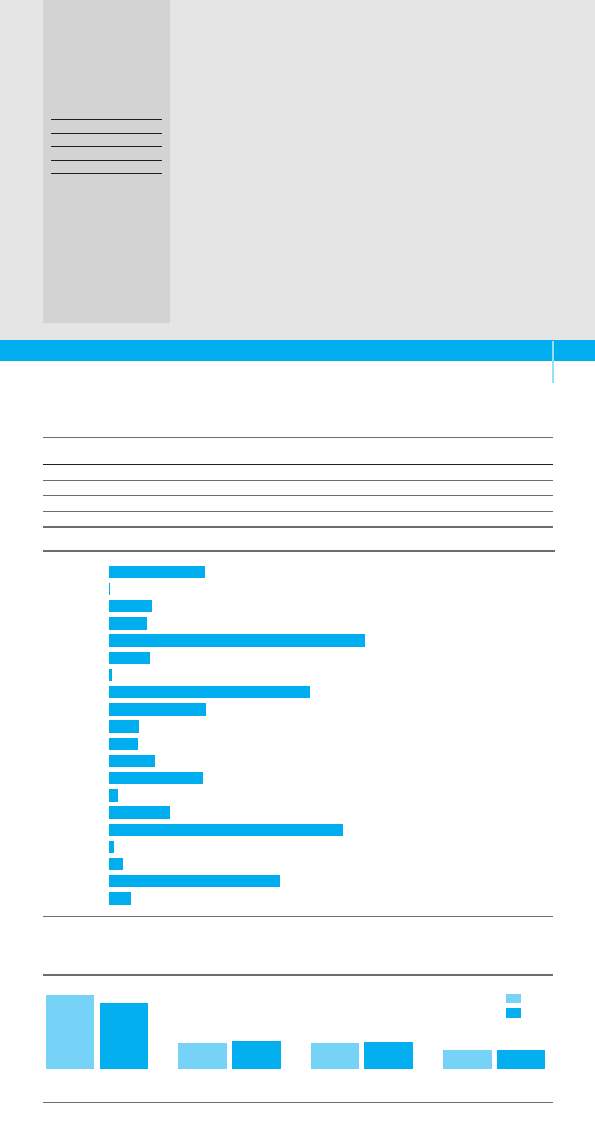
DETAINEES AND INMATES
AT THE END OF 2011
BY AGE GROUP
18-20
1,158
21-24
5,525
25-29
9,945
30-34
11,506
35-39
10,837
40-44
9,516
45-49
7,035
50-59
8,116
60-69
2,668
70 and over
571
Not classified
20
Total
66,897
Judicial authority: the authority in charge of the administration
of criminal, civil and administrative justice
Crime: the crime for which the main penalty of imprisonment,
the fine and some accessory penalties (e.g.: interdiction from
Public Offices) are foreseen
Detainee: person indicted or sentenced under measures involving
freedom deprivation, held in prison in pre-trial detention or serving
a sentence
Inmate: a person sentenced to detention in special institutions
(criminal psychiatric hospital, treatment and surveillance centre,
assignment to an agricultural colony or a workhouse)
MINORS REPORTED BY MAIN TYPE OF CRIME
2009*
Robberies
2,180
Receiving
stolen goods
2,486
Damages to things
and animals
5,463
Drug production
and peddling
3,887
Culpable injuries
5,552
Thefts
10,518
key points
JUSTICE
13
DETAINEES AND INMATES*
AT THE END OF THE YEAR
1936-2011
per 100,000 inhabitants
* articles 648 bis and 648 ter of the penal code ** articles 314, 316, 316 bis, 316 ter, 317, 318, 319, 319 ter, 320, 321, 322, 322 bis of the penal code
* provisional data
CRIMES REPORTED BY POLICE FORCES TO THE JUDICIAL AUTHORITY
2007-2010
2007
2008
2009
2010
Intentional omicides
627
611
586
526
Attempted omicides
1,588
1,621
1,346
1,309
Unintentional omicides
2,040
1,881
1,718
1,765
Culpable injuries
63,602
65,791
65,611
64,866
Blows
14,917
15,288
15,205
14,270
Menaces
81,073
83,580
83,483
81,164
Kidnapping
1,867
1,816
1,481
1,436
Rapes
4,897
4,893
4,963
4,813
Thefts
1,636,656
1,392,544
1,318,076
1,325,013
Robberies
51,210
45,857
35,822
33,754
Extortions
6,545
6,646
6,189
5,992
Swindles and cyber frauds
120,710
104,174
99,366
96,442
Laundering*
1,209
1,253
1,269
1,344
Receiving stolen goods
31,104
27,786
23,619
23,686
Damaging
384,529
402,163
415,391
414,923
Arson
16,716
12,662
10,921
9,622
Drugs
34,439
34,082
34,101
32,761
Embezzlement, bribery, extortion**
1,236
1,280
1,229
1,266
Abuse of office
1,097
1,168
1,099
1,193
Other crimes
477,084
504,792
508,356
504,874
Total
2,933,146
2,709,888
2,629,831
2,621,019
Theatre and music: including theatre (prose and dialect theatre,
literary recitals), opera and operetta, variety shows and musi-
cals, ballets, puppet shows, variety shows and other perform-
ances, circus performances, pop and jazz concerts
Institutes of art and antiques: data are referred to public insti-
tutions, like museums, galleries, archaeological sites and mon-
uments opened during the year
AVERAGE EXPENDITURE ON ENTERTAINMENT EVENTS
2003-2011, euro
2003
2005
2007
2009
2011
EXPENDITURE PER INHABITANT
Theatre and music
8.03
8.83
10.36
10.58
10.46
Cinema
10.56
10.23
11.28
11.03
11.50
Sport events
5.24
5.31
5.93
6.01
5.87
Total
23.83
24.37
27.57
27.62
27.83
EXPENDITURE PER TICKET
Theatre and music
16.83
16.75
17.13
18.60
18.64
Cinema
5.79
5.73
5.75
6.08
6.22
ENTERTAINMENT EVENTS ATTENDANCE
2011, per 100 persons aged 6 and over
21.9
53.7
29.7
22.6
28.4
10.1
20.8
22.9
Theatre
Cinema
Museum,
art exhibition
Discotheque
Sport
events
Classical music
concerts
Other
concerts
Archaeological
sites,
monuments
THEATRE, MUSIC, CINEMA AND ART
2003-2011
2003
2005
2007
2009
2011
THEATRE AND MUSIC
Performances
184,754
187,556
207,401
181,232
175,721
Tickets sold (thousands)
27,484
30,889
35,900
34,252
34,021
CINEMA
Days of release*
1,074,224
1,193,772
1,266,082
1,785,945
2,975,624
Tickets sold (thousands)
105,030
104,684
116,430
109,229
112,120
INSTITUES OF ARTS AND ANTIQUES
Institutes
401
403
400
423
424
Visitors (thousands)
30,451
33,048
34,443
32,380
40,134
* in 2008, SIAE launched a new method for detecting film releases based on single screenings
READERS AND AUDIENCE
IN 2011
* per 100 persons aged 3 and over
** per 100 persons aged 6 and over
CULTURE
14
94.0
TV watchers*
59.0
Radio listeners*
54.0
Newspapers readers**
45.3
Book readers**
SCHOOLING RATE
AT UPPER
SECONDARY SCHOOL
1985/86
57.7
1990/91
68.3
1995/96
80.8
2000/01
87.6
2005/06
92.4
2006/07
92.7
2007/08
93.2
2008/09
92.7
2009/10
92.3
2010/11
92.4
School system is divided into six levels:
■
pre-school education
■
primary
■
lower secondary
■
upper secondary
■
post-secondary (non-tertiary)
■
tertiary (university, doctoral and specialisation courses)
As from school year 2006/2007, data on upper secondary schools
have included information on first and second classes of vocational
schools of the Autonomous Province of Bolzano
Schooling rate at upper secondary school: ratio of upper secondary
school enrolled students to population aged 14-18, per 100
ACTUAL AVERAGE HOUSEHOLD EXPENDITURE ON EDUCATIONAL SERVICES
2010, euro
370
North
Centre
South and the Islands
Italy
School taxes
305
329
346
227
Fees and charges
235
261
232
124
Private lessons
128
147
127
74
School transport
66
54
69
key points
SCHOOLS, CLASSES AND STUDENTS BY TYPE OF SCHOOL
School year 2010/2011
Pre-primary
Primary
Lower
Upper
secondary
secondary
Schools
24,260
17,724
7,937
6,909
Classes*
73,315
59,208
82,654
127,096
Students
1,687,840
2,827,564
1,787,467
2,669,189
% of female students
48.1
48.3
47.9
48.9
% students enrolled in public schools
69.9
92.9
95.9
94.7
Foreigners per 100 students enrolled
8.6
9.0
8.8
5.8
Repeaters per 100 students enrolled
-
0.3
4.3
7.0
Teachers**
81,216
209,710
140,098
211,834
Students per teacher**
12.3
12.3
12.0
11.7
* pre-primary values refer to sections ** data refer to public schools only
EDUCATION
15
Primary
school
licence
17.9
26.7
28.6
5.4
27.7
11.6
35.5
6.0
30.0
10.6
Lower
secondary
licence
2-3 years
upper
secondary
diploma
4-5 years
upper
secondary
diploma
University
degree
Males
Females
POPULATION AGED 15 AND
OVER BY EDUCATIONAL
QUALIFICATION AND SEX
2011,
percentage composition
EDUCATION
The reform of the university system: as stated in the ministry
decree n° 509/1999 (and Law n° 270/2004), academic courses, star-
ting from 2001/2002 are organised in two consecutive cycles: the first
three-year cycle (first level degree to obtain the new university
degree) and the second two-year cycle (second level degree, for spe-
cialistic degree).
The “unique” formula courses (equivalent degree to specialist
degree only upon course completion): five-year courses for architec-
ture, civil engineering, pharmacy, dentistry, veterinary science and
law; the medicine course is six years. Other courses of the old
system still persist in this new system (degree and university degree)
UNIVERSITY GRADUATES
BY GEOGRAPHICAL AREA*
IN 2009
North
124,571
Centre
80,661
South and
the Islands
87,566
Italy
292,798
* the geographical area
is the one where the university
is located
UNIVERSITY NEW ENTRANTS
Academic years 2002/03-2009/10, per 100 upper secondary school graduates in the preceding school-year
2008/09
63.6
2002/03
72.3
2003/04
72.6
2004/05
70.7
2005/06
69.7
2006/07
66.3
2007/08
65.7
2009/10
63.3
16
33.2
46.2
39.6
18.3
14.7
22.0
GRADUATES**
ENROLMENTS AT UNIVERSITY*
Males
Females
Total
ENROLMENTS AT UNIVERSITY
AND GRADUATES
* academic year 2009/10, per 100
persons aged 19-25
** 2009, per 100 persons aged 25; the
percentages are calculated on old
system degrees, two-year
specialistic programme degrees
and unique formula programmes
degrees
UNIVERSITY NEW ENTRANTS, ENROLLED AND GRADUATES BY FIELD OF STUDY
Academic year 2009/2010, absolute values and percentage changes
NEW ENTRANTS
ENROLLED
GRADUATES
Total
% change
Total
% change
Total
% change
on previous
on previous
on previous
year
year
year
Maths and physical science
9,387
-5.9
53,557
-3.2
8,182
3.6
Chemistry and Pharmacy
14,567
4.8
72,802
3.5
7,163
2.4
Life and natural sciences
17,123
8.1
84,986
-0.4
13,927
-2.0
Medicine
26,447
2.6
156,171
3.7
30,071
-1.3
Engineering
34,983
4.8
206,968
1.3
34,489
-1.3
Architecture
13,478
-5.2
101,971
-1.1
15,976
2.0
Agriculture
7,099
5.8
40,915
-0.9
5,371
-2.4
Economics and statistics
43,372
-4.5
239,711
0.4
40,455
-1.6
Political and social sciences
29,814
0.1
188,609
-4.6
38,755
-2.7
Law
32,085
4.9
212,899
-1.3
22,619
-6.9
Humanities
21,123
-9.0
152,546
-4.0
25,635
-0.6
Languages
17,185
-2.6
95,857
-0.2
16,408
5.1
Education
12,960
-8.6
93,240
-2.9
15,390
7.1
Psychology
8,886
-1.6
68,702
-0.4
13,304
0.6
Physical training
5,795
-3.0
27,838
-0.2
4,218
2.6
Army
416
26.8
1,932
-3.7
835
-7.1
Total
294,720
-0.4
1,798,704
-0.8
292,798
-0.7
Labour force survey: provides official esti-
mates of employed, job-seekers and main
labour market aggregates. Data are col-
lected every year on a sample of 300,000
resident households. People permanently
living abroad, in communities, religious
institutes, barracks and similar are there-
fore not included in the survey. Starting
from 2004, the survey is carried out on a
continuous basis as data are collected
every week of the year, although results are
published monthly and every three months
Labour force: includes persons employed
and job-seekers
LABOUR MARKET
17
key points
LABOUR FORCE BY WORKING STATUS, SEX AND GEOGRAPHICAL AREA
2011, thousands of people
Males
Females
Total
PERSONS EMPLOYED
North
6,818
5,107
11,925
Centre
2,774
2,052
4,826
South and the Islands
4,026
2,189
6,216
Italy
13,619
9,349
22,967
JOB-SEEKERS
North
360
371
731
Centre
198
201
399
South and the Islands
556
422
978
Italy
1,114
993
2,108
LABOUR FORCE
North
7,178
5,478
12,656
Centre
2,973
2,253
5,226
South and the Islands
4,582
2,611
7,194
Italy
14,733
10,342
25,075
PERSONS EMPLOYED BY ACTUAL WEEKLY HOURS WORKED AND SECTOR OF ACTIVITY
2011, percentage values
Absent
Up to
11-30
31 hours and over
Not
from work
10 hours
hours
(total)
(of which: 40 hours) available
Agriculture
3.9
2.4
16.5
76.2
31.8
1.0
Industry
8.8
0.8
9.3
80.7
57.4
0.4
Services
7.3
2.5
23.8
65.9
27.7
0.5
Total
7.6
2.0
19.4
70.5
36.3
0.5
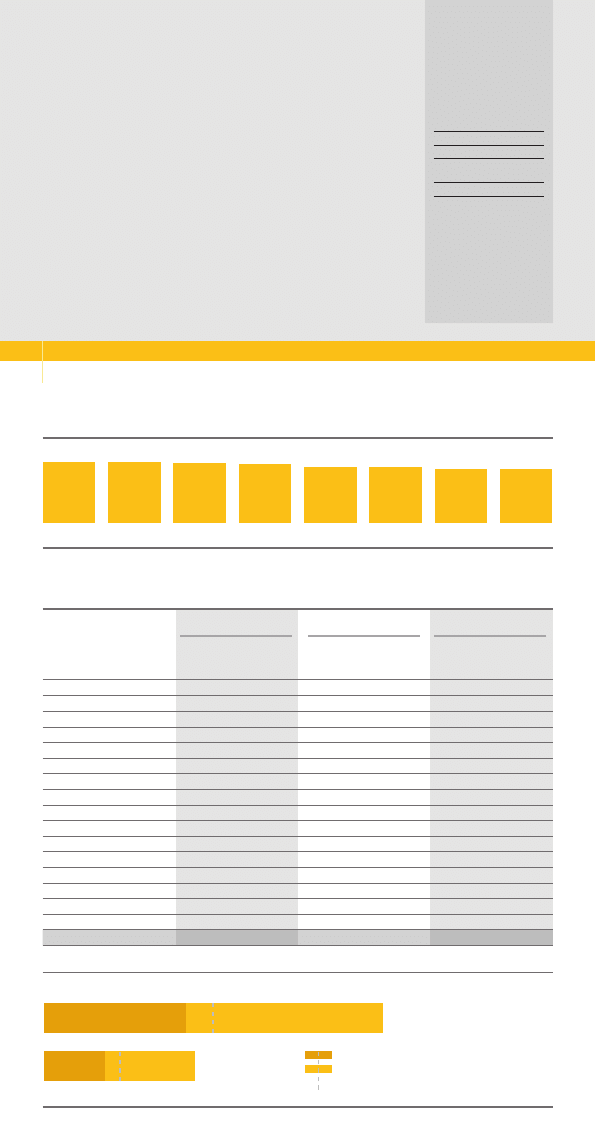
PERSONS EMPLOYED BY SECTOR OF ACTIVITY
2001-2011, percentage composition
2011
2006
2001
Agriculture
4.3%
Agriculture
4.6%
Agriculture
3.7%
Industry
30.1%
Industry
30.8%
Industry
28.5%
Services
65.6%
Services
64.6%
Services
67.8%
LABOUR MARKET
Persons employed: all individuals aged 15 and over that in the ref-
erence week:
■
have carried out at least 1 hour’s paid work
■
have carried out at least 1 hour’s unpaid work in a family business
■
are absent from work (i.e. for holidays or illness)
Job-seekers: unemployed aged 15-74 that:
■
have been active on job search in the 30 days preceding the
interview and would be available to start work within 2 weeks
after the interview
■
will begin a new work within 3 months from interview and would
be able to start work within 2 weeks after the interview
FIXED-TERM EMPLOYED
PERSONS ON TOTAL
EMPLOYEES IN 2011
TOTAL
EU27
14.1
Italy
13.4
Germany
14.7
Spain
25.3
France
15.3
AGED 15-24
EU27
42.5
Italy
49.9
Germany
56.0
Spain
61.4
France
55.0
percentage values
18
PERSONS EMPLOYED BY OCCUPATION AND EMPLOYMENT CONTRACT
2011, thousands of people
SELF-EMPLOYED: 5,727
EMPLOYEES: 17,240
TOTAL: 22,967
19,416
3,551
full time
part time
14,415
2,825
full time
part time
5,001
full time
726
part time
2011
2001
Employees
71.9%
Self-employed
28.1%
Employees
75.1%
Self-employed
24.9%
PERSONS EMPLOYED
BY OCCUPATION
2001 and 2011,
percentage composition
PERSONS EMPLOYED BY OCCUPATION, BRANCH AND GEOGRAPHICAL AREA
2011, thousands of people
North
Centre
South and the Islands
Italy
AGRICULTURE
Employees
93
50
270
413
Self-employed
217
68
153
438
Total
310
117
423
850
INDUSTRY
Employees
3,258
929
1,039
5,226
Self-employed
721
274
317
1,312
Total
3,979
1,203
1,356
6,538
SERVICES
Employees
5,738
2,625
3,238
11,601
Self-employed
1,897
881
1,199
3,978
Total
7,636
3,506
4,437
15,579
TOTAL
Employees
9,090
3,603
4,547
17,240
Self-employed
2,835
1,223
1,668
5,727
Total
11,925
4,826
6,216
22,967
UNEMPLOYMENT RATES
IN 2011
TOTAL
Males
7.6
Females
9.6
Total
8.4
AGED 15-24
Males
27.1
Females
32.0
Total
29.1
LONG TERM
Males
3.8
Females
5.0
Total
4.3
percentage values
ACTIVITY RATES BY GEOGRAPHICAL AREA AND SEX
2011, percentage values
77.7
Males
Females
Total
North
60.8
69.3
75.8
Centre
56.8
66.2
65.5
South and the Islands
36.8
51.0
73.1
Italy
51.5
62.2
LABOUR MARKET
19
key points
SEMI-SUBORDINATE WORKERS BY GEOGRAPHICAL AREA, SECTOR OF ACTIVITY AND SEX
2011, percentage composition
GEOGRAPHICAL AREA
SECTOR OF ACTIVITY
SEX
TOTAL SEMI-SUBORDINATE WORKERS: 309,000
Centre
25.4%
South and
the Islands
26.0%
North
48.6%
Services
88.0%
Industry
11.3%
Agriculture
0.7%
Females
55.8%
Males
44.2%
LABOUR INDICATORS BY SEX AND GEOGRAPHICAL AREA
2011, percentage values
Activity
Employment
Employment
rate
rate
rate
(aged 15-64)
(aged 15-64)
SEX
Males
73.1
67.5
7.6
Females
51.5
46.5
9.6
GEOGRAPHICAL AREA
North
69.3
65.2
5.8
Centre
66.2
61.1
7.6
South and the Islands
51.0
44.0
13.6
Total
62.2
56.9
8.4
Activity rate: ratio of labour force to the correspondent reference
population
Employment rate: ratio of persons employed to the correspondent
reference population
Unemployment rate: ratio of job-seekers to labour force
Long-term unemployment rate: ratio of job-seekers for more than
12 months to labour force
Semi-subordinate workers: employer-coordinated freelance
workers
Project workers: their work must be referable to one or more
projects or phases thereof
WELFARE
Disability, old age, length of service and
survivors’ pensions: paid in case of impaired
work abilities; due to age limits or at the end
of a full insurance career and to survivors in
case of death
Compensatory pensions: indemnities paid by
reason of impairment or death (to survivors in
this case) caused by an event occurred on the
job
Social assistance pensions: include non-con-
tributory pensions, social allowances, pen-
sions for the blind and partially-sighted, for
the deaf and the invalid and war pensions
Retirement rate: percent ratio of number of
pensions to resident population on 31
December of the year
Relative benefit index: percent ratio of avera-
ge amount of pension to GDP per inhabitant
PENSIONS
2010
Disability
Compensatory
Assistance
Total
old age and length
of service, survivors’
Number (thousands)
18,621
880
4,262
23,763
Total amount (millions of euro)
233,551
4,414
20,512
258,477
Average yearly amount (euro)
12,543
5,015
4,812
10,877
Expenditure/GDP
15.03
0.28
1.33
16.64
Retirement rate
30.72
1.45
7.03
39.20
Relative benefit index
48.93
19.31
18.92
42.46
2010
2005
2000
1995
1990
1985
1980
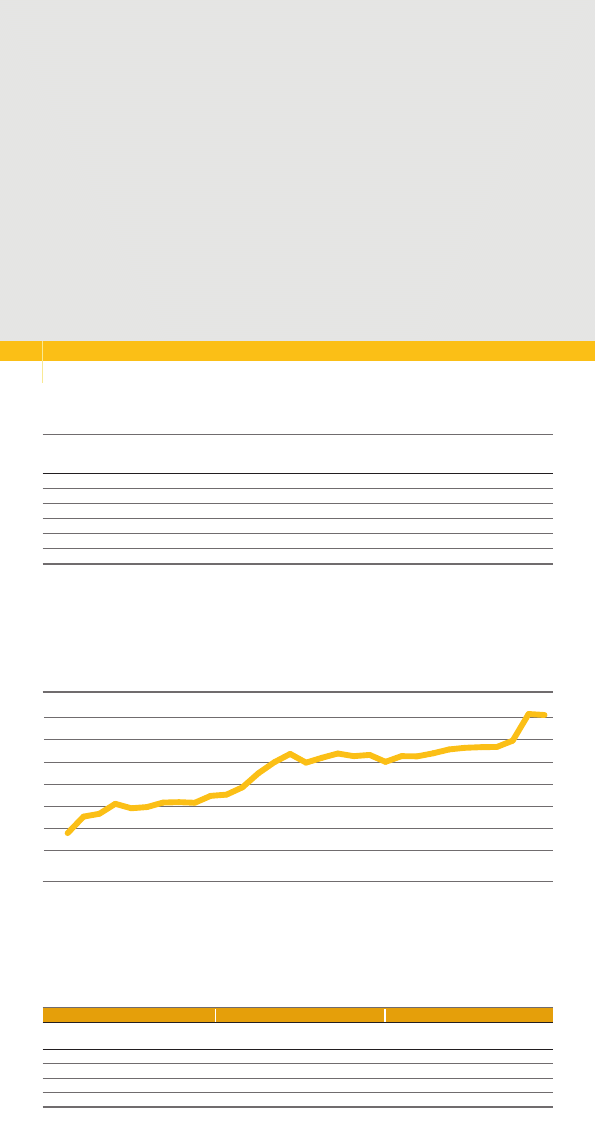
10.84
12.12
12.73
14.30
14.34
15.03
16.64
20
PENSIONERS AND AVERAGE ANNUAL GROSS PENSION INCOMES BY GEOGRAPHICAL AREA
2009 and 2010
2009
2010
number
average income
number
average income
(euro)
(euro)
North
7,867,341
16,258
7,868,019
16,585
Centre
3,268,474
16,568
3,260,789
16,896
South and the Islands
5,100,887
13,708
5,093,784
13,999
Italy*
16,236,702
15,519
16,222,592
15,836
*the total amount does not include pensioners residing abroad and a few cases for which it was not possible to identify the residence
TOTAL EXPENDITURE FOR PENSIONS
1980-2010, percentage of GDP
Agriculture, forestry and fishing
3.5%
Industry
(excl. Construction)
23.7%
Construction
6.3%
Services
66.5%
1992 Value added * 731,357
Agriculture, forestry and fishing
2.0%
Industry
(excl. Construction)
18.6%
Construction
6.0%
Services
73.4%
2011 Value added * 1,414,432
REGIONAL SHARES
OF NATIONAL ECONOMY
IN 2009
GDP
North-west
31.8
North-east
22.6
Centre
21.7
South and the Islands
23.8
AWU
North-west
29.3
North-east
22.5
Centre
21.3
South and the Islands
26.8
percentage composition
Gross Domestic Product at market prices (GDP): final result of
the production activity of resident units. GDP is the sum of final
uses of goods and services (domestic consumption and gross
capital formation) plus exports and less imports of goods and
services
Value added at basic prices: difference between total production
and intermediate consumption used in production, net of taxes
and gross of subsidies on products
Annual working units (AWUs): are calculated by converting into
full-time units all work positions held by each person employed
during the reference period
ECONOMY
21
key points
VALUE ADDED AT BASIC PRICES BY SECTOR OF ACTIVITY
1992 and 2011, percentage composition
RESOURCES AND USES ACCOUNT
2008-2011, millions of euro
2008
2009
2010
2011
CURRENT PRICES
GDP at market prices
1,575,144
1,519,695
1,553,166
1,580,220
Imports of goods and services (Fob)
461,333
368,947
443,422
477,738
Total resources
2,036,477
1,888,642
1,996,588
2,057,958
Domestic consumption
1,247,413
1,241,278
1,268,885
1,293,311
Gross fixed capital formation
330,649
294,680
304,499
308,561
Changes in inventories
8,006
-9,902
7,633
-825
Valuables
2,182
1,706
2,337
2,432
Exports of goods and services (Fob)
448,227
360,880
413,235
454,479
Total uses
2,036,477
1,888,642
1,996,589
2,057,958
CHAINED-LINKED VOLUMES (IN MONETARY TERMS) WITH REFERENCE YEAR 2005
GDP at market prices
1,475,412
1,394,347
1,419,508
1,425,627
Imports of goods and services (Fob)
410,433
355,555
400,660
402,330
Total resources
1,886,105
1,748,822
1,817,552
1,825,330
Domestic consumption
1,157,322
1,146,084
1,154,091
1,153,582
Gross fixed capital formation
304,740
268,982
274,651
269,531
Changes in inventories
-
-
-
-
Valuables
1,385
980
1,088
1,101
Exports of goods and services (Fob)
416,006
343,180
382,956
404,501
Total uses
1,886,105
1,748,822
1,817,552
1,825,330
*millions of euro at current prices
General Government: includes all institu-
tional units whose main function is to pro-
duce non-market services for individual and
collective consumption and to perform ope-
rations of redistribution of national income
and wealth. Their activities are mainly
financed by compulsory payments made by
units belonging to other sectors
Government debt: the amount of General
Government liabilities (EU definition).
Calculations are made according to the
methodological criteria set by the Council
Regulation (EC) n° 3605/93
Government deficit (or net lending/net bor-
rowing): the difference between revenues
and expenditure is the balancing item in the
account. It is the sum of current balance
and capital balance
Primary balance: net lending (+)/net bor-
rowing (-) less consolidated interests expen-
diture
NON FINANCIAL CONSOLIDATED ACCOUNT OF GENERAL GOVERNMENT
2008-2011, millions of euro
2008
2009
2010
2011
EXPENDITURES
Final consumption expenditure
315,406
324,684
327,431
324,220
Social benefits in money
277,183
291,495
298,418
305,122
Other current expenditures
41,486
44,460
44,532
43,285
Interests payable
81,312
70,863
71,112
78,021
Total current expenditures
715,387
731,502
741,493
750,648
Gross fixed capital formation
35,316
38,404
32,346
32,099
Other capital transfers
23,893
28,530
21,472
15,818
Total capital expenditures
59,209
66,934
53,818
47,917
Total expenditure
774,596
798,436
795,311
798,565
REVENUES
Current taxes
455,486
429,255
444,095
448,340
Social contributions
215,809
212,555
213,398
216,340
Other current revenues
56,629
58,246
59,237
61,032
Total current revenues
727,924
700,056
716,730
725,712
Capital taxes
488
12,256
3,497
6,963
Other capital revenues
3,484
3,378
3,627
3,527
Total capital revenues
3,972
15,634
7,124
10,490
Total revenues
731,896
715,690
723,854
736,202
CURRENT BALANCE
12,537
-31,446
-24,763
-24,936
GOVERNMENT DEFICIT
-42,700
-82,746
-71,457
-62,363
PRIMARY BALANCE
38,612
-11,883
-345
15,658
PRIMARY BALANCE
GOVERNMENT DEFICIT
1991
0.0
-11.3
2001
3.1
-3.1
2010
0.0
-4.6
2008
-2.7
2.5
2009
-5.4
-0.8
2011
1.0
-3.9
GOVERNMENT FINANCE
BALANCES
1991-2011,
percentage of GDP
2008
105.7
2001
108.2
2010
118.6
2009
116.0
2011
120.1
GOVERNMENT DEBT
2001-2011, percentage of GDP
22
ECONOMY
key points
30
34
38
42
46
2007
2008
2009
2010
2011
France
Italy
Germany
United Kingdom
Spain
EURO17
GROSS DOMESTIC PRODUCT PER CAPITA IN PURCHASING
POWER PARITIES IN 2010 (EU27=100)
SOME INDICATORS IN EUROPEAN COUNTRIES
2011, percentage values
Government
Government
Inflation
Employment
deficit (GDP)
debt (GDP)
rate
rate
Austria
-2.6
72.2
3.6
72.1
Belgium
-3.7
98.0
3.5
61.9
Cyprus
-6.3
71.6
3.5
68.1
Finland
-0.5
48.6
3.3
69.0
France
-5.2
85.8
2.3
63.8
Germany
-1.0
81.2
2.5
72.5
Greece
-9.1
165.3
3.1
55.6
Ireland
-13.1
108.2
1.2
59.2
Italy
-3.9
120.1
2.9
56.9
Luxembourg
-0.6
18.2
3.7
64.6
Malta
-2.7
72.0
2.4
57.6
Netherlands
-4.7
65.2
2.5
74.9
Portugal
-4.2
107.8
3.6
64.2
Slovakia
-4.8
43.3
4.1
59.5
Slovenia
-6.4
47.6
2.1
64.4
Spain
-8.5
68.5
3.1
57.7
Bulgaria
-2.1
16.3
3.4
58.5
Denmark
-1.8
46.5
2.7
73.1
Estonia
1.0
6.0
5.1
65.1
Latvia
-3.5
42.6
4.2
61.8
Lithuania
-5.5
38.5
4.1
60.7
Poland
-5.1
56.3
3.9
59.7
United Kingdom
-8.3
85.7
4.5
69.5
Czech Republic
-3.1
41.2
2.1
65.7
Romania
-5.2
33.3
5.8
58.5
Sweden
0.3
38.4
1.4
74.1
Hungary
4.3
80.6
3.9
55.8
Euro area 17
-4.1
87.2
2.7
64.2
EU27
-4.5
82.5
3.1
64.3
FISCAL DRAG IN SOME EUROPEAN COUNTRIES
2007-2011, percentage of GDP
EU27
100.0
Euro countries
108.0
Austria
126.0
Belgium
119.0
Cyprus
99.0
Finland
115.0
France
108.0
Germany
118.0
Greece
90.0
Ireland
128.0
Italy
101.0
Luxembourg
271.0
Malta
83.0
Netherlands
133.0
Portugal
80.0
Slovakia
74.0
Slovenia
85.0
Spain
100.0
Bulgaria
44.0
Denmark
127.0
Estonia
64.0
Latvia
51.0
Lithuania
57.0
Poland
63.0
United Kingdom
112.0
Czech Republic
80.0
Romania
46.0
Sweden
123.0
Hungary
65.0
23
ECONOMY
Euro area: since 1 January 2001 is constitu-
ted by Austria, Belgium, Finland, France,
Germany, Greece, Ireland, Italy, Luxembourg,
Netherlands, Portugal and Spain; Slovenia
joined on 1 January 2007; Cyprus and Malta
on 1 January 2008, Slovakia on 1 January
2009 and Estonia on 1 January 2011
European Union: is constituted by 27
Countries, the 17 Euro Countries plus
Bulgaria, Denmark, Latvia, Lithuania, Poland,
UK, Czech Republic, Romania, Sweden, and
Hungary
Purchasing power parities: indicator that eli-
minates differences in price levels between
countries allowing volume comparisons of GDP
PRICES
Output prices index: refers to changes in
time of prices applied by industrial enterpri-
ses, excluding construction companies
Consumer prices index: measures the
variation in time of price of a “basket” of
goods and services. Istat calculates the
following three consumer price indices:
■
consumer price index for the whole
nation (NIC), based on the entire present
population’s consumptions
■
consumer price index for blue and white-
collar workers households (FOI) based
on consumptions of households whose
reference person is an employee
■
harmonised index of consumer prices
(HICP), which refers to households’
consumption of goods and services and
gives comparable measures of inflation at
the European level
Goods and services by purchase frequency:
■
high: food and beverages, tobaccos, rent,
fuels
■
medium: clothing, electricity, water, and
waste disposal rates, medicines, books
■
low: household appliances, transport
means, audiovisual, photographic and
computer equipment
24
PRICE INDICES
2011, trend percentage changes
GENERAL
INDEX
Consumer
goods
OUTPUT PRICE
CONSUMER PRICE
Capital
goods
Intermediate
goods
Energy
NIC
FOI
4.8
2.9
5.7
9.6
2.8
2.7
HICP
2.9
1.3
*
PURCHASE FREQUENCY
PRODUCT TYPE
20.4
Goods
28.7
Services
31.8
High
22.2
Medium
13.3
Low
24.0*
24.0*
CONSUMER PRICE INDEX (NIC) BY CHAPTER OF EXPENDITURE AND PRODUCT TYPE
2007-2011, trend percentage changes
2007
2008
2009
2010
2011
Food and non-alcoholic beverages
2.9
5.4
1.8
0.2
2.4
Alcoholic beverages and tobacco
3.4
4.2
3.8
2.8
3.5
Clothing and footwear
1.4
1.7
1.3
1.0
1.7
Housing, water, electricity gas and other fuels
2.6
6.4
-0.1
1.2
5.1
Furnishings, household items and services
2.4
3.1
1.8
1.1
1.7
Health services
-0.3
0.2
0.6
0.3
0.5
Transport
2.2
5.2
-2.2
4.2
6.2
Communications
-8.4
-4.2
-0.3
-0.9
-1.2
Recreation and culture
1.1
0.8
0.6
0.6
0.3
Education
2.2
2.3
2.2
2.5
2.3
Hotels and restaurants
2.7
2.5
1.2
1.6
2.2
Miscellaneous goods and services
2.3
3.0
2.6
3.2
3.2
General index
1.8
3.3
0.8
1.5
2.8
Goods
1.5
3.6
0.0
1.3
3.1
Services
2.1
3.0
1.9
1.9
2.3
CONSUMER PRICE INDEX (NIC) BY PRODUCT TYPE AND PURCHASE FREQUENCY
2001/2011, percentage changes
* excluding tobaccos
* general index
Foreign trade statistics: are based on the results of the surveys
on Italian trade with EU and non-EU countries. The former, in
accordance with the Intrastat system (introduced in January
1993), is carried out on a monthly basis with quarterly and yearly
integrations. Data are provided by competent Customs offices.
The survey on Italian trade with non-EU countries, based on
customs declarations (single administrative document), is car-
ried out on a monthly basis
FOREIGN TRADE
IN 2011*
millions of euro
*provisional data
EXTERNAL TRADE
25
key points
Germany
France
China Netherlands Russia
Germany France
United
States
Switzerland
Spain
62,406
33,416
29,302
20,863
18,042
49,345
43,707
22,857
20,655
19,885
COUNTRIES TO WHICH ITALY EXPORTS
COUNTRIES FROM WHICH ITALY IMPORTS
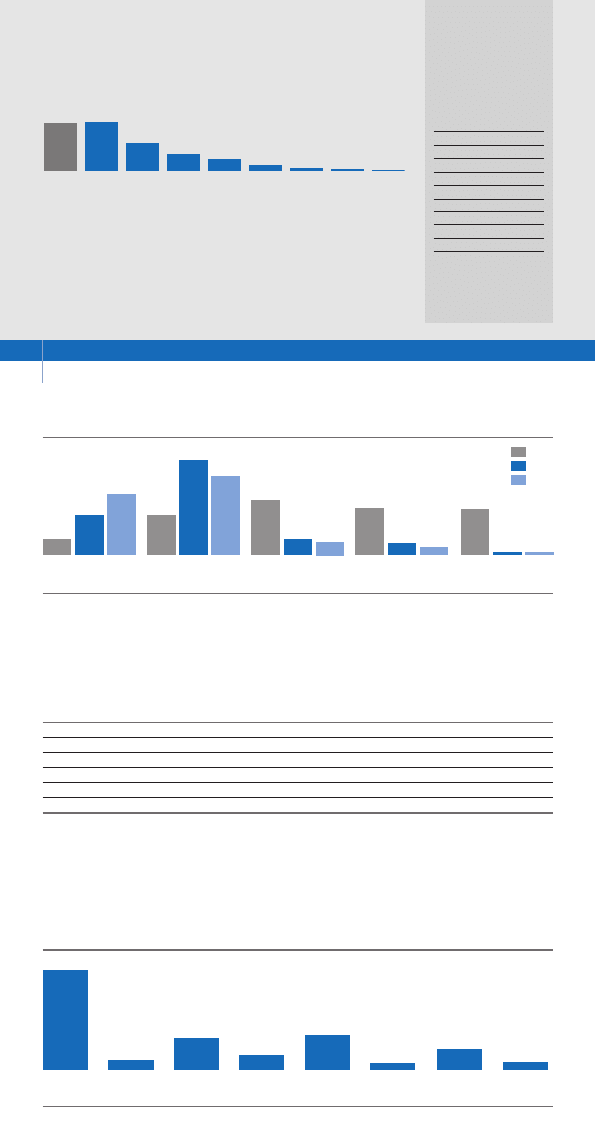
IMPORTS AND EXPORTS BY SECTOR OF ACTIVITY
2010 and 2011*, absolute values in millions of euro
2010
2011*
Imports
Exports
Imports
Exports
Products of agriculture, forestry and fishing
11,123
5,614
12,980
5,770
Mining and quarrying products
59,005
1,165
69,235
1,249
Food, beverages and tobacco
25,320
22,179
27,483
24,390
Textiles, clothing, leather and accessories
25,960
37,339
28,792
41,913
Wood and wood products; paper and printing
9,991
7,151
10,142
7,614
Coke and refined petroleum products
8,550
14,794
10,056
16,770
Chemicals and chemical products
32,122
22,575
36,337
24,911
Pharmaceutical, medical, chemical and botanical products
17,344
13,973
19,160
15,311
Rubber and plastics products
and other non-metallic mineral products
11,312
20,854
12,373
22,505
Basic metals and fabricated metal products
excluding machinery and equipments
36,107
39,350
42,433
48,343
Computer, electronic and optical equipment
33,871
11,604
29,848
12,881
Electrical equipment
13,292
19,380
13,715
20,298
Machinery and equipment n.e.c.
22,416
60,061
24,040
68,418
Transport equipment
37,901
34,507
38,114
36,408
Other manufactured products
10,647
18,918
10,891
19,993
Electricity, gas, steam and air conditioning supply
2,659
277
2,980
276
Other products n.e.c.
9,770
7,605
11,901
8,800
Total
367,390
337,346
400,480
375,850
* provisional data
* provisional data
EU countries
Non-EU countries
Imports
Exports
186,953
165,367
213,526
210,482
ITALY’S MAIN TRADING PARTNERS
2011*, absolute values in millions of euro
Common
wheat
Durum
wheat
Maize
Barley
Rice
Oil seeds
Fruit trees
Grapevine
Olive trees
Citrus trees
Rotation
forage
Vegetables
Permanent meadows
and pastures
543
1,419
246
304
424
1,123
890
262
129
1,918
300
3,434
664
USED AREA BY MAIN
CROPS GROWN*
Crop year 2009-2010,
thousands of hectares
AGRICULTURAL HOLDINGS AND FARM WORKERS*
Crop year 2009-2010
North
Centre
South
Italy
and the Island
Agricultural holdings**
397
252
972
1,621
Utilised agricultural area (UAA)**
4,569
2,192
6,095
12,856
Average UAA per holding
11.5
8.7
6.3
7.9
Working days per person
98.6
68.6
49.3
64.8
Persons working per holding
2.5
2.2
2.4
2.4
Days of work per holding
248.2
150.3
117.7
154.7
* 6
th
Agriculture census ** thousands
LIVESTOCK NUMBERS
ON 1 DECEMBER 2011
Cattle and buffaloes
6,252
Pigs
9,351
Sheep and goats
8,903
thousands
SLAUGHTERED ANIMALS
IN 2011
Cattle and buffaloes
3,616
Pigs
13,097
Sheep and goats
5,513
thousands
Agricultural holding: economic-technical unit with land, equip-
ment and machinery for farming, forestry and livestock. The
undertaking is run by a tenant, i.e. a physical person, a company
or a body assuming the corporate risk. The category also inclu-
des undertakings exclusively engaged in livestock raising
without farmland. It does not include undertakings exclusively
engaged in forestry
26
AGRICULTURE
LICENSED RURAL ACCOMODATIONS BY ACTIVITY* AND GEOGRAPHICAL AREA
2010
Accommodation
Food service
Tasting
Other activities**
Total
North
6,555
4,506
1,234
4,453
8,576
Centre
6,471
2,247
1,940
4,603
6,541
South and the Islands
3,478
3,161
662
2,365
3,902
Italy
16,504
9,914
3,836
11,421
19,019
* a farm may be authorized to perform one or more types of rural tourism activities
** riding, hiking, nature explorations, trekking, mountain bike, courses, sport, etc. are included
* 6
th
Agriculture census
HARVEST OF MAIN CROPS
2007, thousands of quintals
Wheat
Maize
Tomato
Sugar
Olive
Citrus and
beet
trees
fruit trees
North
27,673
77,464
24,005
29,465
420
38,270
Centre
15,096
5,250
5,302
1,681
4,045
3,700
South and the Islands
25,730
2,245
26,978
4,353
26,712
53,931
Italy
68,499
84,959
56,285
35,499
31,177
95,901
Campania
Abruzzo
Friuli-V.G.
Basilicata
Sardegna
4,157
31
1,879
1,641
11,148
1,774
100
8,744
4,236
1,281
1,242
2,013
4,088
391
2,643
10,226
206
599
7,464
925
Piemonte
Valle d'Aosta
Lombardia
Trentino-A.A.
Veneto
Liguria
Emilia-R.
Toscana
Umbria
Marche
Lazio
Molise
Puglia
Calabria
Sicilia
HARVEST OF WINE GRAPES
2010,
thousands of quintals
75,891
67,707
27,036
28,160
26,541
28,128
19,182
19,911
Fungicides
Insecticides
and acaricides
Herbicides
Other plant protection
products
2006
2010
PLANT PROTECTION PRODUCTS PLACED ON THE MARKET FOR AGRICULTURAL USE
2006 and 2010, tons
key points
Harvest and use of grapes: 64.7 millions of quintals of wine
grapes (+3.5% over 2009) and 13.6 millions of quintals of table
grapes (+1.5%) were harvested in 2010. The production of wine
and must was 42.7 millions of hectolitres. The 2010 production
of wines with D.O.C. (Certification of Controlled Origin) or
D.O.C.G.(Certification of Controlled and Guaranteed Origin) rep-
resented 35.2% of the total, while those with I.G.T. label (Typical
Geographical Indication) 31.2% and the table wines 33.6%. White
wine was 49.6% and red and rose wine was 50.4%
Plant protection products (pesticides): are the products used
against all harmful organisms or to prevent the action of such
organisms (infectious diseases, plant pathogens, insects, mol-
luscs weeds)
HARVEST OF TABLE GRAPES
IN 2010
North
26
Centre
205
South and the Islands 13,379
Italy
13,610
thousands of quintals
27
AGRICULTURE
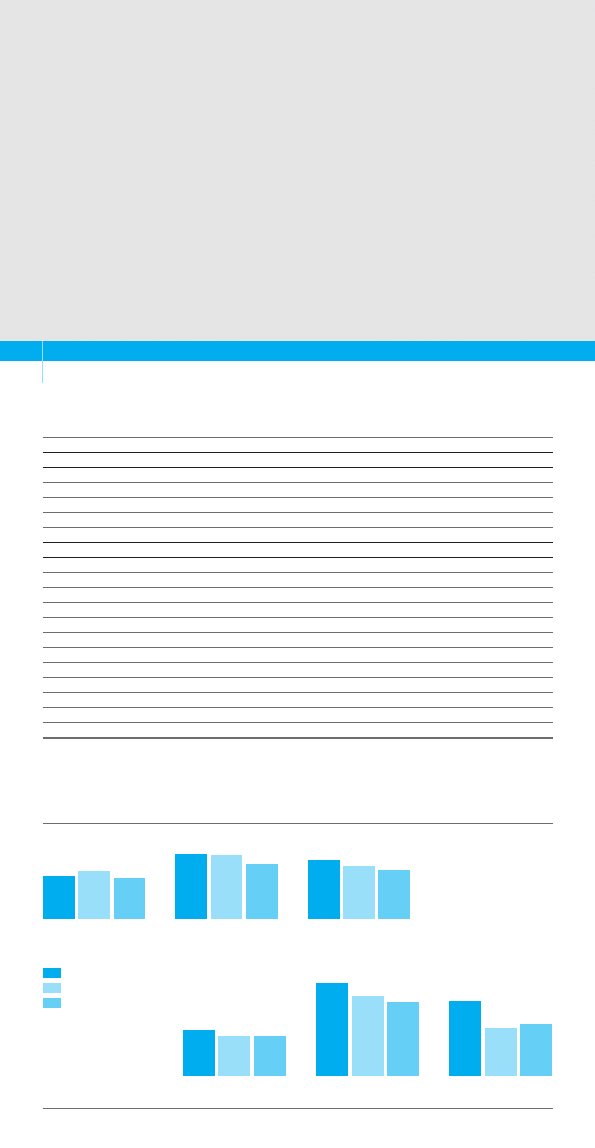
INDUSTRY AND SERVICES
Enterprises: organisations carrying out eco-
nomic activities at a professional level for the
production of market goods or services
Workers: employees (full time, part-time or
under training and employment contracts)
and self-employed in enterprises
Cost of labour: includes all items of
employees’ gross remuneration (managers,
executive officers, white - and blue-collar
workers, sales persons, trainees and home
workers): basic wage, cost-of-living allowan-
ce, overtime, holyday pays, and severance pay
shares
Manufacturing activities: include food, texti-
le and clothing, leather, wood, print and
publishing, rubber and plastics, mechanic,
oil, chemical and transportation industries,
manufacturers of electric machinery, elec-
tric and optical equipment, metallic and
nonmetallic products
Value added: is the increase in the economic
value of goods and services bought in from
other enterprises by means of production
inputs (labour, capital and business activity).
It is defined as total sales revenue less inter-
mediate costs
MAIN ECONOMIC INDICATORS OF ENTERPRISES BY SECTOR OF ACTIVITY AND SIZE
2009, thousands of euro
1-19 workers
20 workers and over
Total
Industry (excluding construction)
Construction
Services
1-19 workers
20 workers and over
Total
27.2
29.8
25.6
40.8
39.9
34.3
36.8
33.0
30.7
29.6
25.8
25.8
59.7
51.5
47.6
48.3
31.0
33.7
COST OF LABOUR
PER EMPLOYEE
VALUE ADDED
PER PERSON EMPLOYED
28
INDUSTRY AND SERVICES ENTERPRISES BY SIZE AND SECTOR OF ACTIVITY
2009
1-19 workers
20 and over workers
Total
Industry (excluding Construction)
418,401
34,678
453,079
Mining and quarrying
2,347
225
2,572
Manufacturing activities
406,186
32,926
439,112
Supply of electricity, gas, steam and conditioned air
2,650
280
2,930
Water supply; sewerage, waste management and remediation
7,218
1,247
8,465
Construction
614,897
8,458
623,355
Services
3,268,572
38,536
3,307,108
Wholesale and retail trade; repair of motor vehicles and motorcycles
1,171,747
12,176
1,183,923
Transportation and storage
131,708
5,673
137,381
Accomodation and restaurant services
286,782
4,191
290,973
Information and communication services
98,126
2,530
100,656
Real estate activities
214,141
207
214,348
Professional, scientific and technical activities
704,617
2,466
707,083
Renting services, travel agencies, business support services
144,162
5,356
149,518
Education
23,655
652
24,307
Human health and social work activities
234,949
3,396
238,345
Arts, sports, entertainment and recreation
60,033
878
60,911
Other service activities
198,652
1,011
199,663
Total
4,301,870
81,672
4,383,542

Information and Communication Technologies (ICT): used in
treating and elaborating information or in communicating. They
are also utilized to make products that use electronic processes
Computer: includes supercomputer, mainframe, minicomputer,
workstation, personal computer, nettop, portable computer,
palmtop (PDA), smartphone
Broadband: is referred to the used technology: xDSL, optical
fibres and other fixed connections to Internet
INDUSTRY AND SERVICES
29
key points
PERSONS EMPLOYED IN INDUSTRY AND SERVICES ENTERPRISES BY SIZE AND SECTOR OF ACTIVITY
2009
1-19 workers 20 workers and over
Total
Industry (excluding Construction)
1,691,749
2,776,383
4,468,132
Mining and quarrying
12,149
23,585
35,734
Manufacturing activities
1,636,851
2,531,881
4,168,732
Supply of electricity, gas, steam and conditioned air
7,686
77,757
85,443
Water supply; sewerage, waste management and remediation
35,063
143,160
178,223
Construction
1,524,709
386,648
1,911,357
Services
6,743,893
3,836,752
10,580,645
Wholesale and retail trade; repair of motor vehicles and motorcycles
2,542,462
980,409
3,522,871
Accomodation and food service activities
351,579
773,575
1,125,154
Transportation and storage
958,637
301,140
1,259,777
Information and communication
238,161
345,823
583,984
Real estate activities
328,389
10,426
338,815
Professional, scientific and technical activities
1,032,190
190,764
1,222,954
Renting services, travel agencies, business support services
339,972
777,310
1,117,282
Education
58,227
28,736
86,963
Human health and social work activities
381,280
331,312
712,592
Arts, sports, entertainment and recreation
119,331
49,350
168,681
Other service activities
393,665
47,907
441,572
Total
9,960,351
6,999,783
16,960,134
VALUE ADDED OF THE INDUSTRY AND SERVICES ENTERPRISES BY SIZE AND SECTOR OF ACTIVITY
2009, millions of euro
1-19 workers 20 workers and over
Total
Industry (excluding Construction)
50,145
165,881
216,026
Mining and quarrying
503
4,672
5,174
Manufacturing activities
45,834
134,422
180,257
Supply of electricity, gas, steam and conditioned air
2,287
18,467
20,754
Water supply; sewerage, waste management and remediation
1,521
8,320
9,841
Construction
39,365
19,916
59,281
Services
173,968
182,610
356,578
Wholesale and retail trade; repair of motor vehicles and motorcycles
57,902
46,981
104,883
Accomodation and food service activities
10,147
38,494
48,641
Transportation and storage
14,900
7,973
22,873
Information and communication
7,388
41,506
48,894
Real estate activities
15,324
2,084
17,407
Professional, scientific and technical activities
34,016
11,776
45,793
Renting services, travel agencies, business support services
8,099
19,559
27,658
Education
1,193
657
1,849
Human health and social work activities
16,168
9,381
25,549
Arts, sports, entertainment and recreation
3,370
2,490
5,860
Other service activities
5,461
1,708
7,169
Total
263,477
368,407
631,884
96.0
94.3
62.6
84.1
Personal computer
Internet
Web site
Broadband
ENTERPRISES WITH AT LEAST
10 PERSONS EMPLOYED
THAT USE ICT IN 2011*
* % of total enterprises
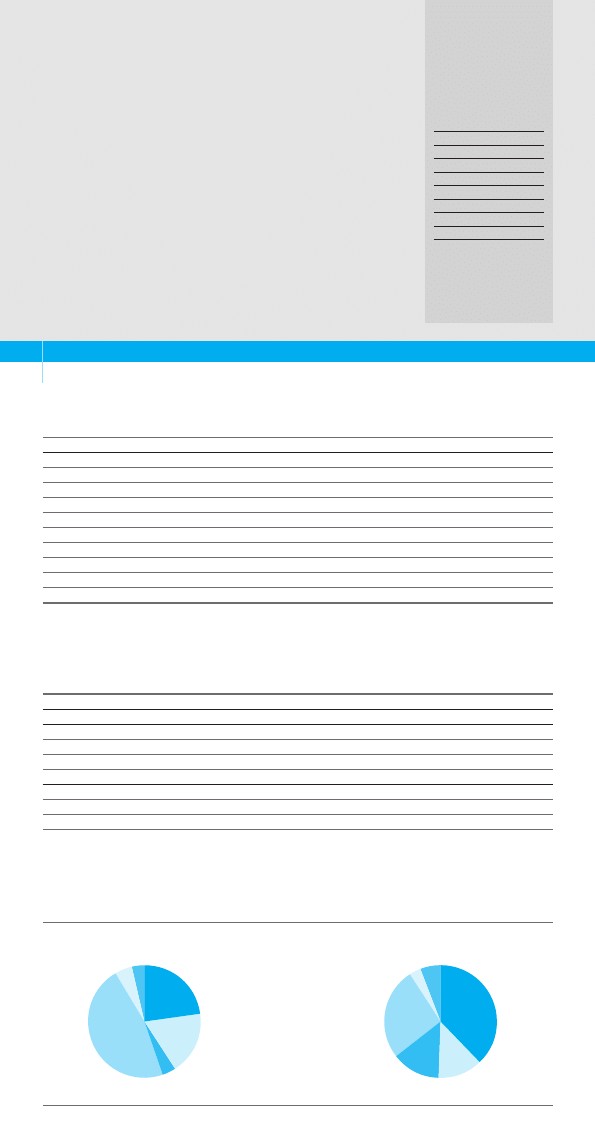
TOURISM
Collective accomodation establishments: include hotels, cam-
pings, resorts, rural tourism facilities, youth hostels, rooms and
flats for rent, holiday homes, alpine huts, bed and breakfast and
other establishments (rural residences and centres for study
stays)
Arrivals: number of guests spending at least one night in collec-
tive accommodation establishments
Nights spent: number of nights spent by guests in accommoda-
tion establishments
Average length of stay: ratio of number of nights spent to num-
ber of guests arrived
HOUSEHOLD AVERAGE
ACTUAL EXPENDITURE
FOR TRAVELS IN 2010
ITALY
All included
463
Full board
797
Overnight stay
526
ESTERO
All included
994
Full board
994
Overnight stay
448
euro
30
NIGHTS SPENT BY DESTINATION
2010, percentage composition
FOREIGNERS
ITALIANS
Other
3.5%
Spas
5.0%
Seaside resorts
46.7%
Lakeside resorts
3.8%
Mountain resorts
18.0%
Art towns
23.0%
Other
5.6%
Spas
3.5%
Seaside resorts
26.3%
Lakeside resorts
13.9%
Mountain resorts
12.8%
Art towns
37.9%
COLLECTIVE ACCOMMODATION ESTABLISHMENTS BY GEOGRAPHICAL AREA
2010
North
Centre
South and the Islands
Italy
Hotels
20,693
6,388
6,918
33,999
Campings and resorts
1,208
553
849
2,610
Rooms and flats for rent
61,328
6,671
3,131
71,130
Rural tourism facilities
6,328
7,058
3,253
16,639
Youth hostels
205
170
81
456
Holiday homes
1,109
701
412
2,222
Alpine huts
943
63
29
1,035
Other establishment
228
98
46
372
Bed and breakfast
8,022
5,420
8,410
21,852
Total
100,064
27,122
23,129
150,315
GUESTS OF ACCOMMODATION ESTABLISHMENTS BY GEOGRAPHICAL AREA
2010, thousands
North
Centre
South and the Islands
Italy
ITALIANS
Arrivals
29,908
12,387
12,725
55,020
Presences
111,781
44,543
54,016
210,339
Average stay (days)
3.74
3.60
4.24
3.82
FOREIGNERS
Arrivals
25,395
13,461
4,938
43,794
Presences
99,493
44,605
21,105
165,203
Average stay (days)
3.92
3.31
4.27
3.77
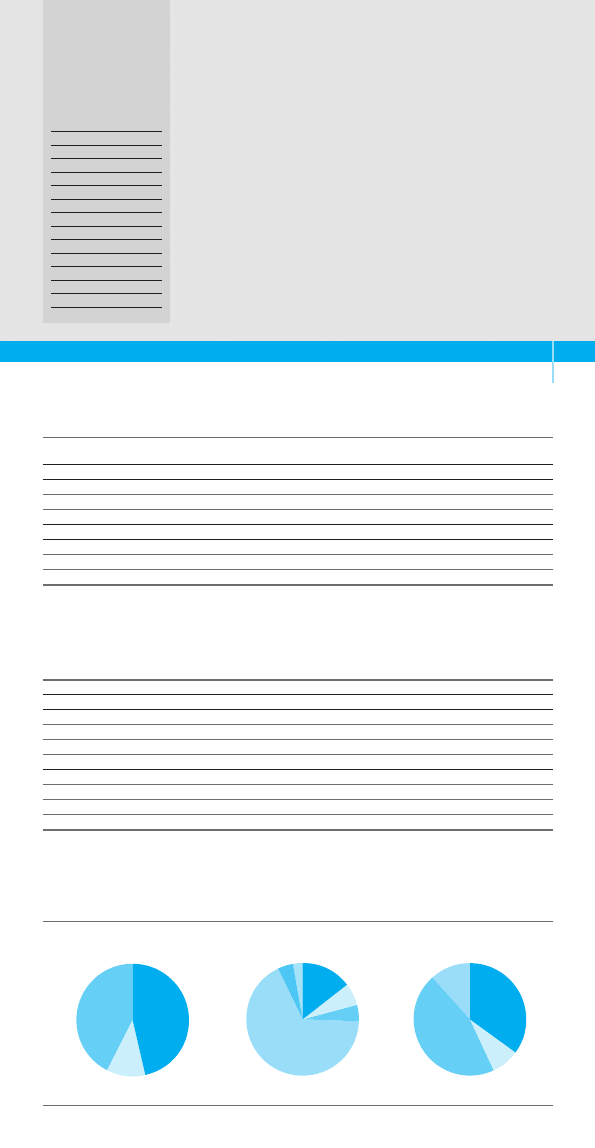
Holidays: trips made by Italians in the reference period for holiday,
leisure, recreation, visiting relatives and friends, religious purpose
and health treatments
Holiday trips by destinations: the most visited Italian region was
Emilia-Romagna (destination of 10.8 out of every 100 travels to
Italy), whereas the most popular international destination among
Italian residents was Spain (15.5 travels out of every 100 travels
abroad). Egypt was the most visited non-European Country (6% out
of every 100 travels abroad)
TRAVELS BY TOURIST
CHARACTERISTICS
IN 2010
SEX
Males
49.2
Females
50.8
AGE GROUP
Up to 14
18.5
15 to 24
9.5
25 to 44
36.3
45 to 64
27.6
65 and over
8.1
RESIDENCE AREA
North
54.8
Centre
23.1
South and the Islands
22.1
percentage composition
HOLIDAYS BY CERTAIN CHARACTERISTICS
2010, percentage composition
ACCOMMODATION
RESERVATION
MEANS OF TRANSPORT
None
41.9%
Through agency
11.1%
Direct
47.0%
Other
2.7%
Coach
4.5%
Car
67.2%
Ship
4.6%
Train
6.4%
Plane
14.6%
Other
11.5%
Private
45.4%
Rented
accomodation
8.1%
Hotel
35.0%
TOURISM
31
key points
HOLIDAYS BY QUARTER AND LENGTH*
2010
January-
April-
July-
October-
Total
March
June
September
December
THOUSANDS
1-3 nights
10,762
11,327
10,723
7,884
40,696
4 or more nights
6,474
7,640
28,728
3,910
46,754
Total
17,237
18,968
39,451
11,795
87,450
PERCENTAGE COMPOSITION
1-3 nights
26.4
27.8
26.3
19.4
100.0
4 nights or more
13.8
16.3
61.4
8.4
100.0
Total
19.7
21.7
45.1
13.5
100.0
HOLIDAYS BY MAIN DESTINATION*
2010, percentage composition
1-3 nights
4 nights or more
Total
Italy
91.3
74.4
82.2
North
45.0
32.1
38.1
Centre
25.6
12.6
18.6
South and the Islands
20.7
29.7
25.5
Abroad
8.7
25.6
17.8
EU countries
7.1
14.9
11.3
Other European countries
1.4
3.8
2.7
Rest of the world
0.1
6.9
3.8
Total
100.0
100.0
100.0
* differences in totals are due to roundings of absolute values
* differences in totals are due to roundings of absolute values

ANCONA
via Castelfidardo, 4
+39 071 5013091
BARI
piazza Aldo Moro, 61
+39 080 5789317
BOLOGNA
via Galleria Cavour, 9
+39 051 6566152
BOLZANO
via Canonico Michael Gamper, 1
+39 0471 418427
astat@provincia.bz.it
CAGLIARI
via Firenze, 17
+39 070 34998702
CAMPOBASSO
via Mazzini, 129
+39 0874 604858
CATANZARO
viale Pio X, 116
+39 0961 507629
FIRENZE
Lungarno Colombo, 54
+39 055 6237711
GENOVA
via S. Vincenzo, 4
+39 010 5849743
MILANO
via Porlezza, 12
+39 02 806132214
NAPOLI
via Giuseppe Verdi, 18
+39 081 4930190
PALERMO
via Giovan Battista Vaccarini, 1
+39 091 6751815
PERUGIA
via Cesare Balbo, 1
+39 075 5826411
PESCARA
via Caduta del Forte, 34
+39 085 44120511
POTENZA
via del Popolo, 4
+39 0971 377261
ROMA
via Cesare Balbo, 11 A
+39 06 46733102
TORINO
via Alessandro Volta, 3
+39 011 5166758
TRENTO
via Brennero, 316
+39 0461 497835
serv.statistica@provincia.tn.it
TRIESTE
via Cesare Battisti, 18
+39 040 6702558
VENEZIA-MESTRE
corso del Popolo, 23
+39 041 5070811
PA
RM
CZ
PZ
BA
NA
PE
CB
AN
PG
FI
CA
GE
BO
VE
TS
MI
TO
BZ
TN
CIS - STATISTICAL INFORMATION CENTRES
Istat is present over the whole territory thanks
to its Statistical Information Centres, the so-called CIS
They offer several services to meet the needs
of every type of user
Besides consulting and buying all publishing products,
it is also possible to:
■
receive help in searching for official statistical data
■
request customised statistical elaborations
■
obtain certificates of consumer price indices
■
subscribe to publishing products
You can contact the Statistical Information Centres
at the following address https://contact.istat.it

TERRITORY
ENVIRONMENT
POPULATION
HEALTH
LIVING CONDITIONS
JUSTICE
CULTURE
EDUCATION
LABOUR MARKET
WELFARE
ECONOMY
PRICES
EXTERNAL TRADE
AGRICULTURE
INDUSTRY AND SERVICES
TOURISM
20
12
Providing users with the tools to deepen
knowledge of Italy's social, economic and
environmental phenomena at various levels
of geographical detail. This is the mission
Istat is pursuing through accurate analyses
and investigations.
Divided into 16 themes, Italy in figures synthetically describes the main
economic, demographic, social and territorial aspects of Italy as well
as some basic habits and behaviours of its population.
In-depth sections, glossaries and brief methodological notes allow
even a non-expert public to take advantage of the information wealth.
Distributed to the international and domestic institutions, media and
opinion leaders, a free copy may be obtained from Istat Statistical
Information Centres in any region or autonomous province or upon
request to the Dissemination and Communication of Statistical
Information Directorate.
Alternatively, users may download its full version or browse each
chapter from the website homepage www.istat.it, where all data
produced by our Institute are available.
STATISTICAL INFORMATION:
A WEALTH TO THE COMMUNITY
Italy
in
figures
Wyszukiwarka
Podobne podstrony:
f polska w liczbach 2012
f polska w liczbach 2012
Kwiek, Marek The Growing Complexity of the Academic Enterprise in Europe A Panoramic View (2012)
f polska w liczbach 2012
Child Participation in Justice Report Poland 2012
Economic, energetic and environmental impact in short rotation coppice harvesting operations Włochy
Energy and CO2 analysis of poplar and maize crops for biomass production in Italy Włochy 2016
Economic evaluation of introduction of poplar as biomass crop in Italy Włochy 2014
Energetic and economic evaluation of a poplar cultivation for the biomass production in Italy Włochy
Cipriani Invisible Relligion or Diffused Religion in Italy
2012 2 MAR Common Toxicologic Issues in Small Animals
Rach koszt dla in 2012 CZESC 1
II Mlodzi w liczbach 12 11 2012
forms of concentration the landed property in italy
Industry and the?fects of climate in Italy
Włochy in, Testy
Poisonous and Edible Mushrooms An Introduction to Mushrooms in Norway (2012)
Ćwiczenie 9 Ogólna liczba bakterii 2012
więcej podobnych podstron