
NUMERICAL MODELS AND THEIR VALIDITY
IN THE PREDICTION OF HEAT CHECKING IN
DIE CASTING TOOLING
A. Srivastava, V. Joshi and R. Shivpuri
Manufacturing Research Group, The Ohio State University,
1971 Neil Avenue, 210 Baker Systems,
Columbus, Ohio 43210
Abstract
Heat checking is a major mode of failure of steel die surfaces in aluminum die
casting. This cracking initiates due to the large thermal shock experienced
by the die surface when it is rapidly quenched by the lubricant spray and
propagates due to thermal cycling during production due to thermal cycling.
Most of the previous studies have focused on the development of die steels and
heat treatments for high fracture toughness using controlled laboratory tests.
Only a few examples exist of their application to the mechanical behavior of
dies. This paper examines the efficacy of numerical models in understanding
the phenomenon and the prediction of cracking mode. It also provides insight
into the validity of using the typical thermal fatigue theories in conjunction
with the numerical models for life predictions in die casting environment.
Keywords:
Thermal Fatigue, heat checking, FEM modeling, Die Casting
INTRODUCTION
Die Casting is a high volume production process, which produces geo-
metrically complex parts of non-ferrous materials with thin walls and high
flow length to thickness ratio. Production rates of 200 parts per hour and
batch sizes of 300,000 parts are common [1]. Wear and failure of die is
significant loss for the die casting industry, owing to the high cost of dies
and production loss due to die downtime. The most important modes of
failure in die-casting dies are thermal fatigue, soldering and chemical attack
767
768
6TH INTERNATIONAL TOOLING CONFERENCE
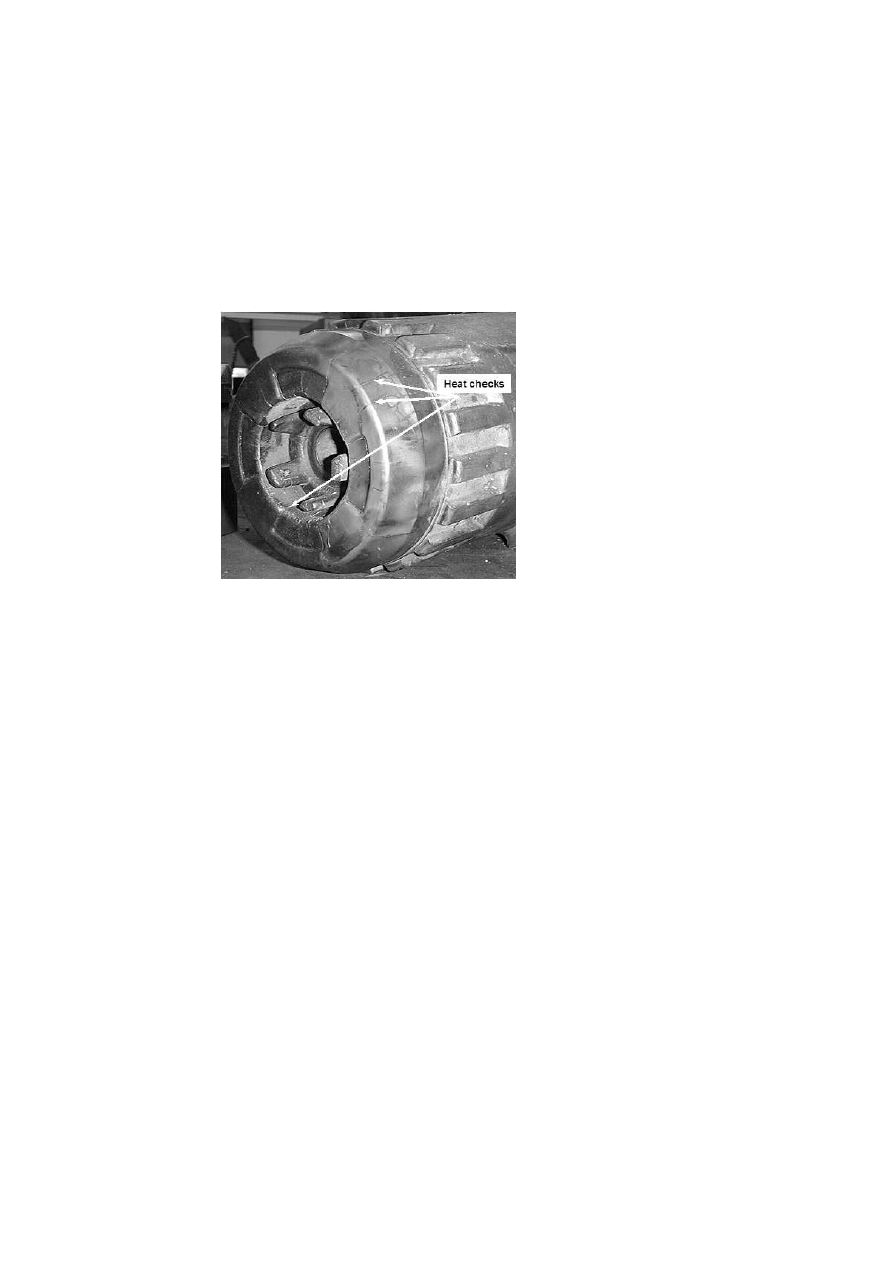
or corrosion. An example of thermal fatigue cracks in a large transmission
die is shown in Fig. 1. Alternate heating and cooling of the die during the
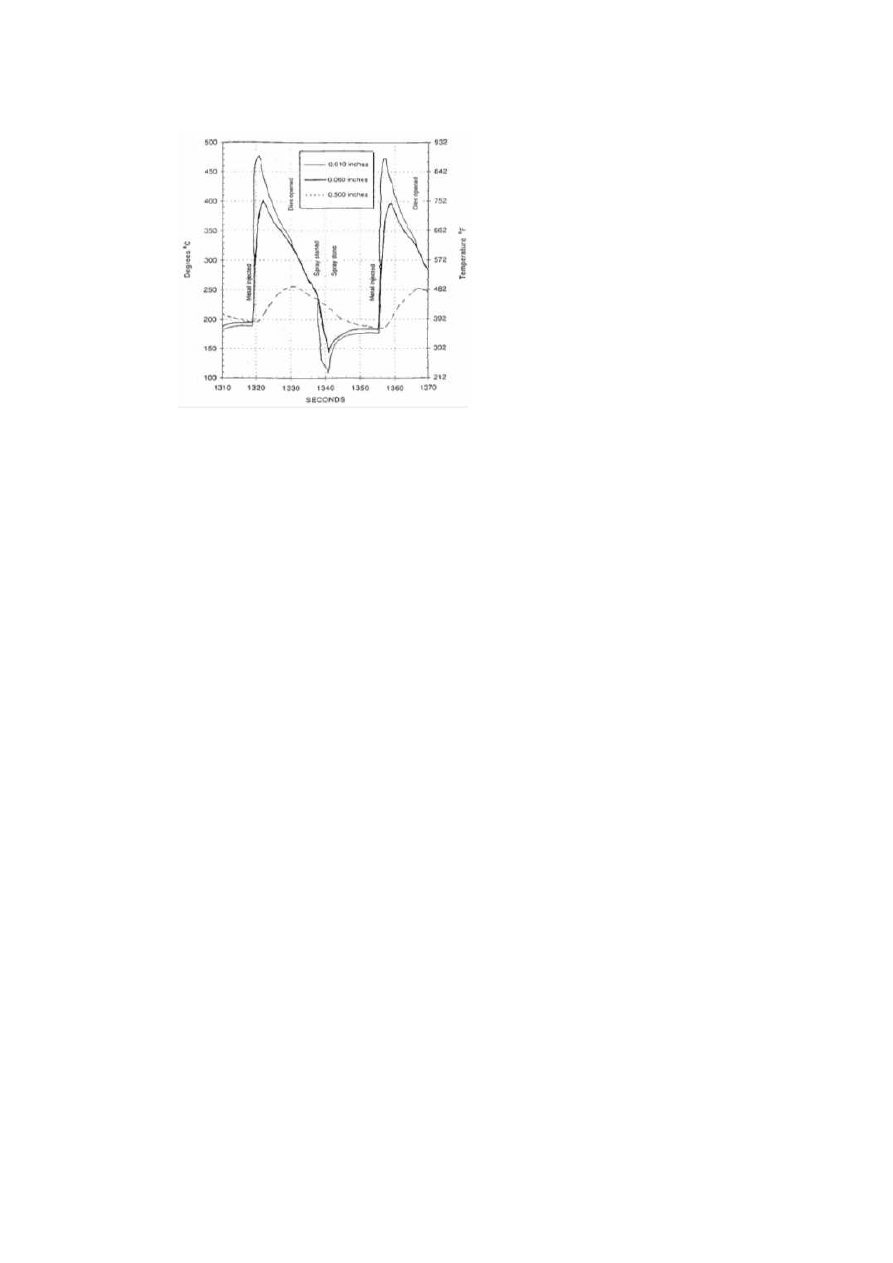
die casting cycle cause thermal fatigue. Figure 2 shows a typical temper-
ature cycle during die casting [2]. The profile shows the thermal gradient
between the surface and the core, which puts the die steels surface in com-
pression during heating and in tension during cooling. This leads to die
surface cracks, which are popularly known as ’heat checks’. These not only
lead to deterioration of the surface quality but also can propagate with time
leading to gross failure of the die.
Figure 1.
An example of thermal fatigue cracking.
A lot of efforts have been done to improve the material properties of die
casting dies to minimize heat checking. Special grades of H-13 and H-11
steels and rapid quenching techniques to suppress grain boundary cracking
have been developed which show improvement in terms of hardness and
toughness. Though these efforts have shown some improvement, yet they
do not eliminate the problem. So in order to avoid this failue over a die’s
life cycle, it is important to be able to predict the failure of die. Increasingly
in die casting companies, results of the controlled laboratory tests are used
to predict the cracking behavior of the actual dies in production. However
these tests do not take into account a number of varying factors in actual die
casting process conditions. Numerical models have been widely used in die
Numerical Models and Their Validity in the Prediction of Heat Checking in Die...
769
Figure 2.
Thermal Cycle in a Die Casting Die (Wallace, 97).
casting often to predict metal flow in the die cavity. Only a few examples
exist of their application to the mechanical behavior of dies. This paper
examines the efficacy of numerical models to the prediction of cracking and
die life. It examines the role played by the process conditions, material
properties (physical and mechanical), heat treatment, tempering and the
boundary conditions on the prediction of cracking. It also provides insight
into the validity of using the typical thermal fatigue theories in conjunction
with the numerical models for life predictions in die casting environment.
THERMAL FATIGUE CONCEPT
Low cycle fatigue has been described as a progressive failure phenomenon
brought about by the cyclic application of strains that extends into the plastic
range to produce failure in about 105 cycles or less. High cycle fatigue is
caused when elastic strain exceeds plastic strain [3], resulting in a failure in
more than 105 cycles. Thermal fatigue is categorized as low cycle fatigue.
Often the strains produced during thermal cycling are not high, yet plastic
range is reached due to decrease in yield strength at elevated temperature.
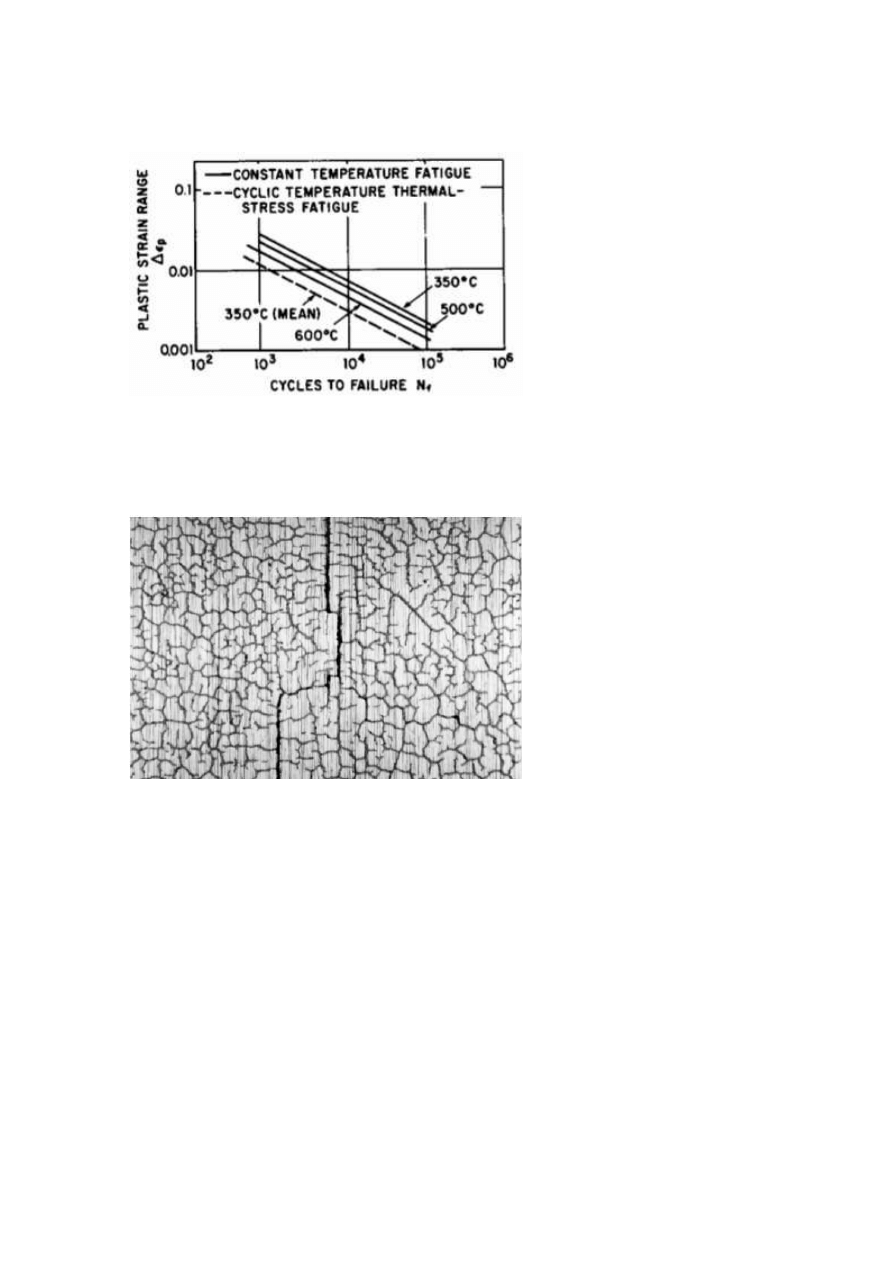
Figure 3 shows results of experiments comparing mechanical strain cycling

770
6TH INTERNATIONAL TOOLING CONFERENCE
at elevated temperature with thermal strain cycling in the low fatigue region
for AISI 347 stainless steel [4]. It must be observed that for equal values of
plastic strain range the number of cycles to failure is much less for thermally
cycled specimen. This result shows that although the mechanical low cycle
fatigue phenomenon and thermal low cycle fatigue phenomenon are very
similar, the use of mechanical low cycle fatigue results for prediction of
thermal fatigue life must be undertaken with care [5] as they significantly
over-predict the cycle to failure.
THERMAL FATIGUE CRACKING IN DIE CASTING
There are two modes of cracking in die casting:
Craze Cracking or Heat Checks
Heat checks are normally seen at flat
die surface, which do not have any stress concentration. Figure 4 shows
an example of such cracking. The direction of cracking depends on which
component of strain is dominant. At the center, the strain in both directions
is same because of symmetry, thus the cracking can occur in both directions.
Consider the direction of principle strain,
tan 2
θ
p
=
γ
xy
ε
x
− ε
y
,
where tan 2θ
p
is direction of principle strain, ε
x
, ε
y
are strains in X and Y
direction and γ
xy
is shear strain.
At center, ε
x
=
ε
y
and γ
xy
= 0
,
tan 2
θ
p
= 0
,
2
θ
p
= 0
◦
and 180
◦
,
θ
p
= 0
◦
and 90
◦
.
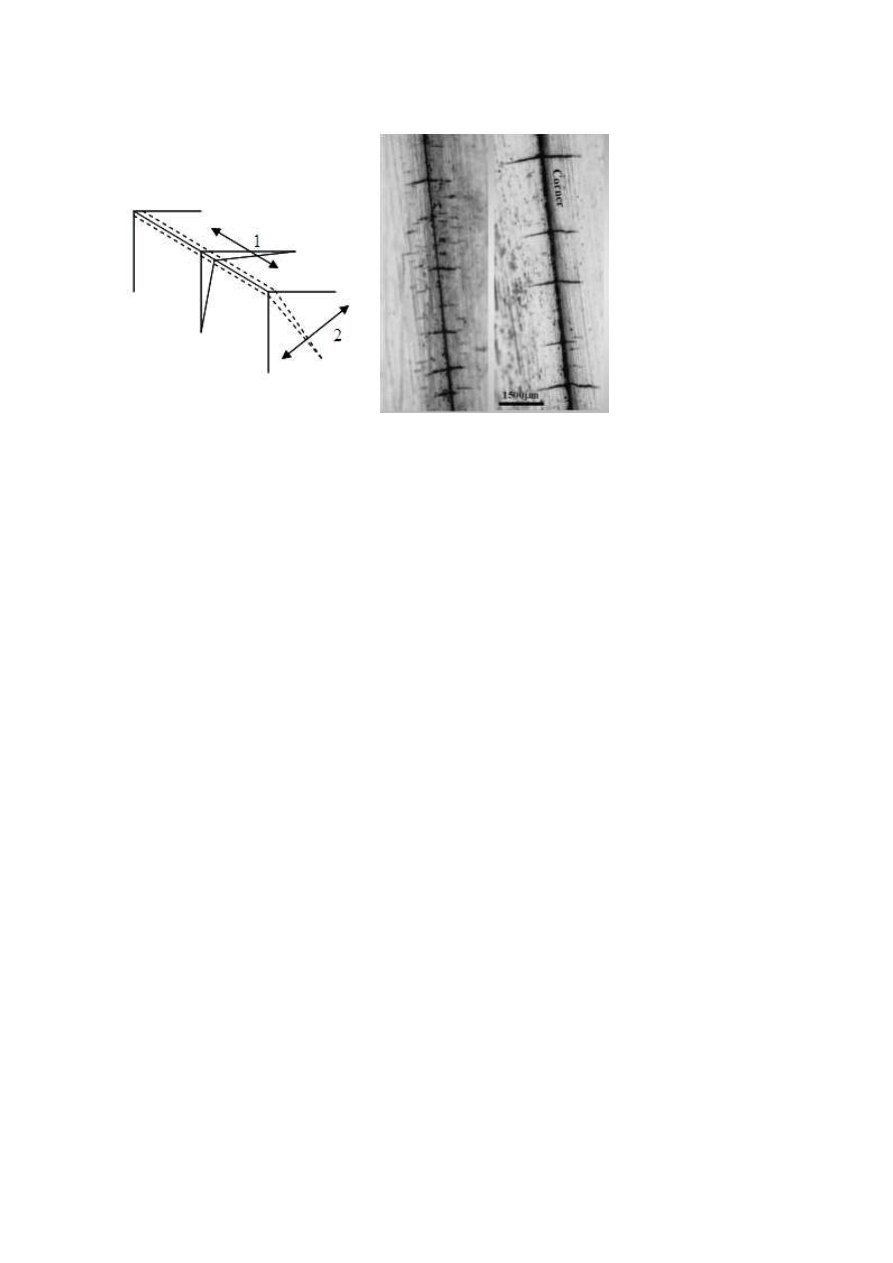
Corner Cracking
Corners are more susceptible to cracking. At corners,
cracking can take place in two directions – perpendicular to the edge because
of cyclic strain in direction 1 and along the edge (dotted line) because of
cyclic strain in direction 2, Fig. 5(a). In most of the laboratory tests, cracks
perpendicular to the edges are observed more often, Fig. 5(b) [6]. It can be
shown using FEM simulation that strain in direction 1 is more dominant that
in-plain strain which results in such cracking.
Numerical Models and Their Validity in the Prediction of Heat Checking in Die...
771
Figure 3.
Cycles to failure in thermal-stress fatigue compared with cycles at contact
temperature in similar plastic-strain range for AISI 347 stainless steel.
Figure 4.
An example of Heat Checking.
772
6TH INTERNATIONAL TOOLING CONFERENCE
(a)
(b)
Figure 5.
(a) Schematic of crack direction and stress direction (b) corner cracking observed
in Lab testing [Wallace].
THERMAL FATIGUE EXPERIMENTS
THERMAL FATIGUE TEST SET UP
Many methods have been used to evaluate the thermal fatigue resistance.
Previous work used direct flame impingement on a surface. However, the
combustion conditions could introduce an arbitrary environment, which may
influence the cracking mechanism. High frequency heating and electrical
resistance heating systems are generally expensive to construct and may not
represent the rapid heating and cooling experienced in die casting. An effec-
tive way of simulating thermal fatigue conditions as well as die-molten metal
contact is to use liquid metal bath heating followed by water quenching. Such
tests have been used for the past 30 years at Case Western Reserve University
to evaluate different material for thermal fatigue resistance. Similar test set
up has also been used at The Ohio State University (OSU). Figure 6 shows
the test setup at OSU, which consists of a heating station (liquid Al bath)
and a cooling station (water). The test specimens are attached into a fixture
and are dipped in heating station and cooling station alternatively to achieve
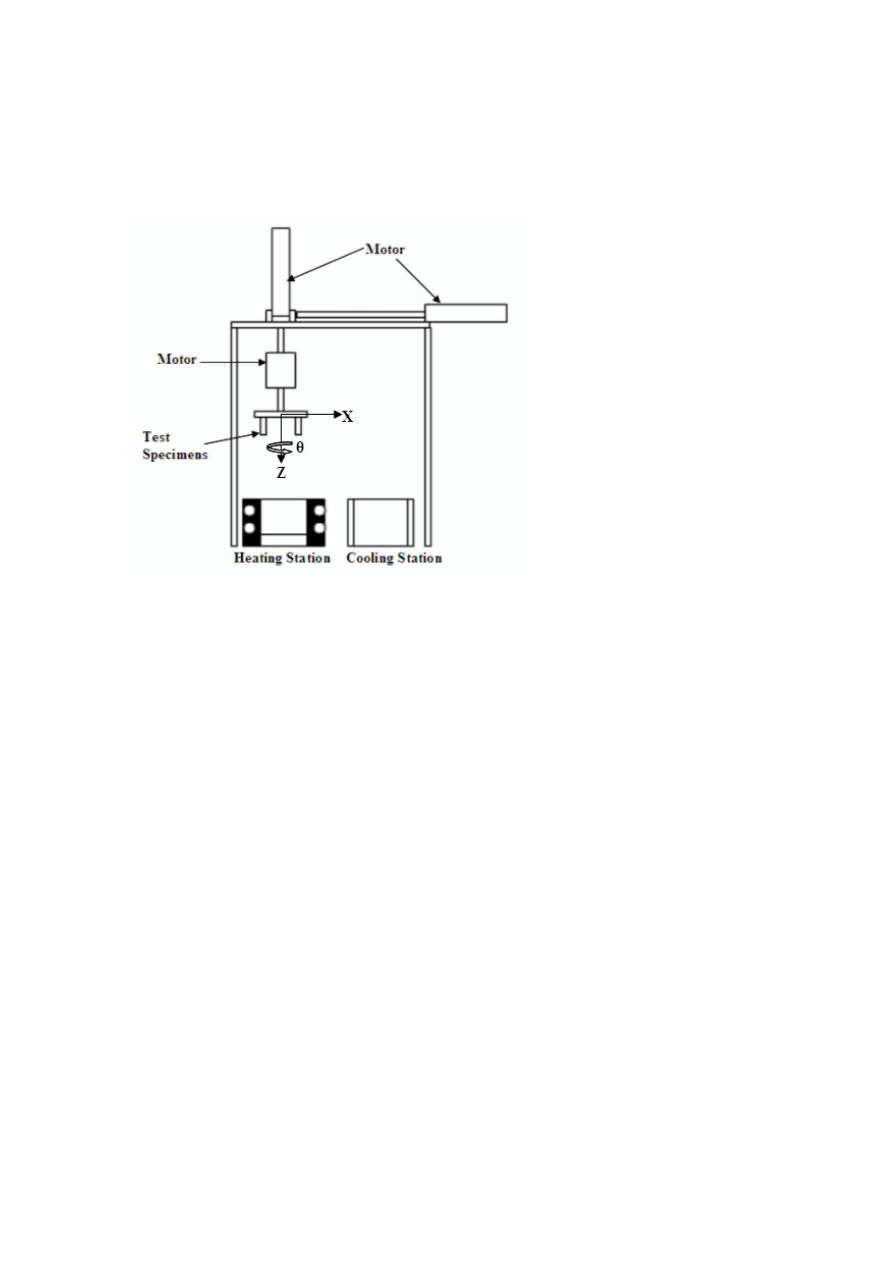
Numerical Models and Their Validity in the Prediction of Heat Checking in Die...
773
thermal fatigue. The speed of the specimen and the dip time are controlled
by a computer. There are 3 motors to control motion in X, Z and Theta
(rotation in water and Al) directions. Rotation is used to strip the adhered
metal from the specimen surface.
Figure 6.
Thermal Cycle Simulator.
TEST SPECIMEN
The specimen, Fig. 7, is a quarter circle geometry cut from round DME
pins (CX41) using EDM process and polishing. The material is H-13 with
hardness 45–53 HRC.
THERMAL CYCLE
A typical thermal cycle consists of dipping time in liquid metal; movement
in air, dipping in water and movement in air again, followed by next cycle.
The dipping time in liquid metal represents the metal injection and part of

774
6TH INTERNATIONAL TOOLING CONFERENCE
Figure 7.
Test Specimen
solidification stage in actual die casting, the time in air represent part of
solidification stage, die opening and part ejection stage, the dipping in water
represents rapid quenching during lubrication spray on dies and the last air
movement represents closing of die and preparation for next cycle. Different
thermal cycles have been used to simulate different die casting conditions.
The cycle is made more severe by dipping for less amount of time, which
causes larger thermal gradient between surface and core. Alternatively, it is
made less severe by dipping for longer times and thus allowing the surface
and core to reach same temperatures. Water cooling inside the test specimen
can be provided to increase the thermal gradient across the thickness. During
the experiment, a severe thermal cycle is used to accelerate the test and to
get the results quickly. The experimental thermal cycle consists of 2 seconds
dipping in molten Al at 1400 F, 10 seconds in air, 3 seconds in water and
finally 10 seconds in air.
FEM MODELING
The test coupon and conditions are modeled using DEFORM 3D package
[7]. The thermal conditions were modeled using heat transfer environment
for aluminum, air and water. A heat exchange window was modeled around
the portion of the coupon which is dipped in aluminum and water. Two
graphs (temperature vs time and heat transfer coefficient vs time) are input
in pre-processor corresponding to thermal cycle. Heat transfer coefficient
was determined in an earlier work at The Ohio State University [8]. Table 1
shows the properties of H-13 steel and heat transfer coefficients used in
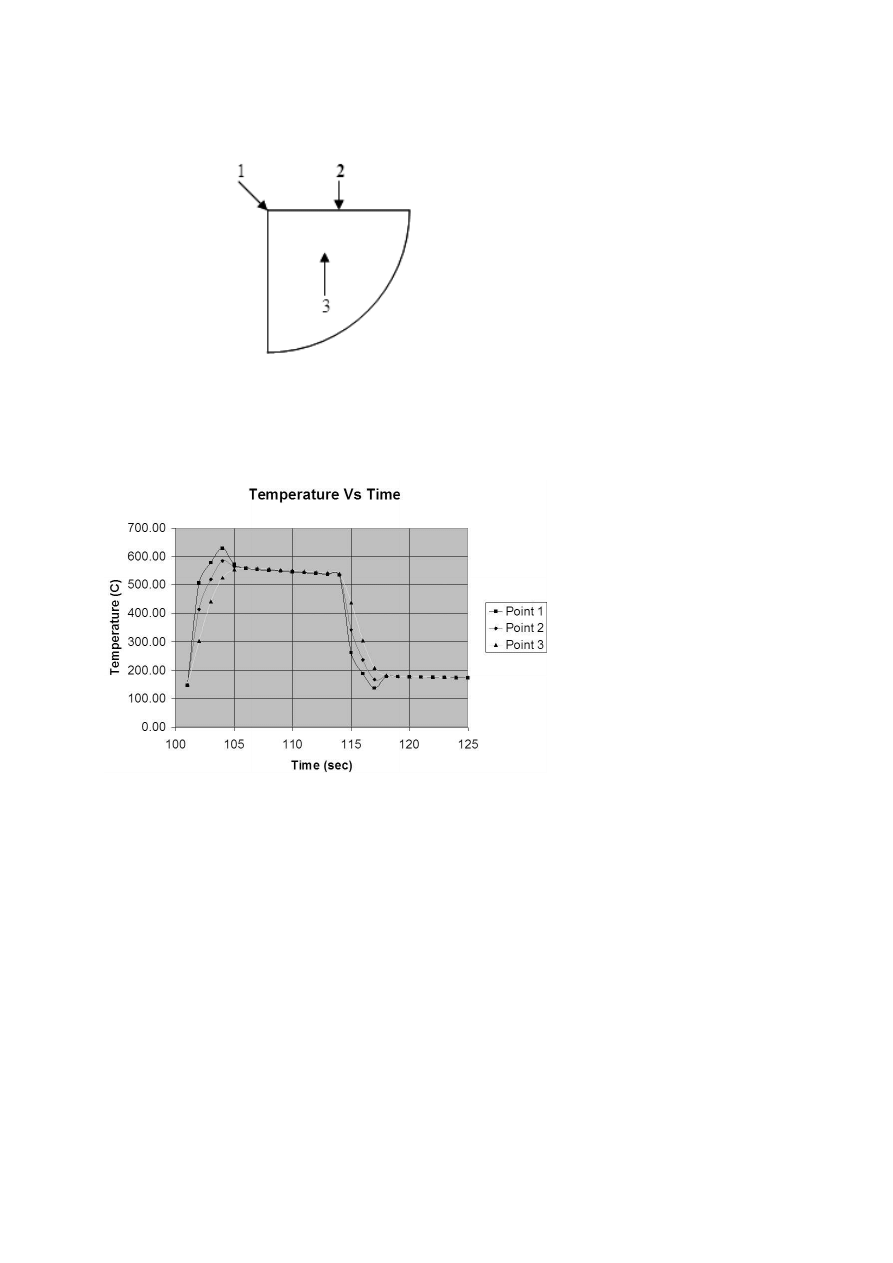
modeling. Temperature and principal stress profiles are tracked at outside
and inside points, Fig. 8.
Numerical Models and Their Validity in the Prediction of Heat Checking in Die...
775
Figure 8.
Location of Points where temperature and principle stress profiles are tracked.
Figure 9.
Temperature vs Time profile.

776
6TH INTERNATIONAL TOOLING CONFERENCE
Table 1.
Properties of H-13 steel used in FEM modeling
Properties
Temperature (
◦
C)
Thermal Conductivity (W/m-K)
215
24.3
350
24.4
475
24.3
605
24.7
Temperature (
◦
C)
Thermal Expansion (m/m -
◦
C)
100
5.78e-06
200
6.39e-06
425
6.78e-06
540
6.89e-06
650
7.28e-06
Elastic Modulus
210 GPA
Poisson Ratio
0.29
Specific Heat
0.46
° J/g-
◦
C
Heat transfer Coefficients
Al and Steel
4016.64 J/m
2
sec
◦
C
Air and Steel
23.85 J/m
2
sec
◦
C
Water and Steel
4184 J/m
2
sec
◦
C
Figure 9 shows the temperature profile obtained at outside and inside
points and it shows a temperature difference of over 176.7
◦
Cbetween sur-
face and interior (3.3 mm below surface) during heating and a temperature
difference of over 148.9
◦
Cduring cooling. This temperature gradient results
in high compressive (-1551 MPA) and tensile stress (1206 MPA) at surface,
which exceeds into plastic regime. This shows that these laboratory tests
also follow the low cycle fatigue model.
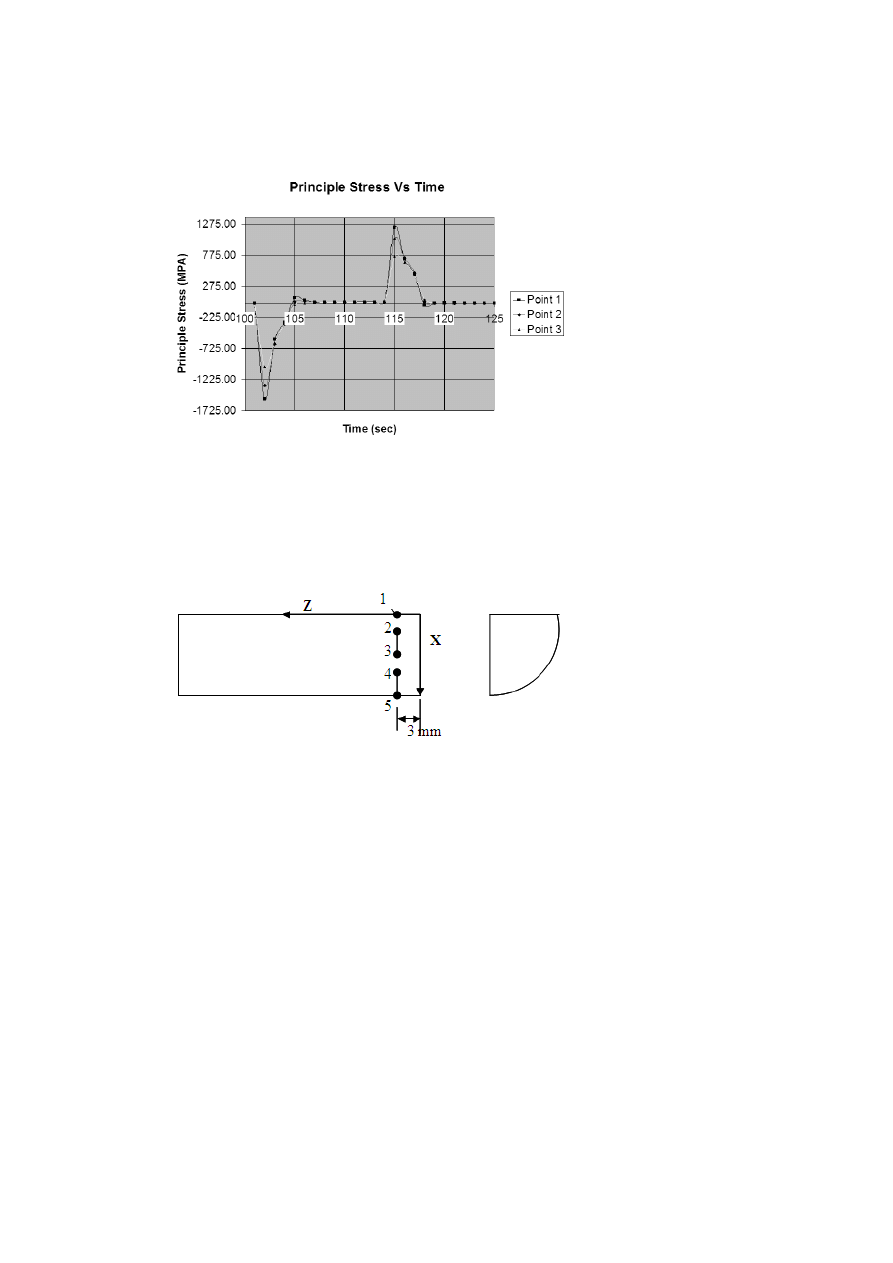
PREDICTION OF CRACKING DIRECTION
The analysis of principle stress plots is done to predict the direction of
cracking as observed in the experimental run. The principle stress is plotted
for 5 points from one edge to other at a distance of 3 mm from the end, as

Numerical Models and Their Validity in the Prediction of Heat Checking in Die...
777
shown in Fig. 11. The values of X, Z and XZ stresses are used to determine
the plane of principle stress.
Table 2.
Maximum Stress, plane of principle stress and direction of cracking
Position
Max
Compressive
Stress
(MPA)
Max
Tensile
Stress
(MPA)
Plane of
Principal
Stress
Direction
of
Cracking
1
−
1696
.11
1399.6
83
◦
−
7
◦
2
−
1441
1192
62
◦
−
28
◦
3
−
1213
.5
958.4
5
◦
−
85
◦
4
−
1310
1061.8
125
◦
35
◦
@@@
5
−
1599
.6
1316.9
90
◦
0
◦
Table 2 shows the plane of principle stress. The direction of cracking is
perpendicular to the plane of maximum principle stress. The direction of
cracking as predicted in the above table follows the same trend as observed in
actual experimental run. This shows that the direction and value of principle
stress can be used to predict the thermal cracking behavior.
OBSERVATION
One of the two flat surfaces of the coupon was polished carefully with 600
grit paper and diamond paste. It is possible that some of the small surface
crack may get polished. However, a lot of scratch marks are still visible on
the coupon. Figures 12(a) – 12(e) shows the crack pattern observed during
laboratory testing corresponding to the positions 1 to 5 shown in Fig. 11. It
can be seen that the direction of the cracking changes as from top to bottom.
The cracking direction is vertical close to horizontal edges, horizontal at the
middle and at an angle at other positions. These results are in conformance
778
6TH INTERNATIONAL TOOLING CONFERENCE
Figure 10.
Principle Stress vs Time profile.
Figure 11.
Position on coupon where prediction of crack pattern is done and actual cracking
in laboratory testing is observed.

Numerical Models and Their Validity in the Prediction of Heat Checking in Die...
779
with the laboratory tests performed at Case Western University. The cracks
at the corners are perpendicular to the edge showing the stress along the edge
to be more dominant than in-plain stress. No results are however available
for the middle portion.
CONCLUSION
One of the important decisions in numerical modeling of thermal fatigue
cracking is to decide on which criterion should be used to model cracking.
Some of the researchers have used elastic and plastic strains to predict ther-
mal fatigue life, whereas others consider residual stress as important. In the
current work, both principle stress and strain are used to model the crack-
ing behavior, however principle stress has shown better correlation between
FEM modeling and actual testing. The cracking direction as predicted using
plane of principle stress is similar to that observed in actual testing. Use
of principle stress in predicting thermal fatigue life is being examined in
current studies.
REFERENCES
[1] SHIVPURI, R et al, Wear 192 (1996) 49-55.
[2] J. C. BENEDYK, D. J. MORACZ, J. F. WALLACE, in Proceedings of the 6th SDCE
International Die-casting Congress, Cleveland, Ohio November 16–19, 1970, organized
by The society of Die Casting Engineers, Inc., pp.187-206.
[3] S. MALM and L. A. NORSTRÖM, Metal Science, September 1979, pp 545–550.
[4] S. S. MANSON, in "Thermal Stress and Low Cycle Fatigue" (Mcgraw Hill Book Com-
pany, New York, 1996) p. 256.
[5] J. A. COLLINS, in "Failure of Materials in Mechanical Design – Analysis Prediction
and Prevention" (John Willey & Sons, New York, 1981) p. 391.
[6] J. F. WALLACE, D. SCHWAM and Q. ZHOU in Proceedings of the 21ST International
Die Casting Congress, Cincinnati, Ohio, October-November 2001, organized by North
American Die Casting Association, p. 317.
[7] DEFORM 3D, SFTC, Columbus Ohio.
[8] C. ROSBROOK and R. SHIVPURI, in Proceedings of the 17th International Die Casting
Congress, Cleveland, Ohio, October 1993.
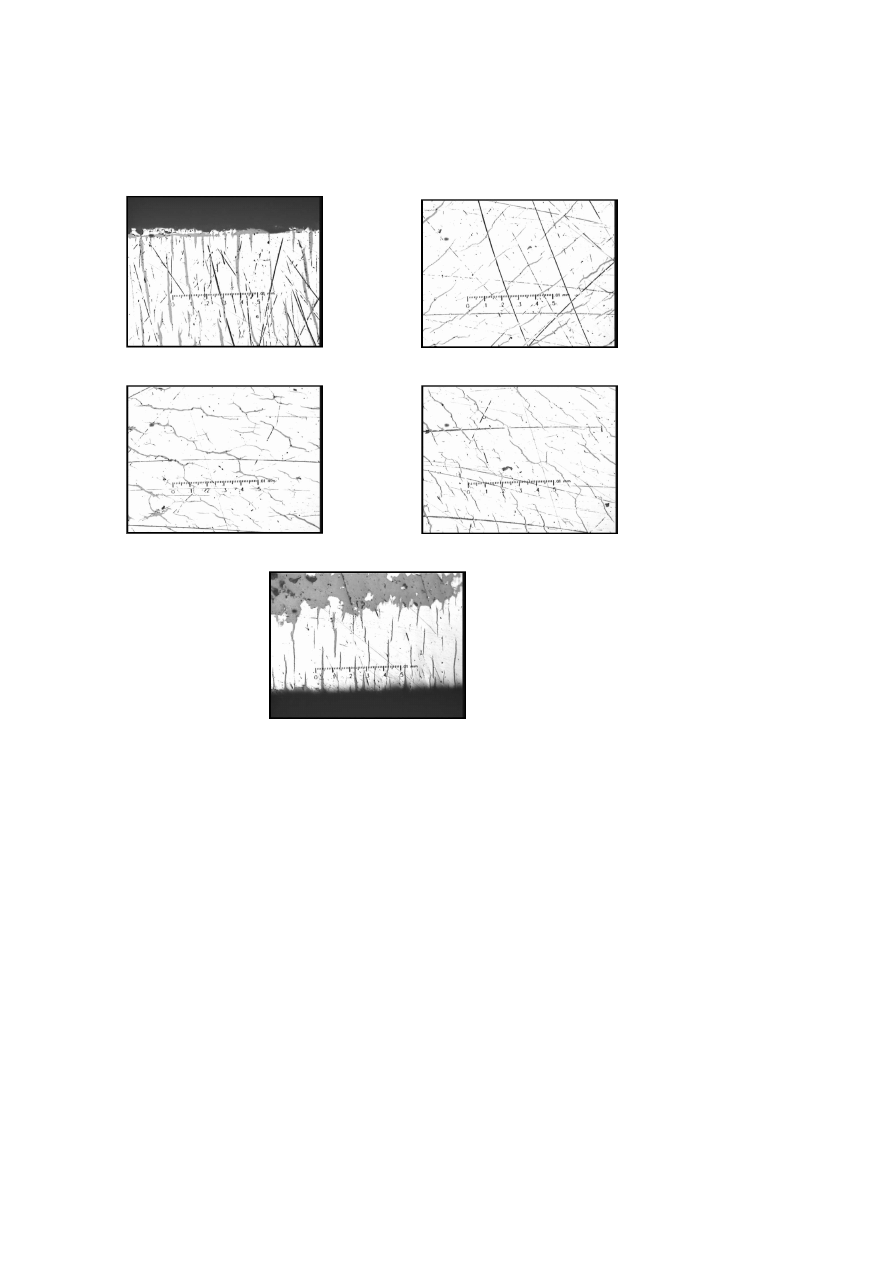
780
6TH INTERNATIONAL TOOLING CONFERENCE
(a) Position 1
(b) Position 2
(c) Position 3
(d) Position 4
(e) Position 5
Figure 12.
Crack pattern as observed in laboratory testing at the positions shown in Fig. 11.
Wyszukiwarka
Podobne podstrony:
74 1053 1066 Hard PVD Coatings and Their Perspectives in Forming Tool Applications
LEDS and their application in practise
Gogosz, Laws of Pagans and their Conversion in the Works of Pawel Wlodkowic
Tea polyphenols and their role in cancer prevention and chemotherapy
31 411 423 Effect of EAF and ESR Technologies on the Yield of Alloying Elements
Lumiste Tarski's system of Geometry and Betweenness Geometry with the Group of Movements
Biography and History Harriet Jacobs The Life of a Slave
Tigers and Devils 3 Countdown until the End of the World
Wicca Book of Spells and Witchcraft for Beginners The Guide of Shadows for Wiccans, Solitary Witche
Truth and Knowledge Introduction to The Philosophy of Freedom by Rudolf Steiner
the garden and story a contribution to the theory of garden narrative Content File PDF
Ebsco Martin Cognitive emotion regulation in the prediction of depression, anxiety, stress, and an
Ebsco Martin Cognitive emotion regulation in the prediction of depression, anxiety, stress, and an
Of Corpses and Gold Materials for the Study of the Vetala and the Ro langs by Michael Walter Tibet
social networks and planned organizational change the impact of strong network ties on effective cha
więcej podobnych podstron