
Whole Transcriptome Sequencing Reveals Gene
Expression and Splicing Differences in Brain Regions
Affected by Alzheimer’s Disease
Natalie A. Twine
1,2
, Karolina Janitz
3
, Marc R. Wilkins
1,2,3
, Michal Janitz
1
*
1 School of Biotechnology and Biomolecular Sciences, University of New South Wales, Sydney, New South Wales, Australia, 2 New South Wales Systems Biology Initiative,
University of New South Wales, Sydney, New South Wales, Australia,
3 Ramaciotti Centre for Gene Function Analysis, University of New South Wales, Sydney, New South
Wales, Australia
Abstract
Recent studies strongly indicate that aberrations in the control of gene expression might contribute to the initiation and
progression of Alzheimer’s disease (AD). In particular, alternative splicing has been suggested to play a role in spontaneous
cases of AD. Previous transcriptome profiling of AD models and patient samples using microarrays delivered conflicting
results. This study provides, for the first time, transcriptomic analysis for distinct regions of the AD brain using RNA-Seq next-
generation sequencing technology. Illumina RNA-Seq analysis was used to survey transcriptome profiles from total brain,
frontal and temporal lobe of healthy and AD post-mortem tissue. We quantified gene expression levels, splicing isoforms
and alternative transcript start sites. Gene Ontology term enrichment analysis revealed an overrepresentation of genes
associated with a neuron’s cytological structure and synapse function in AD brain samples. Analysis of the temporal lobe
with the Cufflinks tool revealed that transcriptional isoforms of the apolipoprotein E gene, APOE-001, -002 and -005, are
under the control of different promoters in normal and AD brain tissue. We also observed differing expression levels of
APOE-001 and -002 splice variants in the AD temporal lobe. Our results indicate that alternative splicing and promoter usage
of the APOE gene in AD brain tissue might reflect the progression of neurodegeneration.
Citation: Twine NA, Janitz K, Wilkins MR, Janitz M (2011) Whole Transcriptome Sequencing Reveals Gene Expression and Splicing Differences in Brain Regions
Affected by Alzheimer’s Disease. PLoS ONE 6(1): e16266. doi:10.1371/journal.pone.0016266
Editor: Thomas Preiss, Victor Chang Cardiac Research Institute (VCCRI), Australia
Received October 29, 2010; Accepted December 8, 2010; Published January 21, 2011
Copyright: ß 2011 Twine et al. This is an open-access article distributed under the terms of the Creative Commons Attribution License, which permits
unrestricted use, distribution, and reproduction in any medium, provided the original author and source are credited.
Funding: MJ acknowledges support from a UNSW Science Faculty Research Grant 2010. MW and the NSW Systems Biology Initiative acknowledge support from
the New South Wales Office for Science and Medical Research and the Australian Government9s Super Science Initiative. The funders had no role in study design,
data collection and analysis, decision to publish, or preparation of the manuscript.
Competing Interests: The authors have declared that no competing interests exist.
* E-mail: m.janitz@unsw.edu.au
Introduction
Alzheimer’s disease (AD) is the most common cause of dementia
in the human population; it mainly affects individuals over the age
of 60, and one’s risk of developing it increases steadily with age [1].
AD is characterized by a complex progression of neurodegeneration
that results in memory impairment and loss of other cognitive
processes as well as the presence of non-cognitive symptoms
including delusions, agitation and changes in mood and personality.
The pathogenesis of AD is complex and remains challenging to
research efforts worldwide. The majority of AD cases show no
familial or geographical clustering and are described as sporadic or
idiopathic. The apolipoprotein E (APOE) genotype influences age at
onset of AD. Compared to APOE e3 (Cys-112, Arg-158), which is
considered neutral, the e4 allele (Arg-112, Arg-158) is associated
with increased risk and earlier onset of AD in a dose-dependent
manner. Conversely, the e2 allele (Cys-112, Cys-158) is protective
against AD [2]. In the absence of greater understanding of AD
pathogenesis, treatment strategies do not provide a cure but only
treat symptoms or reduce the rate of onset [3,4].
The transcriptome reflects cellular activity within a tissue at a
given point in time. Genome-wide expression studies, which are
not influenced by deductive assumptions, provide an unbiased
approach for investigating the pathogenesis of complex diseases
like AD. Transcriptome analyses have been performed using
transgenic animals models of AD and patient-derived cell lines
[5,6]. In contrast to these approaches, post-mortem brain tissue is
difficult to obtain, and some RNA quality concerns exist that
might potentially influence transcriptome studies [7,8]. Neverthe-
less, post-mortem brain tissue, being identical to the tissue affected
by the disease, remains the gold standard against which all other
model systems are evaluated. Transcriptome studies of AD
utilizing brain tissue have however generated mostly discordant
results. The recent development of next-generation sequencing
provides a more comprehensive and accurate tool for transcrip-
tome analysis of this invaluable resource [9,10].
RNA-Seq analyzes complementary DNA (cDNA) by means of
highly efficient, next-generation DNA sequencing methods and
subsequent mapping of short sequence fragments (reads) onto the
reference genome. That this new technology makes it possible to
identify exons and introns, mapping their boundaries and the 59 and
39 ends of genes, in turn makes it possible to understand the
complexity of eukaryotic transcriptomes comprehensively. Moreover,
RNA-Seq enables identification of transcription initiation sites (TSSs)
and new splicing variants, and it permits of a precise quantitative
determination of exon and splicing isoform expression [11].
Some recent reports, which systematically compare microarrays
and next-generation sequencing, have clearly proven the superi-
PLoS ONE | www.plosone.org
1
January 2011 | Volume 6 | Issue 1 | e16266

ority of the latter, both with respect to low frequency of false
positive signals and high reproducibility of the method [12,13]. A
recent report by van Bakel et al. concerning transcript analysis of
intragenic regions unambiguously showed that hybridization
signals from microarrays can lead to massively false positive
signals from transcripts of low abundance [14].
In the present study, we performed a comparative gene
expression analysis of normal human brain tissue and tissue
affected by Alzheimer’s disease, using the RNA-Seq technique.
Along with samples from whole normal and AD brains, mRNA
samples from two different brain regions, namely the frontal and
temporal lobes, were analyzed. We found significant differences in
gene isoform expression levels, alternated use of promoters and
transcription start sites between normal and AD brain tissue.
Materials and Methods
Human brain RNA
Total RNA from post-mortem human brains was obtained from
Ambion (Austin, USA) and Capital Biosciences (Rockville, USA).
Table 1 provides detailed information regarding each sample used
in this study. The quality of the total RNA was evaluated using the
Agilent 2100 Bioanalyser RNA Nano Chip.
Library preparation and sequencing
For the mRNA-Seq sample preparation, the Illumina standard
kit was used according to the manufacturer’s protocol. Briefly,
10
m
g of each total RNA sample was used for polyA mRNA
selection using streptavidin-coated magnetic beads, followed by
thermal mRNA fragmentation. The fragmented mRNA was
subjected to cDNA synthesis using reverse transcriptase (Super-
Script II) and random primers. The cDNA was further converted
into double stranded cDNA and, after an end repair process
(Klenow fragment, T4 polynucleotide kinase and T4 polymerase),
was finally ligated to Illumina paired end (PE) adaptors. Size
selection was performed using a 2% agarose gel, generating cDNA
libraries ranging in size from 200–250 bp. Finally, the libraries
were enriched using 15 cycles of PCR and purified by the
QIAquick PCR purification kit (Qiagen). The enriched libraries
were diluted with Elution Buffer to a final concentration of 10 nM.
Each library was run at a concentration of 7 pM on one Genome
Analyzer (GAII) lane using 36 bp sequencing. Six samples were
analyzed in this manner, taken from frontal, temporal and total
brain tissue of both AD and healthy brains.
Primary processing of Illumina RNA-Seq reads
RNA-Seq reads were obtained using Bustard (Illumina Pipeline
version 1.3). Reads were quality-filtered using the standard
Illumina process, and a 0 (no) or 1 (yes) was used to define
whether a read passed filtering or not. Six sequence files were
generated in FASTQ format (sequence read plus quality
information in Phred format); each file corresponded to the brain
tissue from which the RNA originated. The median number of
reads per sequence file (corresponding to one lane on the flow cell)
was 14,974,824. The sequence data have been submitted to the
NCBI Short Read Archive with accession number SRA027308.2.
Mapping of RNA-Seq reads using TopHat
Reads were then processed and aligned to the UCSC H. sapiens
reference genome (build hg19) using TopHat v1.0.12 [15].
TopHat incorporates the Bowtie v0.11.3 algorithm to perform
the alignment [16]. TopHat initially removes a portion of reads
based on quality information accompanying each read, then maps
reads to the reference genome. The pre-built H. sapiens UCSC
hg19 index was downloaded from the TopHat homepage and
used as the reference genome. TopHat allows multiple alignments
per read (up to 40 by default) and a maximum of 2 mismatches
when mapping reads to the reference. The mapping results were
then used to identify ‘‘islands’’ of expression, which can be
interpreted as potential exons. TopHat builds a database of
potential splice junctions and confirms these by comparing the
previously unmapped reads against the database of putative
junctions. Default parameters for TopHat were used.
Transcript assembly and abundance estimation using
Cufflinks
The aligned read files were processed by Cufflinks v0.8.0 [17].
Reads were assembled into transcripts, their abundance estimated
and tests for differential expression and regulation between the
tissue samples were performed. Cufflinks does not make use of
existing gene annotations during assembly of transcripts, but
rather constructs a minimum set of transcripts that bests describe
the reads in the dataset. This approach allows Cufflinks to identify
alternative transcription and splicing that are not described by pre-
existing gene models [17]. Cufflinks uses the normalized RNA-Seq
fragment counts to measure the relative abundances of transcripts.
The unit of measurement is Fragments Per Kilobase of exon per
Million fragments mapped (FPKM). Confidence intervals for
FPKM estimates were calculated using a Bayesian inference
method [18].
Comparison to reference annotation and differential
expression testing using Cuffcompare and Cuffdiff
Once all short read sequences were assembled with Cufflinks, the
output.GTF files were sent to Cuffcompare along with a refer-
ence.GTF annotation file downloaded from the Ensembl database
(Homo_sapiens.GRCh37.55.gtf; [19]). This classified each transcript
Table 1. Source of total RNA from brain tissue samples.
Condition
Sample
Gender
Age (years)
Source
Normal
Total brain
13 male;
10 female
23–86 (x˜<68.3)
Ambion
Frontal lobe
5 male
22–29 (x˜<26.4)
Capital Biosciences
Temporal lobe
5 male
23–29 (x˜<26.0)
Capital Biosciences
Alzheimer’s disease
Total brain
1 male
87
Capital Biosciences
Frontal lobe
1 male
87
Capital Biosciences
Temporal lobe
1 male
80
Capital Biosciences
doi:10.1371/journal.pone.0016266.t001
Transcriptome Sequencing of AD Brain
PLoS ONE | www.plosone.org
2
January 2011 | Volume 6 | Issue 1 | e16266
as known or novel. The classification also describes the nature of the
match to the reference gene annotation by way of a code letter. These
are useful for selecting novel isoforms from the analysis.
Cuffcompare produces a combined.GTF file which is passed to
Cuffdiff along with the original alignment (.SAM) files produced by
TopHat. Cuffdiff then re-estimates the abundance of transcripts listed
in the.GTF file using alignments from the.SAM file, and concurrently
tests for differential expression. The expression testing is done at the
level of transcripts, primary transcripts and genes. By tracking
changes in the relative abundance of transcripts with a common
transcription start site, Cuffdiff can identify changes in splicing.
Relative promoter use within a single gene is also monitored by
following the abundance changes of primary transcripts from that
gene. We used Cuffdiff to perform three pairwise comparisons of
expression, splicing and promoter use between normal and diseased
samples from temporal, frontal and total brain regions.
Identification of APOE allele in AD samples
To identify which allele of APOE was present in the frontal,
temporal lobe and total brain AD samples, the genotype of SNPs
rs429358 and rs7412 were determined using the Integrated
Genome Viewer.
Visualization of mapped reads
Mapping results were visualized using both the University of
California, Santa Cruz (UCSC) genome browser [20] and a local
copy of the Integrative Genomics Viewer software available at
http://www.broadinstitute.org/igv/. Views of individual genes
were generated by uploading coverage.wig files to the UCSC
Genome browser as a custom track. Data files were restricted to the
chromosome in question due to upload limits imposed by the
genome browser. The same method was used to generate coverage
plots for chromosome 1, except here the coverage values were
logged (base 2) prior to uploading to the genome browser. This was
done to visualize better the full dynamic range of the read coverage.
Functional analysis of gene lists using DAVID
The Database for Annotation, Visualization and Integrated
Discovery (DAVID) v6.7 is a set of web-based functional annotation
tools [21]. The functional clustering tool was used to look for
functional enrichment for genes over- and under-expressed more
than two-fold in Alzheimer’s disease. A unique list of gene symbols
was uploaded via the web interface, and the background was
selected as Homo sapiens. Gene Ontology Biological Process was
selected as the functional annotation category for this analysis.
Hardware specifications
TopHat and Bowtie were installed and run on a SGI Altix 4700
64-bit shared memory machine with 1 TB RAM, 128 Dual-Core
CPUs of 1.6 GHz. Cufflinks was run on a desktop computer with
4 GB RAM.
Results
Analysis of RNA-Seq data
During the amplification step of sequence generation, the
Illumina GAII produces clusters of identical sequence fragments.
The number of these clusters is reported, as is the percentage that
pass quality filtering by the Illumina image analysis software.
Across all 6 samples, between 192,093 and 211,779 raw clusters
were generated. Between 67.6% and 74.1% of these clusters
passed filtering; these values are within the acceptable range
recommended by Illumina. The total number of reads produced
for each brain sample ranged from 13,442,077 to 15,772,947, with
a median of 14,974,824 (Table 2). There was no significant
difference in the number of reads from normal and Alzheimer’s
Table 2. RNA-Seq sequence reads mapping to UCSC Human genome build 19 by TopHat v1.0.12.
Total brain N
a
Total brain AD
b
Temp lobe N
Temp lobe AD
Front lobe N
Front lobe AD
Total reads
13,442,077
14,720,816
15,256,752
14,227,702
15,772,947
15,228,832
Reads removed
0.05%
0.04%
0.02%
0.04%
0.03%
0.04%
Unique hits to reference
genome
91.85%
92.42%
92.40%
90.41%
91.46%
90.96%
TopHat allows up to two mismatches when mapping reads to a reference genome. The number of reads removed due to poor quality and the number of reads
mapping uniquely to the reference genome are both expressed as percentages of the total number of reads.
a
Normal brain samples.
b
Alzheimer’s disease brain samples.
doi:10.1371/journal.pone.0016266.t002
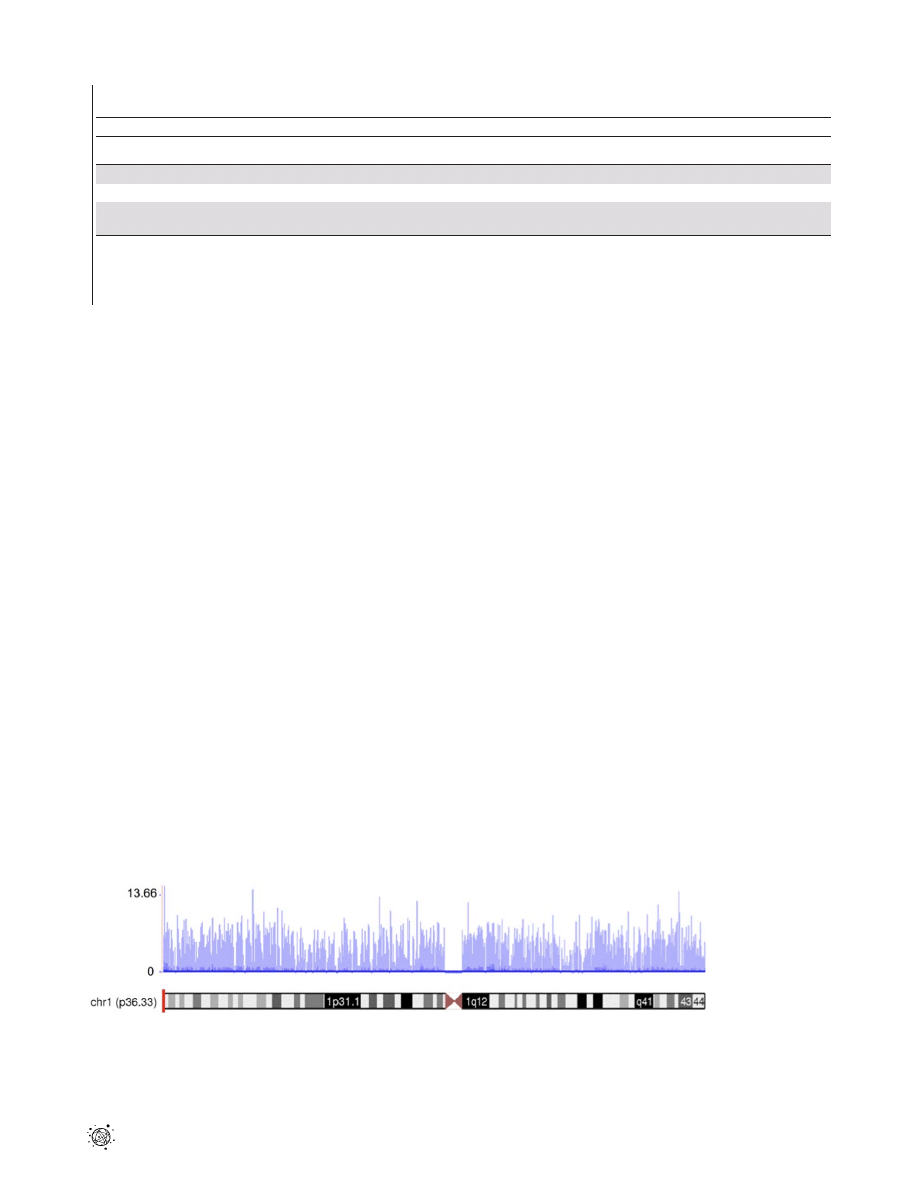
Figure 1. A transcription profile of normal temporal lobe of the brain for chromosome 1. The RNASeq read density along the length of
the chromosome is shown. The coverage values are measured along intervals of the genome. These intervals vary in size from 1 bp to 10 Mbp
depending on how variable the read density is for a particular genomic location. Each bar represents log
2
of the frequency reads plotted against
chromosome coordinates.
doi:10.1371/journal.pone.0016266.g001
Transcriptome Sequencing of AD Brain
PLoS ONE | www.plosone.org
3
January 2011 | Volume 6 | Issue 1 | e16266
brain (Student’s t-test, p = 0.9). To assess the quality of mapping
reads to the reference genome, some key metrics were extracted
from the TopHat output and log files, as shown in Table 2.
Between 90% and 92% of reads aligned to the reference genome
in a unique manner. A small percentage of reads (0.02% to 0.05%)
were removed from the analysis prior to mapping to the reference,
due to low quality.
Sequence coverage distribution
To investigate the level and uniformity of the read coverage
against the human genome, we plotted mapped reads of the
normal temporal lobe sample along the human chromosome 1
(Fig. 1). We exemplified RNA-Seq coverage on chromosome 1
because this is the largest chromosome in the human karyotype,
encoding over 13.6% of all human genes. The coverage values,
measured along discrete intervals or bins of the genome, were log-
transformed (base 2) to visualize better the full dynamic range of
the data. Figure 1 shows the breadth of read coverage across
chromosome 1. The read depth in the different bins ranged from 0
to 12,949 and revealed extensive transcriptional activity in the
genome. As expected, no reads mapped to the centromere. The
total numbers of reads that mapped to chromosome 1 in normal
total brain as well as normal temporal and frontal lobes were
1,700,799, 2,062,880 and 2,048,959 respectively.
Differentially expressed genes
After mapping the RNA-Seq reads to the reference genome
with TopHat, transcripts were assembled and their relative
abundances calculated using Cufflinks. The summation of FPKM
values for every transcript associated with a particular gene gives
the expression (abundance) measurement for that gene, in FPKM.
Cufflinks uses the Cuffdiff algorithm to calculate differential
expression at both the gene and transcript levels. Differential gene
expression (DGE) for total brain, frontal and temporal lobes was
calculated using the ratio of AD versus normal FPKM values for
every gene. The DGE ratios were tested for statistical significance
as described recently [22]. The significance scores were corrected
for multiple testing using the Benjamini-Hochberg correction.
The range of DGE ratios observed was 226.20 to 26.24 for
frontal lobe, 2183 to 13.27 for temporal lobe and 2350 to 36.63 for
total brain. These three ranges for DGE ratios were all statistically
significant. The expression ratios in AD versus normal were skewed
towards down-regulation. This is potentially due to the lower overall
levels of transcriptional activity present in AD vs. normal brain
Table 3. Top ten up- and down-regulated genes in AD total brain.
Gene
Description
Chromosome
FPKM N
FPKM AD
Fold change
p-value
Ensembl Gene ID
IGHA1
immunoglobulin heavy
constant alpha 1
chr14
0.234092
5.275364
22.53543051
0.00018499
ENSG00000211895
RP11-552E20.3
not annotated
chr6
1.87539
14.272193
7.610253334
8.76E-009
not annotated
PCYT1A
phosphate cytidylyltransferase
1, choline, alpha
chr3
0.413637
3.021956
7.305816453
0.00801203
ENSG00000161217
SLC7A9
solute carrier family 7
(cationic amino acid
transporter, y
+ system),
member 9
chr19
0.705822
4.834326
6.849214108
0.0105864
ENSG00000021488
RAD54L
RAD54-like (S. cerevisiae)
chr1
0.436495
2.391719
5.479373189
0.0259394
ENSG00000085999
OAS1
29,59-oligoadenylate
synthetase 1, 40/46kDa
chr12
3.82773
20.973536
5.479366622
4.89E-008
ENSG00000089127
MTIF2
mitochondrial translational
initiation factor 2
chr2
3.75753
16.176999
4.305221515
7.00E-007
ENSG00000085760
STAB1
stabilin 1
chr3
0.729626
2.887364
3.9573206
0.0317452
ENSG00000010327
CD22
CD22 molecule
chr19
9.83818
36.883742
3.749041184
0
ENSG00000012124
AC018730.1
not annotated
chr2
9.4161
32.907895
3.494854027
8.88E-016
not annotated
RELN
reelin
chr7
19.4443
0.055404
2
350.9548047
2.22E-016
ENSG00000189056
ANK1
ankyrin 1, erythrocytic
chr8
13.7202
0.086115
2
159.3241596
8.88E-013
ENSG00000029534
GRM4
glutamate receptor,
metabotropic 4
chr6
29.2203
0.392424
2
74.46104214
0
ENSG00000124493
GRM1
glutamate receptor,
metabotropic 1
chr6
7.96543
0.142632
2
55.84602333
1.76E-008
ENSG00000152822
TFRC
transferrin receptor
(p90, CD71)
chr3
9.17108
0.180114
2
50.91819625
3.81E-008
ENSG00000072274
DAO
D-amino-acid oxidase
chr12
10.0459
0.20387
2
49.27600922
4.99E-008
ENSG00000110887
ABLIM1
actin binding LIM protein 1
chr10
19.2058
0.39862
2
48.1807235
3.21E-011
ENSG00000099204
KIAA0802
KIAA0802
chr18
14.4233
0.387405
2
37.23054684
4.61E-007
ENSG00000168502
MED13L
mediator complex
subunit 13-like
chr12
7.77748
0.210969
2
36.86551105
7.40E-010
ENSG00000123066
ITGB8
integrin, beta 8
chr7
7.38908
0.20143
2
36.68311572
5.17E-007
ENSG00000105855
Differential gene expression for total brain was calculated using the ratio of AD versus normal (N) FPKM values for every gene identified as expressed by Cufflinks. The
genes were ranked on their fold changes and the ten with the highest or lowest fold changes are shown here.
doi:10.1371/journal.pone.0016266.t003
Transcriptome Sequencing of AD Brain
PLoS ONE | www.plosone.org
4
January 2011 | Volume 6 | Issue 1 | e16266
following significant loss of neuronal tissue in the former. The top 10
up- and down-regulated genes in total, frontal and temporal AD
brain regions are listed in Tables 3, 4 and 5, respectively.
When comparing the top 30 most over- and under-expressed
genes in AD across the 3 brain samples (Tables S1, S2, S3),
DHX58 (DEXH box polypeptide 58) and STAB1 (Stabilin 1) are
up-regulated in both total brain (2.13 fold change (FC), p = 0.01
and 4.9 FC, p = 0.01, respectively) and frontal lobe (3.96 FC,
p = 0.03 and 10.5, p,1610
216
, respectively), while TFR1
(transferrin receptor) is down-regulated in both regions (250.92
FC, p = 3.8610
28
and -17.15 FC, p = 9.2610
25
, respectively).
SLIT1 (slit homolog 1) is down-regulated in both frontal and
temporal
lobes
(226.2
FC,
p = 5.7610
26
and
2116.67,
p = 2610
211
). TFR1, responsible for cellular uptake of iron, has
been implicated in neurologic development in mice, and
accumulation of iron in brain-specific regions has been implicated
in AD [23,24]. SLIT1 is widely reported to be involved in brain
development and axon guidance [25].
In the top 30 over- and under-expressed genes in AD between the
3 brain samples, there are a number of genes without annotation,
described either as putative or novel transcripts in the Ensembl
database. RP11-552E20.3 and AC018730.1 are up-regulated in AD
total brain (7.61 FC, p = 8.76610
29
and 3.49 FC, p = 8.88610
216
,
respectively), AC074289.4 is up-regulated in AD temporal lobe
(13.27 FC, p = 0.01) and RP4-697K14.12 is up-regulated in AD
frontal lobe (5.77 FC, p = 0.02). None of these putative or novel
transcripts is described as protein coding by Ensembl.
There is some concordance between gene expression differences
found with RNA-Seq and those reported in previous microarray
studies on Alzheimer’s disease [9]. Genes in the AD temporal lobe
detected as down-regulated by both approaches include dopamine
receptor 2 (DRD2), AMPA1 receptor (GRIA1), glutamate receptor,
ionotropic, N-methyl D-aspartate 1 (GRIN1), glutamate transporter
EAAT3 (SLC1A1), a-synuclein (SCNA), high affinity BDNF/NT-3
receptor (TrkB), high affinity NT-3 receptor (TrkC), glutamic acid
decarboxylase 1 (GAD1) and glutamic acid decarboxylase 2 (GAD2).
Table 4. Top ten up- and down-regulated genes in frontal lobe of AD brain.
Gene
Description
Chromosome
FPKM N
FPKM AD
Fold change
p-value
Ensembl Gene ID
PCK1
phosphoenolpyruvate
carboxykinase 1 (soluble)
chr20
0.121441
3.186619
26.24005896
5.87E-006
ENSG00000124253
CD163
CD163 molecule
chr12
0.264139
4.435869
16.79369196
0.000108665
ENSG00000177575
AC012317.1
Bac clone
chr16
0.295506
3.913347
13.24286817
0.0128902
not annotated
NUPR1
nuclear protein, transcriptional
regulator, 1
chr16
7.93458
94.488709
11.90847014
0
ENSG00000176046
GDPD3
glycerophosphodiester
phosphodiesterase domain
containing 3
chr16
0.262915
3.104517
11.80806344
2.23E-006
ENSG00000102886
STAB1
stabilin 1
chr3
0.407594
4.278127
10.49604999
0.00152394
ENSG00000010327
MOV10
Mov10, Moloney leukemia virus
10, homolog (mouse)
chr1
0.584517
5.521605
9.446440394
0.00022429
ENSG00000155363
MLKL
mixed lineage kinase
domain-like
chr16
0.268134
2.53291
9.4464335
0.00258816
ENSG00000168404
LY6G5C
lymphocyte antigen 6 complex,
locus G5C
chr6
0.275959
2.462004
8.921629662
0.00341639
ENSG00000111971
ITPR3
inositol 1,4,5-triphosphate
receptor, type 3
chr6
0.27173
2.281668
8.396820373
0.00455198
ENSG00000096433
SLIT1
slit homolog 1
(Drosophila)
chr10
9.63131
0.367602
2
26.20037432
5.71E-006
ENSG00000187122
PTPRO
protein tyrosine
phosphatase, receptor
type, O
chr12
8.77741
0.368512
2
23.8185188
1.10E-005
ENSG00000151490
LPIN2
lipin 2
chr18
7.50745
0.335313
2
22.38937948
1.67E-005
ENSG00000101577
ATRN
attractin
chr20
7.2984
0.333062
2
21.91303721
1.92E-005
ENSG00000088812
NAG (NBAS)
neuroblastoma amplified
sequence
chr2
6.54659
0.327206
2
20.00754876
3.48E-005
ENSG00000151779
GPR107
G protein-coupled
receptor 107
chr9
7.31149
0.383708
2
19.05482815
4.75E-005
ENSG00000148358
ACOX1
acyl-CoA oxidase 1,
palmitoyl
chr17
8.28587
0.442214
2
18.73724034
7.37E-007
ENSG00000161533
EDEM3
ER degradation enhancer,
mannosidase alpha-like 3
chr1
5.64477
0.303834
2
18.57846719
5.57E-005
ENSG00000116406
ATP8A1
ATPase, aminophospholipid
transporter (APLT), class I,
type 8A, member 1
chr4
7.66187
0.412407
2
18.57841889
5.57E-005
ENSG00000124406
VWF
von Willebrand factor
chr12
6.0129
0.32365
2
18.5784026
5.57E-005
ENSG00000110799
Differential gene expression for frontal lobe was calculated using the ratio of AD versus normal (N) FPKM values for every gene identified as expressed by Cufflinks. The
genes were ranked on their fold changes and the ten with the highest or lowest fold changes are shown here.
doi:10.1371/journal.pone.0016266.t004
Transcriptome Sequencing of AD Brain
PLoS ONE | www.plosone.org
5
January 2011 | Volume 6 | Issue 1 | e16266
There is also concordance in genes expressed in the frontal lobe,
where DNM1 and SYN2 are down-regulated, in both our data and
previous microarray studies. A comparison also highlights some
contradicting results, however, between RNA-Seq and microarray
techniques. PPP3CB is up-regulated in the temporal lobe in the
microarray study [26] but down-regulated in our dataset. GRIA4
and GRIK1 are shown to be expressed in senile plaques (in temporal
lobe) in microarray data [27] but are not identified as expressed in
the AD temporal lobe in the present RNA-Seq dataset.
Gene Ontology term enrichment analysis of differentially
expressed genes
The NCBI web-based functional annotation tool DAVID v 6.7
(Database for Annotation, Visualization and Integrated Discovery)
was used to investigate functional associations of gene expression
changes seen in AD brain [21]. Genes that were more than two-fold
over- or under-expressed were analyzed by functional clustering.
Gene Ontology Biological Process was selected as the annotation
category for clustering. Once the tool has identified enriched
ontologies for a particular gene list, it clusters those that have a
statistically significant overlap in terms of their constituent genes.
The gene lists used in this analysis contained 1416, 1071 and 944
genes for temporal, whole and frontal brain samples, respectively.
There is a high degree of overlap between the top ten most
enriched clusters (Tables S4, S5, S6). Protein localization is the most
enriched cluster across all three regions, while vesicle mediated
transport and phosphate metabolic processes are within the top five
clusters and proteolysis and regulation of GTPase activity are within
Table 5. Top ten up- and down-regulated genes in temporal lobe of AD brain.
Gene
Description
Chromosome
FPKM N
FPKM AD
Fold change
p-value
Ensembl ID
AC074289.1
Bac clone – not annotated
chr2
0.28593
3.793698
13.26792572
0.0129943
not annotated
MT1G
metallothionein 1G
chr16
15.1637
148.115649
9.767777587
0
ENSG00000125144
S100A4
S100 calcium binding protein A4
chr1
3.0191
23.552175
7.801058262
4.44E-016
ENSG00000196154
DES
desmin
chr2
4.23774
31.344441
7.396499313
0
ENSG00000175084
C19orf42
UPF0608 protein
C19orf42 Precursor
chr19
0.626087
4.153445
6.633974192
0.0132315
ENSG00000214046
MTPAP
mitochondrial poly(A)
polymerase
chr10
1.87181
12.003598
6.412829294
0.000124237
ENSG00000107951
NME3
non-metastatic cells 3,
protein expressed in
chr16
9.40287
45.776586
4.86836317
0
ENSG00000103024
KIF1C
kinesin family member
1C
chr17
39.0482
180.483489
4.622069366
0
ENSG00000129250
MAP4K4
mitogen-activated
protein kinase kinase
kinase kinase 4
chr2
5.65184
24.058735
4.256796902
7.85E-009
ENSG00000071054
TGFB3
transforming growth
factor, beta 3
chr14
4.62642
17.951668
3.880250388
0
ENSG00000119699
MICAL2
microtubule associated
monoxygenase,
calponin and LIM
domain containing 2
chr11
43.9961
0.240419
2
182.9976
0
ENSG00000133816
DYNC1I1
dynein, cytoplasmic 1,
intermediate chain 1
chr7
51.4985
0.292
2
176.364726
2.96E-013
ENSG00000158560
RPH3A
rabphilin 3A homolog
(mouse)
chr12
42.8148
0.271284
2
157.8227982
9.50E-013
ENSG00000089169
RASGRF1
Ras protein-specific
guanine nucleotide-releasing
factor 1
chr15
29.1194
0.19051
2
152.8497192
1.32E-012
ENSG00000058335
ATP2B1
ATPase, Ca
++
transporting, plasma
membrane 1
chr12
27.8105
0.195853
2
141.9968037
2.82E-012
ENSG00000070961
ELMOD1
ELMO/CED-12 domain
containing 1
chr11
25.7148
0.185023
2
138.9816401
0
ENSG00000110675
NELL2
NEL-like 2 (chicken)
chr12
48.256
0.356889
2
135.2129093
4.64E-012
ENSG00000184613
PDE2A
phosphodiesterase
2A, cGMP-stimulated
chr11
33.2491
0.250937
2
132.4997908
5.69E-012
ENSG00000186642
CAMKK2
calcium/calmodulin-dependent
protein
kinase kinase 2, beta
chr12
44.693
0.352967
2
126.6209022
8.97E-012
ENSG00000110931
ICAM5
intercellular adhesion
molecule 5,
telencephalin
chr19
20.7834
0.170851
2
121.6463468
1.34E-011
ENSG00000105376
Differential gene expression for temporal lobe was calculated using the ratio of AD versus normal (N) FPKM values for every gene identified as expressed by Cufflinks.
The genes were ranked on their fold changes and the ten with the highest or lowest fold changes are shown here.
doi:10.1371/journal.pone.0016266.t005
Transcriptome Sequencing of AD Brain
PLoS ONE | www.plosone.org
6
January 2011 | Volume 6 | Issue 1 | e16266
the top seven for all three tissue samples. The only brain-specific
cluster present in the top ten across all three samples is neuronal
development. This level of functional overlap between the samples is
to be expected given that they all originate from the same tissue.
Interestingly, the frontal lobe is different from the other samples
in that it shows greater changes in genes associated with brain-
specific biological processes. These are regulation of synaptic
transmission (rank 9), neurotransmitter transport (11), response to
metal ion (13), metal ion transport (15), regulation of synaptic
plasticity (18), negative regulation of neuron apoptosis (19) and
axon transport (20). By contrast, the brain-specific categories
apparent in the temporal lobe are axon transport (rank 14) and
neurotransmitter transport (18), and cerebellum development (12)
is implicated for the total brain.
Genes known to be involved in programmed cell death were
enriched in the frontal lobe of AD brain (rank 10) and an
induction of apoptosis is present in both frontal and temporal lobes
(rank 16 and 12, respectively). An over-representation of
apoptosis-related genes clearly indicates the ongoing process of
neurodegeneration and associated cell loss. The top 20 DAVID
functional clusters for total, frontal and temporal brain regions can
be seen in Tables S4, S5 and S6, respectively.
Alternative splicing and transcript identification using
RNA-Seq
A key feature of RNA Seq is its ability to identify alternative
splicing of transcripts. It also has an advantage over microarray-
based methods of detection in its ability to identify novel
transcripts. Accordingly, we next investigated the splicing status
of all genes and whether genes show differential splicing patterns
between normal and diseased tissues.
TopHat builds a database of potential splice junctions by
identifying the splice donor and acceptor sites (GT-AG) for each
region of a gene with high coverage of short mRNA reads.
TopHat then compares the previously unmapped reads against
this database of putative junctions. Regions of genes with a high
coverage are also screened for internal junction sites. One of the
advantages of identifying potential exons without using predefined
annotation information is the capability to highlight splicing in
unannotated regions of the genome.
A range of 52,438 to 54,808 splice junctions was predicted for
normal brain (Table 6). This corresponds to 2.1–2.2% of all reads.
By contrast, AD brain samples showed a lower number of splice
variants, ranging from 17,265 to 29,012 predicted junctions. This
corresponds to 0.47–1.28% of all reads. This difference is
statistically significant (Student’s t-test, p = 0.043).
Using the Cuffdiff algorithm to calculate differential expression
at the transcript level allowed discovery of which transcripts are
common, differentially expressed or present/absent between
normal and AD brain tissue.
Frontal, temporal and total brain specimens showed a large
proportion of transcripts at similar expression levels between normal
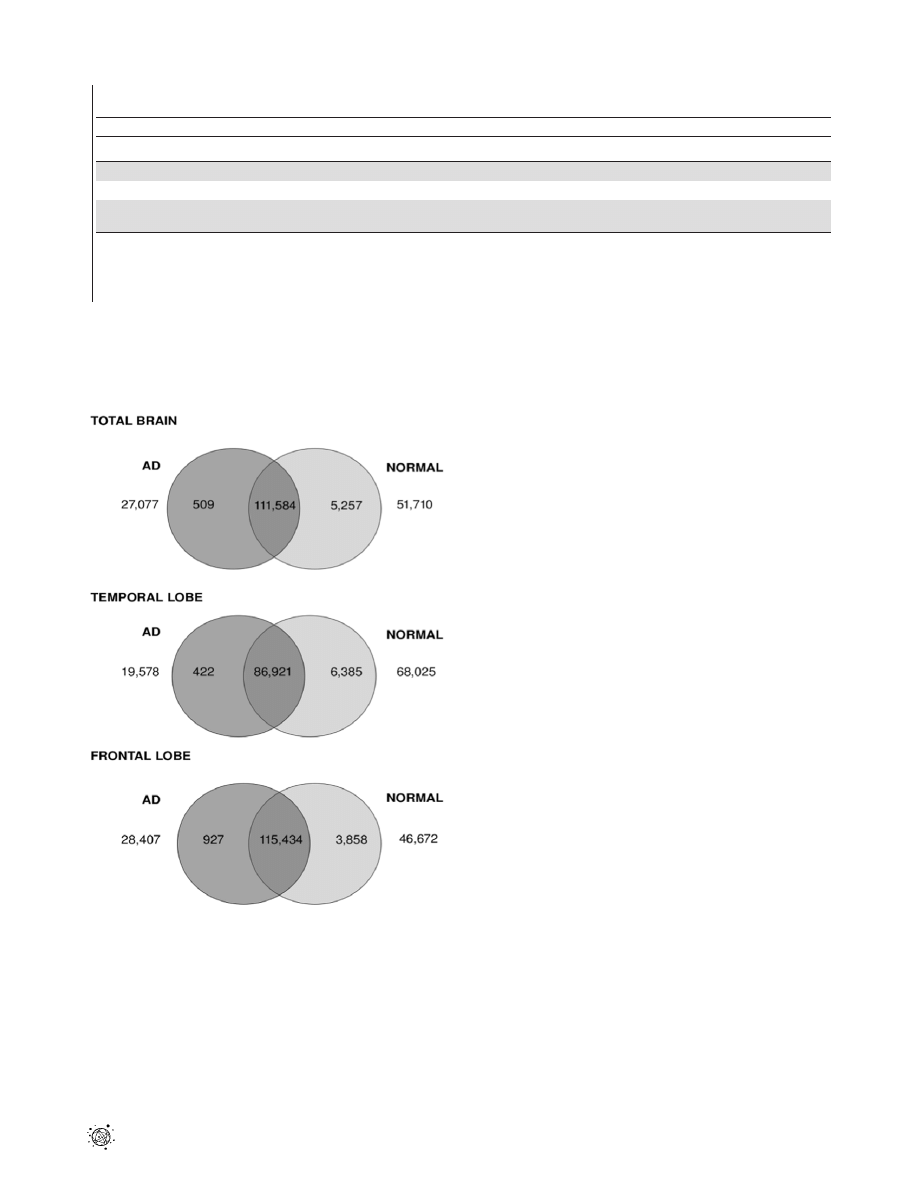
and AD tissue (Fig. 2). Specifically, there were 56%, 48% and 59%
Figure 2. Venn diagram showing distributions of differentially
expressed transcripts between healthy and AD brain. Venn
diagram showing the number of differentially expressed transcripts
between AD and normal tissue samples across total brain, temporal and
frontal lobe. The number of transcripts unique to AD and normal tissues
is shown in universe area outside the circles. The numbers of transcripts
up-regulated by more than two-fold in AD tissue are indicated in the
dark grey circle, while the numbers up-regulated by more than two-fold
in normal tissue are highlighted in the light grey circle. The intersection
of the two circles refers to number of transcripts which are expressed in
both AD and normal tissues but which are less than two-fold different
in expression level.
doi:10.1371/journal.pone.0016266.g002
Table 6. Splice junctions in normal and Alzheimer’s brains predicted by TopHat.
Total brain N
a
Total brain AD
b
Temp lobe N
Temp lobe AD
Front lobe N
Front lobe AD
Total reads
13,442,077
14,720,816
15,256,752
14,227,702
15,772,947
15,228,832
Total splice junctions
54,458
29,012
52,438
17,265
54,808
38,647
Reads mapping to splice
junctions (%)
2.14%
0.94%
2.10%
0.47%
2.20%
1.28%
RNA-Seq data were mapped to the UCSC Human genome build 19. The number of splice junctions predicted by TopHat is shown, as well as the percentage of the total
number of reads.
a
Normal brain samples.
b
Alzheimer’s disease brain samples.
doi:10.1371/journal.pone.0016266.t006
Transcriptome Sequencing of AD Brain
PLoS ONE | www.plosone.org
7
January 2011 | Volume 6 | Issue 1 | e16266

of transcripts showing less than two-fold expression difference in the
total brain, temporal and frontal lobes, respectively. The number of
transcripts up-regulated in AD tissue as compared to normal brain
ranged from 422 to 927, representing 0.2–0.5% of total transcripts.
The number of transcripts up-regulated in normal tissues compared
to AD brain was larger in each case, ranging from 3858 (1.98%) to
6385 (3.52%).
Further analysis revealed a considerable portion of transcripts
that were unique to either AD or normal brains. AD brain tissue
showed between 19,578 and 28,407 (10.7–14.5%) unique
transcripts compared to the corresponding normal tissue. Larger
numbers of transcripts were seen to be unique to normal tissue, for
which between 46,672 to 68,025 transcripts were observed (23.9%
to 37.5%).
Transcriptional and post-transcriptional regulation
between normal and AD brain tissue
To detect transcriptional regulation, RNA-Seq data can be
analyzed with Cufflinks. This identifies how many transcription
start sites (TSS) are used in each gene and groups transcripts from
that gene by their TSS. Each TSS is thus associated with a
primary transcript. Cufflinks compares ratios of grouped tran-
scripts between normal and AD tissue to detect alternative
promoter usage. Cufflinks also identifies post-transcriptional
regulation by looking for changes in relative abundances of
mRNAs spliced from the same primary transcript between normal
and AD tissue, which it detects as alternative splicing. In this way,
Cufflinks discriminates between transcriptional and post-transcrip-
tional processing [17].
Cufflinks analysis of the transcriptome from total brain,
temporal and frontal lobe samples revealed that numerous genes
are controlled by different promoters in normal and AD tissue
(Table 7). Comparative analysis of the total brain samples resulted
in the identification of five genes (CANX, DNAJC5, MGEA5,
TMEM66, WDR92) with statistically significant usage of alterna-
tive promoters in AD samples (p,0.05 and passing false discovery
rate threshold). Using the same selection criteria, frontal and
temporal lobe samples from the AD brain showed alternative
promoter usage in eleven genes (ACAP3, ARGLU1, CHD3, KIF5A,
LENG8, MAPK3, NR1D1, PDE1B, PIP5K2B, RPH3A, WDR47) and
three genes (APOE, KIF5A, PP2R4), respectively.
We also investigated whether splicing patterns for transcripts
sharing the same transcription start site (TSS) differ between
normal and AD brain tissue (Table 8). Statistically significant
alternative splicing between normal and AD total brain was
detected for the following four genes: CALM3, CANX, DNAJC5
and MGEA5. Moreover, alternative splicing was detected at a
statistically significant level in frontal and temporal brain samples
for fifteen and four genes, respectively. For the frontal lobe these
include ACAP3, AP2B1, ATN1, B2M, CHD3, CTBP1, EFHD2,
LENG8, MAPK3, NR1D1, NUDCD3, PDE1B, RHBDD2, SEPT5
and WDR47, and the genes APOE, KIF5A, PDZD4 and SPTBN1 in
the temporal lobe.
Identification of alternative splicing and promoter usage
for apolipoprotein E (APOE)
Apolipoprotein E gene (APOE) is of particular interest due to its
relevance to AD molecular pathology [28]. The mapping of reads
Table 7. Genes showing alternative promoter usage.
Gene
Description
p-value
Total brain
CANX
calnexin
0
DNAJC5
DnaJ (Hsp40) homolog, subfamily C, member 5
5.64E-006
MGEA5
meningioma expressed antigen 5 (hyaluronidase)
0
TMEM66
transmembrane protein 66
1.16E-009
WDR92
WD repeat domain 92
0
Frontal lobe
ACAP3
ArfGAP with coiled-coil, ankyrin repeat and PH domains 3
2.24E-005
ARGLU1
arginine and glutamate rich 1
6.43E-007
CHD3
chromodomain helicase DNA binding protein 3
0
KIF5A
kinesin family member 5A
2.35E-013
LENG8
leukocyte receptor cluster (LRC) member 8
0
MAPK3
mitogen-activated protein kinase 3
0
NR1D1
nuclear receptor subfamily 1, group D, member 1
0
PDE1B
phosphodiesterase 1B, calmodulin-dependent
0
PIP5K2B
phosphatidylinositol-5-phosphate 4-kinase, type II, beta
2.22E-016
RPH3A
rabphilin 3A homolog (mouse)
0
WDR47
WD repeat domain 47
0
Temporal lobe
APOE
apolipoprotein E
1.92E-006
KIF5A
kinesin family member 5A
0
PPP2R4
protein phosphatase 2A activator, regulatory subunit 4
7.18E-007
Genes identified by Cufflinks as exhibiting statistically significant alternative promoter usage between normal and AD tissue. Results are shown for total brain, frontal
and temporal lobe tissue.
doi:10.1371/journal.pone.0016266.t007
Transcriptome Sequencing of AD Brain
PLoS ONE | www.plosone.org
8
January 2011 | Volume 6 | Issue 1 | e16266

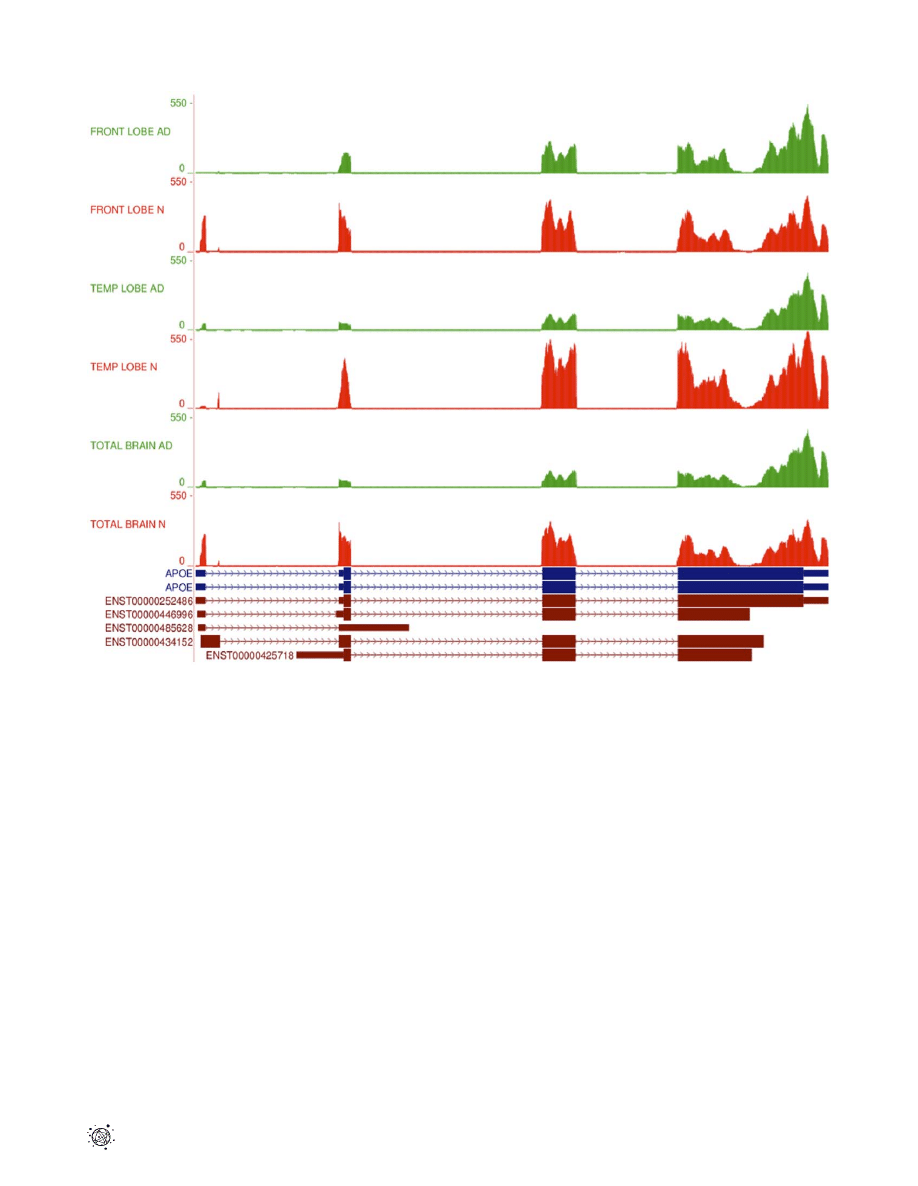
for all six samples to the reference genome shows differences in
expression levels for individual APOE exons (Fig. 3). Cufflinks
quantification of differential gene expression showed a 2.13-fold
down-regulation
of
APOE
in
the
AD
temporal
lobe
(p = 4.19610
27
). It also highlighted the possibility of differential
gene splicing. Detailed analysis of transcripts revealed three
different APOE transcriptional isoforms, namely APOE-001
(ENST00000252486),
APOE-002
(ENST00000446996)
and
APOE-005 (ENST00000425718), in both temporal lobe samples.
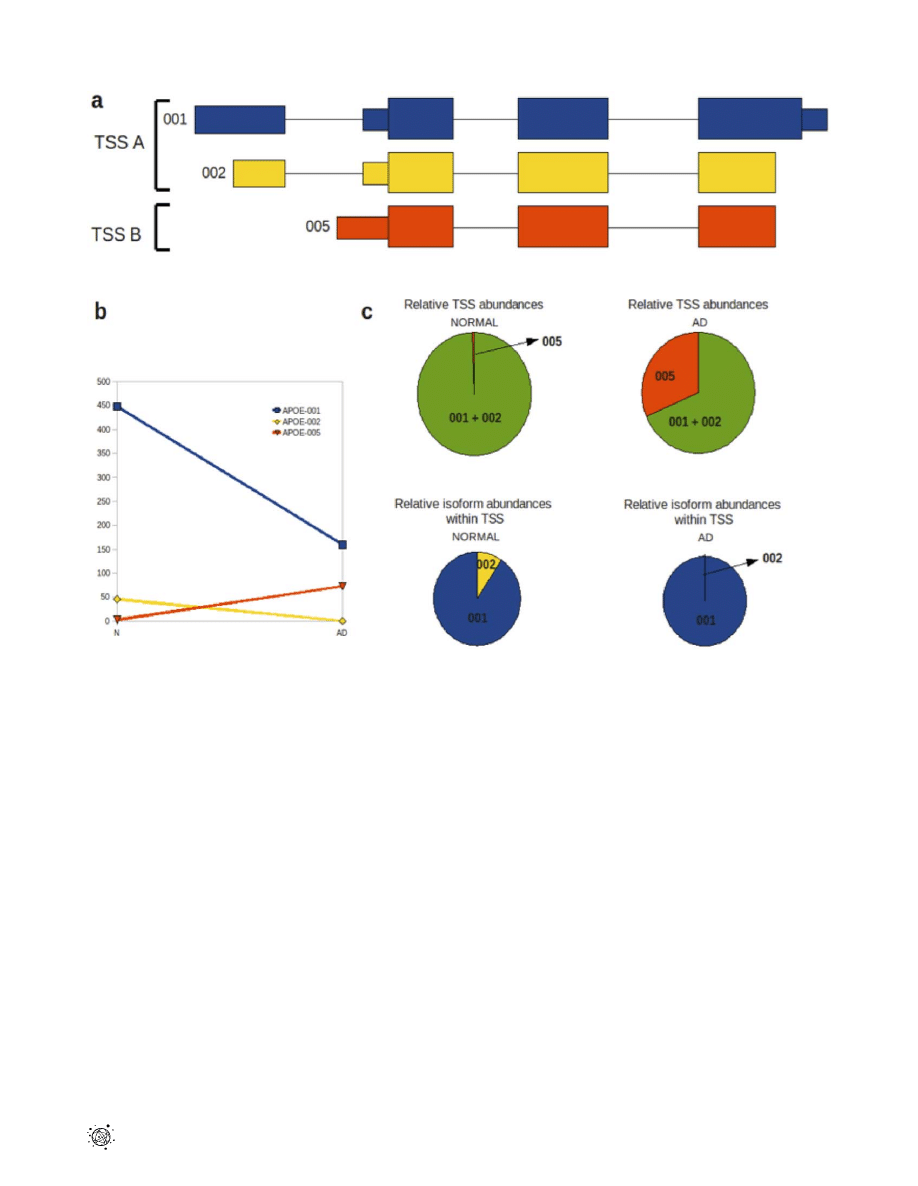
The APOE-001 and -002 isoforms contain exon 1 whereas the
-005 isoform is generated by an alternative promoter upstream of
the second APOE exon. Two transcription start sites (TSS) were
identified for the APOE gene in both temporal lobe samples, which
will be referred to as TSS A and TSS B. Isoforms APOE-001 and
-002 are transcribed from TSS A, while APOE-005 is transcribed
from TSS B (Fig. 4a). Comparative analysis of TSS A and TSS B
revealed a 26.5-fold up-regulation of the latter in AD temporal
lobe (p,1610
216
) and 3.09-fold down-regulation of the former in
AD temporal lobe (p = 5.11610
215
; Fig. 4b,c).
In addition to a switch in promoter usage in the normal and AD
temporal lobe, significant alternative splicing between the two
isoforms is seen under the control of TSS A (p = 1.46610
210
). The
abundance of isoform APOE-002 is reduced in AD temporal lobe
to an almost negligible level of 0.02 FPKM, compared with 45.83
in the normal counterpart. APOE-001 also shows a reduction in
abundance of 2.81-fold in AD relative to normal temporal lobe,
however it still remains the dominant isoform expressed in the AD
temporal lobe at 159.43 FPKM. The APOE-005 isoform has a
FPKM of 73.08 in the AD temporal lobe (Fig. 4c).
A comparison of APOE splicing and promoter use in the frontal
lobe and total brain did not reveal expression pattern differences as
seen in the temporal lobe. Cufflinks does not detect the APOE-002
isoform in either frontal or total brain samples, and no alternative
splicing or promoter usage was detected between the normal and AD
samples. Focusing on APOE expression in temporal lobe clearly
illustrates that, used together, RNA-Seq and Cufflinks can identify not
only transcriptional regulation of a gene but also post-transcriptional
regulation of primary transcripts via alternative splicing.
Identification of APOE alleles in the AD samples
To identify which allele of APOE was present in the temporal,
frontal lobe and total brain AD samples, the genotype of SNPs
rs429358 and rs7412 were determined. These two SNPs are
associated with the amino acid changes at positions 112 and 158 in
the ApoE isoforms. SNP rs429358 showed a T/T genotype for
temporal, frontal lobe and total brain samples. This genotype
translates to a Cys at position 112 of the protein. SNP rs7412 showed
a C/C genotype in temporal lobe and total brain samples and a C/T
Table 8. Genes showing alternative splicing.
Gene
Description
p-value
Total brain
CALM3
calmodulin 3 (phosphorylase kinase, delta)
1.11E-016
CANX
calnexin
0
DNAJC5
DnaJ (Hsp40) homolog, subfamily C, member 5
1.38E-008
MGEA5
meningioma expressed antigen 5 (hyaluronidase)
0
Frontal lobe
ACAP3
ArfGAP with coiled-coil, ankyrin repeat and PH domains 3
0
AP2B1
adaptor-related protein complex 2, beta 1 subunit
1.07E-010
ATN1
atrophin 1
2.34E-008
B2M
beta-2-microglobulin
6.68E-004
CHD3
chromodomain helicase DNA binding protein 3
3.16E-005
CTBP1
C-terminal binding protein 1
1.06E-009
EFHD2
EF-hand domain family, member D2
2.66E-007
LENG8
leukocyte receptor cluster (LRC) member 8
0
MAPK3
mitogen-activated protein kinase 3
0
NR1D1
nuclear receptor subfamily 1, group D, member 1
3.73E-007
NUDCD3
NudC domain containing 3
2.11E-004
PDE1B
phosphodiesterase 1B, calmodulin-dependent
3.42E-004
RHBDD2
rhomboid domain containing 2
0
SEPT5
septin 5
4.44E-016
WDR47
WD repeat domain 47
6.65E-009
Temporal lobe
APOE
apolipoprotein E
1.56E-010
KIF5A
kinesin family member 5A
2.22E-016
PDZD4
PDZ domain containing 4
9.39E-005
SPTBN1
spectrin, beta, non-erythrocytic 1
8.47E-007
Gene names for transcripts identified by Cufflinks as exhibiting statistically significant alternative splicing between normal and AD tissue. Results are shown for total
brain, frontal and temporal lobe tissue. Alternative splicing is detected between transcripts, which share the same transcription start site (TSS).
doi:10.1371/journal.pone.0016266.t008
Transcriptome Sequencing of AD Brain
PLoS ONE | www.plosone.org
9
January 2011 | Volume 6 | Issue 1 | e16266
genotype for the frontal lobe sample. The C allele translates to an Arg
at position 158 of the protein, while a T allele translates to a Cys. The
Cys112/Arg158 combination in the ApoE protein reflects the
presence of the e3 allele, while the Cys112/Cys158 combination
indicates presence of the APOE e2 allele. Thus, both temporal lobe
and total brain AD samples exhibit the APOE e3 allele, while frontal
lobe AD sample has an equal mix of the e2 and e3 allele.
Discussion
Our study provides the first comprehensive insight into the
transcriptome of brain tissue affected by Alzheimer’s disease. Using a
whole transcriptome sequencing technique (RNA-Seq), we were able
to identify the levels of differentially expressed genes and establish
genes with alternative promoter usage and splicing patterns that
changed in association with neurodegeneration. Moreover, compar-
ative analysis of samples derived from different brain regions
produced an increased molecular resolution for our analysis. This
revealed that the frontal and temporal lobes of AD brains not only
differed in the quantitative composition of the genes expressed but
also showed lobe-specific alternations in transcript assembly.
For whole transcriptome sequencing, we used an Illumina
Genome Analyser II with 36 bp sequence reads length. We
obtained ,14610
6
sequence reads per sample, which has been
previously reported to deliver sufficient sequence coverage for
transcriptome profiling [13]. Our rate of 90-92% of reads that
map to the reference genome met quality standards of the RNA-
Seq technique [29]. An estimation of the number of reads covering
chromosome 1 (1,937,546 reads on average) was approximately
12.9% of all reads generated per transcriptome (14,974,824 reads
on average). Human chromosome 1 comprises 8% of the human
genome and contains 3,141 genes, or 13.6% of all annotated genes
[30]. Hence, we conclude that our mRNA-Seq data provide good
representation of expressed genes in the human genome.
Cufflinks analysis of gene isoform expression levels, alternative
splicing and alternative promoter usage revealed significant
differences in transcriptome profiles between frontal and temporal
lobe of the AD brain. These variations might reflect temporal and
spatial differences in the progression of AD neuropathology across
the aging brain. Widespread neuronal loss and a presence of the
intraneuronal neurofibrillary tangles (NFTs) and the extracellular
Figure 3. RNA-Seq read mapping to the reference for
APOE.
RNA-Seq read mapping to the UCSC reference genome (hg19) of the gene APOE
for all 6 samples in this study. The AD tracks are shown in green and normal samples in red. It is clear that the reads map to the 4 exons of the APOE
gene as annotated in the UCSC database (APOE exons shown in blue). The absolute read counts for each sample are indicated on the y axis. A
schematic representation of the 5 Ensembl transcripts for APOE is shown in brown at the bottom of the figure. N – normal brain samples; AD –
Alzheimer’s disease brain samples.
doi:10.1371/journal.pone.0016266.g003
Transcriptome Sequencing of AD Brain
PLoS ONE | www.plosone.org
10
January 2011 | Volume 6 | Issue 1 | e16266
neuritic or senile plaques (NPs) are key features of the AD
neuropathology. The main components of NPs are peptides of
varying length collectively described as beta-amyloid whereas
NFTs are mainly composed of paired helical filaments of a
hyperphosphorylated form of the microtubule-associated protein
tau (MAPT) [31,32]. NFTs first arise in the entorhinal cortex of
the medial temporal lobe and then spread toward the hippocam-
pal CA1 region. NFTs formation then progresses to the temporal
and frontal neocortices, and finally affects primary cortices [33].
Thus the temporal and frontal lobe samples used in this study
might approximately represent brain regions at distinct stages of
the neurodegeneration process, with the temporal lobe affected
first, followed by the frontal lobe of the brain.
The tissue-specific enrichment for gene ontology processes
suggest region-specific, sequential progression of brain tissue
neurodegeneration, with the temporal lobe being affected earlier
than the frontal part of the cortex [33]. Consequently, neuronal
activity in the frontal lobe may be more vigorous at the time of
sample donation. This might count for over-representation of GO
terms such as regulation of synaptic plasticity and negative
regulation of neuronal apoptosis. In contrast, neurons of the
temporal lobe might exist in a more advanced phase of functional
deterioration. This in turn is reflected by the more non-neuronally
specific transcriptome patterns seen in samples derived from the
total brain in this study. We do observe an over-representation of
genes related to apoptosis that is consistent with previous reports,
however there was no evidence in our analysis for AD-associated
changes in the immune response [34].
Many of the changes we observed in gene expression between
normal and AD brains were similar to those reported previously.
However, some differences were noted. This lack of concordance
among our RNA-Seq transcriptome data set and previously
reported gene expression profiles is likely to stem from inherent
limitations in microarray systems. For example, background levels
of hybridization (i.e. hybridization to a probe that occurs
irrespective of the corresponding transcript’s expression level)
limit the accuracy of microarray expression measurements,
particularly for transcripts present at low abundance. Further-
more, probes differ considerably in their hybridization properties
[35]. Thus, although comparing hybridization results across arrays
Figure 4. Alternative splicing and promoter usage for the
APOE
gene in temporal lobe tissue. (a) Transcriptional isoforms APOE-001,
APOE-002 and APOE-005 are detected in both normal and AD temporal lobes; APOE-001 and -002 have transcription start site (TSS) A and 005 is
initiated at TSS B. Isoform 005 comprises exons 2, 3 and 4 while isoforms 001 and 002 contain all 4 exons. (
b) Isoforms 001 and 002 show decreased
expression in AD relative to normal temporal lobe, while isoform 005 shows a relative increase in the AD temporal lobe. (
c) Relative changes in TSS
abundance between normal and AD temporal lobes are indicated by the green/red pie charts, while changes in the two TSS A group isoforms (001
and 002) between normal and AD temporal lobes are shown by the blue/yellow pie charts.
doi:10.1371/journal.pone.0016266.g004
Transcriptome Sequencing of AD Brain
PLoS ONE | www.plosone.org
11
January 2011 | Volume 6 | Issue 1 | e16266

can identify gene expression differences among samples [36],
hybridization results from a single sample may not provide a
reliable measure of relative expression for different transcripts. By
contrast, the Illumina sequencing data have been described as
replicable with relatively little technical variation, thus for many
purposes it may suffice to sequence each mRNA sample only once.
The information gained from a single lane of Illumina flow cell, as
done in the present study, provides a comprehensive analysis of
transcripts and enables identification with confidence of differen-
tially expressed genes [11,37].
Moreover, validation techniques such as quantitative PCR
(qPCR) [38,39] and spike-in RNA [29] have demonstrated that
RNA-Seq is extremely accurate. Accordingly, a false positive rate
,2% has been demonstrated for this technique [40]. As recently
reported by Marioni et al., qPCR results agreed more closely with
Illumina sequencing results than with microarrays [11].
Regarding quantification of gene expression, Cufflinks analysis
of RNA-Seq data allowed us to dissect expression of individual
genes into quantification of particular mRNA isoforms contribut-
ing to the final cumulative value of gene expression. To our
knowledge, this is the first report where quantitative information
about particular splice variants at a genome-wide scale has been
generated for different anatomical segments of normal and AD
brains. Thus, our study creates a useful data set supplementing
previous microarray-generated information, which lacked isoform-
specific resolution of gene expression [9,41].
Despite the magnitude of the APOE e4 risk effect and a possible
mechanistic link with amyloid beta (Ab) pathology [34,42,43], it is still
far from clear how APOE e4 is involved in AD pathogenesis [44].
Interestingly, the APOE genotype in the case of AD samples used in
this study was e3, which is considered to have no effect on AD onset.
This suggests that the observed alternative promoter and TSS usage
during APOE expression in the AD temporal lobe might be
independent of the Cys
)Arg substitution at position 112. Following
this line of reasoning, differential APOE expression patterns - as
indicated in this report - might be independent of the amyloid beta
aggregation pathway in the course of Alzheimer’s disease. Indeed,
previous observations of alternative splicing in AD brains for
glutamate transporter [45], PIN1 [46], estrogen receptor alpha [47]
and the APOE receptor [48] genes strongly suggest that alteration of
transcriptional control for genes involved in neuronal physiology is a
landmark of ongoing neurodegeneration. In light of our observations
of alternative APOE expression, the previously reported AD-specific
splicing pattern of the APOE receptor further suggests the functional
relevance of lipid metabolism in the context of AD pathology [49].
Moreover, it has previously been proposed that synthesis of ApoE
might play a role in regional vulnerability of neurons in AD [50].
How this might relate to the presence of different transcriptional
variants of APOE remains a subject for future studies.
Supporting Information
Table S1
Top 30 up and top 30 down regulated genes in AD
total brain. Differential gene expression for total brain was
calculated using the ratio of AD versus normal FPKM values for
every gene identified as expressed by Cufflinks. The genes were
ranked on this ratio (fold change), and those with the 30 highest
and 30 lowest fold change values are shown here.
(XLSX)
Table S2
Top 30 up and top 30 down regulated genes in AD
frontal lobe. Differential gene expression for frontal lobe was
calculated using the ratio of AD versus normal FPKM values for
every gene identified as expressed by Cufflinks. The genes were
ranked on this ratio (fold change), and those with the 30 highest
and 30 lowest fold change values are shown here.
(XLSX)
Table S3
Top 30 up and top 30 down regulated genes in AD
temporal lobe. Differential gene expression for temporal lobe was
calculated using the ratio of AD versus normal FPKM values for
every gene identified as expressed by Cufflinks. The genes were
ranked on this ratio (fold change), and those with the 30 highest
and 30 lowest fold change values are shown here.
(XLSX)
Table S4
Top 20 Clusters from functional enrichment analysis
using the DAVID tool for total brain. The NCBI tool, DAVID, was
used to investigate functional associations of gene expression changes
seen in AD total brain. There were 1071 genes that were more than
two-fold over- or under-expressed in AD relative to normal total
brain and these were analysed by the functional clustering tool. Gene
Ontology Biological Process was selected as the annotation category
for clustering. Once the tool has identified enriched ontologies for a
particular gene list, it creates annotation clusters with those that have
a statistically significant overlap in terms of their constituent genes.
The top 20 annotation clusters are shown in this table.
(XLSX)
Table S5
Top 20 Clusters from functional enrichment analysis
using the DAVID tool for frontal lobe. The NCBI tool, DAVID, was
used to investigate functional associations of gene expression changes
seen in AD frontal lobe. There were 944 genes that were more than
two-fold over- or under-expressed in AD relative to normal frontal
lobe and these were analysed by the functional clustering tool. Gene
Ontology Biological Process was selected as the annotation category
for clustering. Once the tool has identified enriched ontologies for a
particular gene list, it creates annotation clusters with those that have
a statistically significant overlap in terms of their constituent genes.
The top 20 annotation clusters are shown in this table.
(XLSX)
Table S6
Top 20 Clusters from functional enrichment analysis
using the DAVID tool for temporal lobe. The NCBI tool, DAVID,
was used to investigate functional associations of gene expression
changes seen in AD temporal lobe. There were 1416 genes that
were more than two-fold over- or under-expressed in AD relative
to normal temporal lobe and these were analysed by the functional
clustering tool. Gene Ontology Biological Process was selected as
the annotation category for clustering. Once the tool has identified
enriched ontologies for a particular gene list, it creates annotation
clusters with those that have a statistically significant overlap in
terms of their constituent genes. The top 20 annotation clusters are
shown in this table.
(XLSX)
Author Contributions
Conceived and designed the experiments: MJ KJ. Performed the
experiments: MJ KJ. Analyzed the data: NAT MRW MJ. Wrote the
paper: NAT MRW MJ.
References
1. Evans DA, Funkenstein HH, Albert MS, Scherr PA, Cook NR, et al. (1989)
Prevalence of Alzheimer’s disease in a community population of older persons.
Higher than previously reported. JAMA 262: 2551–2556.
2. Corder EH, Saunders AM, Risch NJ, Strittmatter WJ, Schmechel DE, et al.
(1994) Protective effect of apolipoprotein E type 2 allele for late onset Alzheimer
disease. Nat Genet 7: 180–184.
Transcriptome Sequencing of AD Brain
PLoS ONE | www.plosone.org
12
January 2011 | Volume 6 | Issue 1 | e16266

3. Geula C, Mesulam MM (1995) Cholinesterases and the pathology of Alzheimer
disease. Alzheimer Dis Assoc Disord 9 Suppl 2: 23–28.
4. Raschetti R, Albanese E, Vanacore N, Maggini M (2007) Cholinesterase
inhibitors in mild cognitive impairment: a systematic review of randomised trials.
PLoS Med 4: e338.
5. Soldner F, Hockemeyer D, Beard C, Gao Q, Bell GW, et al. (2009) Parkinson’s
disease patient-derived induced pluripotent stem cells free of viral reprogram-
ming factors. Cell 136: 964–977.
6. Matigian N, Abrahamsen G, Sutharsan R, Cook AL, Vitale AM, et al. (2010)
Disease-specific, neurosphere-derived cells as models for brain disorders. Dis
Model Mech.
7. Atz M, Walsh D, Cartagena P, Li J, Evans S, et al. (2007) Methodological
considerations for gene expression profiling of human brain. J Neurosci Methods
163: 295–309.
8. Monoranu CM, Apfelbacher M, Grunblatt E, Puppe B, Alafuzoff I, et al. (2009)
pH measurement as quality control on human post mortem brain tissue: a study
of the BrainNet Europe consortium. Neuropathol Appl Neurobiol 35: 329–337.
9. Courtney E, Kornfeld S, Janitz K, Janitz M (2010) Transcriptome profiling in
neurodegenerative disease. J Neurosci Methods 193: 189–202.
10. Janitz M (2008) Next-generation genome sequencing: towards personalized
medicine. Weinheim: Wiley-VCH.
11. Marioni JC, Mason CE, Mane SM, Stephens M, Gilad Y (2008) RNA-seq: an
assessment of technical reproducibility and comparison with gene expression
arrays. Genome Res 18: 1509–1517.
12. Richard H, Schulz MH, Sultan M, Nurnberger A, Schrinner S, et al. (2010)
Prediction of alternative isoforms from exon expression levels in RNA-Seq
experiments. Nucleic Acids Res 38: e112.
13. Sultan M, Schulz MH, Richard H, Magen A, Klingenhoff A, et al. (2008) A
global view of gene activity and alternative splicing by deep sequencing of the
human transcriptome. Science 321: 956–960.
14. van Bakel H, Nislow C, Blencowe BJ, Hughes TR (2010) Most ‘‘dark matter’’
transcripts are associated with known genes. PLoS Biol 8: e1000371.
15. Trapnell C, Pachter L, Salzberg SL (2009) TopHat: discovering splice junctions
with RNA-Seq. Bioinformatics 25: 1105–1111.
16. Langmead B, Trapnell C, Pop M, Salzberg SL (2009) Ultrafast and memory-
efficient alignment of short DNA sequences to the human genome. Genome Biol
10: R25.
17. Trapnell C, Williams BA, Pertea G, Mortazavi A, Kwan G, et al. (2010)
Transcript assembly and quantification by RNA-Seq reveals unannotated
transcripts and isoform switching during cell differentiation. Nat Biotechnol 28:
511–515.
18. Jiang H, Wong WH (2009) Statistical inferences for isoform expression in RNA-
Seq. Bioinformatics 25: 1026–1032.
19. Flicek P, Aken BL, Beal K, Ballester B, Caccamo M, et al. (2008) Ensembl 2008.
Nucleic Acids Res 36: D707–714.
20. Zweig AS, Karolchik D, Kuhn RM, Haussler D, Kent WJ (2008) UCSC
genome browser tutorial. Genomics 92: 75–84.
21. Dennis G, Jr., Sherman BT, Hosack DA, Yang J, Gao W, et al. (2003) DAVID:
Database for Annotation, Visualization, and Integrated Discovery. Genome Biol
4: P3.
22. Bullard JH, Purdom E, Hansen KD, Dudoit S (2010) Evaluation of statistical
methods for normalization and differential expression in mRNA-Seq experi-
ments. BMC Bioinformatics 11: 94.
23. Levy JE, Jin O, Fujiwara Y, Kuo F, Andrews NC (1999) Transferrin receptor is
necessary for development of erythrocytes and the nervous system. Nat Genet
21: 396–399.
24. Zecca L, Youdim MB, Riederer P, Connor JR, Crichton RR (2004) Iron, brain
ageing and neurodegenerative disorders. Nat Rev Neurosci 5: 863–873.
25. Kaneko N, Marin O, Koike M, Hirota Y, Uchiyama Y, et al. (2010) New
neurons clear the path of astrocytic processes for their rapid migration in the
adult brain. Neuron 67: 213–223.
26. Hata R, Masumura M, Akatsu H, Li F, Fujita H, et al. (2001) Up-regulation of
calcineurin Abeta mRNA in the Alzheimer’s disease brain: assessment by cDNA
microarray. Biochem Biophys Res Commun 284: 310–316.
27. Ginsberg SD, Crino PB, Hemby SE, Weingarten JA, Lee VM, et al. (1999)
Predominance of neuronal mRNAs in individual Alzheimer’s disease senile
plaques. Ann Neurol 45: 174–181.
28. Bettens K, Sleegers K, Van Broeckhoven C (2010) Current status on Alzheimer
disease molecular genetics: from past, to present, to future. Hum Mol Genet 19:
R4–R11.
29. Mortazavi A, Williams BA, McCue K, Schaeffer L, Wold B (2008) Mapping and
quantifying mammalian transcriptomes by RNA-Seq. Nat Methods 5: 621–628.
30. Gregory SG, Barlow KF, McLay KE, Kaul R, Swarbreck D, et al. (2006) The
DNA sequence and biological annotation of human chromosome 1. Nature 441:
315–321.
31. Kosik KS, Joachim CL, Selkoe DJ (1986) Microtubule-associated protein tau
(tau) is a major antigenic component of paired helical filaments in Alzheimer
disease. Proc Natl Acad Sci U S A 83: 4044–4048.
32. Masters CL, Simms G, Weinman NA, Multhaup G, McDonald BL, et al. (1985)
Amyloid plaque core protein in Alzheimer disease and Down syndrome. Proc
Natl Acad Sci U S A 82: 4245–4249.
33. Braak H, Braak E (1991) Neuropathological stageing of Alzheimer-related
changes. Acta Neuropathol 82: 239–259.
34. Bossers K, Wirz KT, Meerhoff GF, Essing AH, van Dongen JW, et al. (2010)
Concerted changes in transcripts in the prefrontal cortex precede neuropathol-
ogy in Alzheimer’s disease. Brain 133: 3699–3723.
35. Gautier L, Cope L, Bolstad BM, Irizarry RA (2004) affy–analysis of Affymetrix
GeneChip data at the probe level. Bioinformatics 20: 307–315.
36. Allison DB, Cui X, Page GP, Sabripour M (2006) Microarray data analysis:
from disarray to consolidation and consensus. Nat Rev Genet 7: 55–65.
37. Bradford JR, Hey Y, Yates T, Li Y, Pepper SD, et al. (2010) A comparison of
massively parallel nucleotide sequencing with oligonucleotide microarrays for
global transcription profiling. BMC Genomics 11: 282.
38. Nagalakshmi U, Wang Z, Waern K, Shou C, Raha D, et al. (2008) The
transcriptional landscape of the yeast genome defined by RNA sequencing.
Science 320: 1344–1349.
39. Asmann YW, Klee EW, Thompson EA, Perez EA, Middha S, et al. (2009) 39 tag
digital gene expression profiling of human brain and universal reference RNA
using Illumina Genome Analyzer. BMC Genomics 10: 531.
40. Wang ET, Sandberg R, Luo S, Khrebtukova I, Zhang L, et al. (2008)
Alternative isoform regulation in human tissue transcriptomes. Nature 456:
470–476.
41. Sutherland GT, Janitz M, Kril JJ (2010) Understanding the pathogenesis of
Alzheimer’s disease: Will RNA-Seq realize the promise of transcriptomics?
J Neurochem.
42. Holtzman DM, Bales KR, Tenkova T, Fagan AM, Parsadanian M, et al. (2000)
Apolipoprotein E isoform-dependent amyloid deposition and neuritic degener-
ation in a mouse model of Alzheimer’s disease. Proc Natl Acad Sci U S A 97:
2892–2897.
43. Sadowski MJ, Pankiewicz J, Scholtzova H, Mehta PD, Prelli F, et al. (2006)
Blocking the apolipoprotein E/amyloid-beta interaction as a potential
therapeutic approach for Alzheimer’s disease. Proc Natl Acad Sci U S A 103:
18787–18792.
44. Kok E, Haikonen S, Luoto T, Huhtala H, Goebeler S, et al. (2009)
Apolipoprotein E-dependent accumulation of Alzheimer disease-related lesions
begins in middle age. Ann Neurol 65: 650–657.
45. Guo H, Lai L, Butchbach ME, Lin CL (2002) Human glioma cells and
undifferentiated primary astrocytes that express aberrant EAAT2 mRNA inhibit
normal EAAT2 protein expression and prevent cell death. Mol Cell Neurosci
21: 546–560.
46. Maruszak A, Safranow K, Gustaw K, Kijanowska-Haladyna B, Jakubowska K,
et al. (2009) PIN1 gene variants in Alzheimer’s disease. BMC Med Genet 10:
115.
47. Ishunina TA, Swaab DF (2009) Hippocampal estrogen receptor-alpha splice
variant TADDI in the human brain in aging and Alzheimer’s disease.
Neuroendocrinology 89: 187–199.
48. Beffert U, Nematollah Farsian F, Masiulis I, Hammer RE, Yoon SO, et al.
(2006) ApoE receptor 2 controls neuronal survival in the adult brain. Curr Biol
16: 2446–2452.
49. Bales KR (2010) Brain lipid metabolism, apolipoprotein E and the pathophys-
iology of Alzheimer’s disease. Neuropharmacology 59: 295–302.
50. Xu PT, Gilbert JR, Qiu HL, Ervin J, Rothrock-Christian TR, et al. (1999)
Specific regional transcription of apolipoprotein E in human brain neurons.
Am J Pathol 154: 601–611.
Transcriptome Sequencing of AD Brain
PLoS ONE | www.plosone.org
13
January 2011 | Volume 6 | Issue 1 | e16266
Wyszukiwarka
Podobne podstrony:
journal pone 0050315
journal pone 0147452
Open Access and Academic Journal Quality
Electrochemical properties for Journal of Polymer Science
journal design
Derrida, Jacques «Hostipitality» Journal For The Theoretical Humanities
Huang et al 2009 Journal of Polymer Science Part A Polymer Chemistry
Ionic liquids solvent propert Journal of Physical Organic Che
1848 Journal?s oesterreichischen Lloyd
Funding open access journal
09 Spring QUATERLY JOURNAL
Impact Journalism Day 2015
extraction and analysis of indole derivatives from fungal biomass Journal of Basic Microbiology 34 (
[WAŻNE] Minister Falah Bakir's letter to Wall Street Journal 'Don't forget Kurds' role in Iraq' (05
Dannenberg et al 2015 European Journal of Organic Chemistry
Journal Teens Vs Law
Journal of KONES 2011 NO 3 VOL Nieznany
Issues in Publishing an Online, Open Access CALL Journal
więcej podobnych podstron