
User Re-Authentication via Mouse Movements
Maja Pusara
School of Electrical and Computer Engineering
Purdue University
West Lafayette, IN 47906-2035 USA
maja@ecn.purdue.edu
Carla E. Brodley
Department of Computer Science
Tufts University
Medford, MA 02155 USA
brodley@cs.tufts.edu
ABSTRACT
We present an approach to user re-authentication based on
the data collected from the computer’s mouse device. Our
underlying hypothesis is that one can successfully model
user behavior on the basis of user-invoked mouse move-
ments. Our implemented system raises an alarm when the
current behavior of user X, deviates sufficiently from learned
“normal” behavior of user X. We apply a supervised learn-
ing method to discriminate among k users. Our empirical
results for eleven users show that we can differentiate these
individuals based on their mouse movement behavior with
a false positive rate of 0.43% and a false negative rate of
1.75%. Nevertheless, we point out that analyzing mouse
movements alone is not sufficient for a stand-alone user re-
authentication system.
Categories and Subject Descriptors
K.6.5 [Computing Milieux]: MANAGEMENT OF COM-
PUTING AND INFORMATION SYSTEMSSecurity and Pro-
tectionAuthentication, Physical security, Insurance, Unau-
thorized access
General Terms
Security, Human factors, Performance
Keywords
User re-authentication, mouse dynamics, anomaly detection
1.
INTRODUCTION
An integral part of any security policy is user authen-
tication, which seeks to confirm the identity of a user for
the purpose of granting individual users access to their re-
spective accounts. Authentication can be achieved by some-
thing the user knows (e.g., access passwords, PIN codes),
something the user owns (e.g., access tokens, ID badges, PC
cards, smart cards [17], wireless identification agents [20])
Permission to make digital or hard copies of all or part of this work for
personal or classroom use is granted without fee provided that copies are
not made or distributed for profit or commercial advantage and that copies
bear this notice and the full citation on the first page. To copy otherwise, to
republish, to post on servers or to redistribute to lists, requires prior specific
permission and/or a fee.
VizSEC/DMSEC'04, October 29, 2004, Washington, DC, USA.
Copyright 2004 ACM 1-58113-974-8/04/0010 ...
$
5.00.
or something the user is (e.g., a fingerprint [35], a palm
print [32], a voice sample [12], an iris pattern [5], which are
referred to as biometrics [3]).
Typically, authentication is performed once at the start of
each session. The purpose of a re-authentication system is
to continually monitor the user’s behavior during the session
to flag “anomalous” behavior. User re-authentication seeks
to guarantee that the current user is the authorized user.
In the absence of a user re-authentication process, a com-
puter system may be susceptible to insider attacks. Specif-
ically, an unauthorized user could access an account either
through initial authentication (e.g., by stealing a password)
or by simply exploiting an open account of an authorized
user who forgot to logout prior to leaving a computer sta-
tion. Although hackers, viruses and other external hazards
receive considerable media attention, there is a significant
threat presented by insiders, who may be employees, tem-
porary workers and/or consultants. According to the 2003
CSI/FBI Computer Security Survey, the theft of proprietary
information by insiders is once again the most costly form
of computer crime [43]. Indeed, a trusted user gone bad can
potentially compromise the security of an entire network.
In this paper we investigate whether the user’s mouse
movements provide an accurate model for the identification
of a user. We collected mouse data from eighteen users all
working with Internet Explorer. We applied a supervised
learning algorithm to determine whether we could discrim-
inate users based on their mouse movements. Our results
show that for users that utilize the mouse we obtain a false
positive rate of 0.43% and a false negative rate of 1.75%.
These initial results indicate that data from the user’s mouse
movements provide a strong signal of normalcy.
The remainder of the paper is structured as follows: Sec-
tion 2 discusses the related work. Section 3 introduces user
re-authentication via mouse movements and describes a su-
pervised learning method for modeling user behavior. Sec-
tion 4 presents an empirical evaluation of our approach. Sec-
tion 5 discusses different ways for subverting intrusion de-
tection via mouse movements and Section 6 summarizes and
discusses future research directions.
2.
RELATED WORK
Traditional authentication techniques can be employed for
re-authentication by periodically asking the user to authen-
ticate via passwords, tokens and/or biometrics. However,
repeated authentication is disruptive to the user, expensive,
and often unreliable. Furthermore, it places the burden of
the system’s security on the end user and as such it is vul-
1
nerable to identity theft and authentication replay attacks
[38].
Behavioral re-authentication systems were first introduced
by Denning in 1985 [7]. Within host-based intrusion de-
tection systems (IDSs), a distinction can be made between
approaches that model human behavior directly versus in-
directly. Examples of research that utilize human gener-
ated patterns directly include systems that model normal
behavior of a user’s command line input [4, 21, 26, 34, 36],
keystroke dynamics [28, 37] and mouse movements [14]. Ex-
amples of methods that could be applied to monitor a user’s
behavior indirectly include those that monitor system call
traces [6, 10, 15, 22, 41], audit logs [18, 23, 24, 42, 44], pro-
gram execution traces [13, 19, 25, 27, 31, 39] and call-stack
data analysis [9].
In this paper we present a user re-authentication system
that builds a model of a user’s behavior directly from their
mouse movements. To our knowledge our work is the first
to present an accurate re-authentication system based on
mouse movements. Shavlik, et al, describe a set of potential
features (including mouse data) for profiling users via input
devices, but presented results only for keystroke dynamics
[37]. Note that the feature set proposed in [37] includes
counts of the number of hyperlinks clicked on by the user and
the number of scrolling events in a time period [14], whereas
our feature set models the mouse movement in addition to
mouse events (e.g., clicks). Our work is similar to [27, 8] in
that we apply supervised learning to detect anomalies, but
differs in the learning method employed and in the chosen
task of user re-authentication. Finally, similar to other user-
reauthentication methods (e.g., [21]), we apply a mean filter
over a window of observations to lower the false positive
rate.
3.
USER RE-AUTHENTICATION VIA
MOUSE MOVEMENTS
In order to determine whether the current user’s behavior
is anomalous we must first build a model of normal behav-
ior. Building the model requires an initial training phase,
during which the user’s mouse data is collected, model pa-
rameters are selected and a final model is produced. This
model is then used to continually monitor the trusted user’s
account. If the current behavior of a user deviates signifi-
cantly from the model of normal behavior, the system flags
this behavior as anomalous and does one of two things: asks
the user to authenticate again or reports the anomaly to a
system administrator. Due to unavoidable gradual changes
in the user’s behavior over time, the profile should, ideally,
be updated with new training instances periodically. In this
section we describe each step of this process. We specifically
focus on the data collection and feature extraction process,
model construction, and finally how to use the constructed
model to detect anomalies in current behavior.
3.1
Data Collection and Feature Extraction
Modeling mouse-movement behavior of a user x on a ma-
chine y requires capturing both the cursor movement and
the mouse events (i.e., single and double clicks of either a
left, right or a middle mouse button, and the mouse wheel
movements). In order to profile a user’s behavior on a mouse
device,
1
we record two-dimensional screen coordinates of a
1
Note that the model must be built for the user for each
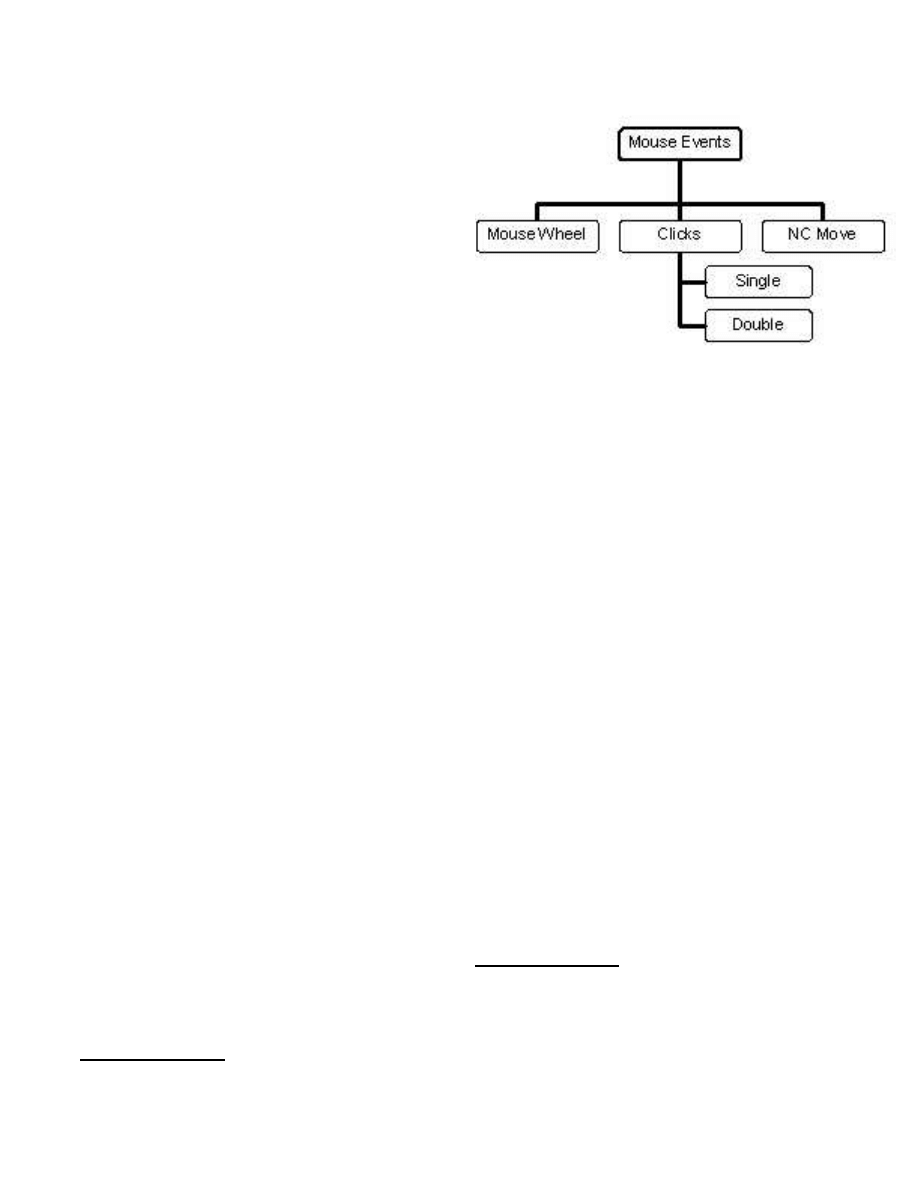
Figure 1: Data Set Hierarchy.
cursor each time that we detect that the mouse has moved.
We examine whether the mouse has moved every 100msec.
We set the time interval to be 100msec because we specu-
late that the time it takes human beings “to do things” is
measured in seconds or even minutes. Although 100msec
interval is a long time from a computer processor’s perspec-
tive, it is a relatively short time for a human, who may or
may not move a mouse even by a pixel in this period.
To extract features from the mouse movement data set, we
first compute the distance, angle, and speed between pairs of
data points. These pairs can either be consecutive or they
can be separated by k data points. We call the parameter
k
the frequency. This parameter is customized for each user
and we discuss how it is selected in Section 4.3. After we
obtain our raw features, we extract their mean, standard
deviation and the third moment values over a window of N
data points.
In addition to the cursor movement data, we collect all
mouse generated events to obtain the mouse event data. We
record the time of each event. To extract features from the
event sequence data, we first group each user’s event se-
quence data into a hierarchical structure that contains all
data points at the top level. At the next level we split the
event data into mouse wheel movements, clicks and non-
client (NC) area mouse movements (the NC area is defined
to be the area of the application window where the menu
and toolbars are located).
2
Finally we group the click data
into single and double click data (see Figure 1). Our as-
sumption is that there is a strong detection signal for each
category of this hierarchical structure that can be used to
distinguish users. In otherwords, we want to extract statis-
tics of different categories of events.
Similar to the cursor movement data we compute the dis-
unique mouse device because a single user’s behavior varies
depending on the type of device (e.g., touch pad, joy stick,
trackball).
2
Note that we do not collect the client area mouse move-
ments because their rate of occurrence is high (approxi-
mately several hundred events per second); consequently,
these points would overwhelm the data set and furthermore,
the volume of the data set would become intractable.
2

tance, angle and speed between pairs of data points A and
B, where B occurs after A – i.e., points A and B must be se-
quential, but need not be consecutive. Some mouse events,
for example mouse wheel movements, occur relatively fre-
quently (approximately 25 events per second). In this case,
we may be interested in observing the user’s behavior be-
tween every ten mouse wheel data points, whereas for rare
events, such as double clicks, we may be interested in con-
secutive data points. Again, we refer to the chosen interval
between two sequential data points as the frequency. Note
that the ideal frequency will be category and user specific.
Identical to our procedure for the cursor movement data, we
compute the mean, standard deviation and the third mo-
ment values of the distance, angle and speed values over the
window of N data points.
Thus, in our model for each user, we have a set of ad-
justable parameters: the frequency for each category and
the window size. Note that the windows are non-overlapping
and that a window corresponds to a single extracted data
point in our profiling data. In other words, each observation
in a user’s behavioral profile is a summary over a window
of N mouse movements. Recall that there can be any num-
ber of event sequence data observations in a window of N
data points. In summary, the extracted features for each
observation in a user’s profile are:
1. For each event category in the mouse event hierarchy,
we count the number of observed events in the window.
This creates six features.
2. For each event category and for the cursor movement
data, we compute the mean, standard deviation and
third moment of the distance, angle and speed between
pairs of points. This creates 63 features.
3. For each event category and for the cursor movement
data, we compute the mean, standard deviation and
third moment for the X and for the Y coordinates.
This gives a rough measure of the location of the events
for that window and the location of the cursor in that
window. This creates 42 features.
3.2
Building a Model of Normal Behavior
The problem of user re-authentication via mouse move-
ments can be regarded as either a supervised or an unsu-
pervised learning problem. The choice depends on whether
public access to hosts is restricted or not. In a closed setting,
one can collect mouse data from all employees, and then,
apply a supervised learning algorithm to obtain a classifier
able to discriminate each employee from the others. The
drawback of this approach is all users’ mouse data must be
collected in order to perform the classification and even then
we may face the “non-uniform” class problem as the number
of classes (i.e., employees) grows large [16].
If collecting data from all individuals who have physical
access is not feasible, then re-authentication is best viewed
as an unsupervised learning problem. In this case, the mouse
data is collected for each individual user whose behavior we
are trying to model. During the user re-authentication pro-
cess, a “normal” user’s profile, generated from the mouse
data during the training phase, is compared against a cur-
rent user’s behavior. If there is a significant difference be-
tween the two, the current behavior is termed an “anoma-
lous” profile. Unlike the supervised learning approach, we
are not given the intruder’s profile a priori in order to detect
his/her presence. The difficulty with unsupervised anomaly
detection is that the false positive rate of such approaches
is often unacceptably high [1]. For user re-authentication
via mouse movements, the choice of supervised or unsuper-
vised learning depends on the physical access control. In
this paper we chose to evaluate how well a supervised learn-
ing approach works in this domain because before we can
apply an unsupervised learning approach we wanted to de-
termine whether users could be discriminated based on their
mouse movements. In Section 4 we describe our choice of
learning algorithm and how we apply it to learn a model for
a particular user. Future work will evaluate this hypothesis
for unsupervised learning scenarios.
Recall that our feature extraction process requires that
we specify the window size N and the frequency for each of
the categories of event data. In our approach we customize
these values for each user, by searching through parameter
space using a parameter selection data set that is separate
from the training data. In our experiments, we select the
values for the parameters that minimize the false positive
and false negative rate for the user for this data. Note that
rather than minimizing error rate, we could alternatively
optimize a cost-function of these two sources of error [22].
Finally, in our current approach, for each user we learn
a separate model of normal behavior for each application.
We conjecture that even the same user will have different
mouse behavior for different applications. For example, a
user may actively use the mouse in Internet Explorer but
may not when using Microsoft Word, because they have ex-
tensive knowledge of editing control commands, which are
often faster than their point and click versions. In future
work we will test this conjecture.
3.3
Anomaly Detection
After we have built a model of normal behavior we can
apply this model to detect whether the current behavior is
normal or anomalous. To this end, we can apply the clas-
sifier constructed by the chosen supervised or unsupervised
learning algorithm to each data point in the current pro-
file. Recall that individual data points are constructed from
a window of N data points. A simple detection scheme
would trigger an alarm each time a data point in the profile
is classified as anomalous. However this detection scheme
may yield an unacceptably high false positive rate (i.e., the
trusted user is falsely identified as an intruder).
A more conservative approach requires t alarms to occur
in m observations of the current user’s behavioral profile.
Consequently, we can apply a smoothing filter. If the clas-
sifier outputs a binary decision, then such a filter requires
specifying a window size of m data points and a threshold,
t
∈ [0, m] for each m. If > t anomalous data points are
observed in a window of m data points then an alarm is
raised. If the classifier outputs a confidence value in the
range [0,1.0], then we essentially have a mean filter, which
also requires a threshold t ∈ [0, 1.0]. Both the size of the
window m and the threshold t can be determined experi-
mentally for each user with a parameter setting dataset.
4.
AN EMPIRICAL EVALUATION
We begin this section with a brief description of the data
sources.
We then describe our application of supervised
learning to form a discriminatory model for each user and
3
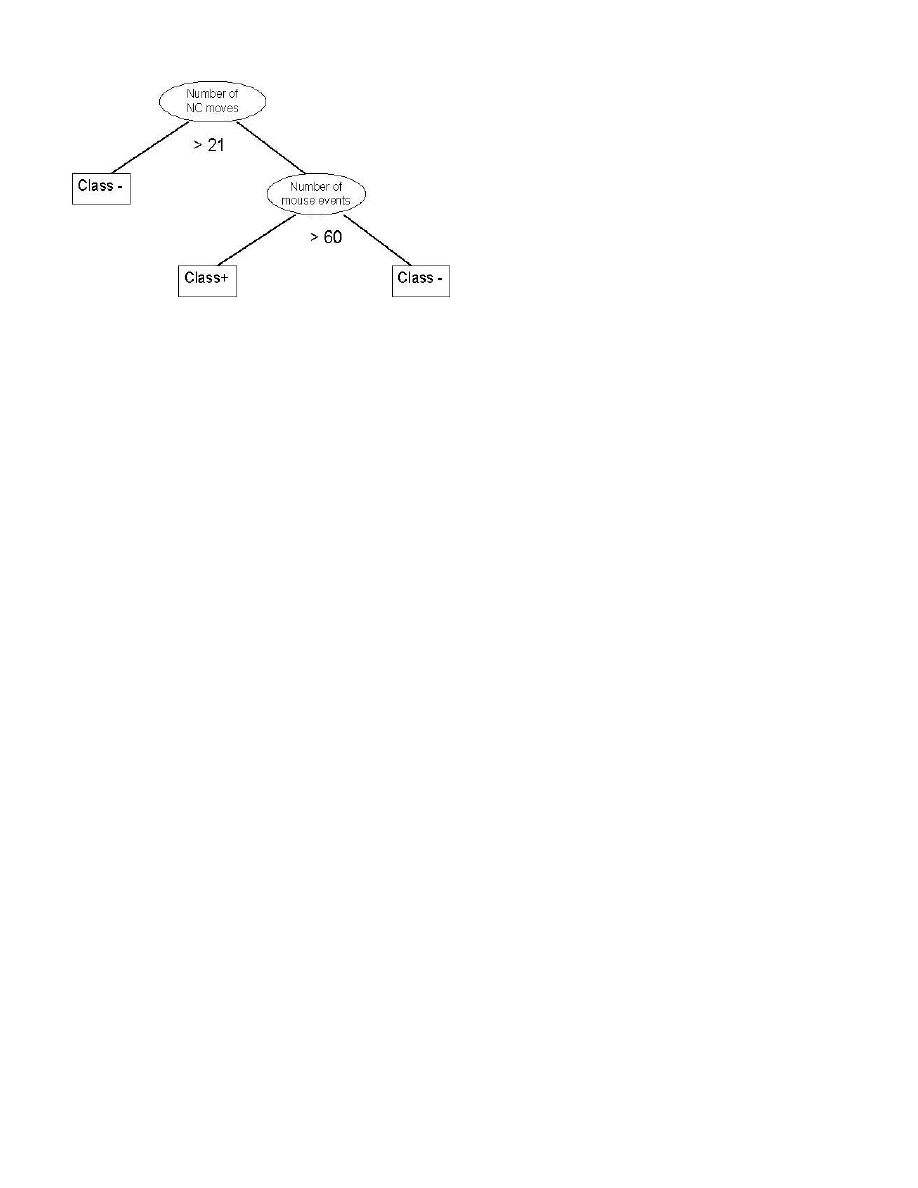
Figure 2: Decision Tree for User #13.
report our experimental results. Our experiments are de-
signed to determine whether mouse data provides sufficient
information with which to discriminate users.
4.1
Data Sources
We collected data from eighteen student volunteers who
agreed to run a data collection for the length of time it took
to collect 10,000 unique cursor locations. On average, users
took two hours to complete data collection (data collection
was a part of weekly assignment instructing students to view
the same set of web pages and hence it was designed not to
span over a longer time period). The volunteers had two
constraints placed upon them before commencing with the
data collection. They were instructed to use a Windows
machine and to run Internet Explorer. In fact, after ex-
tracting Internet Explorer data points from each user’s data
file, an average of 7,635 unique cursor locations remained
per file. We chose to look at the data from a single appli-
cation because it increases the difficulty of our task if we
believe that users have different mouse behavior for differ-
ent applications. Thus, the goal of our experiments is to
determine whether a user x when running an application M
(e.g., Internet Explorer) can be distinguished from the other
n-1
users running the same application.
4.2
Decision Tree Classifier
We chose to use decision trees because they provide a com-
prehensible representation of their classification decisions.
Although techniques such as boosting [11, 33] or support
vector machines [2] might obtain slightly higher classifica-
tion accuracy, they require more computation during classi-
fication and further they obscure the decision making pro-
cess.
A decision tree is a tree structure where each internal
node denotes a test on a feature, each branch indicates an
outcome of the test, and the leaf nodes represent class labels.
An example decision tree is shown in Figure 2. This tree
was generated by C5.0 for user #13. (Note that in the tree,
“+” represents the class “user” and “-” represents the class
“not user”. To classify an observation, the root node tests
the value of feature denoting a number of NC moves over a
window of 400 data points. If the outcome is less than 21,
the observation is given a label of class (-). If not, we descend
the right subtree and test the value for feature representing
the number of all mouse events in the window. If the value
is less than sixty, the observation is given a label of class
(+). If the value is greater than sixty, the observation is
classified as class (-).
We chose to use the C5.0 (without boosting) decision tree
algorithm [29] – a widely used and tested implementation.
For details regarding the specifics of C5.0 the reader is re-
ferred to [29, 30]. Here we provide only the key aspects of
the algorithm related to decision tree estimation, particu-
larly as it pertains to feature selection. The most impor-
tant element of the decision tree estimation algorithm is the
method used to estimate splits at each internal node of the
tree. To do this, C5.0 uses a metric called the informa-
tion gain ratio
that measures the reduction in entropy in
the data produced by a split. In this framework, the test
at each node within a tree is selected based on splits of the
training data that maximize the reduction in entropy of the
descendant nodes. Using this criteria, the training data is
recursively split such that the gain ratio is maximized at
each node of the tree. This procedure continues until each
leaf node contains only examples of a single class or no gain
in information is given by further testing. The result is often
a very large, complex tree that overfits the training data. If
the training data contains errors, then overfitting the tree
to the data in this manner can lead to poor performance
on unseen data. Therefore, the tree must be pruned back to
reduce classification errors when data outside of the training
set are to be classified. To address this problem C5.0 uses
confidence-based pruning, and details can be found in [29].
When using the decision tree to classify unseen examples,
C5.0 supplies both a class label and a confidence value for its
prediction. The confidence value is a decimal number rang-
ing from zero to one – one meaning the highest confidence
– and it is given for each instance.
4.3
Experimental Design and Results
For each user, we used the first two quarters of data for
training, the third quarter for parameter selection, and the
last quarter for testing. Recall that the parameter selection
data set is used to select the frequency value for each cate-
gory and the window size for feature extraction. We chose
to search for the frequency values from the following candi-
date set: {1, 5, 10, 15, 20}. Our choice of values was based
on observations about the data. For example, mouse wheel
points are frequent (approximately 25 per second), whereas
single-click points are scarce (approximately one every five
to ten seconds). Larger frequency values generate a more
accurate profile when coupled with mouse wheel events and
smaller values are better for single click events. In our ex-
periments we set the frequency value to be equal to one for
single and double clicks, and used the parameter data set
to select the frequency value for both the mouse movement
data and the remaining four event categories that minimizes
the false positive and false negative rates for the user.
Candidate values for the window size used during feature
selection were {100, 200, 400, 600, 800, 1000} data points. A
larger window size requires a longer time to either authen-
ticate the user or identify an intruder. A maximum window
size of thousand data points ensures a maximum detection
time of approximately 1.6 minutes (without a smoothing
window) if the user moved the cursor and/or invoked mouse
events in this time period. If we assume a detection smooth-
ing window of size m (see Section 3.3), then a window size
greater than thousand data points would be impractical, be-
cause an intruder can significantly jeopardize the data stored
4

UserID
1
2
3
4
5
6
7
8
9
10
11
12
13
14
15
16
17
18
1
0.0
18.4
41.3
0.0
38.2
1.4
0.0
1.3
0.0
49.4
53
0.0
0.0
43.2
0.0
1.2
48
2
0.0
1.2
0.0
0.0
0.0
0.0
0.0
0.0
28.8
13.6
0.0
0.0
14.5
0.0
0.0
0.0
3
11.7
0.0
18.6
0.0
0.0
17.8
5.1
11.7
22.9
0.0
0.0
21.6
0.0
14.6
36.7
4
0.0
0.0
0.0
0.0
0.0
0.0
0.0
23.8
0.0
0.0
0.0
0.0
0.0
13.4
5
0.0
0.0
0.0
0.0
0.0
0.0
0.0
0.0
0.0
0.0
0.0
0.0
0.0
6
1.4
0.0
0.0
0.0
0.0
26.6
0.0
0.0
44.4
0.0
1.2
49.3
7
0.0
30.7
0.0
41.1
1.3
0.0
0.0
0.0
0.0
0.0
0.0
8
0.0
0.0
0.0
0.0
0.0
0.0
0.0
0.0
0.0
0.0
9
50.7
0.0
21.2
0.0
0.0
8.9
0.0
9.3
17.1
10
0.0
33.7
0.0
0.0
0.0
0.0
0.0
0.0
11
37.5
0.0
0.0
10.4
0.0
0.0
6.6
12
0.0
0.0
19.8
0.0
17
17.4
13
0.0
0.0
0.0
0.0
0.0
14
0.0
0.0
0.0
0.0
15
0.0
0.0
33.3
16
0.0
0.0
17
9.3
Table 1: Error rate for each pair of users.
on a computer system in a period of time greater than m∗1.6
minutes.
To find the best set of parameter values, we search over all
combinations. For each set of candidate parameter values we
extract the features from the raw data to create a parameter-
specific dataset. We then run the supervised learning algo-
rithm to construct a classifier that we then evaluate on the
parameter evaluation data. We do this for every combina-
tion of parameter settings, resulting in 162 candidate sets.
To evaluate whether a smoothing window can lower the
false alarm rate, we applied a smoothing filter. To this end,
after we selected the set of parameters for constructing the
features, we then search over possible values for m and t.
Our candidate values for m were {1, 3, 5, 7, 9, 11}. A larger
value of m implies both, higher accuracy and a longer detec-
tion time. Consequently, we decided not to exceed m = 11.
We chose the value that optimizes performance on our pa-
rameter selection data set.
4.3.1
Pair-Wise Discrimination:
Our first experiment was designed to evaluate the differ-
ence in behavior between each pair of users. The results of
this experiment are shown in Table 1. Table 1 reveals that
there is a substantial variation among different pair-wise re-
sults per user. For example, the error generated between
user #6 and user #18 is 49.3%, but the error generated be-
tween user #6 and user #8 is 0%. This is due to the fact that
both user #6 and user #18 have very few mouse movements
and it is therefore difficult to distinguish them from one an-
other. On the other hand, user #8 has many mouse move-
ments that differentiate him/her from other users. Clearly
some users will be more similar to one another. What is
striking however is that many pairs of users can be com-
pletely discriminated from one another.
4.3.2
Anomaly Detection:
Our second experiment was designed to determine whether
user x could be distinguished from the other n-1 users. For
each user x, we create a supervised dataset in which user
x
’s data points are labeled as normal and the remaining n-
1
user data sets are labeled as intruders. We then built a
discriminatory model for user x from this data. In Figure 3
we show the false positive and false negative rates for each
user on the testing data without a smoothing window. In
other words, for a particular user x, the false positive rate
is the percentage of user x’s data points in the testing data
that are labeled as intruder and the false negative rate is
the percentage of the intruder data points labeled as x (the
valid user).
The average false negative rate across all 18 users is 3.06%,
which one can argue is acceptably low. However, the false
positive rate for many users is unacceptably high (the av-
erage is 27.5%). A closer examination of the users’ whose
false positive rate was higher than 10%, revealed that these
users rarely generated mouse events.
Indeed, these users
rarely generated mouse clicks of any kind (i.e., single, dou-
ble, left, right or middle). Only 1.2% of these users’ data
files was mouse clicks data. Our hypothesis is that these
users spent time reading what they were viewing on Internet
Explorer (the 18 volunteers were students in an undergrad-
uate security class assigned to read about various recent at-
tacks, hence all 18 were viewing the same web pages). The
net effect is that all of these users look remarkably simi-
lar to one another. This points out that clearly a user re-
authentication system based on mouse movements can only
be applied to users who both utilize the mouse and move the
cursor. Note that if an intruder tries to escape detection by
not using the mouse and the valid user is one who uses the
mouse, our approach will flag an anomaly. The difficulty
arises when the valid user does NOT use the mouse and nei-
ther does the intruder. Because of these observations we do
not report results for users #1, #2, #3, #6, #9, #17 and
#18 for the remainder of our experiments. Note that their
data is still used to help form the intruder portion of the
training data.
4.3.3
Smoothing Filter:
Our third experiment evaluates the effect of the smoothing
window on detection accuracy (shown in Figure 4). These
results are obtained for the remaining eleven users. The
effect of the smoothing window is rather remarkable. The
average false positive rate is 0.43% and the average false
5
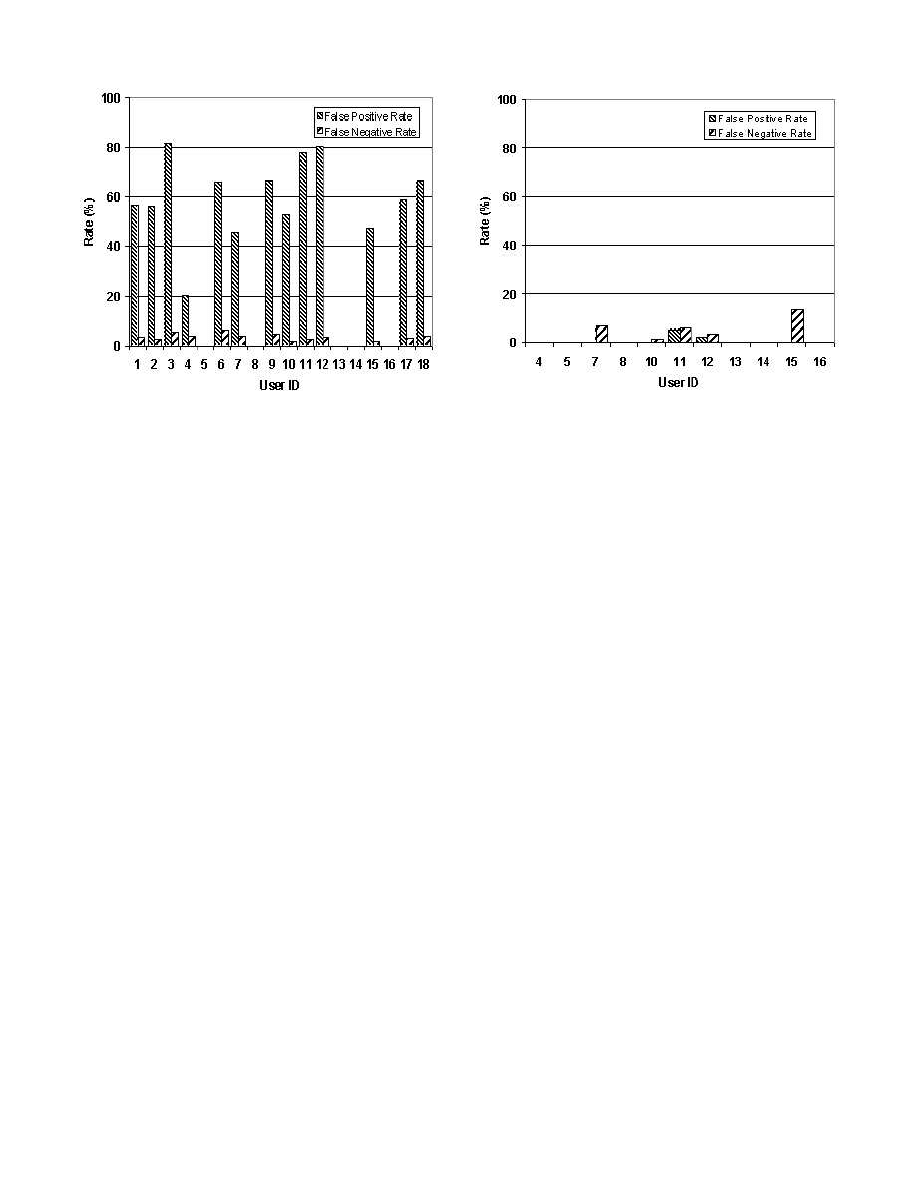
Figure 3: Anomaly detection results for all 18 users.
negative rate is 1.75%. Six of the eleven users have 0% false
positive and 0% false negative rate. Only user #15 displays
a significant increase in the false negative rate, which rose
from 4.37% in the previous experiment to 13.98% in this
experiment (this user’s false positive rate did not change).
Upon a closer examination of the C5.0 decision tree gen-
erated for this user, we discovered that all of the features
in the tree were derived from the cursor movements. No
feature tested was derived from mouse events even though
the user’s data set contained a significant number of mouse
event data points. Consequently, instead of decreasing the
number of false negative instances the smoothing filter in-
creased it when attempting to distinguish user #15 from
those seven users whose data sets contain few mouse events.
The addition of the smoothing filter has improved our re-
sults while causing negligible impact on the performance and
efficiency of the approach. Considering the cumulative re-
sults of our third experiment one could clearly argue that
user re-authentication system via mouse movements has a
potential to be deployed in a real-world setting.
Table 2 shows the empirically-obtained values for the pa-
rameter settings for each of the users. Specifically we show
the feature extraction window size in row 1, and the best
choice for the smoothing window parameters, m and t, in
rows 2 and 3. Note that t is shown as a percentage of the
window size, m.
5.
SUBVERTING CLASSIFICATION
Replay attacks have been shown to be a vulnerability for
biometric authentication devices [38] and for some anomaly-
based IDS [40]. In future work we will investigate whether
replay attacks can be used to avoid detection of user re-
authentication systems. We conjecture that it is virtually
impossible to construct a useful replay attack with mouse
data, but that the opposite is true of keyboard dynamics
and user-command sequences.
Clearly to avoid mouse detection an attacker can avoid
using the mouse, but this in itself can be regarded as an
Figure 4: Smoothing filter results for 11 users.
anomaly if the user’s normal behavior involves frequent mouse
movements. Expert users accustomed to a frequent use of
keyboard keys as a navigational tool through their computer
system can evade detection at this time. Our future goal is
to expand our data set by including the API events gen-
erated as a result of a keyboard-aided navigation. We will
also investigate whether a clever attacker who models the
statistics of mouse movements of a trusted user could use
these to construct a session where he/she could successfully
masquerade as the authorized user.
6.
CONCLUSIONS
In this paper we presented a method to detect anomalous
behavior using the current user’s mouse movements. For
users who utilized the mouse we obtain an average false pos-
itive rate of 0.43% and false negative rate of 1.75%. Clearly
for users who do not use the mouse, this method will fail to
detect an intruder. However, the promising results of this
initial exploration point toward the need for more work in
this area.
Our future work will address the conjecture that we need
to learn a model for each combination of user and applica-
tion. Related to this, model scalability to a large number
of users and applications may become an issue. In addi-
tion, we are currently in the process of collecting a much
larger scale dataset. Our next research direction will be to
determine how best to apply unsupervised learning to this
problem and how to incorporate the results from different
sources of user behavioral data such as keystroke dynamics
and user commands.
7.
REFERENCES
[1] S. Axelsson. On a difficulty of intrusion detection. In
Proceedings of the Recent Advances in Intrusion
Detection Conference
, 1999.
[2] K. Bennett and C. Campbell. Support vector
machines: Hype or hallelujah? SIGKDD Explorations,
2:1–13, 2000.
6

Parameter
4
5
7
8
10
11
12
13
14
15
16
Avg
Window
1000
600
1000
1000
800
800
1000
1000
600
1000
1000
891
m
1
1
1
1
11
1
3
1
1
9
1
2.8
t
.05
.05
.05
.05
.55
.05
.15
.05
.05
.45
.05
.14
Table 2: Parametric values for each user.
[3] U. B. Consortium. “Face recognition”.
www.vitro.bloomington.in.us:8080/ BC, 2004.
[4] S. Coull, J. Branch, B. Szymanski, and E. Breimer.
“Intrusion detection: A bioinformatics approach”. In
Proceedings of the Nineteenth Annual Computer
Security Applications Conference
, pages 24–34, Las
Vegas, NE, 2003.
[5] J. G. Daugman. “High confidence visual recognition of
persons by a test of statistical independence”. In
Proceedings of the IEEE Transactions on Pattern
Analysis and Machine Intelligence
, volume 15, pages
1148–1161, November 1993.
[6] D. E. Denning. “An intrusion-detection model”. IEEE
Transactions on Software Engineering
, 13(2):222–232,
1987.
[7] D. E. Denning and P. G. Neumann. “Requirements
and model for IDES - A real-time intrusion detection
system”. Technical report, Computer Science
Laboratory, SRI International, Menlo Park, CA, 1985.
[8] D. Endler. “Intrusion detection applying machine
learning to Solaris audit data”. In Proceedings of the
Computer Security Applications Conference
, pages
268–279, 1998.
[9] H. H. Feng, O. M. Kolesnikov, P. Fogla, W. Lee, and
W. Gong. “Anomaly detection using call stack
information”. In Proceedings of IEEE Symposium on
Security and Privacy
, pages 62–78, 2003.
[10] S. Forrest, S. A. Hofmeyr, and A. Somayaji.
“Computer immunology”. Communications of the
ACM
, 40(10):88–96, 1997.
[11] Y. Freund. Boosting a Weak Learning Algorithm by
Majority. Information and Computation,
121(2):256–285, 1995.
[12] T. Gear. “Voice recognition solutions”.
www.transcriptiongear.com, 2004.
[13] A. K. Ghosh, A. Schwartzbard, and M. Schatz.
“Learning program behavior profiles for intrusion
detection”. In Proceedings of the First USENIX
Workshop on Intrusion Detection and Network
Monitoring
, pages 51–62, April 1999.
[14] J. Goecks and J. Shavlik. “Automatically labeling web
pages based on normal user actions”. In Procedings of
the IJCAI Workshop on Machine Learning for
Information Filtering
, July 1999.
[15] S. A. Hofmeyr, S. Forrest, and A. Somayaji.
“Intrusion detection using sequences of system calls”.
Journal of Computer Security
, 6(3):151–180, 1998.
[16] C. Hsu and C. Lin. “A comparison of methods for
multi-class support vector machines”. IEEE
Transactions on Neural Networks
, 13:415–425, 2002.
[17] S. HTT. “Access control”. www.htt.com, 2004.
[18] K. Ilgun, R. A. Kemmerer, and P. A. Porras. “State
transition analysis: A rule-based intrusion detection
approach”. Software Engineering, 21(3):181–199, 1995.
[19] C. Ko, G. Fink, and K. Levitt. “Automated detection
of vulnerabilities in priviledged programs by execution
monitoring”. In Proceedings of the Tenth Annual
Computer Security Applications Conference
, pages
134–144, December 1994.
[20] C. E. Landwehr. “Protecting unattended computers
without software”. In Proceedings of the 13th Annual
Computer Security Applications Conference
, pages
273–283, December 1997.
[21] T. Lane and C. E. Brodley. “Temporal sequence
learning and data reduction for anomaly detection”.
ACM Transactions on Information and System
Security
, 2(3):295–331, 1999.
[22] W. Lee, S. J. Stolfo, and K. W. Mok. “A data mining
framework for building intrusion detection models”. In
Proceedings of the IEEE Symposium on Security and
Privacy
, pages 120–132, 1999.
[23] Y. Li, N. Wu, S. Jajodia, and X. S. Wang. “Enhancing
profiles for anomaly detection using time
granularities”. Journal of Computer Security,
10(2):137–157, 2002.
[24] T. F. Lunt, A. Tamaru, F. Gilham, R. Jagannathan,
P. G. Neumann, H. S. Javitz, A. Valdes, and T. D.
Garvey. “A real-time intrusion detection expert
system IDES - Final report”. Technical Report
SRI-CSL-92-05, SRI Computer Science Laboratory,
SRI International, February 1992.
[25] C. Marceau. “Characterizing the behavior of a
program using multiple-length N-grams”. In
Proceedings of the 2000 Workshop on New Security
Paradigms
, pages 101–110. ACM Press, 2000.
[26] J. A. Marin, D. Ragsdale, and J. Surdu. “A hybrid
approach to profile creation and intrusion detection”.
In Proceedings of DARPA Information Survivability
Conference and Exposition
, pages 12–14, June 2001.
[27] C. Michael and A. Ghosh. “Using finite automata to
mine execution data for intrusion detection: A
preliminary report”. Lecture Notes in Computer
Science
, 1907:66–80, 2000.
[28] F. Monrose and A. Rubin. “Authentication via
keystroke dynamics”. In Proceedings of the Fourth
ACM Conference on Computer and Communications
Security
, pages 48–56, April 1997.
[29] J. R. Quinlan. C4.5: Programs for machine learning.
Morgan Kaufmann, San Mateo, CA, 1993.
[30] R. Quinlan. Data mining tools See5 and C5.0.
www.rulequest.com/see5-info.html, 2003.
7

[31] M. Rajagopalan, S. Debray, M. Hiltunen, and
R. Schlichting. “Profile-directed optimization of
event-based programs”. In Proceedings of the ACM
SIGPLAN on Programming Language Design and
Implementation
, June 2002.
[32] I. Recognition. “Hand geometry technology”.
www.recogsys.com, 2004.
[33] R. E. Schapire. A brief introduction to boosting. In
IJCAI
, pages 1401–1406, 1999.
[34] M. Schonlau, W. DuMouchel, W. Ju, A. F. Karr,
M. Theus, and Y. Vardi. “Computer intrusion:
Detecting masquerades”
. 16(1):58-74. February 2001.
[35] I. Security. “Index security: Biometric fingerprint ID”.
www.index-security.com, 2004.
[36] K. Sequeira and M. Zaki. “ADMIT: Anomaly-based
data mining for intrusions”. In Proceedings of the
Eighth ACM SIGKDD International Conference on
Knowledge Discovery and Data Mining
, pages
386–395. ACM Press, 2002.
[37] J. Shavlik, M. Shavlik, and M. Fahland. “Evaluating
software sensors for actively profiling Windows 2000
users”. In Proceedings of the Fourth International
Symposium on Recent Advances in Intrusion
Detection
, October 2001.
[38] L. Thalheim, J. Krissler, and P. M. Ziegler. “Body
check: Biometrics defeated”.
www.heise.de/ct/english/02/11/114/, June 2002.
[39] D. Wagner and D. Dean. “Intrusion detection via
static analysis”. In Proceedings of IEEE Symposium
on Security and Privacy
, pages 156–169, 2001.
[40] D. Wagner and P. Soto. “Mimicry attacks on host
based intrusion detection systems”. In Proceedings
Ninth ACM Conference on Computer and
Communications Security
, pages 255–264. ACM Press,
2002.
[41] C. Warrender, S. Forrest, and B. A. Pearlmutter.
“Detecting intrusions using system calls: Alternative
data models”. In Proceedings of the IEEE Symposium
on Security and Privacy
, pages 133–145, 1999.
[42] A. Wespi, M. Dacier, and H. Debar. “Intrusion
detection using variable-length audit trail patterns”.
In Proceedings of the 3rd International Workshop on
the Recent Advances in Intrusion Detection
, volume
1907, 2000.
[43] R. Wright. “2003 CSI/FBI computer security survey”.
http://www.security.fsu.edu/docs/FBI2003.pdf, 2003.
[44] N. Ye. “A Markov chain model of temporal behavior
for anomaly detection”. In Proceedings of the 2000
IEEE Systems, Man, and Cybernetics Information
Assurance and Security Workshop, 2000
, pages
171–174, 2000.
8
Wyszukiwarka
Podobne podstrony:
10 Metody otrzymywania zwierzat transgenicznychid 10950 ppt
10 dźwigniaid 10541 ppt
wyklad 10 MNE
Kosci, kregoslup 28[1][1][1] 10 06 dla studentow
10 budowa i rozwój OUN
10 Hist BNid 10866 ppt
POKREWIEŃSTWO I INBRED 22 4 10
Prezentacja JMichalska PSP w obliczu zagrozen cywilizacyjn 10 2007
Mat 10 Ceramika
BLS 10
10 0 Reprezentacja Binarna
więcej podobnych podstron