
Estimation of Dietary Pb and Cd Intake from Pb and Cd
in Blood or Urine
Masayuki Ikeda
&
Shinichiro Shimbo
&
Takao Watanabe
&
Fumiko Ohashi
&
Yoshinari Fukui
&
Sonoko Sakuragi
&
Jiro Moriguchi
Received: 6 January 2010 / Accepted: 24 February 2010 /
Published online: 27 April 2010
# Springer Science+Business Media, LLC 2010
Abstract Successful trials were made to estimate the dietary daily intake of lead (Pb) and
cadmium (Cd) via foods from the levels of the metals in blood or urine. In practice, 14 and
15 reports were available for Pb and Cd in blood (Pb-B and Cd-B), urine (Pb-U and Cd-U)
and 24-h diet duplicates (Pb-D and Cd-D), respectively, from which 68 pairs each of Pb or
Cd in blood and food duplicates [each being geometric mean (GM) values for the survey
sites] were obtained. Regression analysis revealed that there was a significant correlation
between Pb-B and Pb-D, and also between Cd-B and Cd-D, suggesting that it should be
possible to estimate both Pb-D and Cd-D from Pb-B and Cd-B, respectively. For Cd-U, the
number of available cases was limited (20 pairs), but a significant correlation was detected
between Cd-U (as Cd-U
cr
, or Cd levels in urine as corrected for creatinine concentration)
and Cd-D. Care should be taken in estimating Pb-D from Pb-B, as the ratio of Pb-D over
Pb-B may decrease as a function of increasing Pb-B levels. The Pb-D (
μg/day) for typical
Japanese women with Pb-B of 15
μg/l was best estimated to be 13.5 μg/day. No Cd-B- or
Cd-U
cr
-dependent change was detected in case of Cd. The best estimate of Cd-D for Cd-B
at 1.5
μg/l should be about 19.4 μg/day.
Keywords Blood . Cadmium . Daily diet . Lead . Urine
Biol Trace Elem Res (2011) 139:269
–286
DOI 10.1007/s12011-010-8661-x
M. Ikeda (
*)
:
F. Ohashi
:
Y. Fukui
Kyoto Industrial Health Association (Main Office), 67 Nishinokyo-Kitatsuboicho, Nakagyo-ku,
Kyoto 604-8472, Japan
e-mail: ikeda@kojohokenkai.or.jp
S. Shimbo
Kyoto Women
’s University, Kyoto 605-8501, Japan
T. Watanabe
Miyagi University of Education, Sendai 980-0845, Japan
S. Sakuragi
:
J. Moriguchi
Kyoto Industrial Health Association (Mibu Office), Kyoto 604-8871, Japan

Introduction
Dietary intake of ubiquitous heavy metals such as cadmium (Cd) and lead (Pb) are
among the foci of public concern especially as the metal levels in atmosphere has been
gradually decreasing in many countries including Japan, so that body burden via
respiratory route will be less important whereas metal intake via foods remains as the
major source [
–
]. Although it is desirable to have data on dietary metal intake, such
procedures as 24-h food duplicate collection followed by instrumental analyses for metals
to obtain reliable estimate for dietary intake are not only complex but time- and hand-
consuming [
In the present analysis, data were collected from previous publications on Cd and Pb in
blood, urine and diet (Cd-B, Pb-B, Cd-U, Pb-U, Cd-D and Pb-D, respectively) of populations
mostly in Japan and in east or south-east Asia, and correlations among the parameters were
examined for a possibility that Pb-D and Cd-D may be estimated from Pb-B and Cd-B,
respectively, or Cd-D from Cd-U.
Materials and Methods
Data from Literature
Data are all on general populations without occupational exposure to Pb or Cd, and cited
from previous publications, i.e. references [
,
] for Pb in blood, urine or 24-h
food duplicate samples, and references [
,
,
] for Cd in blood, urine or 24-h
food duplicate samples (Tables
and
). Regarding Cd-U, the values as corrected for
creatinine (Cd-U
cr
) [
] rather than non-corrected values (CdU
ob
) were employed simply
because the published data were more abundant for Cd-U
cr
than Cd-U
ob
despite the
criticism that creatinine correction may induce biases especially among aged people [
Watanabe et al. [
] published GM values for Cd-B, Cd-D, Pb-B and Pb-D in 38 sites, i.
e. 19 sites being studied twice, 10 years apart. From the 38 data sets, those with
≧10 pairs
of data on blood and food duplicates were selected so that 32 sets were taken for present
analysis.
Using the market basket method [
], Matsuda [
] reported on dietary Cd and Pb
intake for adult Japanese (assumedly at the ages of 40
–59 years, men and women not
specified). In the report, Cd and Pb intakes were given by food groups, e.g. cereals,
animal meats, fish and shellfish etc. similar to the classification by Ministry of Health,
Labour and Welfare, Japan [
]. The report [
] describes per capita per day food
consumption (in weight) among Japanese populations by age groups (1
–6, 7–14, 15–19
and 20
–29 years, and by decade up to 69, and ≧70 years of age) and for men and women
combined and also separately. It is known that adult men take more cereals (typically rice,
the leading source of dietary Cd in Japan [
]. Thus, Cd intake
for adult women for example was estimated for each food group assuming that the Cd
intake for women was proportional to the amount (in weight) of food consumed [i.e. Cd
in the food group × (food amount for women/food amount for men and women
combined)], which was followed by summation for all food groups to estimate daily
intake via foods. The same assumption of Cd (or Pb) intake proportional to the amount of
foods in the food groups was taken in cases of estimation for dietary Cd or Pb intake of
children except that boys and girls were treated as combined.
270
Ikeda et al.
T
able
1
The
databa
se
for
Pb
inter
nal
dose
and
dietary
intake
Reference
Country/Area
Location
Gender
,
etc.
Y
ear
of
study
Pb-B
Pb-U
cr
Pb-D
Pb-B
over
Pb-D
Pb-Ucr
over
Pb-D
GM
(μ
g/l)
GSD
N
GM
(μ
g/l)
GSD
N
GM
(μ
g/l)
GSD
N
Ref.
[
]
Korea
Busan
Children
b
2000
38.0
1.57
38
6.92
1.59
38
8.2
2.36
38
4.63
0.843
Ibid.
Korea
Busan
Mothers
c
2000
37.3
1.70
38
5.13
2.28
38
18.4
1.78
38
2.03
0.279
Ref.
[
]
Korea
Seoul
W
omen
1994
46.6
1.21
24
17.5
1.68
24
2.66
Ibid.
Korea
Chunan
W
omen
1994
59.9
1.34
29
21.7
1.53
29
2.76
Ibid.
Korea
Haman
W
omen
1994
33.4
1.33
41
20.2
1.70
41
1.65
Ibid.
Korea
Pusan
W
omen
1994
46.0
1.33
47
21.6
1.67
47
2.13
Ref.
[
]
Malaysia
Kuala
Lumpur
W
omen
1995
45.6
1.35
49
10.1
1.88
52
4.51
Ref.
[
]
T
aiwan
T
ainan
W
omen
1994
44.5
1.28
52
22.4
1.93
52
1.99
Ref.
[
]
Japan
All
Japan
W
omen
2003
–2008
15.5
i
1.51
1227
20.1
i
0.77
Ibid.
Japan
Hirosaki
city
W
omen
2008
13.8
i
1.60
100
20.1
i
0.69
Ibid.
Japan
Fukui
city
W
omen
2008
14.2
i
1.44
106
20.1
i
0.71
Ref.
[
]
Japan
Abuta
W
omen
1980
33.6
1.33
56
38.5
1.68
17
0.87
Ibid.
Japan
Nankodai
W
omen
1980
52.3
1.53
20
22.0
1.83
20
2.38
Ibid.
Japan
Akiu
W
omen
1980
35.0
1.35
19
25.3
1.42
15
1.38
Ibid.
Japan
Shironé
W
omen
1980
32.7
1.51
19
40.7
2.09
18
0.80
Ibid.
Japan
T
oyama
W
omen
1980
31.9
1.39
23
56.7
1.7
16
0.56
Ibid.
Japan
Fukagawa
W
omen
1980
61.6
1.44
22
55.2
1.65
24
1.12
Ibid.
Japan
Kanazawa
W
omen
1980
33.1
1.39
20
41.8
1.72
19
0.79
Ibid.
Japan
Hikawa
W
omen
1980
21.6
1.47
27
31.5
1.46
20
0.69
Ibid.
Japan
Geisei
W
omen
1980
21.0
1.53
16
42.5
2.01
17
0.49
Ibid.
Japan
T
suyazaki
W
omen
1980
26.2
1.40
26
31.7
1.42
26
0.83
Ibid.
Japan
Amami
W
omen
1980
30.7
1.37
52
25.9
1.67
21
1.19
Ibid.
Japan
Fukiagé
W
omen
1980
27.6
1.57
31
23.1
1.58
26
1.19
Ibid.
Japan
Aira
W
omen
1980
42.5
1.35
25
21.7
2.32
19
1.96
Ibid.
Japan
Misato
W
omen
1980
45.1
1.51
21
28.5
1.59
1
1
1.58
Ibid.
Japan
Miyako
W
omen
1980
27.8
1.47
38
17.2
1.36
10
1.62
Estimation of Dietary Pb and Cd Intake from Blood or Urine
271
T
able
1
(co
ntinued)
Reference
Country/Area
Location
Gender
,
etc.
Y
ear
of
study
Pb-B
Pb-U
cr
Pb-D
Pb-B
over
Pb-D
Pb-Ucr
over
Pb-D
GM
(μ
g/l)
GSD
N
GM
(μ
g/l)
GSD
N
GM
(μ
g/l)
GSD
N
Ibid.
Japan
Abuta
W
omen
1990
21.2
1.33
37
4.0
2.85
32
5.30
Ibid.
Japan
Nankodai
W
omen
1990
26.2
1.50
19
9.1
1.66
19
2.88
Ibid.
Japan
Kanan
W
omen
1990
30.5
1.37
18
8.7
1.54
10
3.51
Ibid.
Japan
Akiu
W
omen
1990
22.8
1.52
18
4.0
2.35
15
5.70
Ibid.
Japan
Kitakata
W
omen
1990
12.2
1.92
28
14.5
2.09
29
0.84
Ibid.
Japan
Shironé
W
omen
1990
24.5
1.37
24
2.2
2.68
22
1
1.14
Ibid.
Japan
T
oyama
W
omen
1990
25.2
1.48
26
6.0
3.02
25
4.20
Ibid.
Japan
Fukagawa
W
omen
1990
37.8
1.47
21
6.8
3.28
23
5.56
Ibid.
Japan
Kanazawa
W
omen
1990
22.0
1.51
24
7.8
2.56
24
2.82
Ibid.
Japan
Hikawa
W
omen
1990
25.8
1.46
33
7.8
2.96
28
3.31
Ibid.
Japan
Geisei
W
omen
1990
19.9
1.30
20
4.2
2.07
17
4.74
Ibid.
Japan
T
suyazaki
W
omen
1990
17.4
1.32
16
6.6
1.85
14
2.64
Ibid.
Japan
Amami
W
omen
1990
15.2
1.91
22
1
1.7
2.39
23
1.30
Ibid.
Japan
Fukiagé
W
omen
1990
25.0
1.60
29
10.6
2.16
28
2.36
Ibid.
Japan
Aira
W
omen
1990
27.8
1.39
28
10.1
2.38
28
2.75
Ibid.
Japan
Misato
W
omen
1990
32.7
1.45
29
10.2
2.23
10
3.21
Ibid.
Japan
Miyako
W
omen
1990
21.3
1.37
52
7.5
3.15
22
2.84
Ref.
[
]
China
Xian
W
omen
1997
43.4
1.32
50
7.03
2.49
50
26.1
1.64
50
1.66
0.269
Ibid.
China
Gongzhang
W
omen
1997
38.2
1.46
49
4.29
1.96
49
28.1
1.48
49
1.36
0.153
Ibid.
China
Baoji
W
omen
1997
21.5
1.37
50
4.03
1.89
50
36.0
1.49
50
0.60
0.1
12
Ref.
[
]
China
Beijing
W
omen
1993
–1995
53.2
1.41
50
31.8
3.12
24
1.67
Ibid.
China
Shanghai
W
omen
1993
–1995
79.0
1.50
50
17.0
1.72
50
4.65
Ibid.
China
Nannin
W
omen
1993
–1995
56.0
1.47
50
37.3
1.99
50
1.50
Ibid.
China
T
ainan
W
omen
1993
–1995
44.5
1.28
52
22.2
1.95
48
2.00
Ibid.
Japan
T
okyo
W
omen
1993
–1995
30.6
1.62
39
9.3
4.39
39
3.29
272
Ikeda et al.
T
a
bl
e
1
(co
n
ti
nue
d)
Reference
Country/Area
Location
Gender
,
etc.
Y
ear
of
study
Pb-B
Pb-U
cr
Pb-D
Pb-B
over
Pb-D
Pb-Ucr
over
Pb-D
GM
(μ
g/l)
GSD
N
GM
(μ
g/l)
GSD
N
GM
(μ
g/l)
GSD
N
Ibid.
Japan
Kyoto
W
omen
1993
–1995
45.6
2.05
17
14.6
3.6
17
3.12
Ibid.
Japan
Sendai
W
omen
1993
–1995
25.3
1.48
16
15.6
1.75
16
1.62
Ref.
[
]
The
Philippines
Manila
W
omen
1997
37
1.36
45
1
1.1
1.74
45
3.33
Ref.
[
]
Korea
Seoul
etc.
Adults
1999
–2000
28.9
30
16.4
30
1.76
Ref.
[
]
a
Japan
Shizuoka
pref.
Children
d
17.1
1.1
1
2
0
13.1
j
1.30
Ibid.
Japan
Shizuoka
pref.
Children
e
13.0
1.09
60
13.1
j
0.99
Ibid.
Japan
Shizuoka
pref.
Children
f
14.1
1.09
36
18.8
j
0.75
Ibid.
Japan
Shizuoka
pref.
Children
g
12.1
1.08
61
18.8
j
0.64
Ref.
[
]
a
Japan
Unknown
Children
h
1
1.8
i
1.1
132
16.5
j
0.72
Ref.
[
]
Thailand
Bangkok
W
omen
1998
30.7
1.38
36
2.00
1.51
36
14.1
1.76
36
2.18
0.142
Ref.
[
]
Japan
Hokkaido
W
omen
1991
–1998
17.1
1.87
51
5.15
1.98
51
4.90
3.44
51
3.49
1.051
Ibid.
Japan
T
ohoku
W
omen
1991
–1998
18.9
1.74
145
1.23
2.76
145
8.34
2.53
145
2.27
0.147
Ibid.
Japan
Kanto-T
okai
W
omen
1991
–1998
16.9
2.18
123
1.70
2.70
123
7.79
2.09
123
2.17
0.218
Ibid.
Japan
Hokuriku
W
omen
1991
–1998
20.7
1.94
75
3.55
2.48
75
8.52
2.68
75
2.43
0.417
Ibid.
Japan
Kinki
W
omen
1991
–1998
21.5
1.99
83
2.01
3.37
83
8.47
2.40
83
2.54
0.237
Ibid.
Japan
Chu-Shikoku
W
omen
1991
–1998
18.8
1.90
63
2.73
3.55
63
9.36
2.27
63
2.01
0.292
Ibid.
Japan
Kyushu-Okinawa
W
omen
1991
–1998
20.9
1.44
67
1.94
2.72
67
5.62
2.18
67
3.72
0.345
Pb-B,
Pb-Ucr
and
Pb-D
stand
for
Pb
in
blood,
in
urine
as
corrected
for
creatinine
and
in
24-h
food
duplicate,
respectively
,
unless
otherwise
specified
.
Analyses
were
by
graphite
furnace
atomic
absorption
spectrometry
,
unless
otherwise
specified.
GM,
GSD
and
N
stand
for
geometric
mean,
geometric
standard
deviation
and
numbers
of
case,
resp
ectively
a
The
moment
method
[
]
was
applied
to
estimate
GM
and
GSD
from
AM
and
ASD
b
4–
10-year-olds,
boys
and
girls
mixed
c
28-46
yr
-olds
d
1–
5-yr
-olds
from
smoking
families
e
1–
5
year-olds
from
non-smoking
families
f
6–
14-year-
olds
from
smoking
families
g
6–
14-year-olds
from
non-smoking
families
h
1–
15-year-olds
i
By
inductively-coupled
plasma-mass
spectrometry
j
Estimated
frrom
market
basket-based
data
of
Matsuda
[
];
see
the
“
”
section
for
details
of
estimation
procedures
Estimation of Dietary Pb and Cd Intake from Blood or Urine
273
T
able
2
The
database
for
Cd
internal
dose
and
dietary
intake
Reference
Country/Area
Location
Gender
,
etc.
Y
ear
of
study
Cd-B
Cd-U
cr
Cd-D
Cd-B
over
Cd-D
Cd-Ucr
over
Cd-D
GM
(μ
g/l)
GSD
N
G
M
(μ
g/l)
GSD
N
G
M
(μ
g/l)
GSD
N
Ref.
[
]
Korea
Busan
Children
a
2000
1.51
1.67
38
1.69
1.60
38
1
1.2
2.00
38
0.135
0.151
Ibid.
Korea
Busan
Mothers
b
2000
2.74
1.75
38
1.56
1.73
38
16.7
1.84
38
0.164
0.093
Ref.
[
]
Korea
Seoul
W
omen
1994
1.21
1.49
24
14.3
1.71
24
0.085
Ibid.
Korea
Chunan
W
omen
1994
1.03
1.78
29
19.6
1.61
29
0.053
Ibid.
Korea
Haman
W
omen
1994
1.55
1.51
41
24.2
1.82
41
0.064
Ibid.
Korea
Pusan
W
omen
1994
1.25
1.77
47
24.3
1.54
47
0.051
Ref.
[
]
Malaysia
Kuala
Lumpur
W
omen
1995
0.71
2.02
49
7.31
2.58
49
0.097
Ref.
[
]
T
aiwan
T
ainan
W
omen
1994
1.1
1
1.39
52
10.1
1.70
52
0.1
10
Ref.
[
]
Japan
All
Japan
W
omen
2003-8
1.23
c
1.70
1227
20.6
d
0.060
Ibid.
Japan
Hirosaki
city
W
omen
2008
1.37
c
1.66
100
1.01
1.88
100
20.6
d
0.066
0.049
Ibid.
Japan
Fukui
city
W
omen
2008
1.38
c
1.67
106
0.64
2.30
106
20.6
d
0.067
0.031
Ref.
[
]
Japan
Abuta
W
omen
1980
3.89
1.33
56
35.3
1.69
17
0.1
10
Ibid.
Japan
Nankodai
W
omen
1980
4.08
1.21
20
29.5
1.65
20
0.138
Ibid.
Japan
Akiu
W
omen
1980
3.15
1.38
19
26.7
1.86
15
0.1
18
Ibid.
Japan
Shironé
W
omen
1980
3.84
1.26
19
71.4
1.57
18
0.054
Ibid.
Japan
T
oyama
W
omen
1980
4.81
1.6
23
63.7
1.38
16
0.076
Ibid.
Japan
Fukagawa
W
omen
1980
3.68
1.29
22
27.6
1.53
24
0.133
Ibid.
Japan
Kanazawa
W
omen
1980
3.16
1.48
20
50.5
1.55
19
0.063
Ibid.
Japan
Hikawa
W
omen
1980
4.84
1.29
27
86.8
1.39
20
0.056
Ibid.
Japan
Geisei
W
omen
1980
3.05
1.27
16
33.3
1.59
17
0.092
Ibid.
Japan
T
suyazaki
W
omen
1980
3.94
1.47
26
92.3
1.69
26
0.043
Ibid.
Japan
Amami
W
omen
1980
2.92
1.47
52
19.5
1.31
21
0.150
Ibid.
Japan
Fukiagé
W
omen
1980
2.64
1.34
31
23.5
1.62
26
0.1
12
Ibid.
Japan
Aira
W
omen
1980
2.01
1.38
25
23.2
1.25
19
0.087
Ibid.
Japan
Misato
W
omen
1980
2.83
1.31
21
29.2
1.41
1
1
0.097
274
Ikeda et al.

T
able
2
(con
ti
nue
d)
Reference
Country/Area
Location
Gender
,
etc.
Y
ear
of
study
Cd-B
Cd-U
cr
Cd-D
Cd-B
over
Cd-D
Cd-Ucr
over
Cd-D
GM
(μ
g/l)
GSD
N
G
M
(μ
g/l)
GSD
N
G
M
(μ
g/l)
GSD
N
Ibid.
Japan
Miyako
W
omen
1980
3.31
1.43
38
30.1
1.37
10
0.1
10
Ibid.
Japan
Abuta
W
omen
1990
2.25
1.5
37
18.9
1.97
32
0.1
19
Ibid.
Japan
Nankodai
W
omen
1990
2.1
1
1.74
19
22.8
1.87
19
0.093
Ibid.
Japan
Kanan
W
omen
1990
1.99
1.32
18
29.0
1.53
10
0.069
Ibid.
Japan
Akiu
W
omen
1990
2.66
1.45
18
16.9
1.48
15
0.157
Ibid.
Japan
Kitakata
W
omen
1990
3.27
1.6
28
58.1
1.86
29
0.056
Ibid.
Japan
Shironé
W
omen
1990
3.93
1.37
24
67.3
1.65
22
0.058
Ibid.
Japan
T
oyama
W
omen
1990
3.76
1.49
26
64.5
1.84
25
0.058
Ibid.
Japan
Fukagawa
W
omen
1990
1.63
1.52
21
32.6
2.49
23
0.050
Ibid.
Japan
Kanazawa
W
omen
1990
2.57
1.83
24
45.8
1.54
24
0.056
Ibid.
Japan
Hikawa
W
omen
1990
2.41
1.5
33
41.6
1.74
28
0.058
Ibid.
Japan
Geisei
W
omen
1990
1.73
1.49
20
20.1
1.55
17
0.086
Ibid.
Japan
T
suyazaki
W
omen
1990
2.50
1.54
16
32.9
1.5
14
0.076
Ibid.
Japan
Amami
W
omen
1990
0.96
1.48
22
16.7
1.74
23
0.057
Ref.
[
]
China
Xian
W
omen
1997
0.45
1.51
50
3.00
1.72
50
5.83
1.41
50
0.077
0.515
Ibid.
China
Gongzhang
W
omen
1997
0.52
1.48
49
2.46
1.51
49
6.79
1.43
49
0.077
0.362
Ibid.
China
Baoji
W
omen
1997
0.42
1.72
50
3.06
1.63
50
5.64
1.49
50
0.074
0.543
Ref.
[
]
China
Beijing
W
omen
1993-5
0.79
1.54
50
5.8
1.87
24
0.136
Ibid.
China
Shanghai
W
omen
1993-5
1.18
1.40
50
6.1
2.01
50
0.193
Ibid.
China
Nannin
W
omen
1993-5
1.25
1.45
50
25.0
2.05
50
0.050
Ibid.
China
T
ainan
W
omen
1993-5
1.1
1
1.39
52
10.1
1.73
48
0.1
10
Ibid.
Japan
T
okyo
W
omen
1993-5
1.82
1.57
39
33.4
2.08
39
0.054
Ibid.
Japan
Kyoto
W
omen
1993-5
1.99
1.45
17
37.0
1.55
37
0.054
Ibid.
Japan
Sendai
W
omen
1993-5
2.08
1.84
16
24.8
1.88
16
0.084
Ref.
[
]
The
Philippines
Manila
W
omen
1997
0.47
1.87
45
14.2
2.77
45
0.033
Ref.
[
]
Korea
Seoul
etc.
Adults
1999-2000
1.30
12.61
0.103
Ref.
[
]
Japan
3
prefectures
W
omen
1980
3.57
1.42
141
27.7
1.75
65
0.129
Ibid.
Japan
3
prefectures
W
omen
1990
1.84
1.67
165
23.8
1.73
85
0.077
Ref.
[
]
China
Jinan
W
omen
1996
0.48
1.44
50
6.43
1.98
50
0.075
Estimation of Dietary Pb and Cd Intake from Blood or Urine
275
T
able
2
(continued)
Reference
Country/Area
Location
Gender
,
etc.
Y
ear
of
study
Cd-B
Cd-U
cr
Cd-D
Cd-B
over
Cd-D
Cd-Ucr
over
Cd-D
GM
(μ
g/l)
GSD
N
G
M
(μ
g/l)
GSD
N
G
M
(μ
g/l)
GSD
N
Ibid.
China
Baiquan
W
omen
1996
0.29
1.50
50
5.93
1.50
50
0.049
Ref.
[
]
Thailand
Bangkok
W
omen
1998
0.40
1.52
36
1.47
1.48
36
7.37
1.91
36
0.054
0.199
Ref.
[
]
Japan
V
illage
A
W
omen
2000-1
2.00
1.58
202
2.63
1.74
202
6.99
2.56
202
0.286
0.376
Ibid.
Japan
V
illage
B
W
omen
2000-1
1.91
1.73
202
3.47
1.7
202
19.14
2.30
202
0.100
0.181
Ibid.
Japan
V
illage
C
W
omen
2000-1
2.56
1.52
203
3.16
1.71
203
17.65
2.88
203
0.145
0.179
Ibid.
Japan
V
illage
D
W
omen
2000-1
1.65
2.35
204
3.16
1.77
204
38.91
2.18
204
0.042
0.081
Ibid.
Japan
V
illage
E
W
omen
2000-1
3.61
1.63
569
4.08
1.74
569
51.99
2.25
569
0.069
0.078
Ref.
[
]
Japan
Hokkaido
W
omen
1991-1998
2.17
1.52
51
5.69
1.39
51
18.7
1.88
51
0.12
0.30
Ibid.
Japan
T
ohoku
W
omen
1991-1998
1.42
2.12
145
3.16
2.00
145
20.7
2.54
145
0.07
0.15
Ibid.
Japan
Kanto-T
okai
W
omen
1991-1998
1.80
1.51
123
3.42
1.67
123
23.0
2.12
123
0.08
0.15
Ibid.
Japan
Hokuriku
W
omen
1991-1998
3.74
1.50
75
7.78
2.18
75
53.2
1.72
75
0.07
0.15
Ibid.
Japan
Kinki
W
omen
1991-1998
1.02
2.26
83
2.40
2.38
83
23.4
2.13
83
0.04
0.10
Ibid.
Japan
Chu-Shikoku
W
omen
1991-1998
2.02
1.58
63
5.27
1.92
63
27.0
1.92
63
0.07
0.20
Ibid.
Japan
Kyushu-Okinawa
W
omen
1991-1998
1.71
1.62
67
4.10
1.74
67
20.9
1.89
67
0.08
0.20
Analyses
were
by
graphite
furnace
atomic
absorption
spectrometry
,
unless
otherwise
specified.
Cd-B,
Cd-Ucr
and
Cd-D
stand
for
Cd
in
blood
(unit,
μ
g/l),
in
urine
as
corrected
for
creatinine
(unit,
μ
g/g
creatinine)
and
in
24-h
food
duplicate
(unit,
μ
g/day)
unless
otherwise
specified
a
4–
10-year
-old,
boys
and
girls
mixed
b
28
–46-year
-old
c
By
indusctively
coupled
plasma-mass
spectrometry
d
Estimated
from
market
basket-based
data
of
Matsuda
[
];
see
the
“Materials
and
Methods
”
section
for
details
of
estimation
procedures
276
Ikeda et al.

Analysis for Lead in Blood
For graphite furnace atomic absorption spectrometry (GFAAS) analysis, 100
μl blood
sample was taken into an acid-washed tube and mixed with 900
μl of a 1 to 1 mixture of
10% Triton X-100 in water and 10% diammonium hydrogenphosphate in water. An aliquot,
10
μl, of the final mixture was introduced into a GFAAS system by use of an auto-sampler.
The GFAAS was Hitachi type Z-8270 (Hitachi-naka, Hitachi, Japan) equipped with a tube-
type cuvette, and the measurement was made at 283.3 nm using the standard addition
method as previously described [
]. The average of two measurements was taken as a
representative value.
Inductively coupled plasma-mass spectrometry (ICP-MS) analysis was conducted after
acid digestion of 0.1 ml of blood sample by heating by microwave in a closed container,
and the digest was taken up with ultra-pure water (final volume; 5 ml), and analyzed by the
method as previously described [
].
Statistical Analysis
Log-normal distributions were assumed for Cd and Pb in food, blood or urine so that
geometric means (GMs) and geometric standard deviations (GSDs) were taken as
representative parameters for the distributions. In case original data were given in terms
of arithmetic means (AMs) and arithmetic standard deviations (ASDs), they were converted
to GMs and GSDs by use of the moment method [
] for uniformity of data presentation.
In case only medians were given in original articles, the medians were taken as if
they had been GMs. Possible significant correlation between two parameters was
examined by simple regression analysis. Smirnov test for extreme values was applied as
necessary.
Results
Quantitative Correlation Between the Measures by GFAAS and ICP-MS
In order to compare the results by GFAAS analysis with that by ICP-MS, 20 blood samples
of various Pb concentrations (24.0
–42.8 μg/l blood by ICP-MS) were analyzed for Pb by
both methods. When the results (in
μg Cd/l blood) by the ICP-MS and GFAAS methods
were taken on the x- and y-axis, respectively, there was a significant correlation between the
paired results with a regression line of y=0.677+0.77x (r=0.797, p<0.01). The analysis
showed that while the correlation between the two sets of the results were close and
significant, the difference between the two values were significant (p<0.01 by paired t test).
Comparison of the AM values (29.4 and 23.3
μg Cd/l blood by the ICP-MS and GFAAS,
respectively) suggests that ICP-MS would give greater values than GFASS by 26%.
Availability of the Data
Literature survey for publications in 1990s and 2000s for a combination of Pb-B (or Pb-U)
and Pb-D, or Cd-B (or Cd-U) and Cd-D gave 14 reports on Pb and 15 reports on Cd, as
summarized in Table
(for Pb) and Table
(for Cd). The basic parameters on data
availability are presented in Table
.
Estimation of Dietary Pb and Cd Intake from Blood or Urine
277
T
able
3
Basic
parameters
of
distribution
A
P
b
(14
reports)
B
C
d
(15
reports)
Parameter
Pb-B
Pb-U
cr
Pb-D
Ratio
Cd-B
Cd-U
cr
Cd-D
Ratio
GM
(μ
g/l)
GSD
N
b
GM
(μ
g/g
cr)
GSD
N
b
GM
(μ
g/day)
GSD
N
b
Pb-B
over
Pb-D
Pb-U
cr
over
Pb-D
Pb-D
over
Pb-B
Pb-D
over
Pb-U
cr
GM
(μ
g/l)
GSD
N
b
GM
(μ
g/g
cr)
GSD
N
b
GM
(μ
g/day)
GSD
N
b
Cb-B
over
Cb-D
Cb-U
cr
over
Cb-D
Cb-D
over
Cb-B
Cb-D
over
Cb-U
cr
N
a
68
67
68
13
13
13
68
59
68
68
13
68
5.2
68
67
68
20
20
20
68
64
68
68
20
68
20
AM
30.3
1.5
59.7
3.7
2.4
66.8
18.3
2.1
34.7
2.3
0.3
0.7
52.9
2.13
1.56
80.1
3.16
1.79
122.7
27.6
1.81
56.4
0.09
0.20
13.4
8.2
ASD
13.8
0.2
146.3
2.0
0.6
33.4
12.1
0.6
25.0
1.7
0.3
0.5
42.8
1.15
0.22
163.0
1.69
0.26
121.3
19.2
0.36
80.5
0.04
0.14
5.2
7.2
MED
27.7
1.44
36
3.55
2.48
51
16.4
1.95
26
2.0
0.3
0.5
61.0
1.99
1.51
39
3.1
1
1.74
79
23.3
1.74
34
0.1
0.2
13.1
6.1
Min
1
1.8
1.08
16
1.23
1.51
36
2.2
1.36
10
0.5
0.1
0.1
19.7
0.29
1.21
16
0.64
1.39
36
5.64
1.25
10
0.0
0.0
3.5
1.8
Max
79.0
2.2
1227
7.0
3.6
145
56.7
4.4
145
1
1.1
1.1
2.0
53.9
4.84
2.35
1227
7.78
2.38
569
92.3
2.88
569
0.3
0.5
30.2
32.2
a
Number
of
data
sets
b
Numbe
r
o
f
ca
ses
studie
d
in
each
report
278
Ikeda et al.

In the 14 reports on Pb, 68 pairs of Pb-B and Pb-D were available, but some papers did
not give variation parameters such as GSD. The number of articles reporting Pb-U in
combination with Pb-D was limited (13 papers). The distribution of the reported values for
Pb-D was markedly skewed, but the AM was about 18
μg/day with the maximum of
56.7
μg/day. The highest GM for Pb-B was 79.0 μg/l.
In case of Cd for which 15 reports were available, 68 pairs of Cd in blood (Cd-B) and in
food duplicates (Cd-D) were found. Reflecting the fact that the populations studied were
residents in non-polluted areas, the average Cd-D was less than 30
μg/day, but the
maximum was as high as 92.3
μg/day. The number of articles reporting both Cd-U and Cd-D
was limited to 20. The average and the maximum Cd-U
cr
were 3.16 and 7.78
μg/g cr,
respectively.
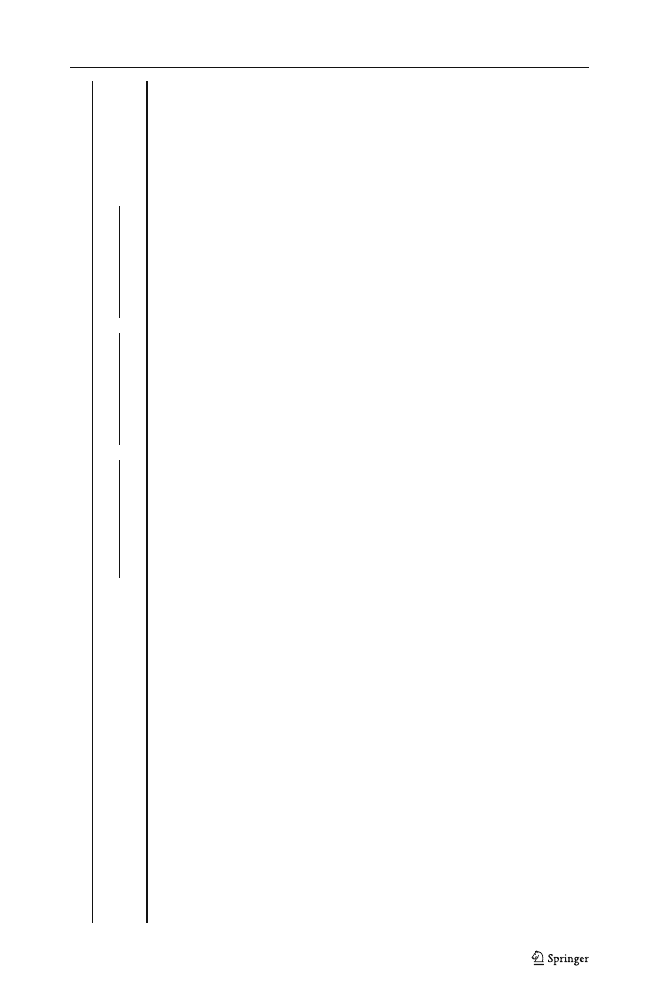
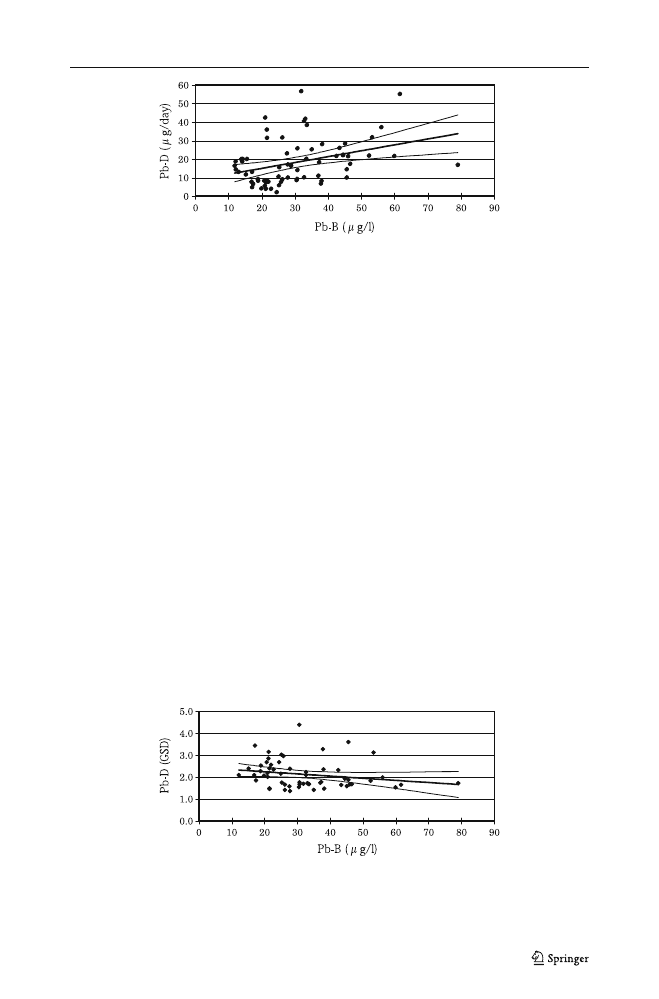
Relation of Pb-D with Pb-B and with Pb-U
Regression analysis was conducted (taking Pb-D as an independent variable and Pb-B or
Pb-U
cr
as a dependent variable) to examine the quantitative effects of Pb-D on Pb-B as well
as Pb-U
cr
. The analysis with Pb-B (Eq. 1 in Table
, Fig.
) showed that there was a
significant correlation between the two parameters (r=0.360, p<0.01), as expected. Only
13 cases were available for Pb-U
cr
. The correlation of Pb-U
cr
with Pb-D was weak and
insignificant (p>0.10; Eq. 2 in Table
), but that with Pb-B was close and significant (p<
0.01; Eq. 3).
With Pb-B and Pb-D as an independent and a dependent variable, respectively (Eq. 4
in Table
), the correlation was significant (p<0.01), and the slope was positive [0.317
(
μg/daily diet per μg/l blood) with the 95% range of 0.115 and 0.517]. The observation as
a whole was taken to suggest that Pb-D can be estimated from Pb-B, but the variation
may be wide.
In fact, when the Pb-D over Pb-B ratio was taken as a dependent variable (with Pb-B as
an independent variable) (Eq. 5 in Table
), the slope (the 95% range) was negative, i.e.
−0.011 (−0.018 to −0.003) suggesting that the role of Pb-D would decrease when total body
burden (Pb-B as an indicator of the total body burden) be high. In other words, the non-
dietary burden such as exposure to Pb-polluted atmospheric air may gain weight, as a
function of total body burden, as to be discussed later.
An attempt was made to estimate the Pb-D (GM) that would induce Pb-B at given levels,
such as 15
μg/l [the typical Pb-B level among current day Japanese women; the three lines
for ref. 11 in Table
], taking advantage of the regression analysis with Pb-B (GM) as an
independent variable and Pb-D (GM) as a dependent variable as described previously
(Fig.
). The three crosses of a hypothetical vertical line at 15
μg/l with the regression line
(and the 95% range curves in parenthesis) gave Pb-D of 14 (10
–18) μg/l. Similar regression
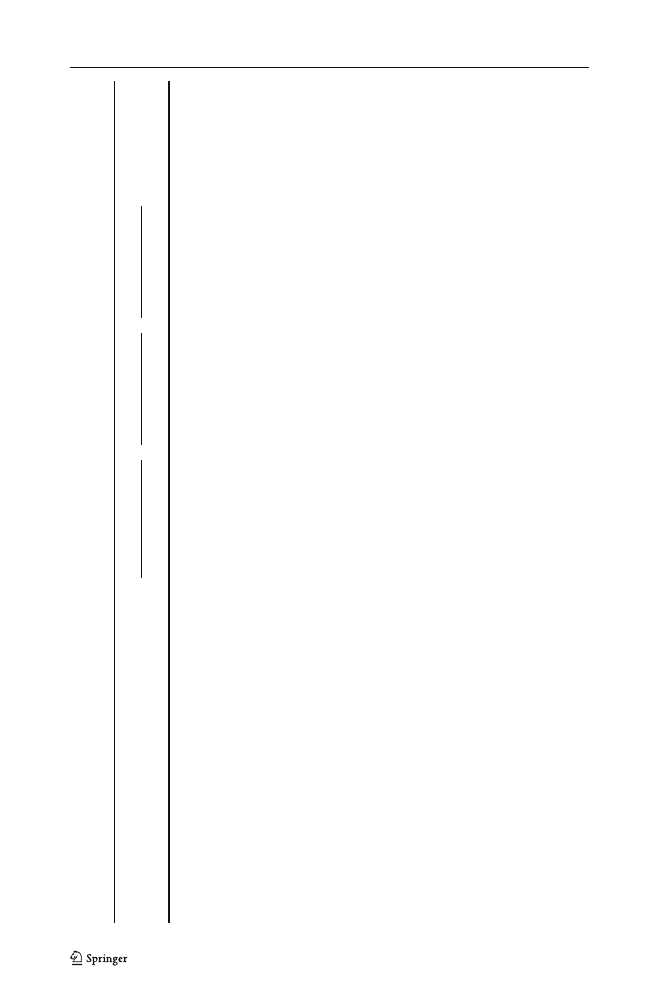
analysis taking Pb-B (GM) on the horizontal axis and Pb-D (GSD) on the vertical axis gave
a regression line (Eq. 6 in Table
) in which the slope was shallow but significant. The
regression equation gave about 2.3 for 15
μg/l Pb-B. The factor of 2.3 may suggest a 68%
variation range for Pb-D on an individual basis (Fig.
The Pb-B over Pb-D ratios were calculated for each case with Pb-B in
μg/l and Pb-D in
μg/day, and listed in the second right-most column in Table
. A regression analysis was
conducted taking Pb-B (in
μg/l) as an independent variable and the Pb-B over Pb-D ratio as
a dependent variable. A case with the Pb-B over Pb-D ratio of 11.14 was excluded as an
extreme value after application of Smirnov test. The calculation with 67 cases gave a
regression line with r=0.210 (p<0.10), a slope=0.020 (the 95% range; 0.000 to 0.044) and
an intercept=1.588 (Eq. 7 in Table
); the correlation coefficient of 0.210 was of borderline
Estimation of Dietary Pb and Cd Intake from Blood or Urine
279
T
able
4
Paramete
rs
of
reg
ression
equ
ations
Equati
on
no.
Indepe
n-dent
variable
Depende
nt
variable
Intercept
Slop
e
No.
of
cases
Co
rrelation
coef
ficient|
P
(α
)(
β
)
(95%
interval)
Eq.
1
Pb-D
Pb-B
22.810
0.41
0.15
–
0.670
68
0.36
0
<
0.01
Eq.
2
Pb-D
Pb-U
cr
2.64
5
0.07
−
0.04
9
–
0.19
13
0.37
>
0.10
Eq.
3
Pb-B
Pb-U
cr
−
0.12
0
0.14
0.05
–
0.240
13
0.7
<
0.01
Eq.
4
Pb-B
Pb-D
8.73
7
0.32
0.12
–
0.519
68
0.36
0
<
0.01
Eq.
5
Pb-B
Pb-D
ove
r
Pb-B
0.99
8
−
0.01
1
−
0.01
8
–
0.00
3
6
8
0.32
<
0.01
Eq.
6
Pb-B
Pb-D
(GS
D)
2.44
7
−
0.01
0
−
0.02
2
–
0
5
9
0.21
>
0.10
Eq.
7
Pb-B
Pb-B
ove
r
Pb-D
1.58
8
0.02
0
0.00
0
–
0.041
67
a
0.21
0
<
0.10
Eq.
8
C
d
-D
Cd-B
0.81
0
0.05
0.04
–
0.06
68
0.79
<
0.01
Eq.
9
C
d
-B
Cd-D
−
0.343
13.1
6
10.4
7
–
15.66
68
0.79
<
0.01
Eq.
10
Cd
-D
Cd-U
cr
1.7
0.07
0
0.02
0
–
0.12
20
0.57
0
<
0.01
Eq.
1
1
Cd
-U
cr
Cd-D
6.22
4.62
1.32
–
7.916
20
0.57
0
<
0.01
Eq.
12
Cd
-B
Cd-D
ove
r
Cd-B
14.950
−
0.71
1
−
1.80
2
–
0.38
68
0.16
>
0.10
Eq.
13
Cd
-U
cr
Cd-D
ove
r
Cd-U
cr
14.101
−
1.87
1
−
3.77
7
–
0.03
20
0.44
<
0.10
Unless
othe
rwise
specified,
Pb-B
,
Pb-
Ucr
,
Pb-D
,
C
d
-B,
Cd-Ucr
and
Cd
-D
are
GM
values
in
μ
g/l,
μ
g/g
cr
or
μ
g/day
a
One
case
w
ith
the
Pb-
B
over
Pb-D
ratio
of
1
1.14
was
dep
eted
as
an
extreme
valu
e
after
Smi
rnov
test
for
extr
eme
value
280
Ikeda et al.
significance (p<0.10). Based on the equation, the best estimate of the Pb-B over Pb-D ratio
for Pb-B of 15
μg/l was 1.9 or about 2.
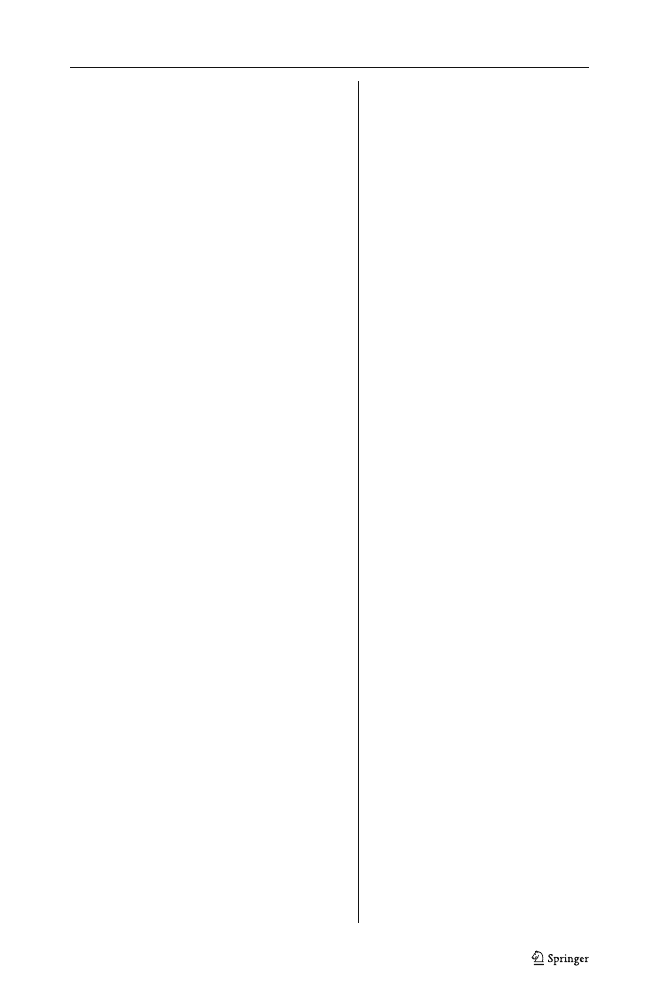
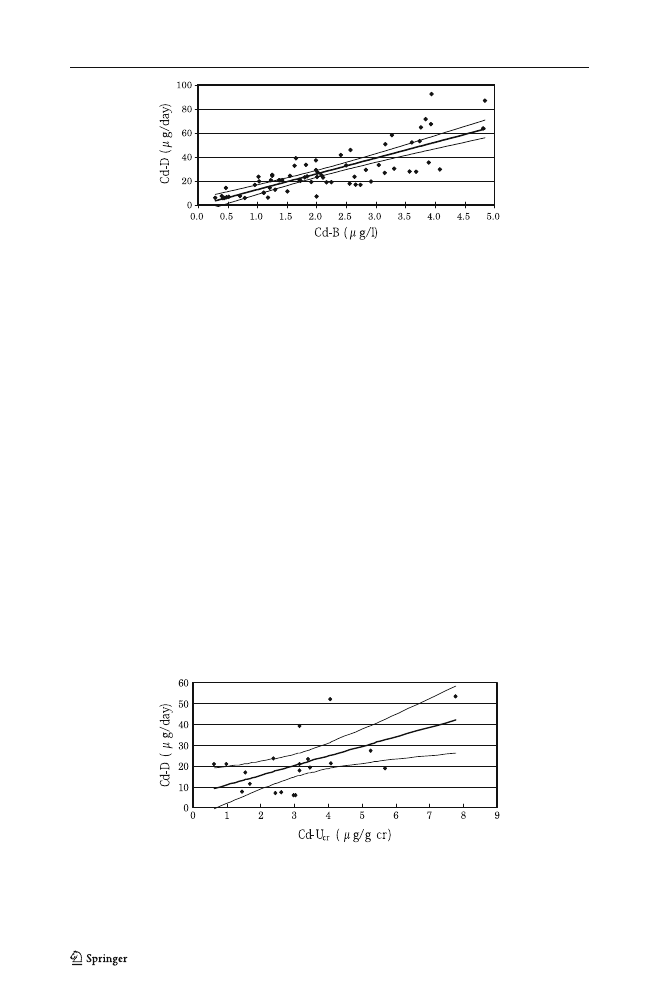
Dietary Burden and Internal Dose of Cd
The correlation analysis showed that Cd-B correlated significantly (p<0.01) with Cd-D,
with a significant correlation coefficient of 0.792 (Eq. 8 in Table
). When Cd-B was taken
as an independent variable, the lower 95% limit of the slope (
β) was 10.47, which was
clearly positive (i.e. >0) (Eq. 9 in Table
, Fig.
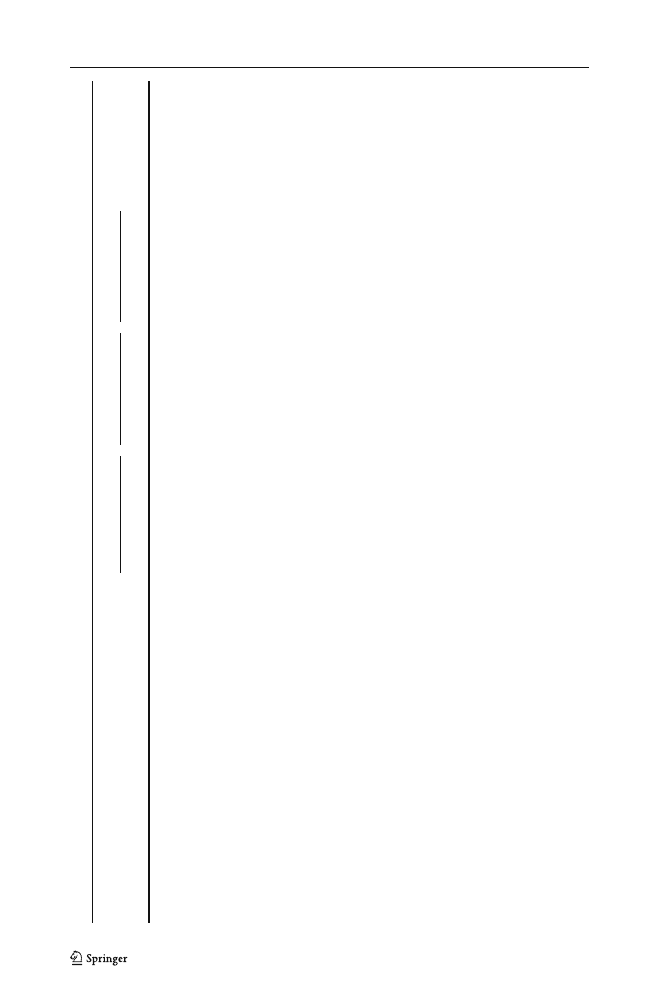
The number of studies of Cd-U paired with daily dietary intake data was limited and
only 20 pairs of Cd-U
cr
and Cd-D were available. Similar analysis revealed that, taking
Cd-D and Cd-U
cr
as an independent and a dependent variable, respectively, the slope was
positive (0.070) suggesting that Cd-U would increase as an increasing function of Cd-D
(Eq. 10 in Table
). The correlation, r=0.570, was statistically significant (p<0.01) (Fig.
).
The analysis taking Cd-B as an independent variable and the ratio of Cd-D over Cd-B as
a dependent variable (Eq. 12 in Table
) revealed that the ratio stayed essentially unchanged
with no response to an increase in Cd-B. Although the correlation (r=0.158) was weak and
statistically insignificant (p>0.10), the 95% range for the slope was −1.802 to 0.381,
indicating that the regression line was essentially in parallel to the horizontal axis. A similar
Fig. 1 Relation of Pb in blood and Pb in daily diet. A regression analysis was conducted with Pb in blood
(Pb-B) as an independent variable and Pb in daily diet (Pb-D) as a dependent variable. Both Pb-B (μg/l) and
Pb-D (
μg/day) are GM values for the study sites. The line in the middle is a calculated regression line (for the
equation parameters, see Table
), and the curves on both sides are the 95% ranges of the means. Each dot
represents one study site
Fig. 2 No significant changes in GSD of Pb in daily diet as a function of Pb in blood. A regression analysis
was conducted with Pb in blood (Pb-B; GM in μg/l for the study site) as an independent variable and GSD
(dimensionless) of Pb in daily diet (Pb-D) as a dependent variable. The meaning of the line in the middle and
two curves on both sides, as well as that of the dots are as in Fig.
. For equation, see Table
Estimation of Dietary Pb and Cd Intake from Blood or Urine
281
analysis with Cd-U
cr
and the ratio of Cd-D over Cd-U
cr
(Eq. 13) also gave a regression line
with no significant increase of the ratio with increasing Cd-U
cr
.
Discussion
It appears to be the case that 50 to 100
μg/l is a critical concentration when GFAAS is
employed for Pb-B analysis; for example, a coefficient of variation as large as 20% was
reported when blood samples containing 100
μg Pb/l was analyzed [
]. As the target Pb-B
concentrations in the present study were well below these levels (e.g. Table
), it was
thought essential to make a compatibility analysis in results between conventional GFAAS
and newly developed ICP-MS. The results showed that there was a close correlation
between the GFAAS results and ICP-MS result, and that ICP-MS would give greater values
than GFAAS by 26%. In contrast, GFAAS has been well accepted for both Cd-B and Cd-U
analyses in a wide range [
], suggesting no need for compatibility tests with other
analytical methods in case of Cd analyses.
The present analyses with data in 14 reports on Pb and 15 reports on Cd in blood, urine
and 24-h diet samples suggested that it should be possible to estimate both Pb-D and Cd-D
Fig. 4 Relation of Cd in blood and Cd in daily diet. A regression analysis was conducted with Cd in urine
after correction for creatinine (Cd-U
cr
) as an independent variable and Cd in daily diet (Cd-D) as a dependent
variable. Both Cd-U
cr
(
μg/g cr) and Cd-D (μg/day) are GM values for the study sites. The meaning of the
line in the middle and two curves on both sides, as well as that of the dots are as in Fig.
. For equation, see
Table
Fig. 3 Relation of Cd in blood and Cd in daily diet. A regression analysis was conducted with Cd in blood
(Cd-B) as an independent variable and Cd in daily diet (Cd-D) as a dependent variable. Both Cd-B (μg/l) and
Cd-D (
μg/day) are GM values for the study sites. The meaning of the line in the middle and two curves on
both sides, as well as that of the dots are as in Fig.
. For equation, see Table
282
Ikeda et al.

from Pb-B and Cd-D. The Cd-B-based estimation for Cd-D appears to be quite possible as
the Cd-D over Cd-B ratio stayed unchanged irrespective of Cd-B. It was also the case when
Cd-U
cr
was employed in place of Cd-B. In contrast, the estimation for Pb-D from Pb-B
apparently needs careful evaluation of concurrent intensity of exposure to Pb, because the
ratio of Pb-D over Pb-B may decrease as a function of increasing intensity of Pb exposure
as represented by Pb-B (Eq. 7 in Table
Such difference between Cd and Pb in the relationship of dietary exposure (Cd-D and
Pb-D) with total body burden (as expressed by Cd-B or Cd-U
cr
, and Pb-B) is in agreement
with previous observation on the populations environmentally exposed to Pb and Cd.
Namely, the exposure to Cd is almost exclusively via foods as Cd in the atmosphere is
generally very low and contributes little to total body burden [
], whereas contribution of
air-borne Pb may exceed 50% of total Pb burden even for general populations [
] as a
function of the extent of urban air pollution with Pb [
]. In this sense, the gap between the
1980
’s studies-based estimate by Carrington et al. [
] and the present estimation as to
be discussed below may be attributable to the different intensity of environmental Pb
pollution, especially that of urban air.
Based on the studies of Ryu et al. [
]
estimated 10, 10, 30
μg Pb/100 ml blood (or 100, 100 and 300 μg Pb/l blood) as Pb-B
levels of concern for children, pregnant women and adults and figured out Pb-D of 60, 250
and 750
μg Pb/day by use of conversion factors [=Pb-B (inμg/100 ml)/Pb-D (in μg/day)
[
]] of 0.16, 0.04 and 0.04 for the three groups, respectively. The Pb-D of 750
μg/day is
however apparently too high when the present day Pb-D is considered; for example, the Pb-D
level is well below 60
μg/day in Japan (Table
). Pb-B has also been reduced to <20
μg/l (or
<2
μg/100 ml; Table
). Thus, the conversion factor of 0.04 (or 0.40 when Pb-B is expressed
in
μg/l) for adults for example, will be no longer valid.
The present analysis made it clear in addition, that the relation of Pb-B with Pb-D is not
constant but may vary as a function of Pb-B (Eq. 7 in Table
) so that the ratio, calculated
as Pb-B (in
μg/l) over Pb-D (inμg/day) e.g. for adult Japanese women with current Pb-B of
around 15
μg/l (in the three lines under ref. 11 in Table
) should be around 1.9 (Eq. 7 in
Table
) as described above. For those with Pd-B of about 30
μg/l, the best estimate will be
2.2 (Eq.7 in Table
). No data are available to compare the ratio for children directly with
that for adult people in Japan. Nevertheless, the data made available by Moon et al. [
]
based on the study in Busan, Korea, suggest that the ratio for children may be twice as high
as that for their mothers (Table
Possible effects of insufficient calcium (Ca) intake on Pb-B among children have been a
matter of concern in recent years. Three reports are available which unanimously suggest
that Pb-B would be higher among those who take Ca only insufficiently. In a study in
Mexico city [
] in which 200 cases of children (at the age of <13 to 50+ months) were
analyzed, those (n=50 each) with daily Ca intake of <360, 360 to <449, 449 to <624 and
624 mg/day (estimated by food intake frequency questionnaires) had Pb-B [GM estimated
from AM and ASD by the moment method [
]] at 9.75, 9.03, 8.00 and 7.64
μg/100 ml,
respectively. P-values for the differences in Pb-B from the lowest Ca intake group were
>0.10, >0.10, <0.10 and <0.05, respectively.
Elias et al. [
] reported that Pb-B [2.96
μg/100 ml as GM estimated by the moment
method [
]] of 225 primary school children (in Kuala Lumpur, Malaysia) decreased as a
reverse function of dietary Ca intake (407 mg/day as AM estimated by food frequency
questionnaire); the slope (with Ca intake and Pb-B on the horizontal and vertical axis,
respectively), was <0 (i.e.,
−0.011) with p=0.014. In a village in Mexico, a study [
] on
752 residents including 202<15 year-old children showed that Pb-B was lower (7.2, 6.9
Estimation of Dietary Pb and Cd Intake from Blood or Urine
283

and 6.0
μg/100 ml as GM, respectively) among those (n=243 to 247) who took more Ca (i.e.
505, 505
–706, and 706 mg/day; estimated by food frequency questionnaires).
It is known through national surveys that Ca intake is insufficient especially among young
children in Japan [
]. Thus, more than 50% of children at the ages of 1
–2 and 3–5 years take
Ca less than the adequate intake (AI; 40), and the median intake is about the AI at 6
–9 years
of age [
]. Thus, insufficient intake of Ca among children should be taken as a dietary factor
to increase sensitivity of Japanese children to Pb toxicity. Of interest in this connection is the
observation that Pb in Ca supplements does not affect Pb-B, possibly because Pb absorption
in the digestive tract is suppressed by co-existing abundant Ca in the pellets [
Different from adult cases, poor personal hygiene of using dirty hands when eating foods is
an additional factor to increase lead exposure of children. Freeman et al. [
] observed
increased Pb burden through foods such as banana and hot dog when taken with spoilt hands.
There are several limitations in the present analysis. Compared with the number of pairs
of Cd-D and Cd-B (60 in total), only 13 pairs were available for the analysis between Cd-D
and Cd-U. More data are apparently desired to examine possible association between Cd-D
and Cd-U, because urine samples are more readily available than blood samples in field
surveys. In the case of Pb, the limited number for Pb-U is not necessarily a matter of serious
concern in evaluation because poor correlation of Pb-U with Pb-B is well-known especially
when Pb exposure is low [
].
It was observed in the present study that the ICP-MS would be give values about 26%
larger than the values by GFAAS. Another factor to induce bias relates to the methods to
estimate recent metal burden for Japanese populations. The market basket method was
employed by Matsuda [
] to establish the estimates, whereas the food duplicate method
was employed in other studies. The difference might induce systematic bias in evaluation.
For example, the data by Watanabe et al. [
] on 1990 survey gave a number weighted
average of 19.1
μg/day for Pb. It was 40.8 μg/day for Cd. In contrast, Toyoda et al. [
using the market basket method assumedly similar to that used by Matsuda [
], reported that
daily Pb and Cd intakes by Japanese population in 1990 were 41
μg/day and 26 μg/day,
respectively. In estimating the Pb-B over Pb-D ratios based on Kaji [
]
Ikeda et al. [
], the estimation of dietary intake was based on Matsuda [
]. In Takagi [
]
and Ikeda et al. [
], Pb-B for example was measured by the ICP-MS method. Introduction of
factors for converting a market basket-based value to a food duplicate-based one (e.g. division
by factor 2) and a ICP-MS-based value to a GFASS-based value (-ca. 20%) would give Pb-B
(in
μg/l) over Pb-D (in μg per day) ratio of 1.3 to 2.0 for Kaji [
]
and 1.1 to 1.2 for Ikeda et al. [
In over-all evaluation, it appears prudent to conclude that dietary intake of Pb and Cd can be
estimated from Pb and Cd in blood, as well as Cd in urine. Nevertheless, care should be taken
for the estimation of Pb-D from Pb-B as the ratio of Pb-D over Pb-B may increase as Pb-B
decreases. The best estimate for Pb-B (
μg/l)/Pb-D (μg/day) will be about two for adults, and the
ratio for children may be higher possibly by a factor of about two [
]. It should be noted that in
the case of children, poor personal hygiene and possible effects of nutritional factors such as
insufficient calcium intake (typically in Japan) may need to be taken into consideration.
Acknowledgments A part of this study was supported by Grants-in Aid from Food Safety Commission,
Japan (No.0802) for fiscal years 2008
–2009.
Thanks are due to the administration and staff of Kyoto Industrial Health Association, Kyoto, Japan, for
their interest in and support to this study.
Conflicts of Interest The authors declare that they have no conflicts of interest.
284
Ikeda et al.

References
1. Ikeda M, Zhang Z-W, Shimbo S, Watanabe T, Nakatsuka H, Moon C-S, Matsuda-Inoguchi N,
Higashikawa K (2000) Exposure of women in general populations to lead via food and air in east and
southeast Asia. Am J Ind Med 38:271
–280
2. Ikeda M, Zhang Z-W, Shimbo S, Watanabe T, Nakatsuka H, Moon C-S, Matsuda-Inoguchi N,
Higashikawa K (2000) Urban population exposure to lead and cadmium in east and south-east Asia. Sci
Total Environ 249:373
–384
3. Zhang Z-W, Moon C-S, Shimbo S, Watanabe T, Nakatsuka H, Matsuda-Inoguchi N, Higashikawa K,
Ikeda M (2000) Further reduction in lead exposure in women in general populations in Japan in the
1990s, and comparison with levels in east and south-east Asia. Int Arch Occup Environ Health
73:91
–97
4. Acheson KJ, Campbell IT, Edholm OC, Miller DS, Stock MJ (1980) The measurement of food and
energy intake in man
—an evaluation of some techniques. Am J Clin Nutr 33:147–1154
5. Zhang Z-W, Shimbo S, Miyake K, Watanabe T, Nakatsuka H, Matsuda-Inoguchi N, Moon C-S,
Higashikawa K, Ikeda M (1999) Estimates of mineral intakes using food composition tables vs measures
by inductively-coupled plasma mass spectrometry: Part 1. Calcium, phosphorus and iron. Eur J Clin Nutr
53:226
–232
6. Shimbo S, Zhang Z-W, Miyake K, Watanabe T, Nakatsuka H, Matsuda-Inoguchi N, Moon C-S,
Higashikawa K, Ikeda M (1999) Estimates of mineral intakes using food composition tables vs measures
by inductively-coupled plasma mass spectrometry: Part 2. Sodium, potassium, magnesium, copper and
zinc. Eur J Clin Nutr 53:233
–238
7. Moon C-S, Paik J-M, Choi C-S, Kim D-H, Ikeda M (2003) Lead and cadmium levels in daily
foods, blood and urine in children and their mothers in Korea. In Arch Occup Environ Health
76:282
–288
8. Moon C-S, Zhang Z-W, Shimbo S, Watanabe T, Moon D-H, Lee C-U, Lee B-K, Ahn K-D, Lee S-H,
Ikeda M (1995) Dietary intake of cadmium and lead among the general population in Korea. Environ
Res 71:46
–54
9. Moon C-S, Zhang Z-W, Watanabe T, Shimbo S, Noor Hassim I, Jamal HH, Ikeda M (1996) Non-
occupational exposure of Malay women in Kuala Lumpur, Malaysia, to cadmium and lead. Biomarkers
1:81
–85
10. Ikeda M, Zhang Z-W, Moon C-S, Imai Y, Watanabe T, Shimbo S, Ma W-C, Lee C-C, Guo Y-LL (1996)
Background exposure of general population to cadmium and lead in Tainan City, Taiwan. Arch Environ
Contam Toxicol 30:121
–126
11. Ikeda M, Ohashi F, Sakuragi S, Moriguchi J (2010) Cadmium, chromium, manganese, lead and nickel
levels in blood of adult women in non-polluted areas in Japan, as determined by inductively-coupled
sector field mass spectrometry. Int Arch Occup Environ Health (in press)
12. Watanabe T, Nakatsuka H, Shimbo S, Iwami O, Imai Y, Moon C-S, Zhang Z-W, Iguchi H, Ikeda M
(1996) Reduced cadmium and lead burden in Japan in the past 10 years. Int Arch Occup Environ Health
68:305
–314
13. Watanabe T, Zhang Z-W, Qu J-B, Gao W-P, Jian Z-K, Shimbo S, Nakatsuka H, Matsuda-Inoguchi N,
Higashikawa K, Ikeda M (2000) Background lead and cadmium exposure of adult women in Xian city
and two farming villages in Shaanxi Province, China. Sci Total Environ 247:1
–13
14. Zhang Z-W, Moon C-S, Watanabe T, Shimbo S, He F-S, Wu Y-Q, Zhou S-F, Su D-M, Qu J-B, Ikeda M
(1997). Background exposure of urban populations to lead and cadmium: comparison between China
and Japan. Int Arch Occup Environ Health 69:273
–281
15. Zhang Z-W, Subida RD, Agetano MG, Nakatsuka H, Inoguchi N, Watanabe T, Shimbo S, Higashikawa
K, Ikeda M (1998) Non-occupational exposure of adult women in Manila, the Philippines, to lead and
cadmium. Sci Total Environ 215:157
–165
16. Oh E, Lee E-I, Lim H, Jang J-Y (2006) Human muiti-route exposure assessment of lead and cadmium
for Korean volunteers. J Prev Med Publ Health 39:53
–58 (in Korean with English abstract)
17. Kaji M (2007) Blood levels in Japanese children
—effects of passive smoking. Biomed Res Trace Elem
18:199
–203
18. Matsuda R (2008) Dietary intake of food contaminants. Available at
http://mhlw-grants.niph.go.jp/niph/
(in Japanese). Accessed on 1 Dec 2009
19. Takagi M, Tamiya S, Yoshinaga J, Kaji M (2009) Lead in blood of Japanese children; analytical
considerations. Jpn J Hyg 64:403, in Japanese
20. Watanabe T, Iwami O, Shimbo S, Ikeda M (1993) Reduction in cadmium in blood and dietary intake
among general populations in Japan. Int Arch Occup Environ Health 65:S205
–S208
Estimation of Dietary Pb and Cd Intake from Blood or Urine
285

21. Watanabe T, Zhang Z-W, Qu J-B, Xu G-F, Song L-H, Wang J-J, Shimbo S, Nakatsuka H, Higashikawa
K, Ikeda M (1998) Urban-rural comparison on cadmium exposure among general populations in
Shandong Province, China. Sci Total Environ 217:1
–8
22. Zhang Z-W, Shimbo S, Watanabe T, Srianujata S, Banjong O, Chitchumroonchokchai C, Nakatsuka H,
Matsuda-Inoguchi N, Higashikawa K, Ikeda M (1999) Non-occupational lead and cadmium exposure of
adult women in Bangkok, Thailand. Sci Total Environ 226:65
–74
23. Horiguchi H, Oguma E, Sasaki S, Miyamoto K, Ikeda Y, Machida M, Kayama F (2004) Dietary
exposure to cadmium at close to the current provisional tolerable weekly intake does not affect renal
function among female Japanese farmers. Environ Res 95:20
–31
24. Jackson S (1966) Creatinine in urine as an index of urinary excretion rate. Health Phy 12:843
–850
25. Moriguchi J, Ezaki T, Tsukahara T, Fukui Y, Ukai H, Okamoto S, Shimbo S, Sakurai H, Ikeda M (2005)
Decrease in urine specific gravity and urinary creatinine in elderly women. Int Arch Occup Environ
Health 78:438
–445
26. Ministry of Health Labour and Welfare, Japan (2009) National health and nutrition survey in Japan 2006.
Dai-ichi Shuppan Press, Tokyo, p 277, in Japanese
27. Ezaki T, Tsukahara T, Moriguchi J, Furuki K, Fukui Y, Ukai H, Okamoto S, Sakurai H, Honda S, Ikeda M
(2003) No clear-cut evidence for cadmium-induced tubular dysfunction among over 10,000 women in the
Japanese general population; a nationwide large-scale survey. Int Arch Occup Environ Health 76:186
–196
28. Sugita M, Tsuchiya K (1996) Estimation of variation among individuals of biological half-times of
cadmium calculated from accumulation data. Environ Res 68:31
–37
29. American Conference of Governmental Industrial Hygienists (2009) BEI: Lead, elemental and inorganic.
TLVs® and BEIs® with 7th Edition Documentation. ACGIH, Cincinnati
30. American Conference of Governmental Industrial Hygienists (2009) BEI: Cadmium and inorganic
compounds. TLVs® and BEIs® with 7th Edition Documentation. ACGIH, Cincinnati
31. Carrington CD, Bolger PM (1992) An assessment of the hazards of lead in food. Regulat Toxicol
Pharmacol 16:265
–272
32. Carrington CD, Bolger PM, Scheuplein RJ (1996) Risk analysis of dietary lead exposure. Food Add
Contam 13:61
–76
33. Ryu JE, Ziegler EE, Nelson SE, Fomon SJ (1983) Dietary intake of lead and blood lead concentration in
early infancy. Am J Dis Child 137:886
–891
34. Sherlock JC, Smart G, Forbes GI, Moore MR, Patterson WJ, Richards WN, Wilson TS (1982)
Assessment of lead intakes and dose-response for a population in Ayr exposed to a plumbosolvent water
supply. Hum Toxicol 1:115
–122
35. Sherlock JC, Ashby D, Delves HT, Forbes GI, Moore MR, Patterson WJ, Pocock SJ, Quinn MJ,
Richards WN, Wilson TS (1984) Reduction in exposure to lead from drinking water and its effect on
blood lead concentrations. Hum Toxicol 3:383
–392
36. Sherlock JC, Quinn MJ (1986) Relationship between blood lead concentrations and dietary lead intake in
infants: the Glasgow duplicate diet study 1979
–1980. Food Add Contam 3:167–176
37. Lacasaña M, Romieu I, Sanin LH, Palazuelos E, Hernandez-Avila M (2000) Blood lead levels and
calcium intake in Mexico City children under five years of age. Int J Environ Health Res 10:331
–340
38. Elias SM, Hashim Z, Marjan ZN, Abdullah AS, Hashim JH (2007) Relationship between blood lead
concentration and nutritional status among Malay primary school children in Kuala Lumpur, Malaysia.
Asian-Pacific J Public Health 19:29
–37
39. Cifuentes E, Villanueva J, Sanin LH LH (2000) Predictors of blood lead levels in Agricultural villages
practicing wastewater irrigation in central Mexico. Environ Health 75:177
–182
40. Ministry of Health, Labour and Welfare, Japan (2005) Dietary reference values for Japanese, 2005. Dai-
ichi Shuppan Press, Tokyo, pp XII
–XIV, in Japanese
41. Gulson BL, Mizon KJ, Palmer JM, Korsh MJ, Taylor AJ (2001) Contribution of lead from calcium
supplements to blood lead. Environ Health Perspect 109:283
–288
42. Freeman NCG, Sheldon L, Jimenez M, Melnyk L, Pellizzari E, Berry M (2001) Contribution of
children's activities to lead contamination of food. J Expos Anal Environ Epidemiol 11:407
–413
43. Higashikawa K, Zhang Z-W, Shimbo S, Moon C-S, Watanabe T, Nakatsuka H, Matsuda-Inoguchi N,
Ikeda M (2000) Correlation between concentration in urine and in blood of cadmium and lead among
women in Asia. Sci Total Environ 246:97
–107
44. Toyoda M, Matsuda R, Igarashi A, Saito Y (1998) Estimation of daily dietary intake of environmental
pollutants in Japan and analysis of the contamination sources. Shokuhin Eisei Kenkyu (Food Hygiene
Research) 48:43
–65 (in Japanese)
45. Shimbo S, Zhang Z-W, Moon C-S, Watanabe T, Nakatsuka H, Matsuda-Inoguchi N, Higashikawa K,
Ikeda M (2000) Correlation between urine and blood concentrations, and dietary intake of cadmium and
lead among women in the general population of Japan. Int Arch Occup Environ Health 73:163
–170
286
Ikeda et al.
Document Outline
- Estimation of Dietary Pb and Cd Intake from Pb and Cd in Blood or Urine
Wyszukiwarka
Podobne podstrony:
Numerical estimation of the internal and external aerodynamic coefficients of a tunnel greenhouse st
ENERGY FOR BUILDINGS ESTIMATION OF DEMAND VARIATIONS AND MODERN SYSTEMS OF ENERGY SUPPLY Kalina 31
Population Based Estimates of Breast Cancer Risks Associated With ATM Gene Variants c 7271T4G and c
Detection and Molecular Characterization of 9000 Year Old Mycobacterium tuberculosis from a Neolithi
Gade, Lisa, Lynge, Rindel Roman Theatre Acoustics; Comparison of acoustic measurement and simulatio
Coleman Playback From The Victrola To MP3, 100 Years Of Music, Machines, And Money
Did Shmu el Ben Nathan and Nathan Hanover Exaggerate Estimates of Jewish Casualties in the Ukraine D
Pitot pressures of correctly expanded and underexpanded free jets from axisymmetric supersonic nozzl
James Dawes The Language of War, Literature and Culture in the U S from the Civil War through World
2000 SOURCE OF DIETARY FIBER FED TO DOGS AFFECTS NITROGEN AND ENERGY
Claire Puccia Parham From Great Wilderness to Seaway Towns, A Comparative History of Cornwall, Onta
Insensitive Semantics~ A Defense of Semantic Minimalism and Speech Act Pluralism
Development of Carbon Nanotubes and Polymer Composites Therefrom
Does the number of rescuers affect the survival rate from out-of-hospital cardiac arrests, MEDYCYNA,
Analysis of soil fertility and its anomalies using an objective model
więcej podobnych podstron