
© National Instruments
| 1-1
1
Navigating LabVIEW
This lesson introduces how to navigate the LabVIEW environment. This includes using the menus,
toolbars, palettes, tools, help, and common dialog boxes of LabVIEW. You also learn how to run
a VI and gain a general understanding of a front panel and block diagram. At the end of this lesson,
you create a simple VI that acquires, analyzes, and presents data.
Topics
A. What is LabVIEW
B. Project Explorer
C. Parts of a VI
D. Front Panel
E. Block Diagram
F. Searching for Controls, VIs and Functions
G. Selecting a Tool
H. Dataflow
I.
Building a Simple VI

Lesson 1
Navigating LabVIEW
1-2
| ni.com
A. What is LabVIEW
LabVIEW is a graphical programming environment you can use to quickly and efficiently create
applications with professional user interfaces. Millions of engineers and scientists use LabVIEW
to develop sophisticated measurement, test, and control system applications using intuitive icons
and wires. In addition, the LabVIEW platform is scalable across different targets and OSs. In fact,
LabVIEW offers unrivaled integration with thousands of hardware devices and provides hundreds
of built-in libraries for advanced analysis and data visualization for you to create virtual
instruments you can customize to your needs.
Because LabVIEW programs imitate the appearance and operation of physical instruments, such
as oscilloscopes and multimeters, LabVIEW programs are called virtual instruments or, more
commonly, VIs. VIs have front panels and block diagrams. The front panel is the user interface.
The block diagram is the programming behind the user interface. After you build the front panel,
you add code using graphical representations of functions to control the front panel objects. The
code on the block diagram is graphical code, also known as G code or block diagram code.
In contrast to text-based programming languages, like C++ and Visual Basic, LabVIEW uses icons
instead of lines of text to create applications. In text-based programming, instructions determine
the order of program execution. LabVIEW uses graphical dataflow programming. In graphical
dataflow programming, the flow of data through the nodes on the block diagram determines the
execution order. Graphical programming and dataflow execution are the two major ways
LabVIEW is different from most other general-purpose programming languages.
In this course, you see how you can use LabVIEW to effectively create simple data acquisition
applications using the three steps: acquire, analyze, and present. Although this course is taught on
a Windows system, LabVIEW is multi-platform. You can develop applications on a Windows, Mac
OS, or Linux system. Furthermore, you can deploy LabVIEW applications to a variety of real-time
and FPGA targets.
LabVIEW Characteristics
LabVIEW programs have the following characteristics:
•
A graphical and compiled nature
•
Dataflow and/or event-based programming
•
Multi-target and platform capabilities
•
Object-oriented flexibility
•
Multi-threading possibilities

LabVIEW Core 1 Course Manual
© National Instruments
| 1-3
In LabVIEW Core 1, you learn about the graphical and compiled nature of LabVIEW and dataflow
programming. The following courses explore other characteristics:
•
LabVIEW Core 2—Learn about event-based programming.
•
Object-Oriented Design and Programming in LabVIEW—Learn about object-oriented
programming in LabVIEW.
•
LabVIEW Performance—Learn how to take advantage of LabVIEW's multithreading and
memory management to improve program execution and memory usage.
Graphical and Compiled
While represented graphically, with icons and wires instead of with text, G code on the block
diagram contains the same programming concepts found in most traditional languages. For
example, G code includes data types, loops, event handling, variables, recursion, and
object-oriented programming. LabVIEW compiles G code directly to machine code so the
computer processors can execute it. You do not have to compile G code in a separate step.
Dataflow and Event-Driven Programming
LabVIEW programs execute according to dataflow programming rules instead of the procedural
approach found in most text-based programming languages such as C and C++. Dataflow
execution is data-driven, or data-dependent. The flow of data between nodes in the G code
determines the execution order.
Event-driven programming features extend the LabVIEW dataflow environment to allow the user's
direct interaction with the program without the need for polling. Event-based programming also
allows other asynchronous activity to influence the execution of G code on the block diagram.
Multi-Target and Multi-Platform
With LabVIEW applications, you can target multicore processors and other parallel hardware such
as field-programmable gate arrays (FPGAs). You can automatically scale LabVIEW applications
to CPUs with two, four, or more cores, often with no additional programming effort.
G code, with the exception of a few platform-specific functions, is portable between the different
LabVIEW systems for different operating systems. Therefore, you can often use the same code
whether running LabVIEW on Windows, Mac OS X or Linux systems.
Object-Oriented
Object-oriented programming is a popular programming approach across a wide variety of
programming languages. It allows a variety of similar, yet different items, to be represented as a
class of objects in software. LabVIEW provides tools and functions so you can use object-oriented
programming techniques in G code.
Lesson 1
Navigating LabVIEW
1-4
| ni.com
Multithreading and Memory Management
LabVIEW enables your code to have automatic parallelism. In other languages if you want to run
code in parallel, you have to manage multiple threads manually. The LabVIEW environment, with
the compiler and execution system working together, automatically runs code in parallel whenever
possible. Most of the time the details of the execution system are unimportant to you because the
system does the right thing without intervention. However, LabVIEW also provides you with
options for improving performance.
Launching the LabVIEW Environment
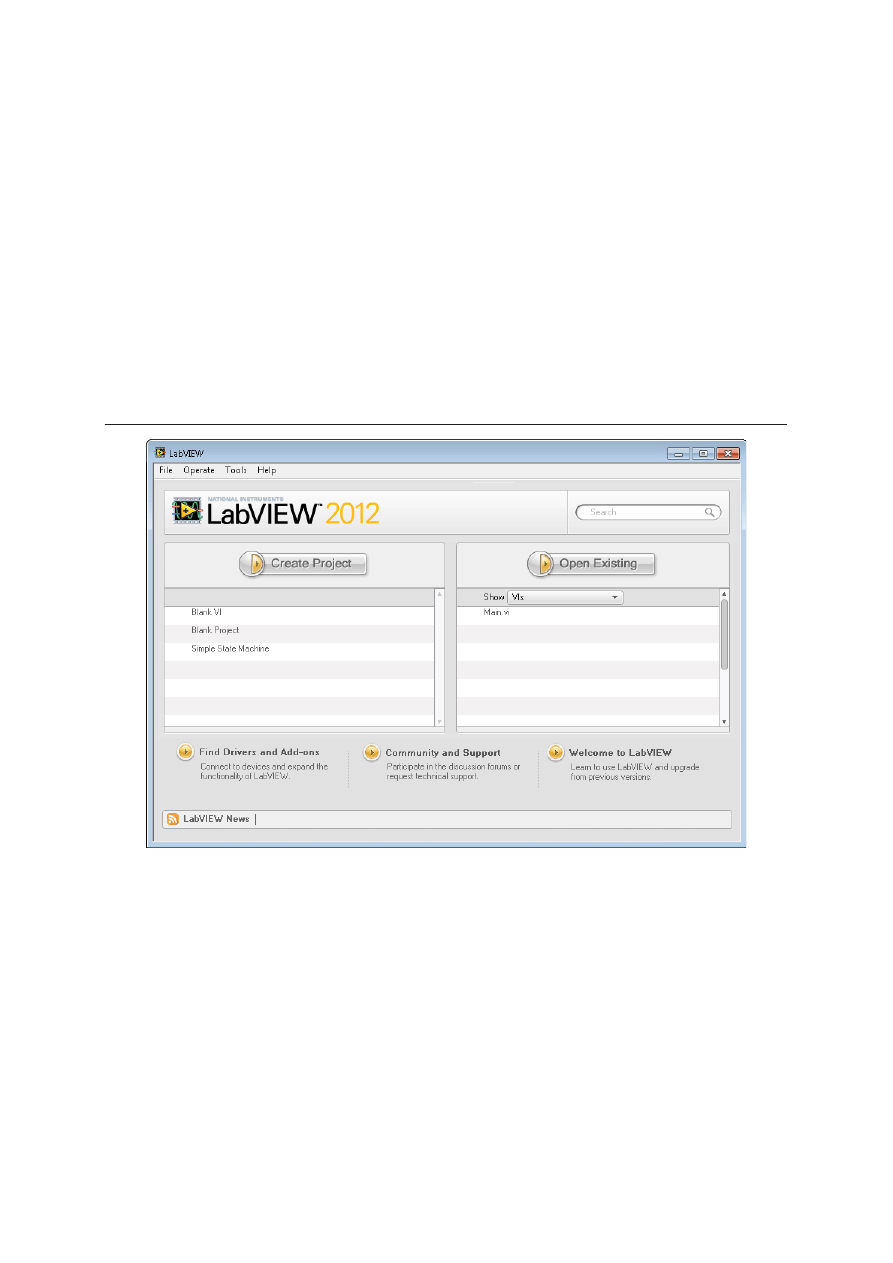
When you launch LabVIEW, the Getting Started window appears as shown in Figure 1-1.
Figure 1-1. LabVIEW Getting Started Window
Use the Getting Started window to create new projects and VIs. You can create items from scratch
or from templates and samples. You can also open existing LabVIEW files and access LabVIEW
community resources and help.
The Getting Started window disappears when you open an existing file or create a new file, and
reappears when you close all open front panels and block diagrams. You can display the window
at any time by selecting View»Getting Started Window.

LabVIEW Core 1 Course Manual
© National Instruments
| 1-5
B. Project Explorer
VIs are LabVIEW programs, and you can use multiple VIs together to make a LabVIEW
application. To group these application-related VIs together, use a LabVIEW project. When you
save a LabVIEW project from the Project Explorer window, LabVIEW creates a project file
(
.lvproj
), that includes references to all the LabVIEW files and non-LabVIEW files in the
project, configuration information, build information, and deployment information.
Some LabVIEW applications, such as simple VIs, do not need to use a LabVIEW project.
However, you must use a project to build stand-alone applications and shared libraries. In addition,
you must use a project to work with non-development machine targets such as real-time (RT),
field-programmable gate array (FPGA), or personal digital assistant (PDA) targets. Refer to the
specific module documentation for more information about using projects with the LabVIEW
Real-Time, FPGA, and PDA modules.
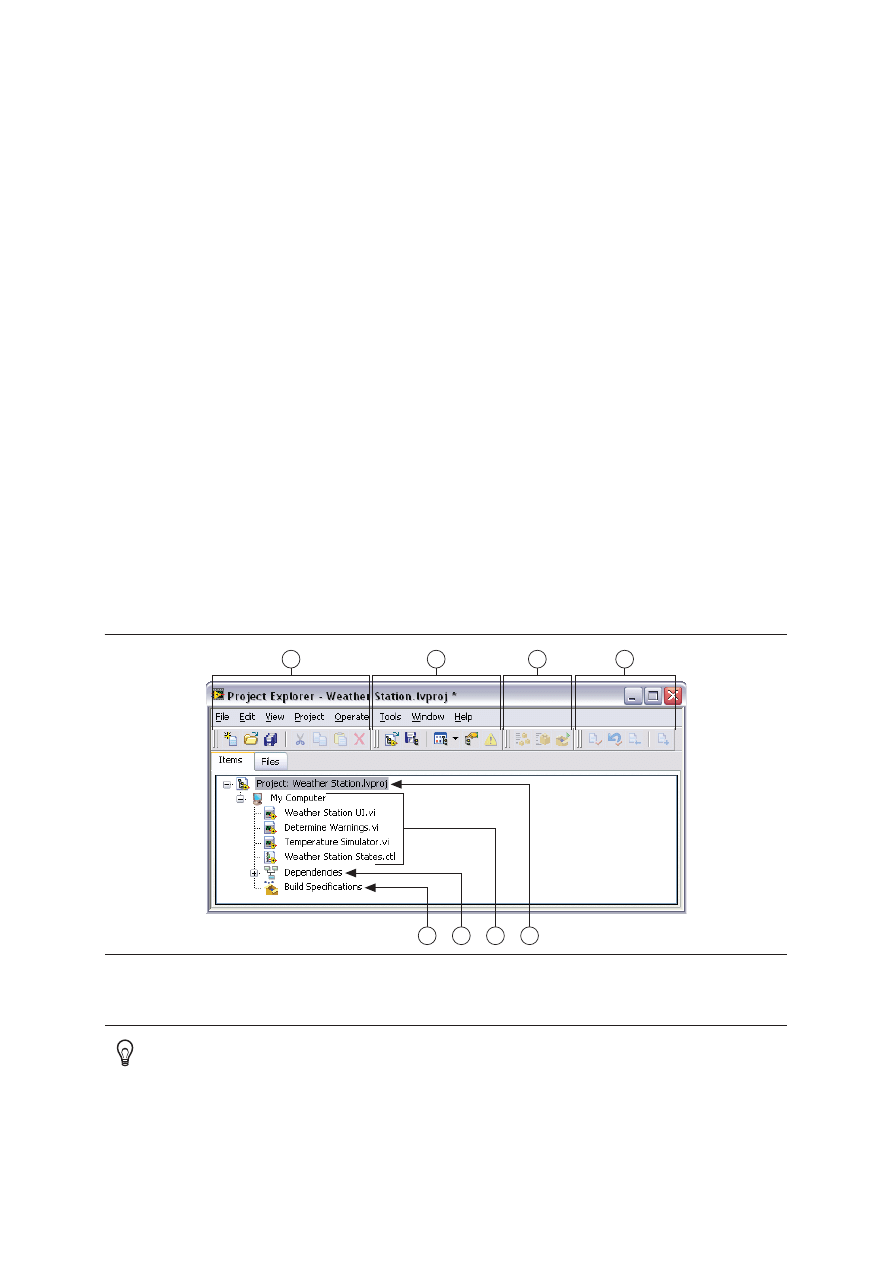
Project Explorer Window
Projects in LabVIEW consist of VIs, files necessary for those VIs to run properly, and
supplemental files such as documentation or related links. Use the Project Explorer window to
manage projects in LabVIEW.
The Project Explorer window includes the following items by default:
•
Project root—Contains all other items in the Project Explorer window. The label on the
project root includes the filename for the project.
•
My Computer—Represents the local computer as a target in the project.
•
Dependencies—Includes VIs and items that VIs under a target require.
•
Build Specifications—Includes build configurations for source distributions and other types
of builds available in LabVIEW toolkits and modules. If you have the LabVIEW Professional
Development System or Application Builder installed, you can use Build Specifications to
configure stand-alone applications, shared libraries, installers, and zip files.
Tip
A target is any device that can run a VI.
When you add another target to the project, LabVIEW creates an additional item in the Project
Explorer window to represent the target. Each target also includes Dependencies and Build
Specifications sections. You can add files under each target.
Complete the following steps to use the Project Explorer window to create and edit LabVIEW
Projects.
1. Select File»Create Project to display the Create Project dialog box. The Create Project
dialog box includes a list of templates and sample projects you can use to ensure that the project
you create uses reliable designs and programming practices.
Lesson 1
Navigating LabVIEW
1-6
| ni.com
2. Search for the template or sample project that supports the goal you want the project to
accomplish. Use the following features to search for templates and sample projects:
•
Filters—Displays only results of a certain type, such as templates or sample projects for a
specific target.
•
Additional Search—Searches the keywords, titles, and descriptions of the filtered results.
•
More Information—Opens the help file for the item. Review the help file to ensure that
the template or sample project supports the goal you want the project to accomplish.
3. Click the Next or Finish button to configure details of the project, including how the project is
saved. After you finish configuring the project, LabVIEW saves the project and opens the
Project Explorer window and the top-level VI of the project.
4. Use the Project Explorer window to modify the project. Refer to the comments on the block
diagrams of VIs in the project for more information about how to modify the project. Also refer
to the Project Documentation folder in the Project Explorer window for more information
about how to modify the project.
Project-Related Toolbars
Use the Standard, Project, Build, and Source Control toolbar buttons to perform operations in a
LabVIEW project. The toolbars are available at the top of the Project Explorer window, as shown
in Figure 1-2. You might need to expand the Project Explorer window to view all of the toolbars.
Figure 1-2. Project Explorer Window
Tip
The Source Control toolbar is only available if you have source control configured
in LabVIEW.
1
Standard Toolbar
2
Project Toolbar
3
Build Toolbar
4
Source Control Toolbar
5
Project Root
6
Target
7
Dependencies
8
Build Specifications
1
2
4
3
8
5
7
6

LabVIEW Core 1 Course Manual
© National Instruments
| 1-7
You can show or hide toolbars by selecting View»Toolbars and selecting the toolbars you want to
show or hide. You can also right-click an open area on the toolbar and select the toolbars you want
to show or hide.
Creating a LabVIEW Project
Complete the following steps to create a project.
1. Choose one of the following actions to create a new LabVIEW project.
•
In the Getting Started window, click Blank Project to open a blank project or click the
Create Project button to create a project from a template.
•
In an open LabVIEW project or VI, select File»Create Project.
•
In any LabVIEW window, select File»New. Then select Project»Empty Project in the
New dialog box to display the Project Explorer window.
2. Add items you want to include in the project under a target.
3. Select File»Save Project to save the project.
Adding Existing Files To A Project
You can add existing files to a project. Use the My Computer item (or other target) in the Project
Explorer window to add files such as VIs or text files, to a LabVIEW project.
You can add items to a project in the following ways:
•
Right-click My Computer and select Add»File from the shortcut menu to add a file. You also
can select Project»Add To Project»File from the Project Explorer menu to add a file.
•
Right-click the target and select Add»Folder (Auto-populating) from the shortcut menu to
add an auto-populating folder. You also can select Project»Add To Project»Add Folder
(Auto-populating) to add an auto-populating folder. LabVIEW continuously monitors and
updates the folder according to changes made in the project and on disk.
•
Right-click the target or My Computer and select Add»Folder (Snapshot) from the shortcut
menu to add a virtual folder. You also can select Project»Add To Project»Add Folder
(Snapshot) to add a virtual folder. When you select a directory on disk, LabVIEW creates a
new virtual folder in the project with the same name as the directory on disk. LabVIEW also
creates project items that represent the contents of the entire directory, including files and
contents of subdirectories. Selecting a folder on disk adds contents of the entire folder,
including files and contents of subfolders.
Note
After you add a virtual folder on disk to a project, LabVIEW does not
automatically update the folder in the project if you make changes to the folder on disk.
•
Right-click the target and select New»VI from the shortcut menu to add a new, blank VI. You
also can select File»New VI or Project»Add To Project»New VI to add a new, blank VI.

Lesson 1
Navigating LabVIEW
1-8
| ni.com
•
Select the VI icon in the upper right corner of a front panel or block diagram window and drag
the icon to the target.
•
Select an item or folder from the file system on your computer and drag it to the target.
Removing Items from a Project
You can remove items from the Project Explorer window in the following ways:
•
Right-click the item you want to remove and select Remove from Project from the shortcut
menu.
•
Select the item you want to remove and press <Delete>.
•
Select the item you want to remove and click the Remove From Project button on the
Standard toolbar.
Note
Removing an item from a project does not delete the item on disk.
Organizing Items in a Project
The Project Explorer window includes two pages, the Items page and the Files page. The Items
page displays the project items as they exist in the project tree. The Files page displays the project
items that have a corresponding file on disk. You can organize filenames and folders on this page.
Project operations on the Files page both reflect and update the contents on disk. You can switch
from one page to the other by right-clicking a folder or item under a target and selecting Show in
Items View or Show in Files View from the shortcut menu.
Use folders to organize items in the Project Explorer window. You can add two types of folders
to a LabVIEW project, virtual folders and auto-populating folders. Virtual folders organize project
items. Right-click a target in the Project Explorer window and select New»Virtual Folder from
the shortcut menu to create a new virtual folder. Auto-populating folders update in real time to
reflect the contents of folders on disk. Add an auto-populating folder to the project to view project
items as they appear on disk.
Auto-populating folders are visible only on the Items page of the Project Explorer window. You
can view the disk contents of an auto-populating folder but you cannot perform disk operations
such as renaming, reorganizing, and removing project items. To perform disk operations of items
in an auto-populating folder, use the Files page of the Project Explorer window. The Files page
displays the location of project folders on disk. Project operations on the Files page both update
and reflect the contents of the folder on disk. Likewise, LabVIEW automatically updates the
auto-populating folder in the project if you make changes to the folder on disk outside of
LabVIEW.
You can arrange items in a folder. Right-click a folder and select Arrange By»Name from the
shortcut menu to arrange items in alphabetical order. Right-click a folder and select Arrange By»
Type from the shortcut menu to arrange items by file type.

LabVIEW Core 1 Course Manual
© National Instruments
| 1-9
Viewing Files in a Project
When you add a file to a LabVIEW project, LabVIEW includes a reference to the file on disk.
Right-click a file in the Project Explorer window and select Open from the shortcut menu to open
the file in its default editor.
Right-click the project and select View»Full Paths from the shortcut menu to view where files that
a project references are saved on disk.
Use the Project File Information dialog box to view where files that a project references are
located on disk and in the Project Explorer window. Select Project»File Information to display
the Project File Information dialog box. You also can right-click the project and select View»File
Information from the shortcut menu to display the Project File Information dialog box.
Saving a Project
You can save a LabVIEW project in the following ways:
•
Select File»Save Project.
•
Select Project»Save Project.
•
Right-click the project and select Save from the shortcut menu.
•
Click the Save Project button on the Project toolbar.
You must save new, unsaved files in a project before you can save the project. When you save a
project, LabVIEW does not save dependencies as part of the project file.
Note
Make a backup copy of a project when you prepare to make major revisions to
the project.
Lesson 1
Navigating LabVIEW
1-10
| ni.com
C. Parts of a VI
LabVIEW VIs contain three main components—the front panel window, the block diagram, and
the icon/connector pane.
Front Panel Window
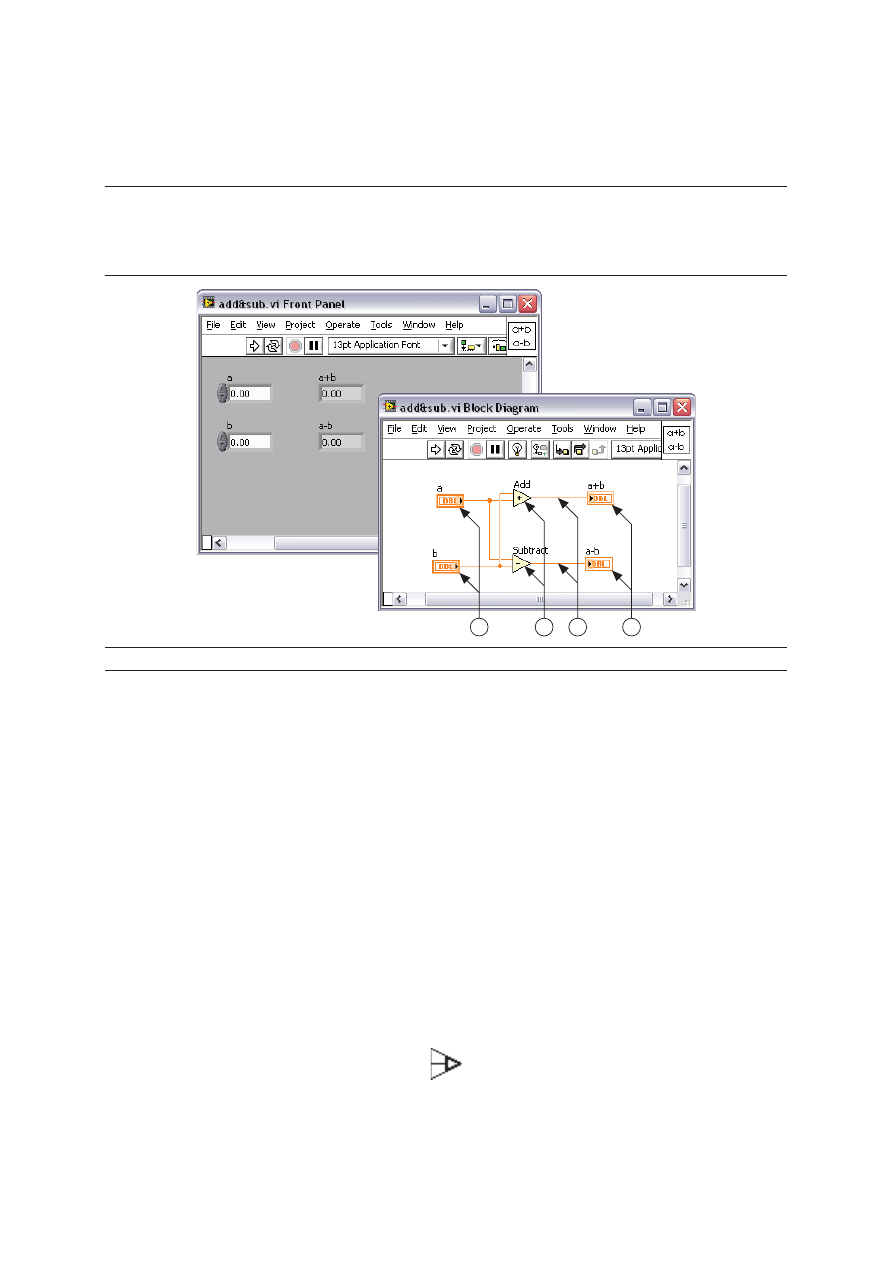
The front panel window is the user interface for the VI. Figure 1-3 shows an example of a front
panel window. You create the front panel window with controls and indicators, which are the
interactive input and output terminals of the VI, respectively.
Figure 1-3. VI Front Panel
LabVIEW Core 1 Course Manual
© National Instruments
| 1-11
Block Diagram Window
After you create the front panel window, you add code using graphical representations of functions
to control the front panel objects. Figure 1-4 shows an example of a block diagram window. The
block diagram window contains this graphical source code. Front panel objects appear as terminals
on the block diagram.
Figure 1-4. Block Diagram
Icon and Connector Pane
The Icon and Connector pane allows you to use and view a VI in another VI. A VI that is used in
another VI is called a subVI, which is similar to a function in a text-based programming language.
To use a VI as a subVI, it must have an icon and a connector pane.
Every VI displays an icon in the upper right corner of the front panel window and block diagram
window. An example of the default icon is shown below. An icon is a graphical representation of
a VI. The icon can contain both text and images. If you use a VI as a subVI, the icon identifies the
subVI on the block diagram of the VI. The default icon contains a number that indicates how many
new VIs you opened after launching LabVIEW.
To use a VI as a subVI, you need to build a connector pane, shown below. The connector pane is a
set of terminals on the icon that corresponds to the controls and indicators of that VI, similar to the
parameter list of a function call in text-based programming languages. The connector pane is
displayed next to the VI icon in the upper right corner of the front panel window. You cannot access
the connector pane from the icon in the block diagram window.
Lesson 1
Navigating LabVIEW
1-12
| ni.com
Opening an Existing VI
Select Browse in the Open list in the Getting Started window to navigate to and open an existing VI.
Tip
The VIs you edit in this course are located in the
<Exercises>\LabVIEW
Core 1
directory.
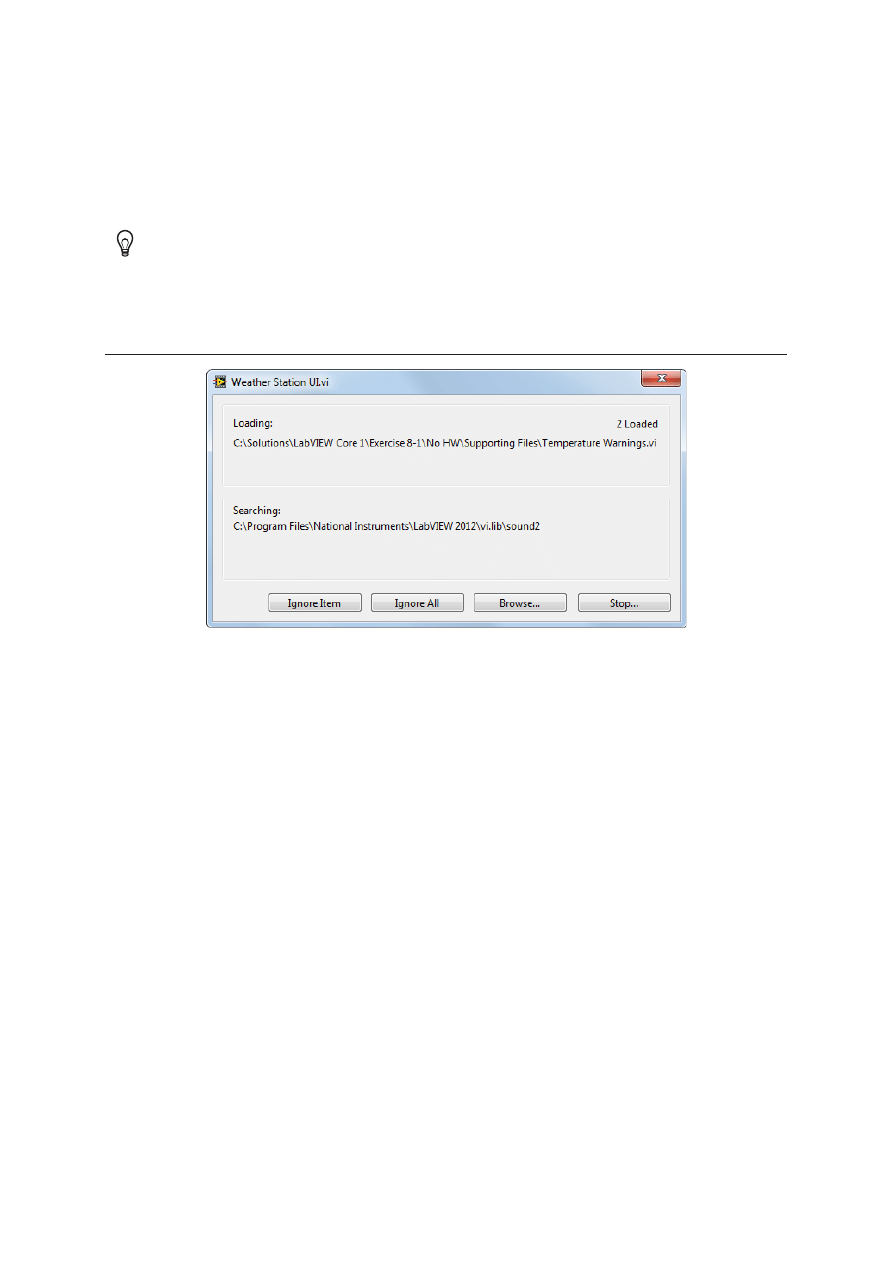
As the VI loads, a status dialog box similar to the following example might appear.
Figure 1-5. Dialog Box Indicating the Status of Loading VIs
The Loading section lists the subVIs of the VI as they load into memory and shows the number of
subVIs loaded into memory so far. You can cancel the load at any time by clicking the Stop button.
If LabVIEW cannot immediately locate a subVI, it begins searching through all directories
specified by the VI search path. You can edit the VI search path by selecting Tools»Options and
selecting Paths from the Category list.
You can have LabVIEW ignore a subVI by clicking the Ignore Item button, or you can click the
Browse button to search for the missing subVI.
LabVIEW Core 1 Course Manual
© National Instruments
| 1-13
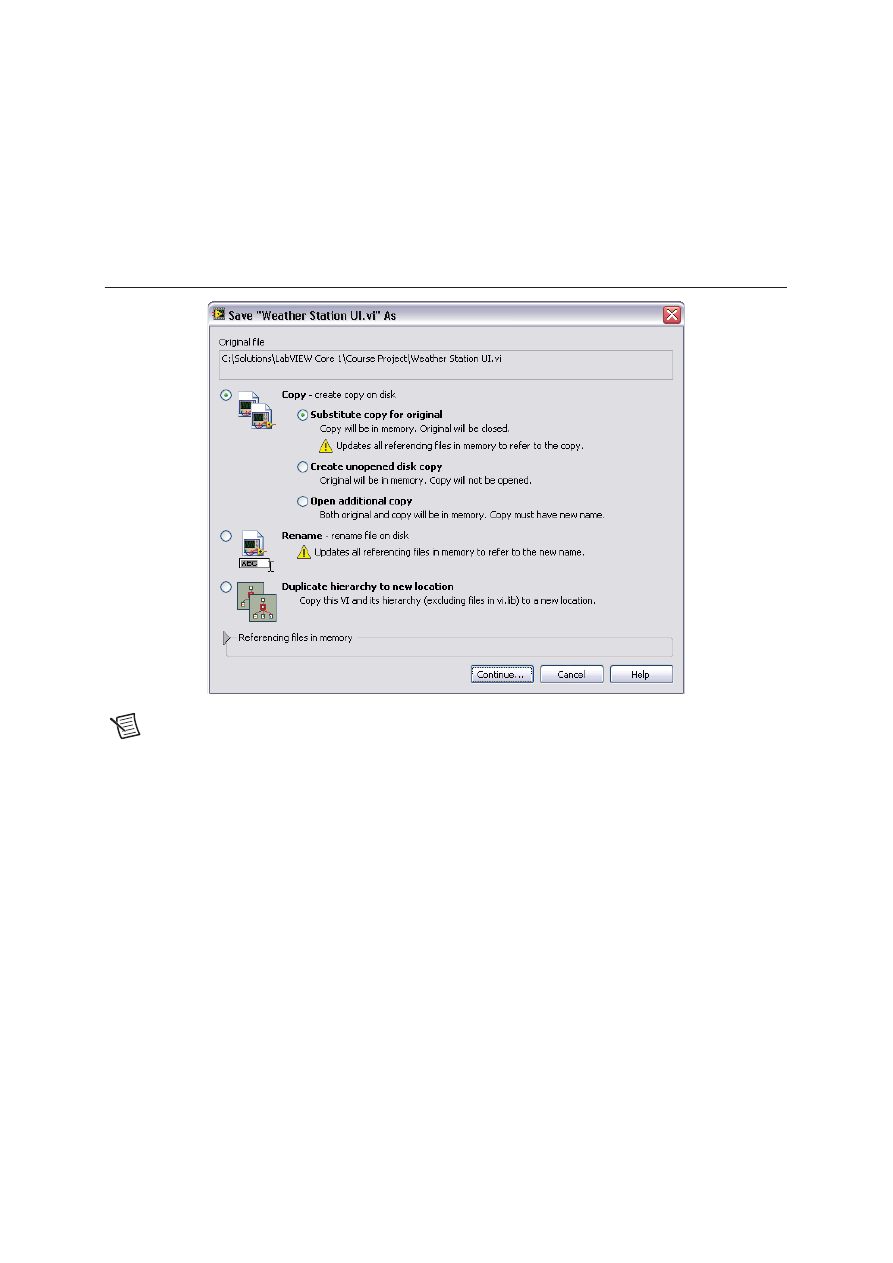
Saving a VI
To save a new VI, select File»Save. If you already saved your VI, select File»Save As to access
the Save As dialog box. From the Save As dialog box, you can create a copy of the VI, or delete
the original VI and replace it with the new one.
Figure 1-6. Save As Dialog Box
Note
Refer to the Save As Dialog Box topic of the LabVIEW Help for detailed
information about each option in the Save As dialog box.
Lesson 1
Navigating LabVIEW
1-14
| ni.com
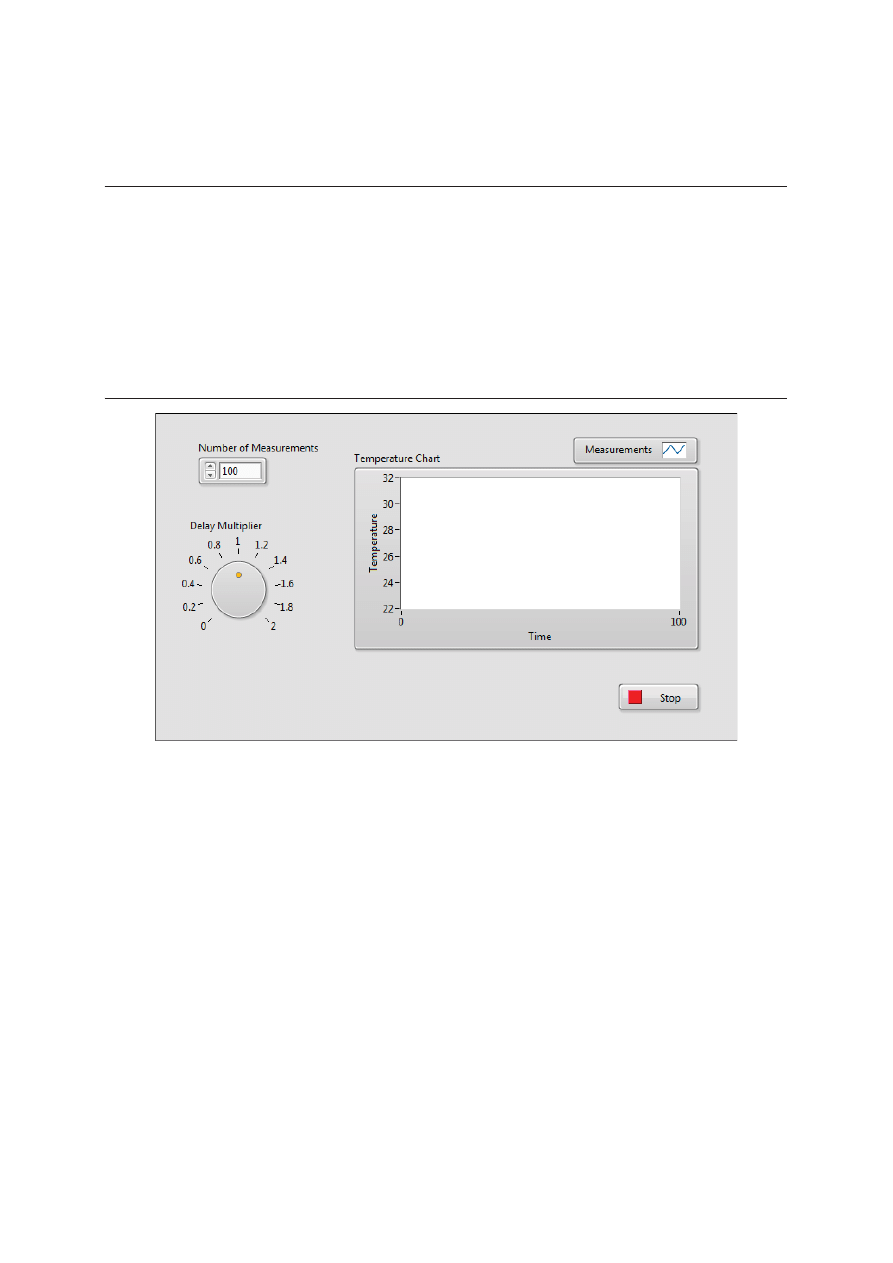
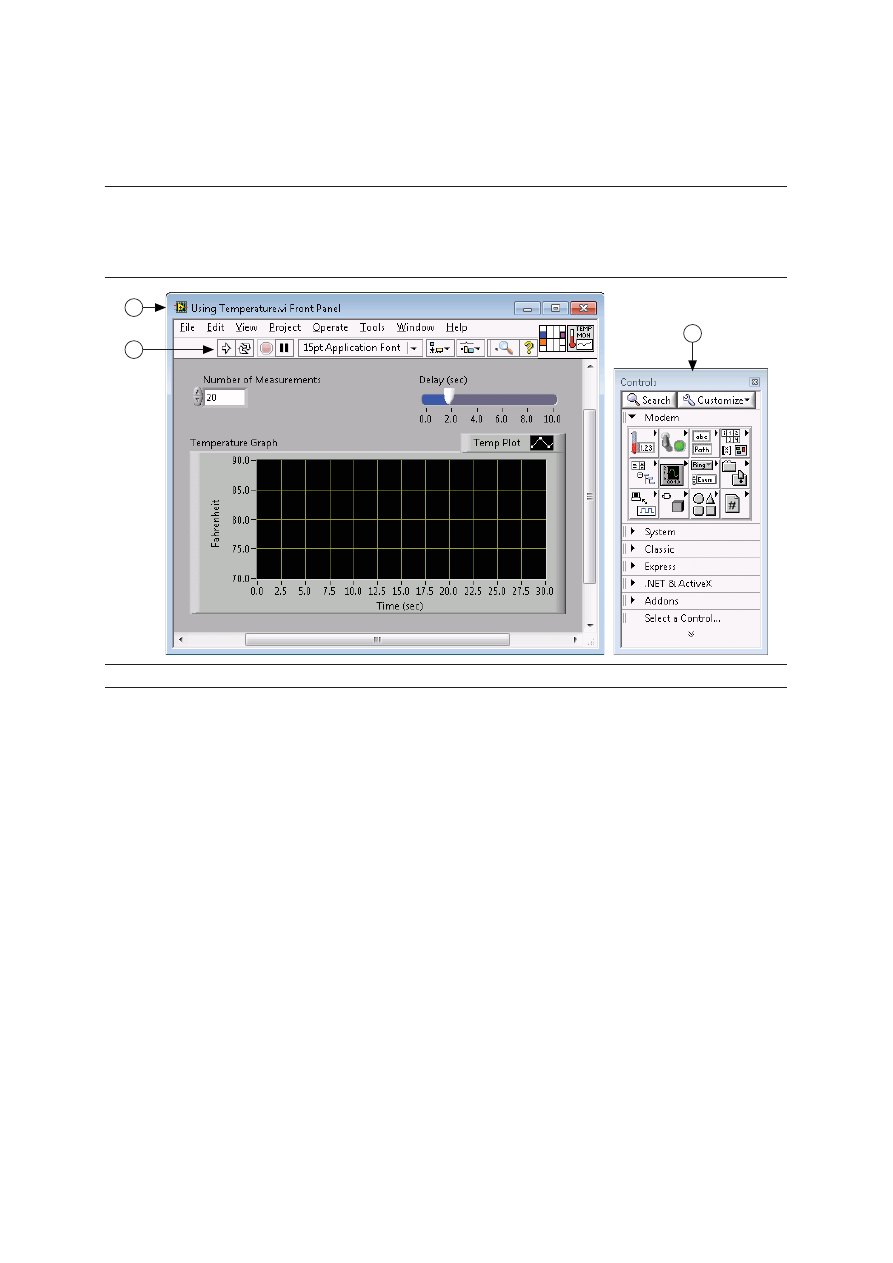
D. Front Panel
When you open a new or existing VI, the front panel window of the VI appears. The front panel
window is the user interface for the VI. Figure 1-7 shows an example of a front panel window.
Figure 1-7. Example of a Front Panel
Controls and Indicators
You create the front panel with controls and indicators, which are the interactive input and output
terminals of the VI, respectively. Controls are knobs, push buttons, dials, and other input devices.
Indicators are graphs, LEDs and other displays. Controls simulate instrument input devices and
supply data to the block diagram of the VI. Indicators simulate instrument output devices and
display data the block diagram acquires or generates.
Figure 1-7 has the following objects: two controls: Number of Measurements and Delay(sec). It
has one indicator: an XY graph named Temperature Graph.
The user can change the input value for the Number of Measurements and Delay(sec) controls.
The user can see the value generated by the VI on the Temperature Graph indicator. The VI
generates the values for the indicators based on the code created on the block diagram. You learn
about this in the Numeric Controls and Indicators section.
Every control or indicator has a data type associated with it. For example, the Delay(sec) horizontal
slide is a numeric data type. The most commonly used data types are numeric, Boolean value and
string. You learn about other data types in Lesson 3, Implementing a VI.
1
Front Panel Window
2
Toolbar
3
Controls Palette
3
1
2
LabVIEW Core 1 Course Manual
© National Instruments
| 1-15
Numeric Controls and Indicators
The numeric data type can represent numbers of various types, such as integer or real. The
two common numeric objects are the numeric control and the numeric indicator, as shown in
Figure 1-8. Objects such as meters and dials also represent numeric data.
Figure 1-8. Numeric Controls and Indicators
To enter or change values in a numeric control, click the increment and decrement buttons with the
Operating tool or double-click the number with either the Labeling tool or the Operating tool, enter
a new number, and press the <Enter> key.
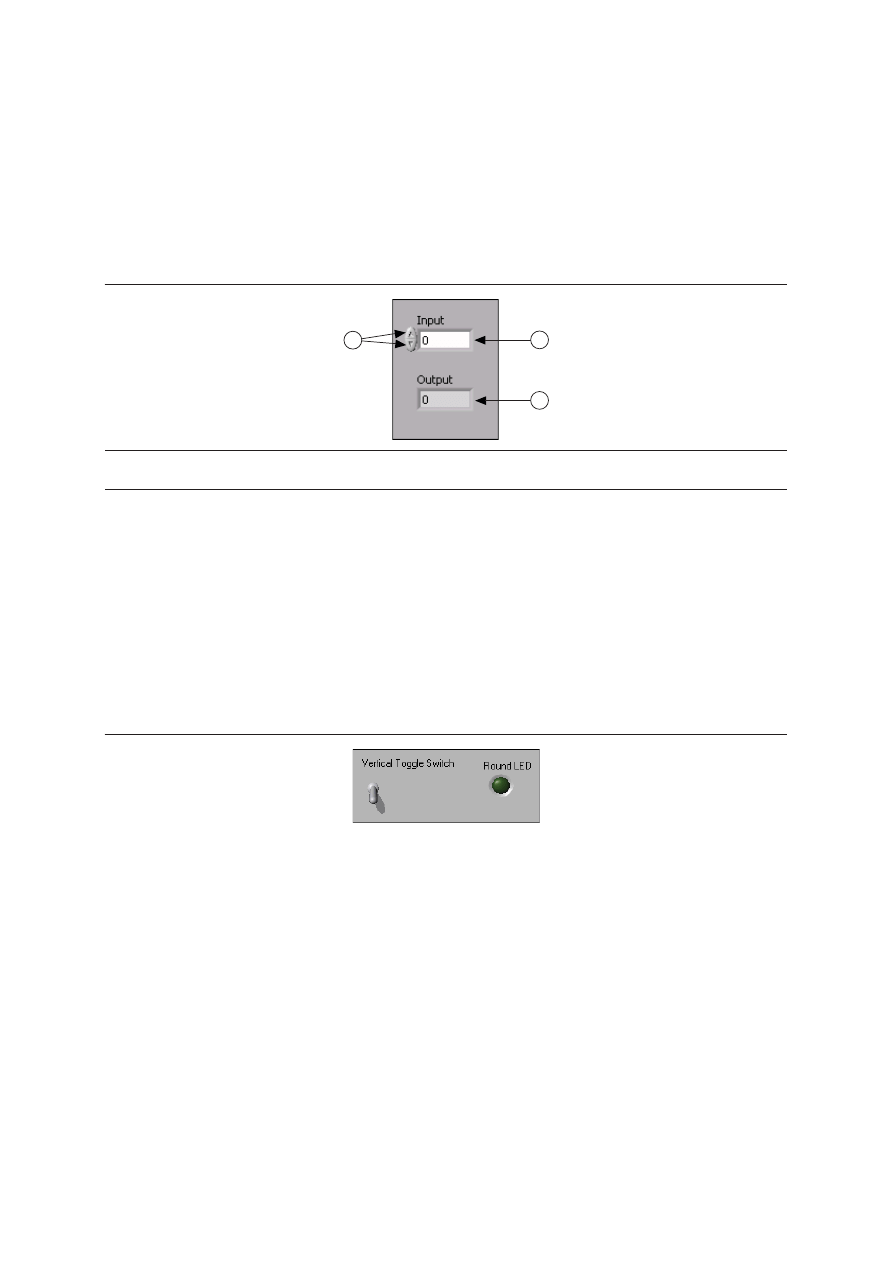
Boolean Controls and Indicators
The Boolean data type represents data that only has two possible states, such as TRUE and FALSE
or ON and OFF. Use Boolean controls and indicators to enter and display Boolean values. Boolean
objects simulate switches, push buttons, and LEDs. The vertical toggle switch and the round LED
Boolean objects are shown in Figure 1-9.
Figure 1-9. Boolean Controls and Indicators
1
Increment/Decrement Buttons
2
Numeric Control
3
Numeric Indicator
2
1
3
Lesson 1
Navigating LabVIEW
1-16
| ni.com
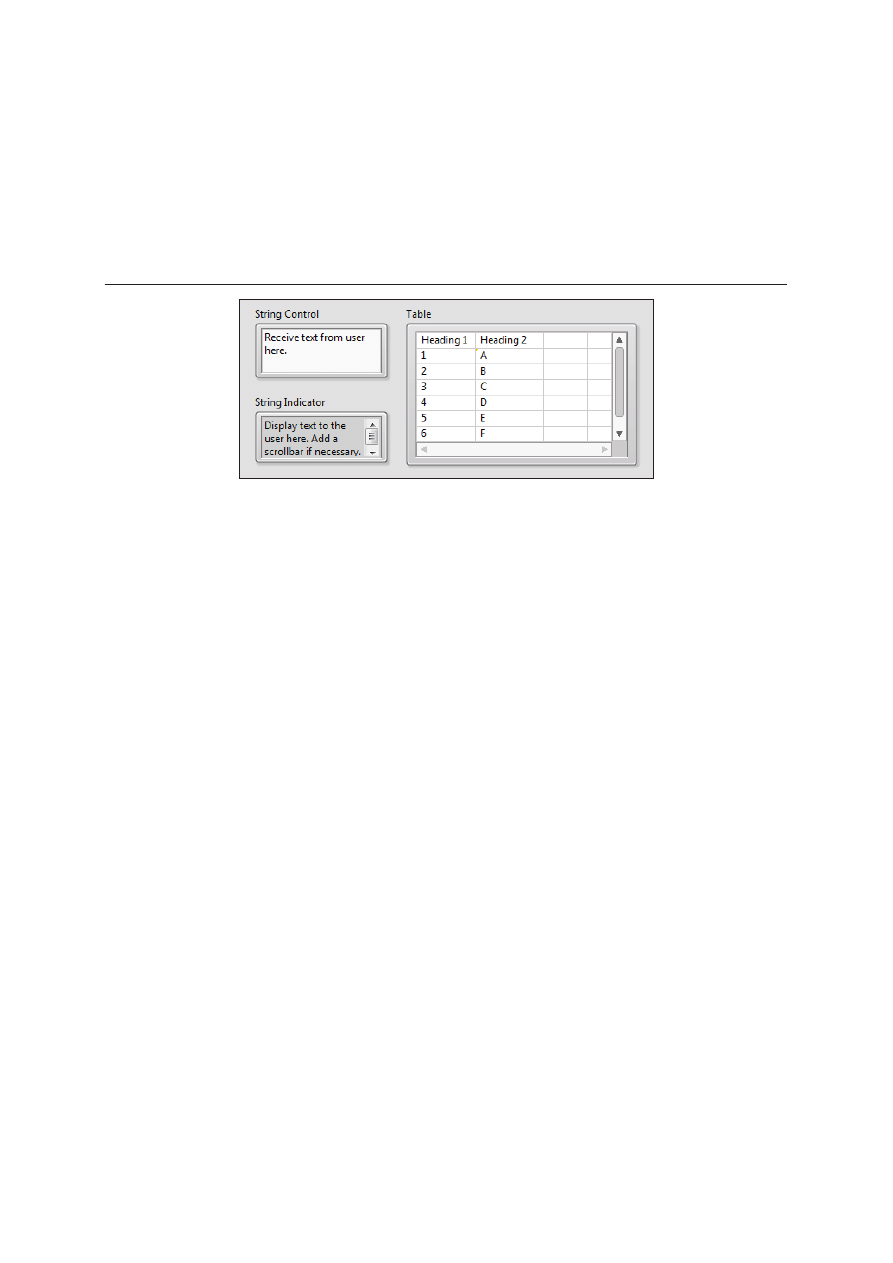
String Controls and Indicators
The string data type is a sequence of ASCII characters. Use string controls to receive text from the
user such as a password or user name. Use string indicators to display text to the user. The most
common string objects are tables and text entry boxes as shown in Figure 1-10.
Figure 1-10. String Controls and Indicators
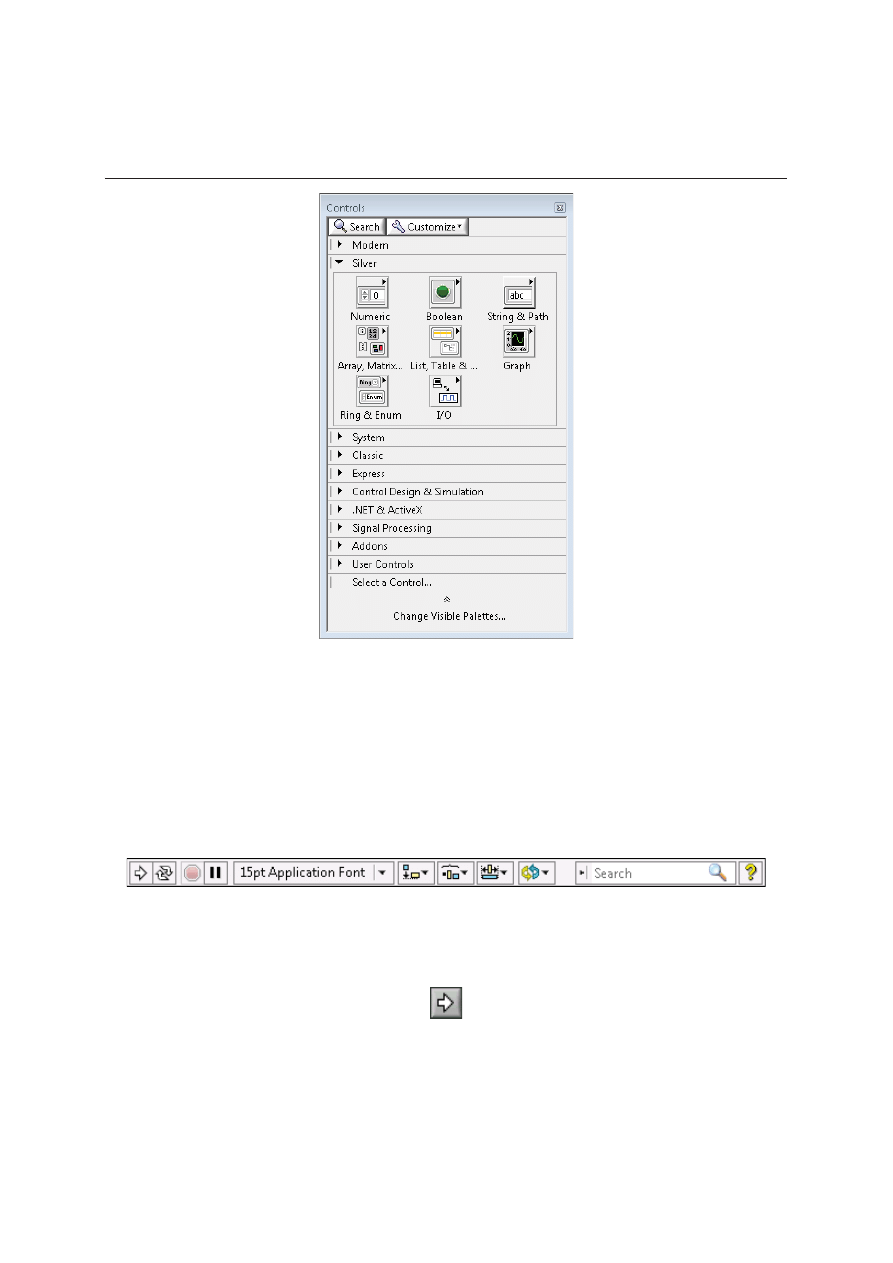
Controls Palette
The Controls palette contains the controls and indicators you use to create the front panel. You
access the Controls palette from the front panel window by selecting View»Controls Palette. The
Controls palette is broken into various categories; you can expose some or all of these categories
to suit your needs. Figure 1-11 shows a Controls palette with all of the categories exposed and the
Silver category expanded. During this course, most exercises use controls from the Silver
category.
LabVIEW Core 1 Course Manual
© National Instruments
| 1-17
Figure 1-11. Controls Palette
To view or hide categories (subpalettes), select the Customize button on the palette, and select or
deselect in the Change Visible Palettes option.
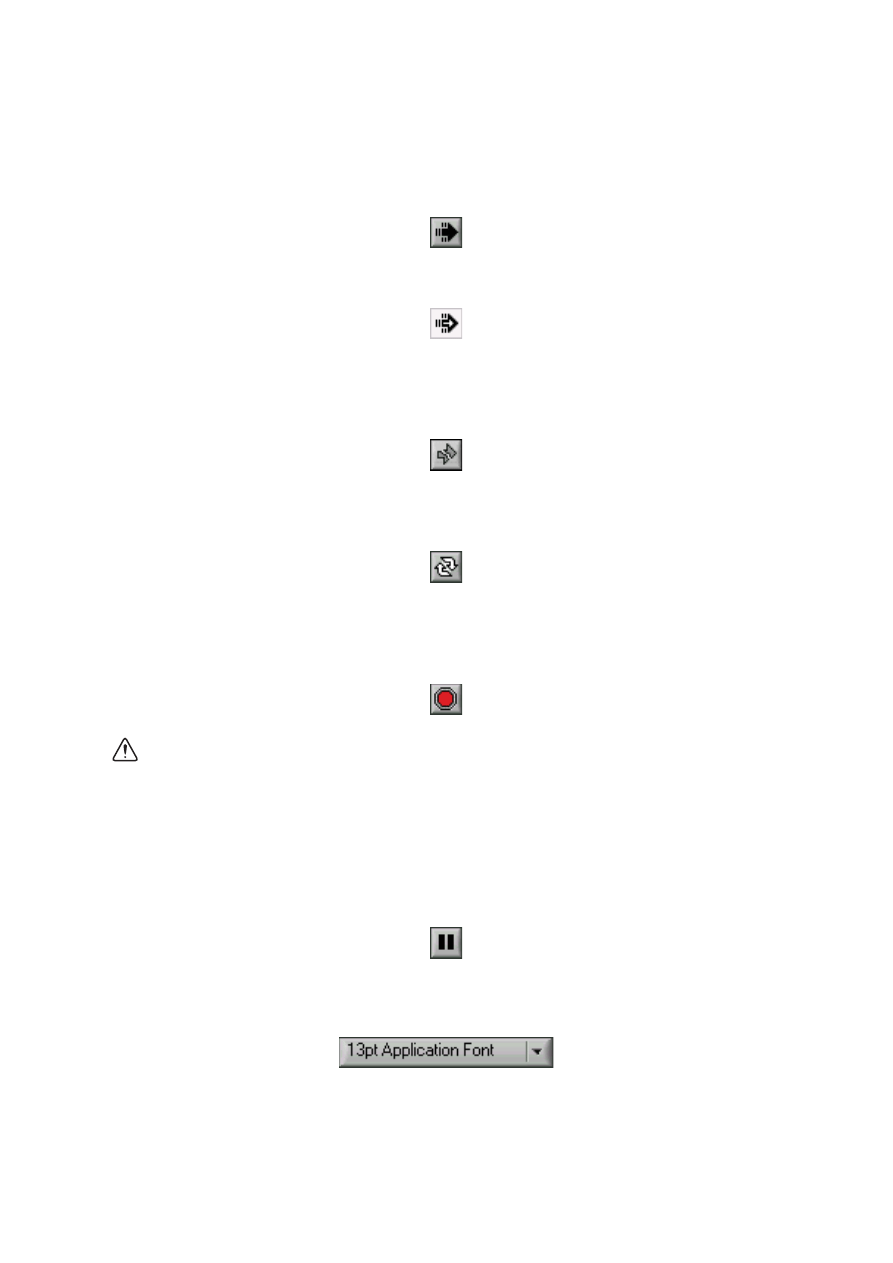
Front Panel Window Toolbar
Each window has a toolbar associated with it. Use the front panel window toolbar buttons to run
and edit the VI.
The following toolbar appears on the front panel window.
Click the Run button to run a VI. LabVIEW compiles the VI, if necessary. You can run a VI if the
Run button appears as a solid white arrow, shown below. The solid white arrow also indicates you
can use the VI as a subVI if you create a connector pane for the VI.
Lesson 1
Navigating LabVIEW
1-18
| ni.com
While the VI runs, the Run button appears as shown below if the VI is a top-level VI, meaning it
has no callers and therefore is not a subVI.
If the VI that is running is a subVI, the Run button appears as shown below.
The Run button appears broken when the VI you are creating or editing contains errors. If the Run
button still appears broken after you finish wiring the block diagram, the VI is broken and cannot
run. Click this button to display the Error list window, which lists all errors and warnings.
Click the Run Continuously button to run the VI until you abort or pause execution. You also can
click the button again to disable continuous running.
While the VI runs, the Abort Execution button appears. Click this button to stop the VI
immediately if there is no other way to stop the VI. If more than one running top-level VI uses the
VI, the button is dimmed.
Caution
The Abort Execution button stops the VI immediately, before the VI finishes
the current iteration. Aborting a VI that uses external resources, such as external
hardware, might leave the resources in an unknown state by not resetting or releasing
them properly. Design VIs with a stop button to avoid this problem.
Click the Pause button to pause a running VI. When you click the Pause button, LabVIEW
highlights on the block diagram the location where you paused execution, and the Pause button
appears red. Click the Pause button again to continue running the VI.
Select the Text Settings pull-down menu to change the font settings for the selected portions of
the VI, including size, style, and color.
LabVIEW Core 1 Course Manual
© National Instruments
| 1-19
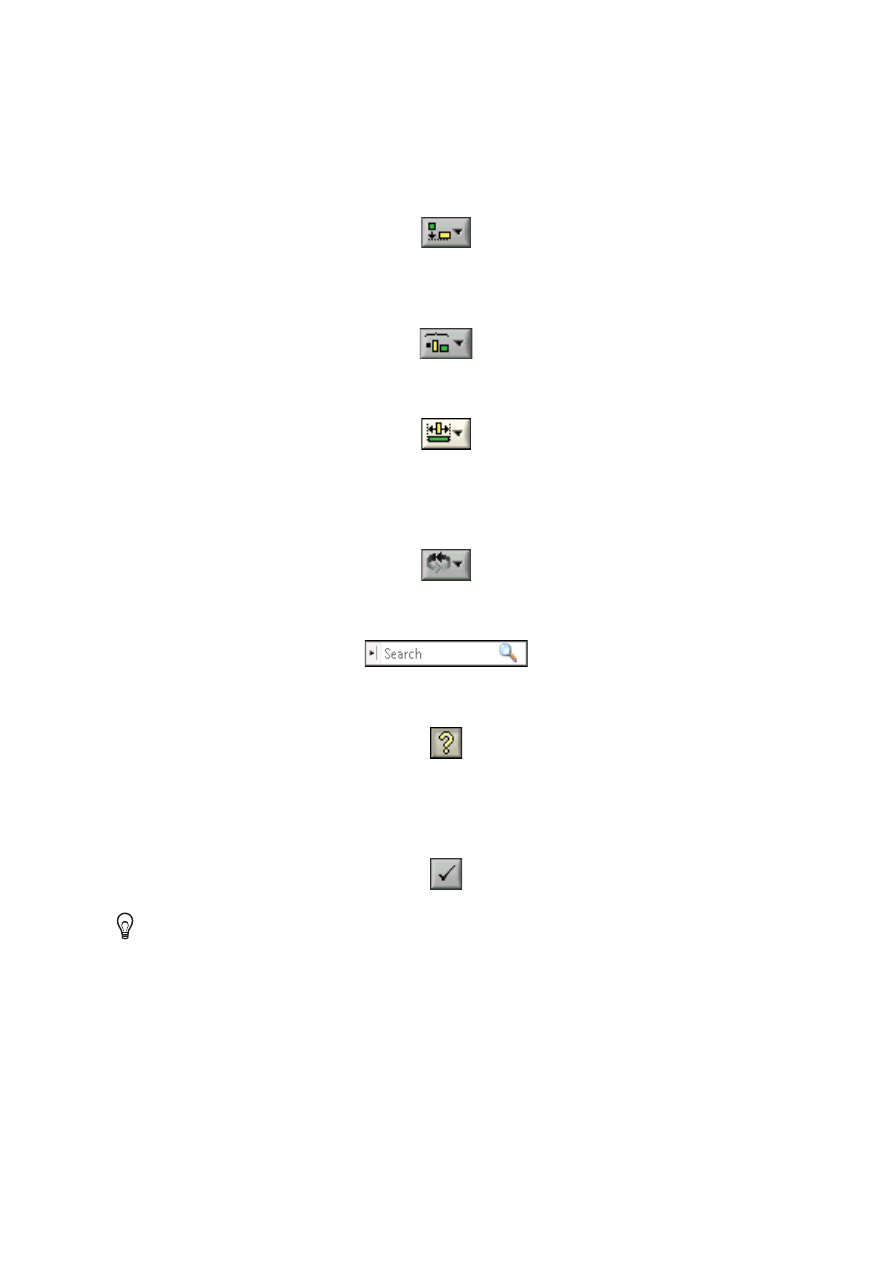
Select the Align Objects pull-down menu to align objects along axes, including vertical, top edge,
left, and so on.
Select the Distribute Objects pull-down menu to space objects evenly, including gaps,
compression, and so on.
Select the Resize Objects pull-down menu to resize multiple front panel objects to the same size.
Select the Reorder pull-down menu when you have objects that overlap each other and you want
to define which one is in front or back of another. Select one of the objects with the Positioning
tool and then select from Move Forward, Move Backward, Move To Front, and Move To Back.
Enter search terms to locate content in the LabVIEW Help.
Select the Show Context Help Window button to toggle the display of the Context Help window.
Enter Text appears to remind you that a new value is available to replace an old value. The Enter
Text button disappears when you click it, press the <Enter> key, or click the front panel or block
diagram workspace.
Tip
The <Enter> key on the numeric keypad ends a text entry, while the main <Enter>
key adds a new line. To modify this behavior, select Tools»Options, select the
Environment from the Category list, and place a checkmark in the End text entry with
Enter key option.
Lesson 1
Navigating LabVIEW
1-20
| ni.com
E. Block Diagram
Block diagram objects include terminals, subVIs, functions, constants, structures, and wires, which
transfer data among other block diagram objects.
Figure 1-12. Example of a Block Diagram and Corresponding Front Panel
Terminals
Objects on the front panel window appear as terminals on the block diagram. Terminals are entry
and exit ports that exchange information between the front panel and block diagram. Terminals are
analogous to parameters and constants in text-based programming languages. Types of terminals
include control or indicator terminals and node terminals. Control and indicator terminals belong
to front panel controls and indicators. Data you enter into the front panel controls (a and b in the
previous front panel) enter the block diagram through the control terminals. The data then enter the
Add and Subtract functions. When the Add and Subtract functions complete their calculations, they
produce new data values. The data values flow to the indicator terminals, where they update the
front panel indicators (a+b and a–b in the previous front panel).
The terminals in Figure 1-12 belong to four front panel controls and indicators. Because terminals
represent the inputs and outputs of your VI, subVIs and functions also have terminals shown below.
For example, the connector panes of the Add and Subtract functions have three node terminals. To
display the terminals of the function on the block diagram, right-click the function node and select
Visible Items»Terminals from the shortcut menu.
1
Indicator Terminals
2
Wires
3
Nodes
4
Control Terminals
1
2
3
4
LabVIEW Core 1 Course Manual
© National Instruments
| 1-21
Controls, Indicators, and Constants
Controls, indicators, and constants behave as inputs and outputs of the block diagram algorithm.
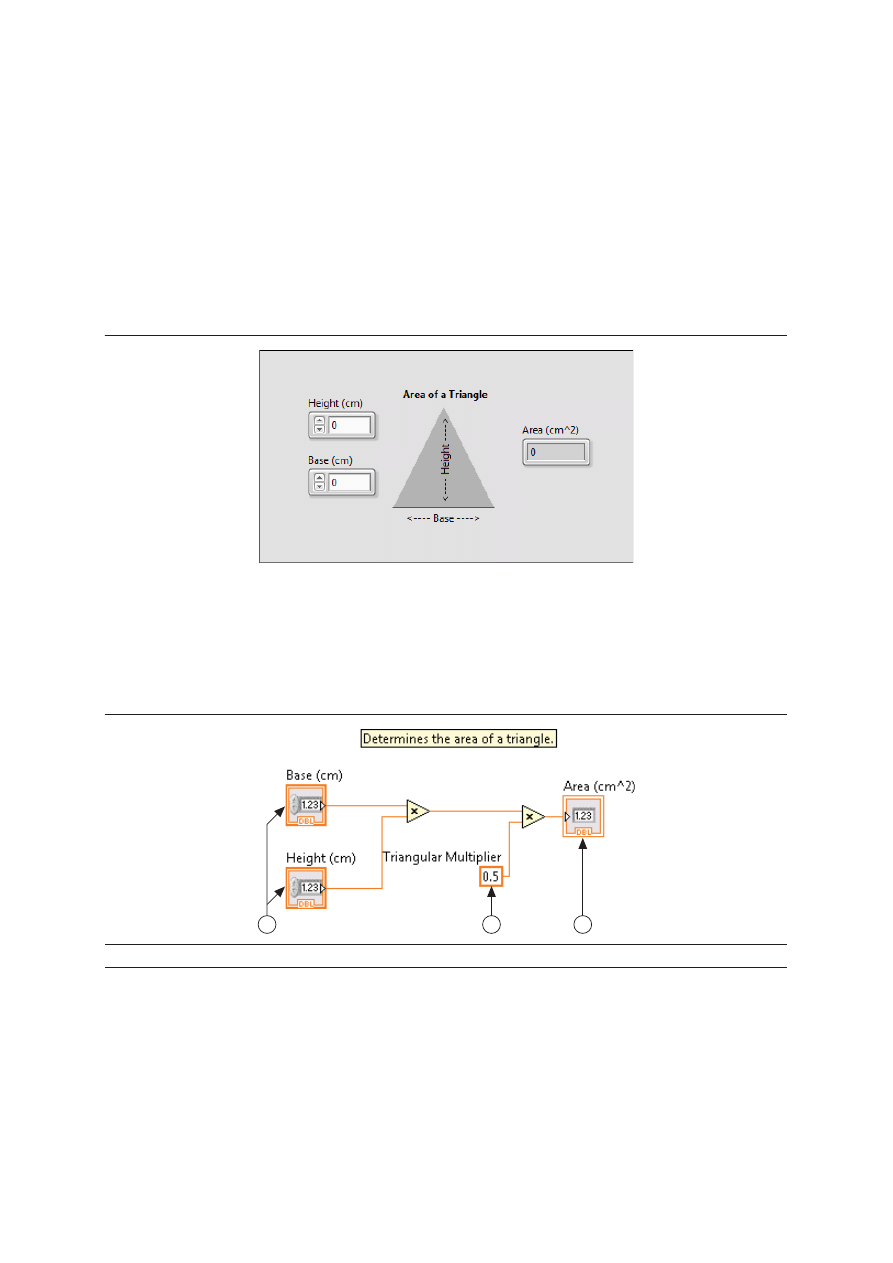
Consider the implementation of the algorithm for the area of a triangle:
Area = .5 * Base * Height
In this algorithm, Base and Height are inputs and Area is an output, as shown in Figure 1-13.
Figure 1-13. Area of a Triangle Front Panel
The user never changes or accesses the constant .5, so it does not appear on the front panel unless
included as documentation of the algorithm.
Figure 1-14 shows a possible implementation of this algorithm on a LabVIEW block diagram. This
block diagram has four different terminals created by two controls, one constant, and one indicator.
Figure 1-14. Area of a Triangle Block Diagram with Icon Terminal View
Notice that the Base (cm) and Height (cm) block diagram terminals have a different appearance
from the Area (cm
2
) terminal. There are two distinguishing characteristics between a control and
an indicator on the block diagram. The first is an arrow on the terminal that indicates the direction
of data flow. The controls have arrows showing the data leaving the terminal, whereas the indicator
has an arrow showing the data entering the terminal. The second distinguishing characteristic is the
border around the terminal. Controls have a thick border and indicators have a thin border.
1
Controls
2
Indicator
3
Constant
3
2
1
Lesson 1
Navigating LabVIEW
1-22
| ni.com
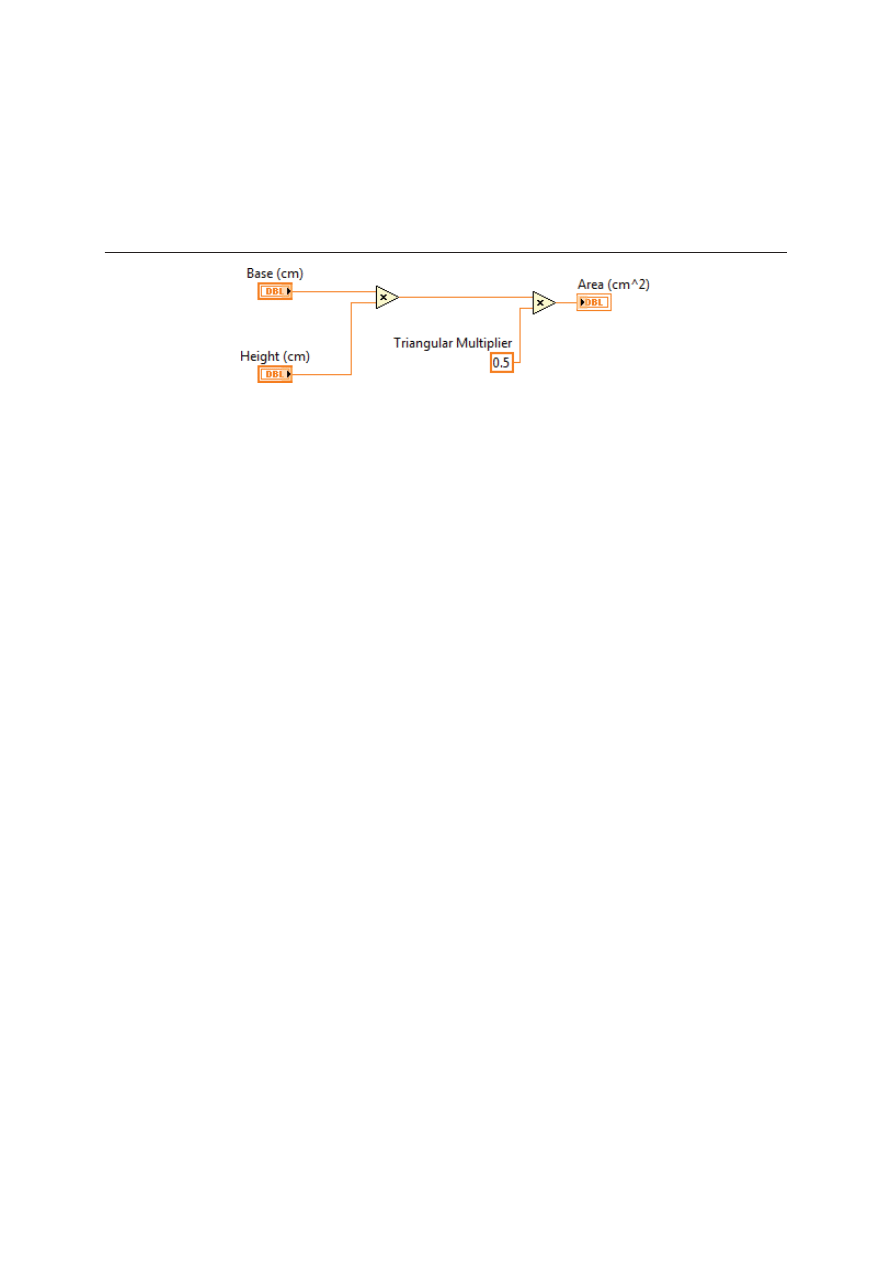
You can view terminals with or without icon view. Figure 1-15 shows the same block diagram
without using the icon view of the terminals; however, the same distinguishing characteristics
between controls and indicators exist.
Figure 1-15. Area of a Triangle Block Diagram without Icon Terminal View
Block Diagram Nodes
Nodes are objects on the block diagram that have inputs and/or outputs and perform operations
when a VI runs. They are analogous to statements, operators, functions, and subroutines in
text-based programming languages. Nodes can be functions, subVIs, or structures. Structures are
process control elements, such as Case structures, For Loops, or While Loops. The Add and
Subtract functions in the Figure 1-12 are function nodes.
Functions
Functions are the fundamental operating elements of LabVIEW. Functions do not have front panel
windows or block diagram windows but do have connector panes. Double-clicking a function only
selects the function. A function has a pale yellow background on its icon.
SubVIs
SubVIs are VIs that you create to use inside of another VI or that you access on the Functions
palette.
Any VI has the potential to be used as a subVI. When you double-click a subVI on the block
diagram, its front panel window appears. The front panel includes controls and indicators. The
block diagram includes wires, icons, functions, possibly subVIs, and other LabVIEW objects. The
upper right corner of the front panel window and block diagram window displays the icon for the
VI. This is the icon that appears when you place the VI on a block diagram as a subVI.
SubVIs can also be Express VIs. Express VIs are nodes that require minimal wiring because you
configure them with dialog boxes. Use Express VIs for common measurement tasks. You can save
the configuration of an Express VI as a subVI. Refer to the Express VIs topic of the LabVIEW Help
for more information about creating a subVI from an Express VI configuration.
LabVIEW uses colored icons to distinguish between Express VIs and other VIs on the block
diagram. Icons for Express VIs appear on the block diagram as icons surrounded by a blue field
whereas subVI icons have a yellow field.
LabVIEW Core 1 Course Manual
© National Instruments
| 1-23
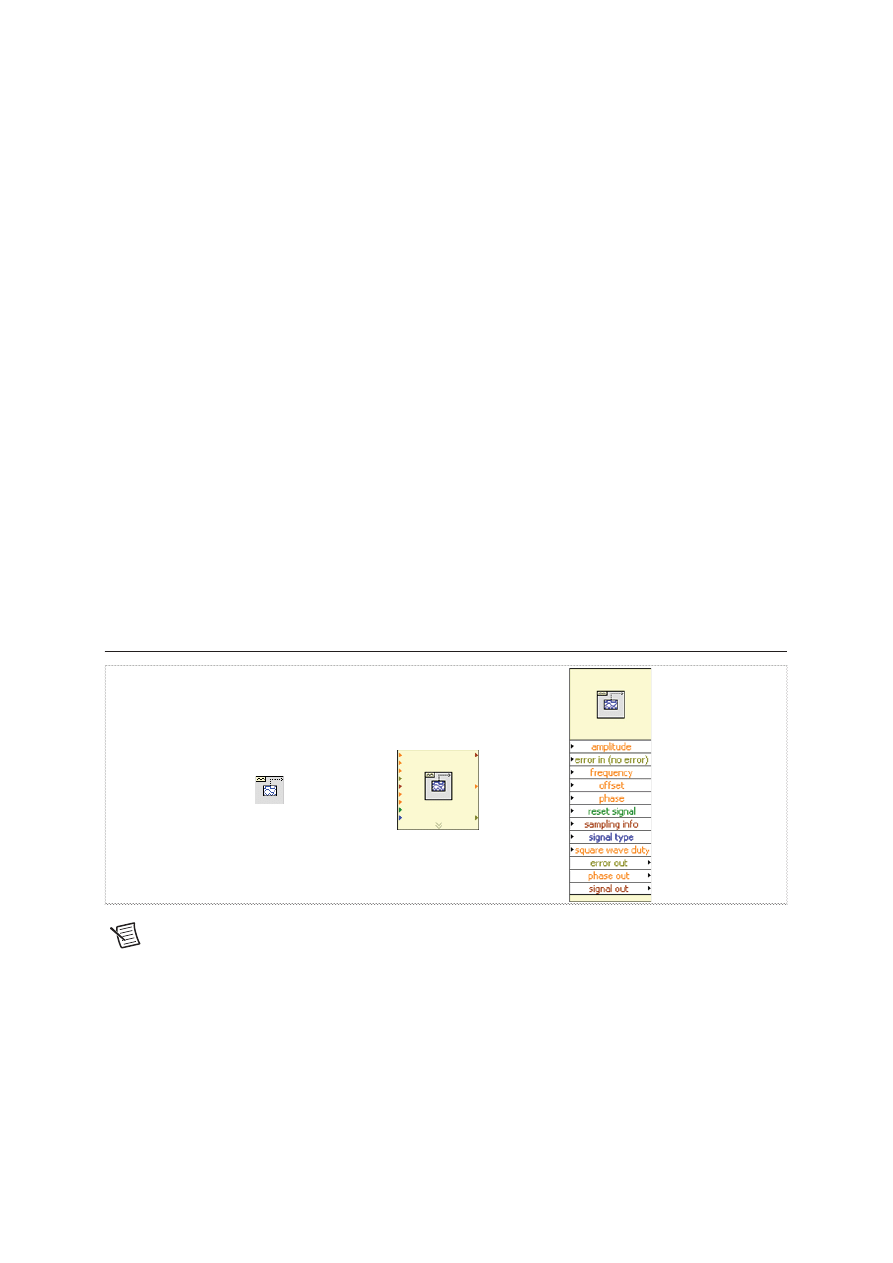
Expandable Nodes versus Icons
You can display VIs and Express VIs as icons or as expandable nodes. Expandable nodes appear
as icons surrounded by a colored field. SubVIs appear with a yellow field, and Express VIs appear
with a blue field. Use icons if you want to conserve space on the block diagram. Use expandable
nodes to make wiring easier and to aid in documenting block diagrams. By default, subVIs appear
as icons on the block diagram, and Express VIs appear as expandable nodes. To display a subVI or
Express VI as an expandable node, right-click the subVI or Express VI and remove the checkmark
next to the View As Icon shortcut menu item.
You can resize the expandable node to make wiring even easier, but it also takes a large amount of
space on the block diagram. Complete the following steps to resize a node on the block diagram:
1. Move the Positioning tool over the node. Resizing handles appear at the top and bottom of the
node.
2. Move the cursor over a resizing handle to change the cursor to the resizing cursor.
3. Use the resizing cursor to drag the border of the node down to display additional terminals.
4. Release the mouse button.
To cancel a resizing operation, drag the node border past the block diagram window before you
release the mouse button.
Figure 1-16 shows the Basic Function Generator VI as a resized expandable node.
Figure 1-16. Basic Function Generator VI in Different Display Modes
Note
If you display a subVI or Express VI as an expandable node, you cannot display
the terminals for that node and you cannot enable database access for that node.
Lesson 1
Navigating LabVIEW
1-24
| ni.com
Wires
You transfer data among block diagram objects through wires. In Figure 1-12, wires connect the
control and indicator terminals to the Add and Subtract function. Each wire has a single data
source, but you can wire it to many VIs and functions that read the data. Wires are different colors,
styles, and thicknesses, depending on their data types.
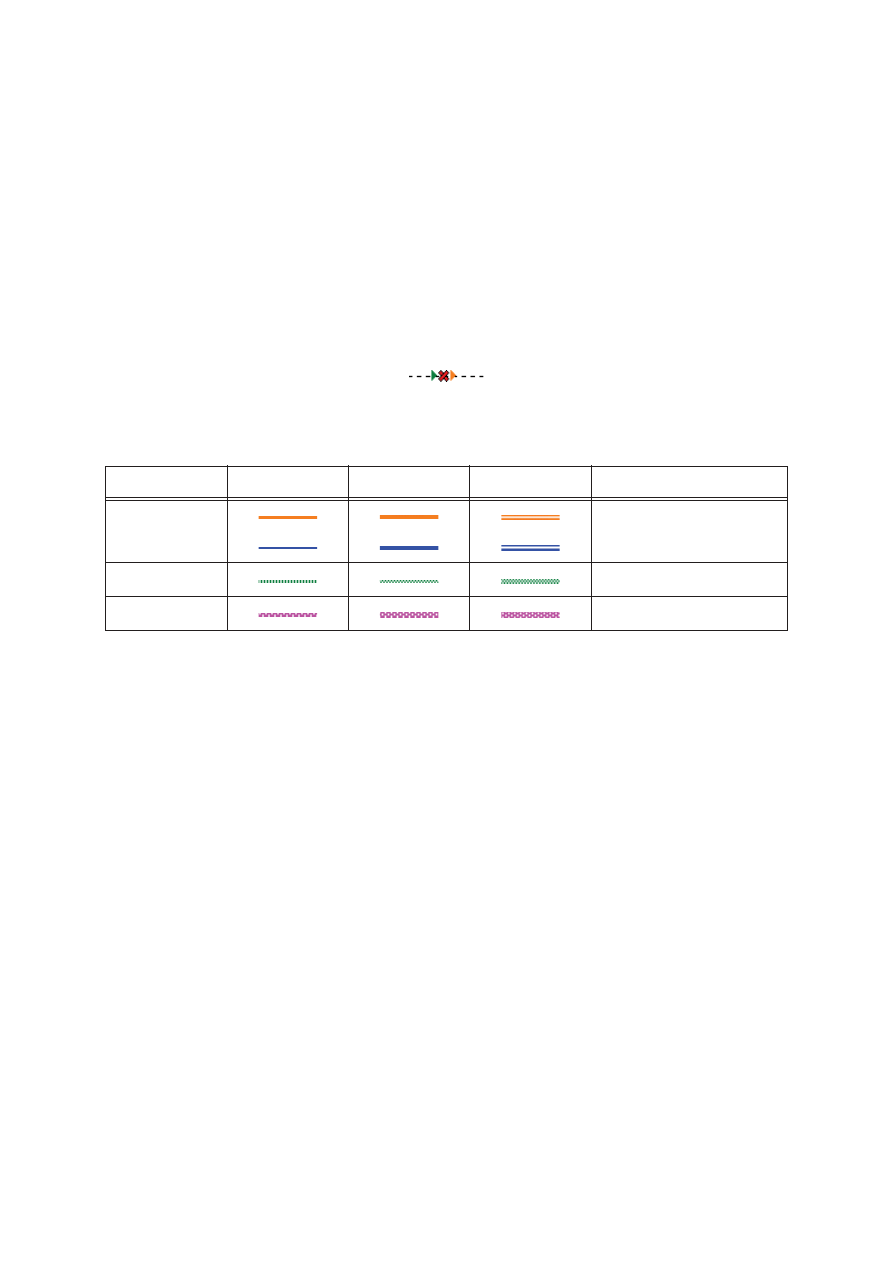
A broken wire appears as a dashed black line with a red X in the middle, as shown below. Broken
wires occur for a variety of reasons, such as when you try to wire two objects with incompatible
data types.
Table 1-1 shows the most common wire types.
In LabVIEW, you use wires to connect multiple terminals together to pass data in a VI. You must
connect the wires to inputs and outputs that are compatible with the data that is transferred with the
wire. For example, you cannot wire an array output to a numeric input. In addition the direction of
the wires must be correct. You must connect the wires to only one input and at least one output. For
example, you cannot wire two indicators together. The components that determine wiring
compatibility include the data type of the control and/or the indicator and the data type of the
terminal.
Data Types
Data types indicate what objects, inputs, and outputs you can wire together. For example, if a
switch has a green border, you can wire a switch to any input with a green label on an Express VI.
If a knob has an orange border, you can wire a knob to any input with an orange label. However,
you cannot wire an orange knob to an input with a green label. Notice the wires are the same color
as the terminal.
Table 1-1. Common Wire Types
Wire Type
Scalar
1D Array
2D Array
Color
Numeric
Orange (floating-point),
Blue (integer)
Boolean
Green
String
Pink

LabVIEW Core 1 Course Manual
© National Instruments
| 1-25
Automatically Wiring Objects
As you move a selected object close to other objects on the block diagram, LabVIEW draws
temporary wires to show you valid connections. When you release the mouse button to place the
object on the block diagram, LabVIEW automatically connects the wires. You also can
automatically wire objects already on the block diagram. LabVIEW connects the terminals that
best match and does not connect the terminals that do not match.
Toggle automatic wiring by pressing the spacebar while you move an object using the Positioning
tool.
By default, automatic wiring is enabled when you select an object from the Functions palette or
when you copy an object already on the block diagram by pressing the <Ctrl> key and dragging
the object. Automatic wiring is disabled by default when you use the Positioning tool to move an
object already on the block diagram.
You can adjust the automatic wiring settings by selecting Tools»Options and selecting Block
Diagram from the Category list.
Manually Wiring Objects
When you pass the Wiring tool over a terminal, a tip strip appears with the name of the terminal.
In addition, the terminal blinks in the Context Help window and on the icon to help you verify that
you are wiring to the correct terminal. To wire objects together, pass the Wiring tool over the first
terminal, click, pass the cursor over the second terminal, and click again. After wiring, you can
right-click the wire and select Clean Up Wire from the shortcut menu to have LabVIEW
automatically choose a path for the wire. If you have broken wires to remove, press <Ctrl-B> to
delete all the broken wires on the block diagram.
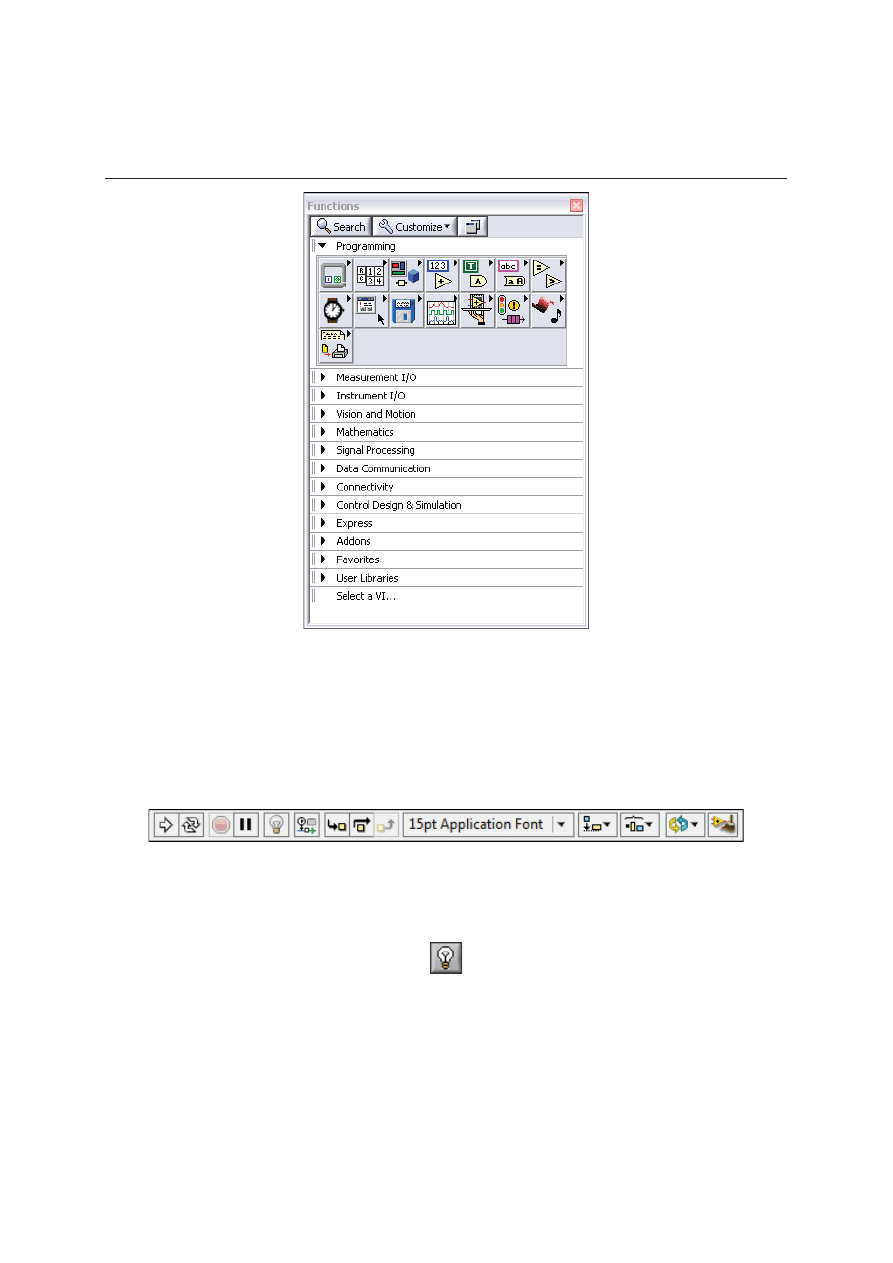
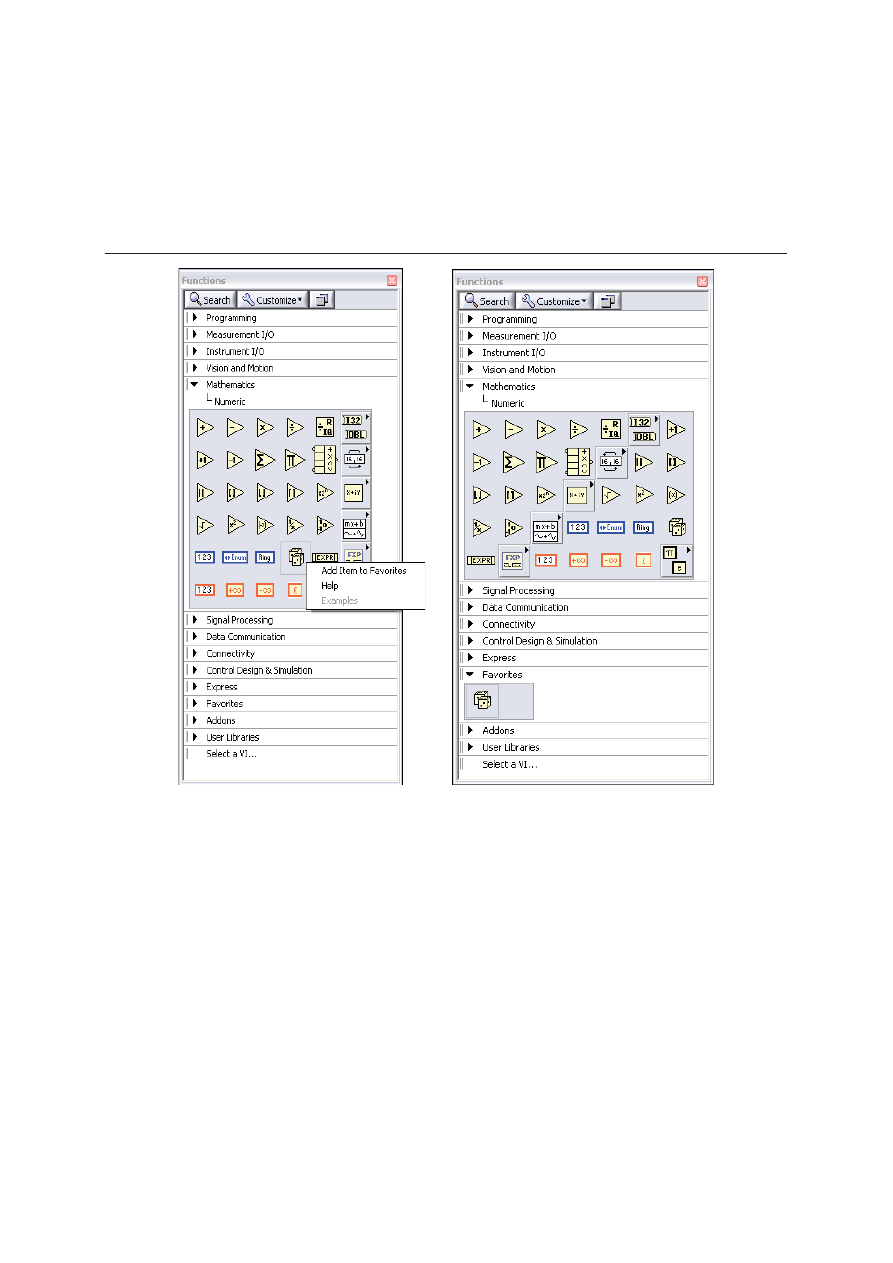
Functions Palette
The Functions palette contains the VIs, functions and constants you use to create the block
diagram. You access the Functions palette from the block diagram by selecting View»Functions
Palette. The Functions palette is broken into various categories; you can show and hide categories
to suit your needs. Figure 1-17 shows a Functions palette with all of the categories exposed and
the Programming category expanded. During this course, you work mostly in the Programming
category, but you also use other categories, or subpalettes.
Lesson 1
Navigating LabVIEW
1-26
| ni.com
Figure 1-17. Functions Palette
To view or hide categories, click the Customize button on the palette, and select or deselect the
Change Visible Palettes option.
Block Diagram Toolbar
When you run a VI, buttons appear on the block diagram toolbar that you can use to debug the VI.
The following toolbar appears on the block diagram.
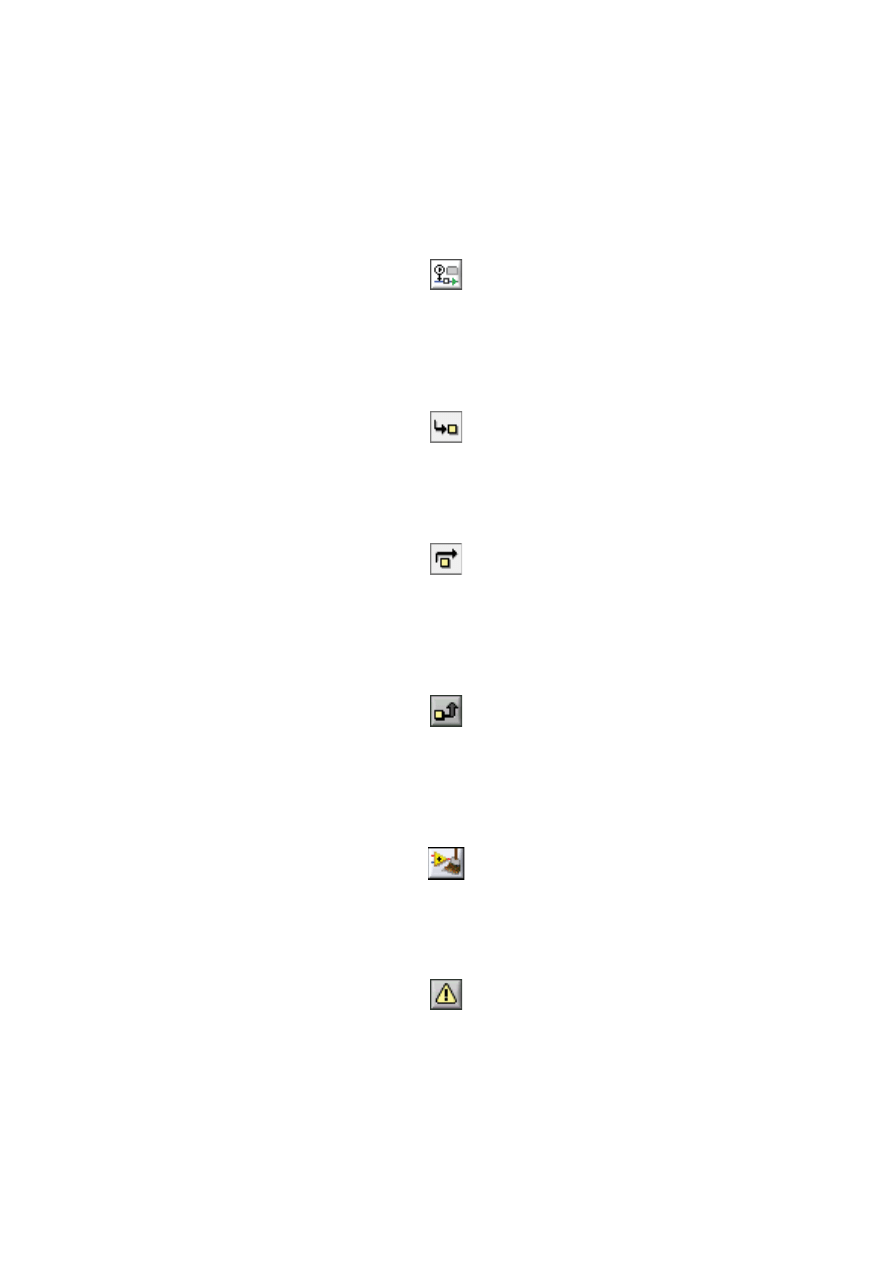
Click the Highlight Execution button to display an animation of the block diagram execution
when you run the VI. Notice the flow of data through the block diagram. Click the button again to
disable execution highlighting.
LabVIEW Core 1 Course Manual
© National Instruments
| 1-27
Click the Retain Wire Values button to save the wire values at each point in the flow of execution
so that when you place a probe on the wire you can immediately retain the most recent value of the
data that passed through the wire. You must successfully run the VI at least once before you can
retain the wire values.
Click the Step Into button to open a node and pause. When you click the Step Into button again,
it executes the first action and pauses at the next action of the subVI or structure. You also can press
the <Ctrl> and down arrow keys. Single-stepping through a VI steps through the VI node by node.
Each node blinks to denote when it is ready to execute.
Click the Step Over button to execute a node and pause at the next node. You also can press the
<Ctrl> and right arrow keys. By stepping over the node, you execute the node without
single-stepping through the node.
Click the Step Out button to finish executing the current node and pause. When the VI finishes
executing, the Step Out button is dimmed. You also can press the <Ctrl> and up arrow keys. By
stepping out of a node, you complete single-stepping through the node and navigate to the next
node.
Click the Clean Up Diagram button to automatically reroute all existing wires and rearrange
objects on the block diagram to generate a cleaner layout. To configure the clean up options, select
Tools»Options to display the Options dialog box and select Block Diagram from the Category
list. You can configure the settings in the Block Diagram Cleanup section.
The Warning button appears if a VI includes a warning and you placed a checkmark in the Show
Warnings checkbox in the Error List window. A warning indicates there is a potential problem
with the block diagram, but it does not stop the VI from running.
Lesson 1
Navigating LabVIEW
1-28
| ni.com
LabVIEW Help Utilities
Use the Context Help window, the LabVIEW Help, and the NI Example Finder to help you create
and edit VIs. Refer to the LabVIEW Help and manuals for more information about LabVIEW.
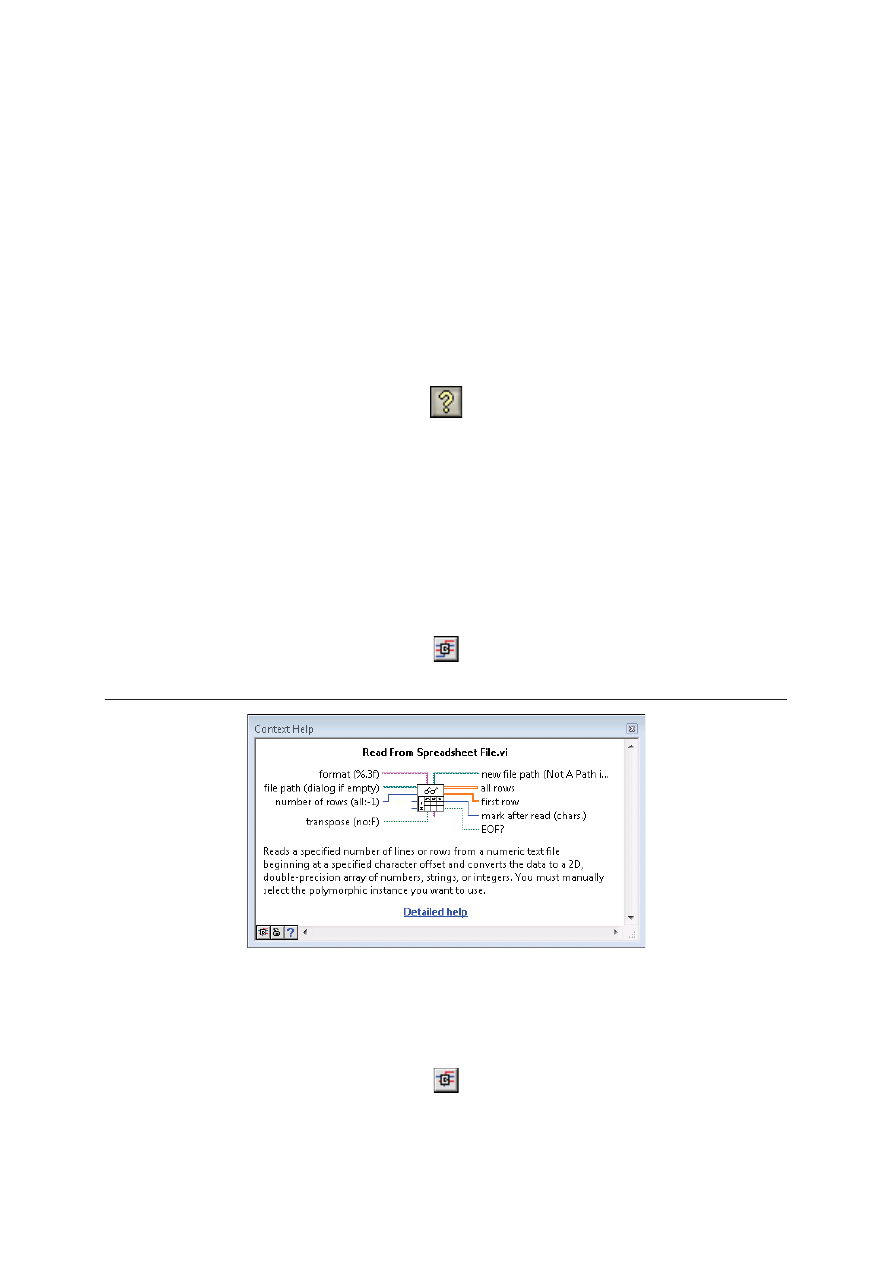
Context Help Window
The Context Help window displays basic information about LabVIEW objects when you move
the cursor over each object. To toggle display of the Context Help window select Help»Show
Context Help, press the <Ctrl-H> keys, or click the Show Context Help Window button on the
toolbar.
When you move the cursor over front panel and block diagram objects, the Context Help window
displays the icon for subVIs, functions, constants, controls, and indicators, with wires attached to
each terminal. When you move the cursor over dialog box options, the Context Help window
displays descriptions of those options.
In the Context Help window, the labels of required terminals appear bold, recommended terminals
appear as plain text, and optional terminals appear dimmed. The labels of optional terminals do not
appear if you click the Hide Optional Terminals and Full Path button in the Context Help
window.
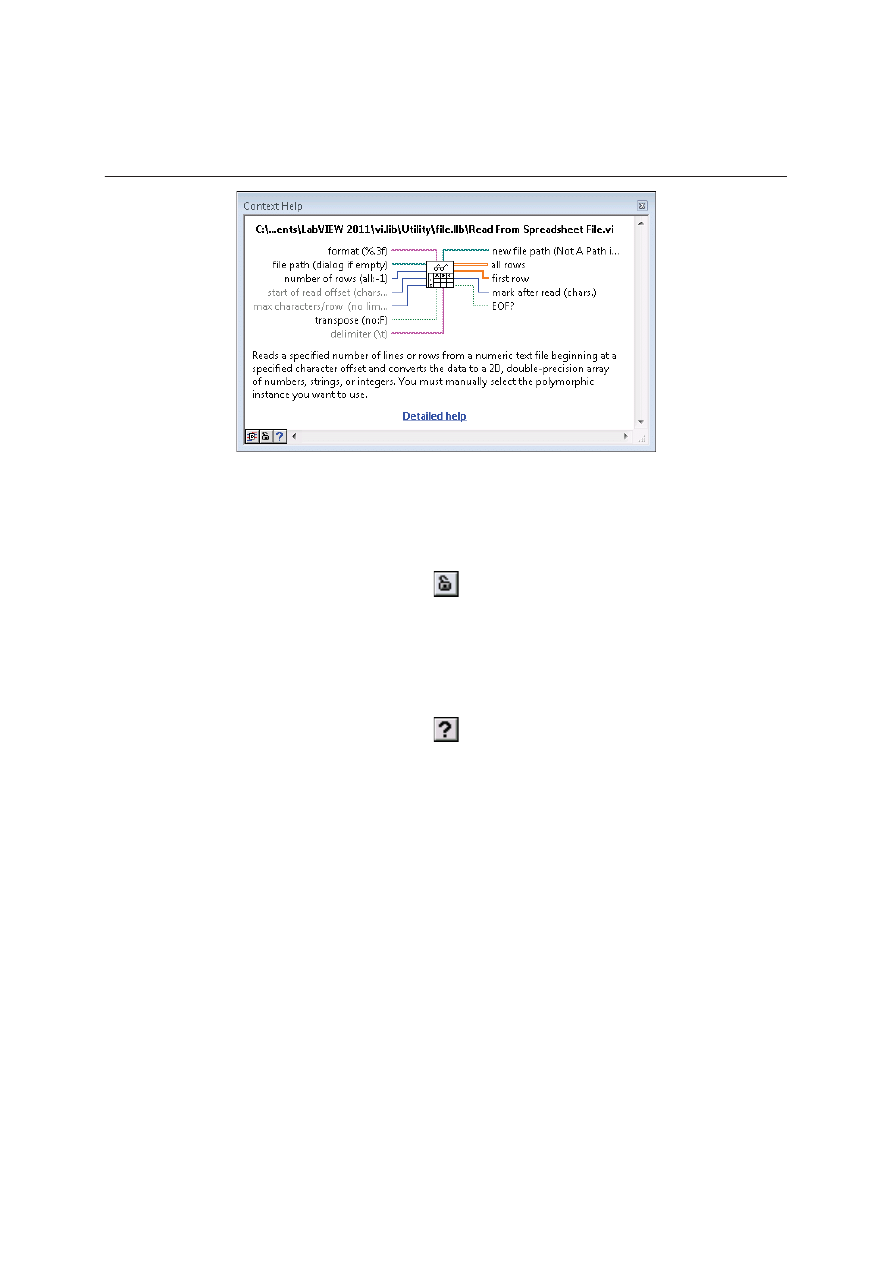
Figure 1-18. Context Help Window
Click the Show Optional Terminals and Full Path button located on the lower left corner of the
Context Help window to display the optional terminals of a connector pane and to display the full
path to a VI. Optional terminals are shown by wire stubs, informing you that other connections
exist. The detailed mode displays all terminals, as shown in Figure 1-19.
LabVIEW Core 1 Course Manual
© National Instruments
| 1-29
Figure 1-19. Detailed Context Help Window
Click the Lock Context Help button to lock the current contents of the Context Help window.
When the contents are locked, moving the cursor over another object does not change the contents
of the window. To unlock the window, click the button again. You also can access this option from
the Help menu.
If a corresponding LabVIEW Help topic exists for an object the Context Help window describes,
a blue Detailed help link appears in the Context Help window. Also, the More Help button is
enabled. Click the link or the button to display the LabVIEW Help for more information about the
object.
LabVIEW Help
You can access the LabVIEW Help by clicking the More Help button in the Context Help window,
selecting Help»LabVIEW Help, or clicking the blue Detailed Help link in the Context Help
window. You also can right-click an object and select Help from the shortcut menu.
The LabVIEW Help contains detailed descriptions of most palettes, menus, tools, VIs, and
functions. The LabVIEW Help also includes step-by-step instructions for using LabVIEW features.
The LabVIEW Help includes links to the following resources:
•
LabVIEW Documentation Resources, which describes online and print documents to help new
and experienced users and includes PDF versions of all LabVIEW manuals.
•
Technical support resources on the National Instruments Web site, such as the NI Developer
Zone, the KnowledgeBase, and the Product Manuals Library.
Lesson 1
Navigating LabVIEW
1-30
| ni.com
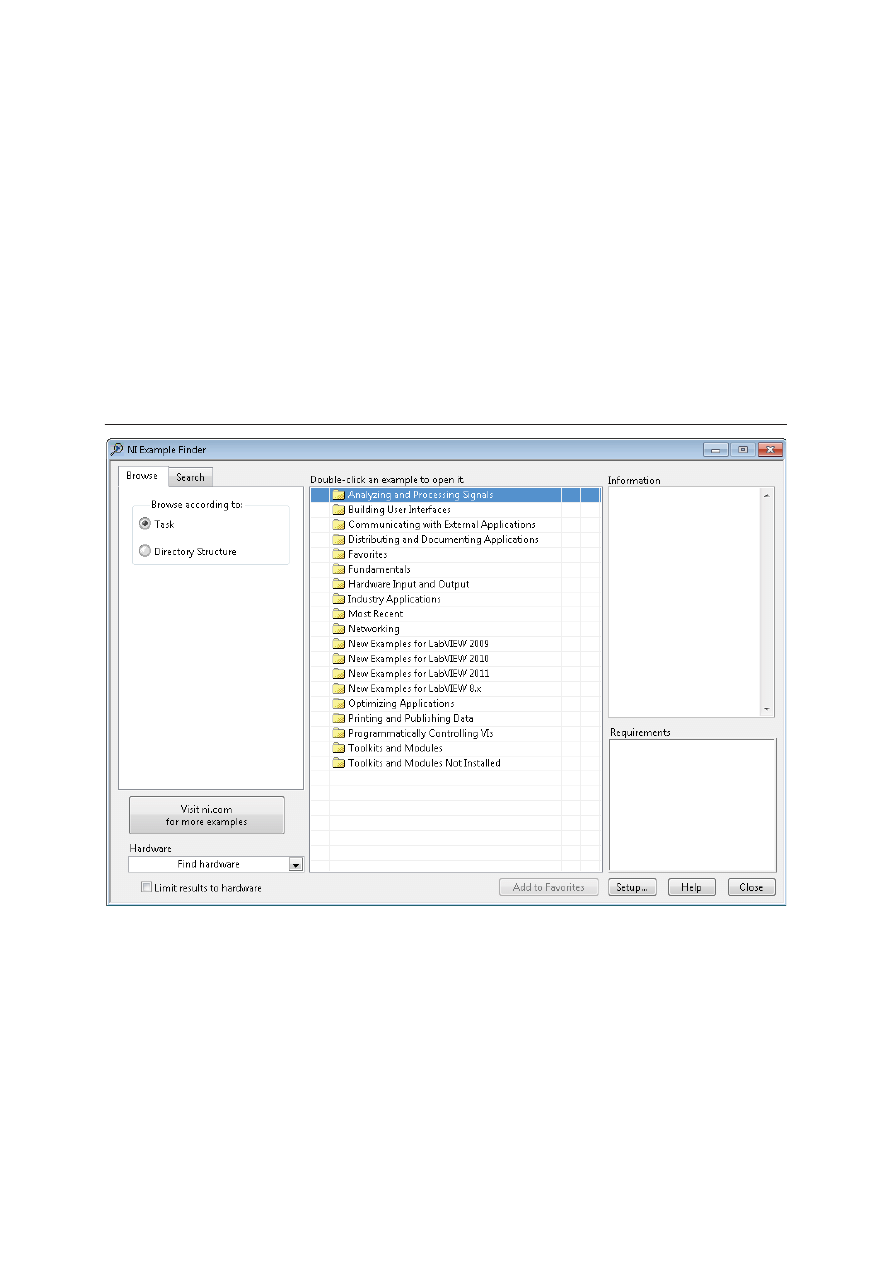
NI Example Finder
Use the NI Example Finder to browse or search examples installed on your computer or on the NI
Developer Zone at
ni.com/zone
. These examples demonstrate how to use LabVIEW to perform
a wide variety of test, measurement, control, and design tasks. Select Help»Find Examples or
click the Find Examples link in the Examples section of the Getting Started window to launch
the NI Example Finder.
Examples can show you how to use specific VIs or functions. You can right-click a VI or function
on the block diagram or on a pinned palette and select Examples from the shortcut menu to display
a help topic with links to examples for that VI or function. You can modify an example VI to fit an
application, or you can copy and paste from one or more examples into a VI that you create.
Figure 1-20. NI Example Finder
LabVIEW Core 1 Course Manual
© National Instruments
| 1-31
F. Searching for Controls, VIs and Functions
When you select View»Controls or View»Functions to open the Controls and Functions
palettes, two buttons appear at the top of the palette.
Search—Changes the palette to search mode so you can perform text-based searches to locate
controls, VIs, or functions on the palettes. While a palette is in search mode, click the Return button
to exit search mode and return to the palette.
Customize—Provides options for selecting a format for the current palette, showing and hiding
categories for all palettes, and sorting items in the Text and Tree formats alphabetically. Select
Options from the shortcut menu to display the Controls/Functions Palettes page of the Options
dialog box, in which you can select a format for all palettes. This button appears only if you click
the thumbtack in the upper left corner of a palette to pin the palette.
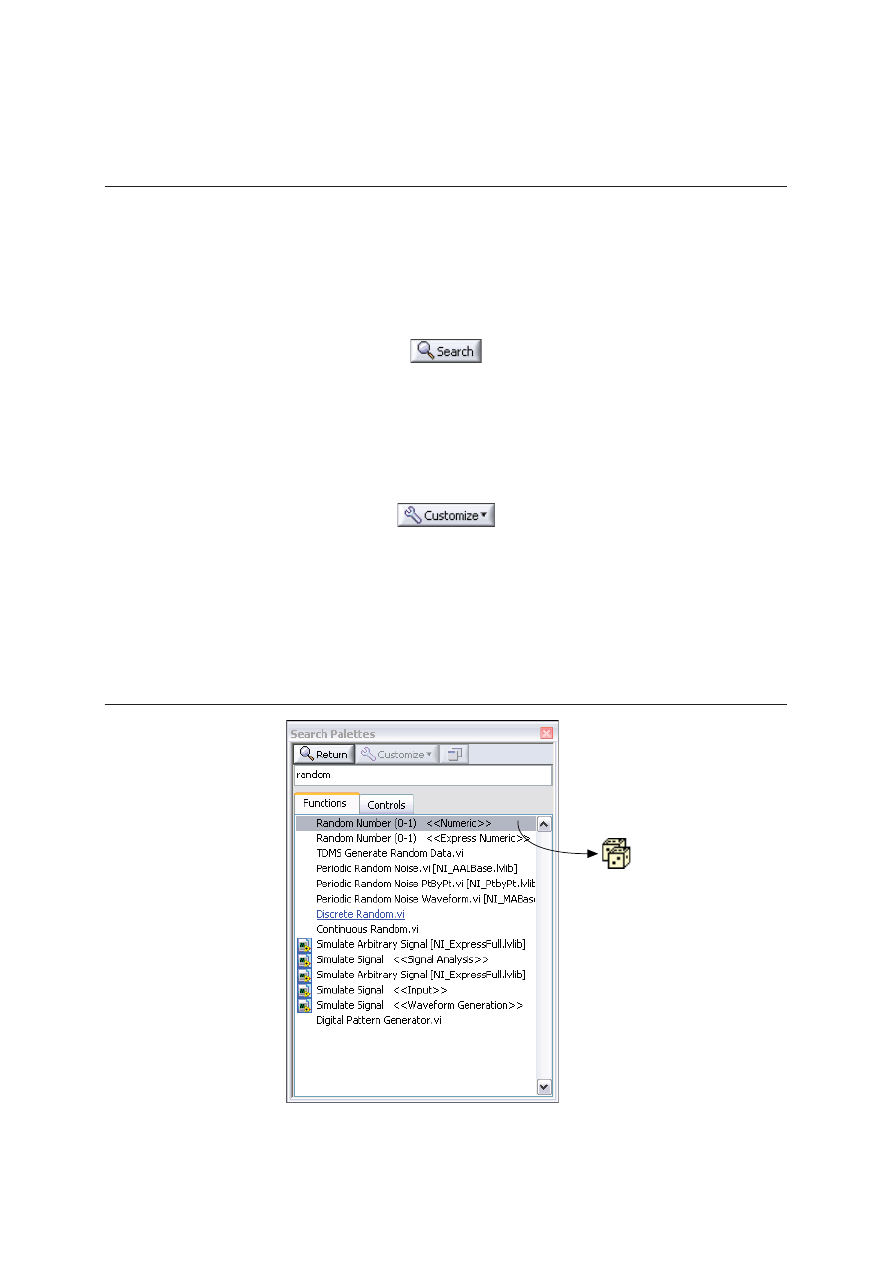
Until you are familiar with the location of VIs and functions, search for the function or VI using
the Search button. For example, if you want to find the Random Number function, click the
Search button on the Functions palette toolbar and start typing
Random Number
in the text box
at the top of the palette. LabVIEW lists all matching items that either start with or contain the text
you typed. You can click one of the search results and drag it to the block diagram, as shown in
Figure 1-21.
Figure 1-21. Searching for an Object in the Functions Palette
Lesson 1
Navigating LabVIEW
1-32
| ni.com
Double-click the search result to highlight its location on the palette. If the object is one you need
to use frequently, you can add it to your Favorites category. Right-click the object on the palette
and select Add Item to Favorites, as shown in Figure 1-22.
Figure 1-22. Adding an Item to the Favorites Category of a Palette
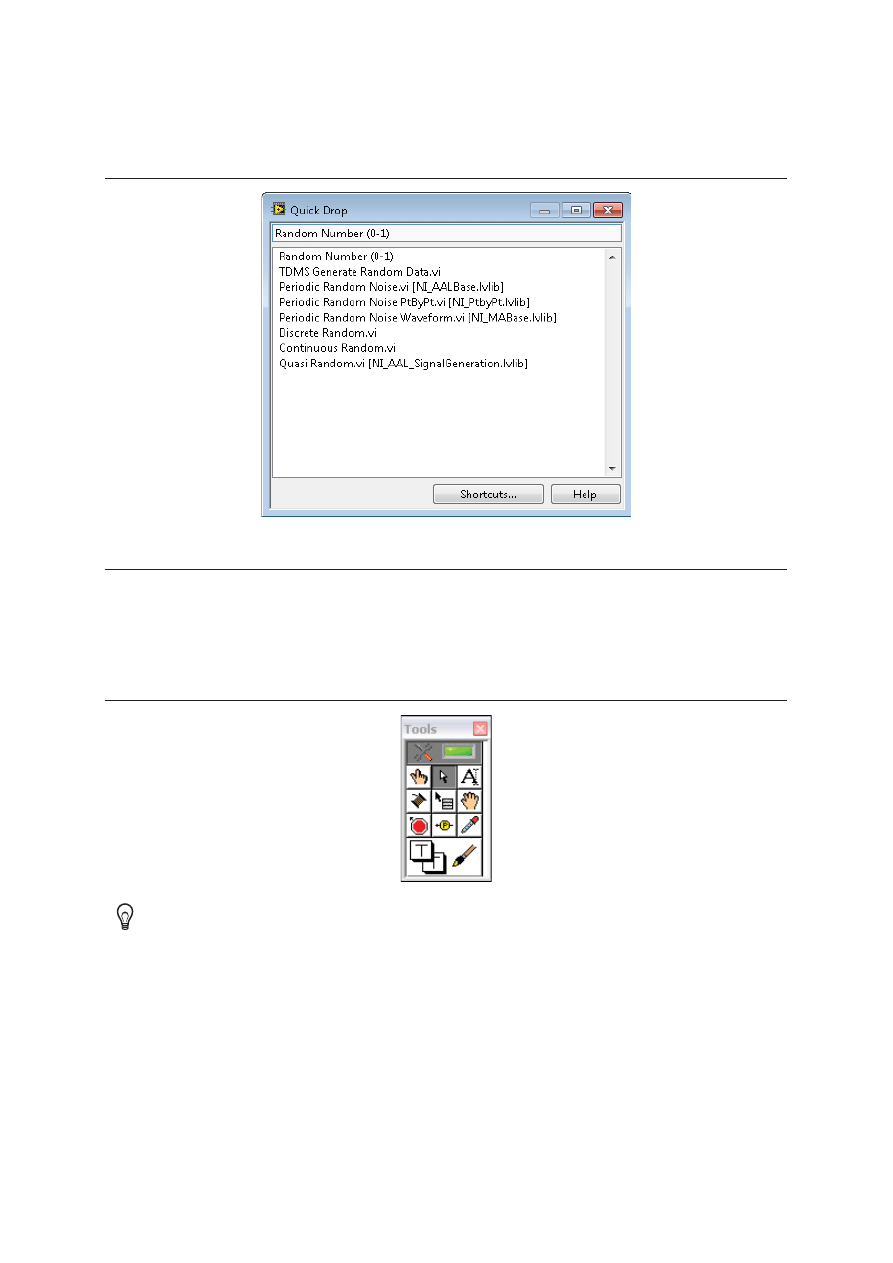
Similar to the Search button, you use the Quick Drop dialog box to specify a palette object by
name and then place the object on the block diagram or front panel. In addition to palette objects,
you can also specify a project item by name in the Quick Drop dialog box.
To display the Quick Drop dialog box, press <Ctrl-Space> or select View»Quick Drop. Type the
name of the object you want to add to the block diagram or front panel. LabVIEW displays the
results in the Name Match List. To attach the object you select to the cursor, press the <Enter>
key, double-click the name of the object in the list, or click the block diagram or front panel. Click
the location on the block diagram or front panel where you want to add the object.
LabVIEW Core 1 Course Manual
© National Instruments
| 1-33
Figure 1-23. Searching for an Object in the Quick Drop Dialog Box
G. Selecting a Tool
You can create, modify and debug VIs using the tools provided by LabVIEW. A tool is a special
operating mode of the mouse cursor. The operating mode of the cursor corresponds to the icon of
the tool selected. LabVIEW chooses which tool to select based on the current location of the
mouse.
Figure 1-24. Tools Palette
Tip
You can manually choose the tool you need by selecting it on the Tools palette.
Select View»Tools Palette to display the Tools palette.
Lesson 1
Navigating LabVIEW
1-34
| ni.com
Operating Tool
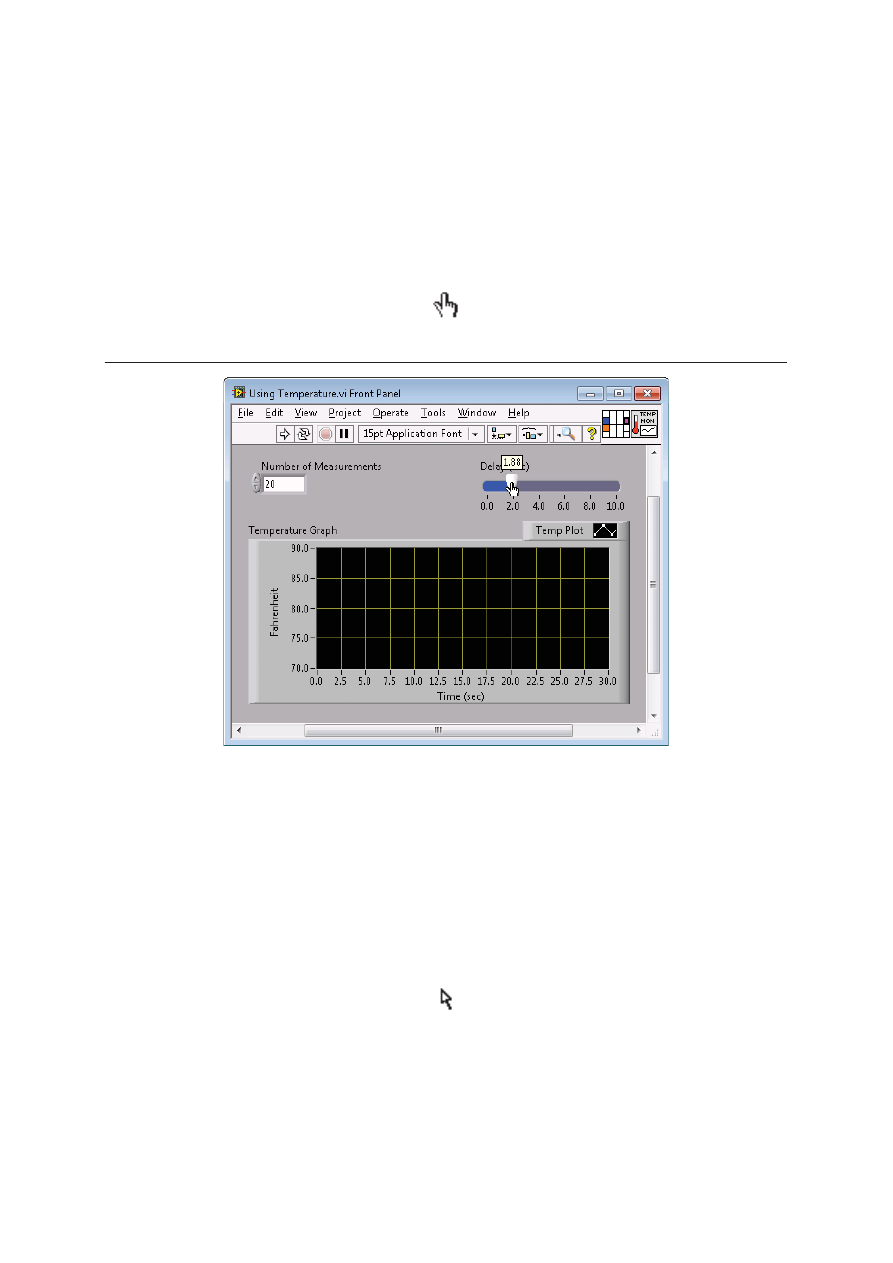
When the mouse cursor changes to the icon shown below, the Operating tool is in operation. Use
the Operating tool to change the values of a control. For example, in Figure 1-25 the Operating tool
moves the pointer on the Horizontal Pointer Slide. When the mouse hovers over the pointer, the
cursor automatically accesses the Operating tool.
Figure 1-25. Using the Operating Tool
The Operating tool is mostly used on the front panel window, but you also can use the Operating
tool on the block diagram window to change the value of a Boolean constant.
Positioning Tool
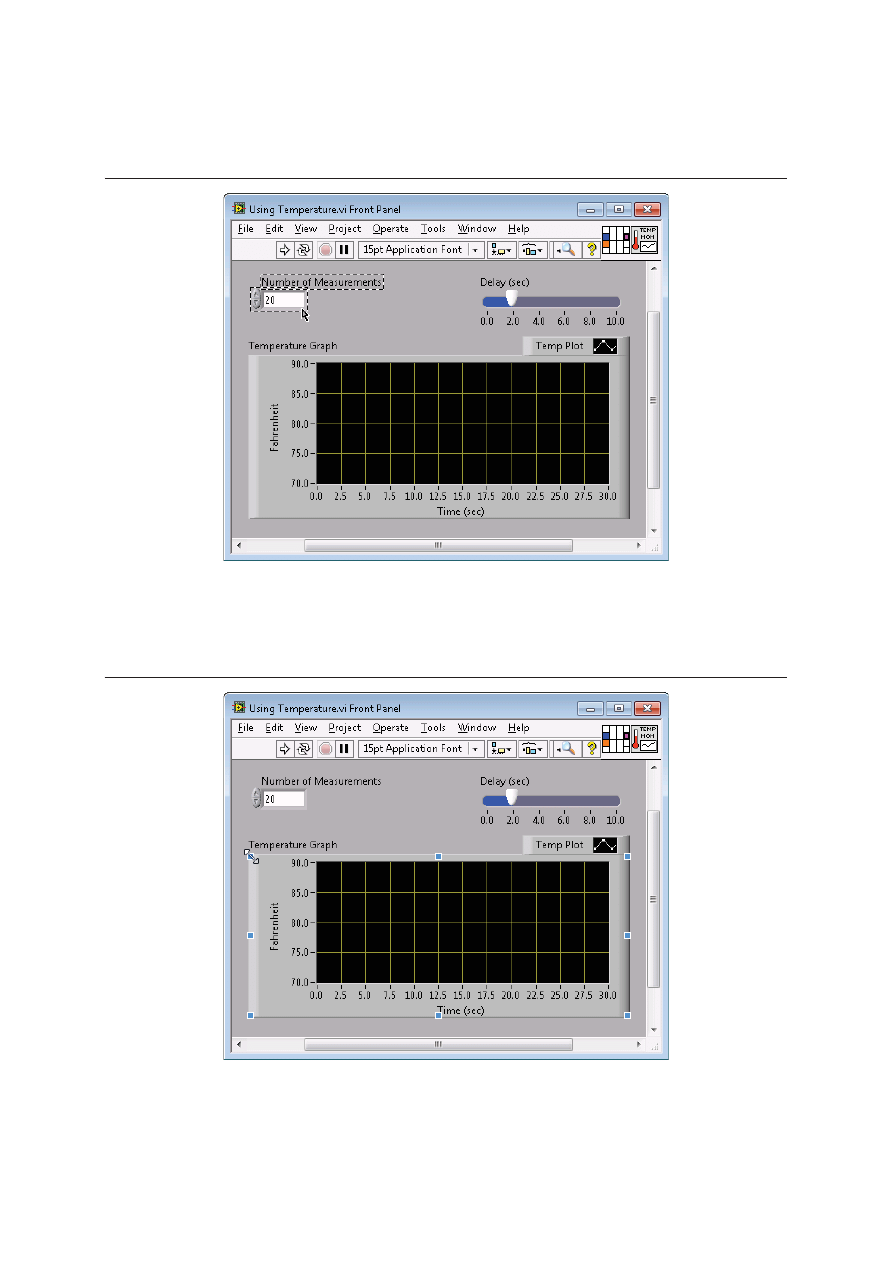
When the mouse cursor changes to the icon shown below, the Positioning tool is in operation. Use
the Positioning tool to select or resize objects. For example, in Figure 1-26 the Positioning tool
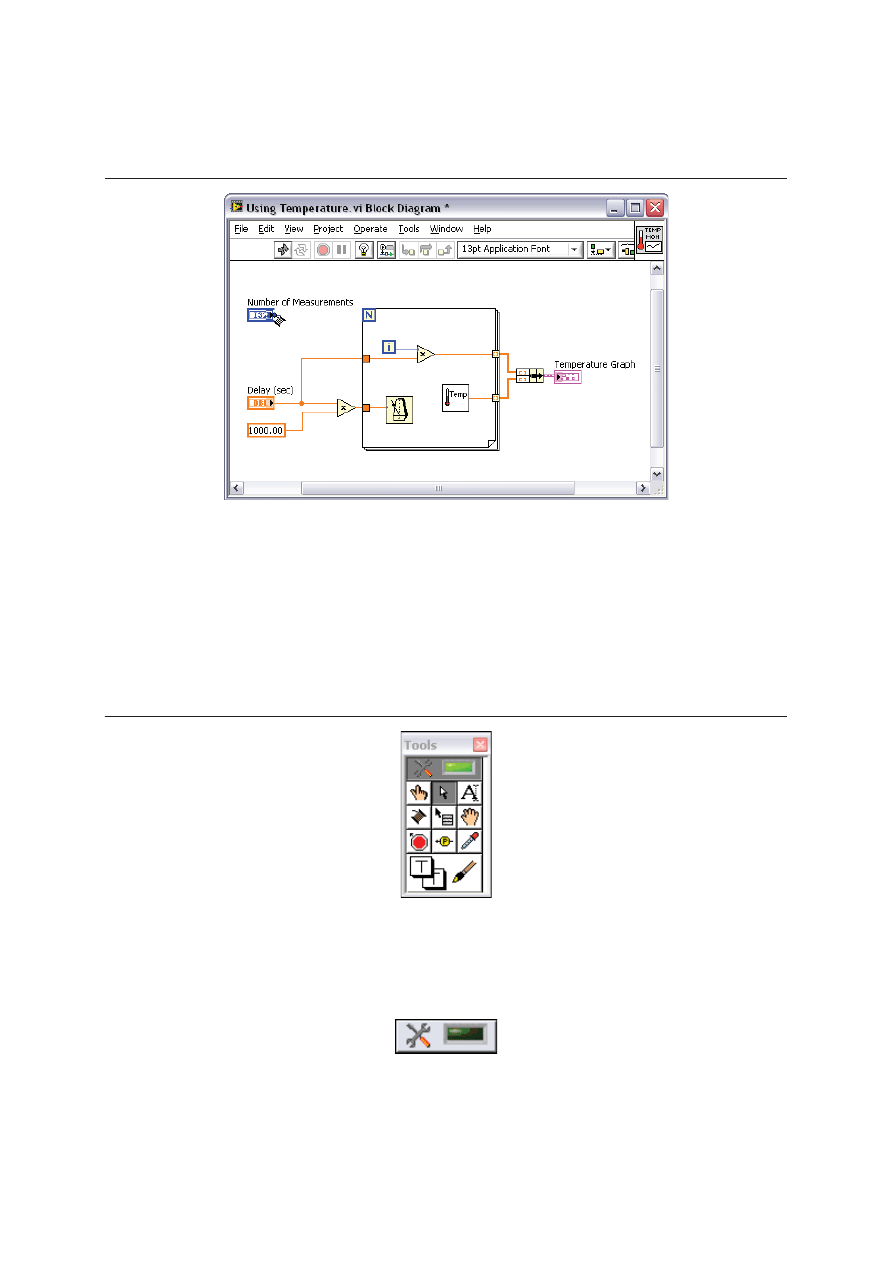
selects the Number of Measurements numeric control. After selecting an object, you can move,
copy, or delete the object. When the mouse hovers over the edge of an object, the cursor
automatically accesses the Positioning tool.
LabVIEW Core 1 Course Manual
© National Instruments
| 1-35
Figure 1-26. Using the Positioning Tool to Select an Object
If the mouse hovers over a resizing node of an object, the cursor mode changes to show that you
can resize the object, as shown in Figure 1-27. Notice that the cursor is hovering over a corner of
the XY Graph at a resizing node, and the cursor mode changes to a double-sided arrow.
Figure 1-27. Using the Positioning Tool to Resize an Object
You can use the Positioning tool on both the front panel window and the block diagram.
Lesson 1
Navigating LabVIEW
1-36
| ni.com
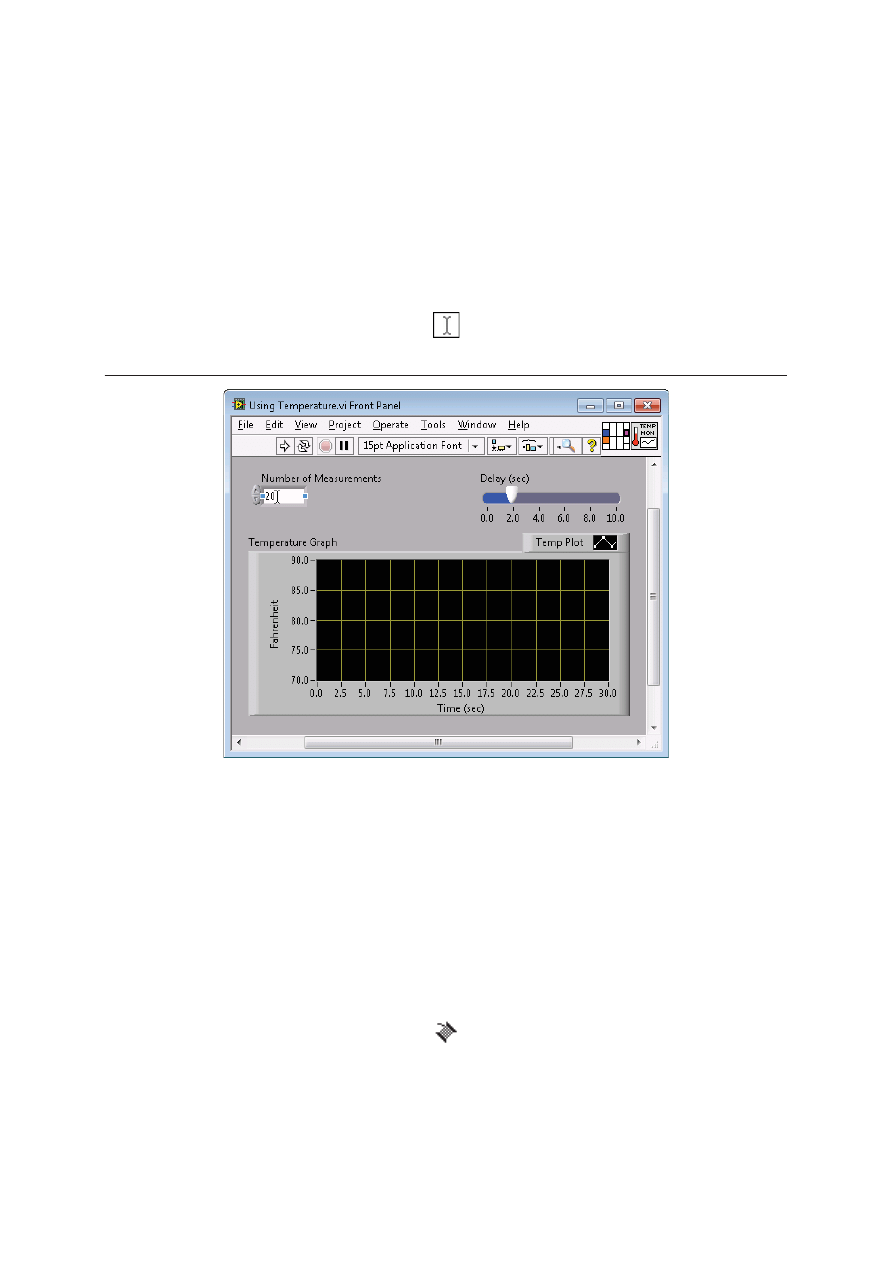
Labeling Tool
When the mouse cursor changes to the icon shown below, the Labeling tool is in operation. Use the
Labeling tool to enter text in a control, to edit text, and to create free labels. For example, in
Figure 1-28 the Labeling tool enters text in the Number of Measurements numeric control. When
the mouse hovers over the interior of the control, the cursor automatically accesses the Labeling
tool. Click once to place a cursor inside the control. Then double-click to select the current text.
Figure 1-28. Using the Labeling Tool
When you are not in a specific area of a front panel window or block diagram window that accesses
a certain mouse mode, the cursor appears as cross-hairs. If automatic tool selection is enabled, you
can double-click any open space to access the Labeling tool and create a free label.
Wiring Tool
When the mouse cursor changes to the icon shown below, the Wiring tool is in operation. Use the
Wiring tool to wire objects together on the block diagram. For example, in Figure 1-29 the Wiring
tool wires the Number of Measurements terminal to the count terminal of the For Loop. When
the mouse hovers over the exit or entry point of a terminal or over a wire, the cursor automatically
accesses the Wiring tool.
LabVIEW Core 1 Course Manual
© National Instruments
| 1-37
Figure 1-29. Using the Wiring Tool
The Wiring tool works mainly with the block diagram window and when you create a connector
pane on the front panel window.
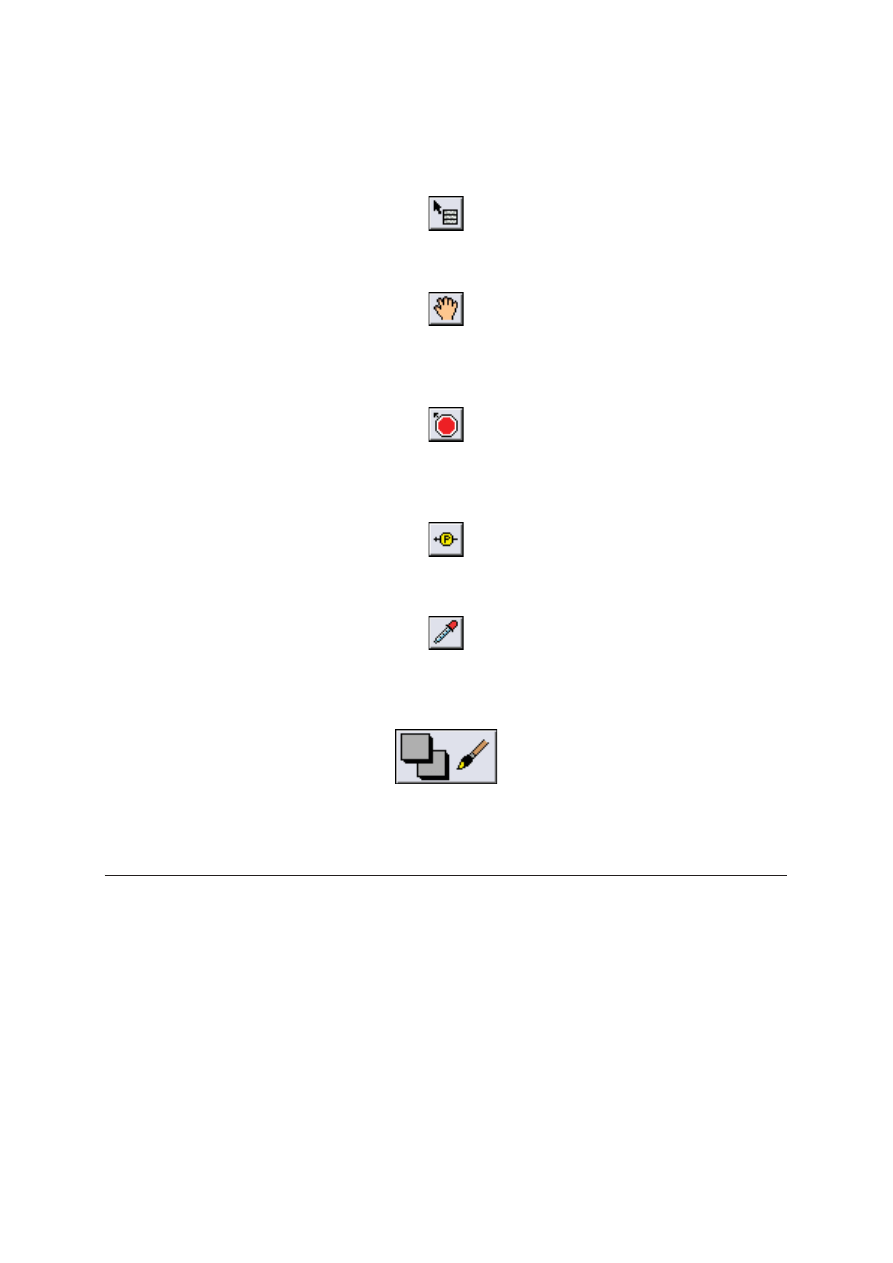
Other Tools Accessed from the Palette
You can access the Operating, Positioning, Labeling, and Wiring tools directly from the Tools
palette, rather than using the Automatic tool selection mode. Select View»Tools Palette to access
the Tools palette.
Figure 1-30. The Tools Palette
The top item in the Tools palette is the Automatic Tool Selection button. When this is selected,
LabVIEW automatically chooses a tool based on the location of your cursor. You can turn off
automatic tool selection by deselecting the item, or by selecting another item in the palette. There
are some additional tools on the palette, as described below:
Lesson 1
Navigating LabVIEW
1-38
| ni.com
Use the Object Shortcut Menu tool to access an object shortcut menu with the left mouse button.
Use the Scrolling tool to scroll through windows without using scrollbars.
Use the Breakpoint tool to set breakpoints on VIs, functions, nodes, wires, and structures to pause
execution at that location.
Use the Probe tool to create probes on wires on the block diagram. Use the Probe tool to check
intermediate values in a VI that produces questionable or unexpected results.
Use the Color Copy tool to copy colors for pasting with the Coloring tool.
Use the Coloring tool and the color picker to color an object. The Coloring tool also displays the
current foreground and background color settings.
Select the Coloring tool and right-click an object or workspace to display the color picker.
H. Dataflow
LabVIEW follows a dataflow model for running VIs. A block diagram node executes when it
receives all required inputs. When a node executes, it produces output data and passes the data to
the next node in the dataflow path. The movement of data through the nodes determines the
execution order of the VIs and functions on the block diagram.
Visual Basic, C++, JAVA, and most other text-based programming languages follow a control flow
model of program execution. In control flow, the sequential order of program elements determines
the execution order of a program.
LabVIEW Core 1 Course Manual
© National Instruments
| 1-39
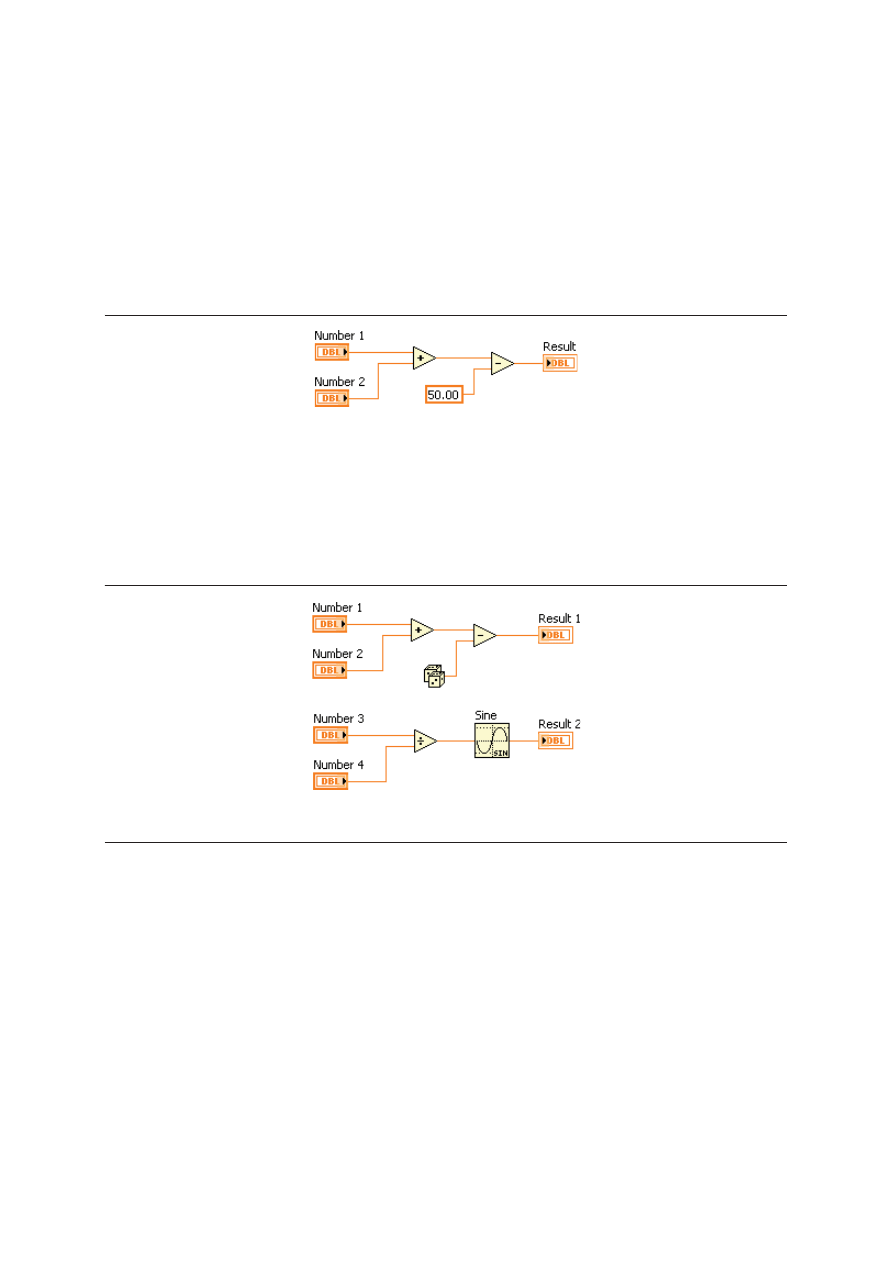
For a dataflow programming example, consider a block diagram that adds two numbers and then
subtracts
50.00
from the result of the addition, as shown in Figure 1-31. In this case, the block
diagram executes from left to right, not because the objects are placed in that order, but because the
Subtract function cannot execute until the Add function finishes executing and passes the data to
the Subtract function. Remember that a node executes only when data are available at all of its
input terminals and supplies data to the output terminals only when the node finishes execution.
Figure 1-31. Dataflow Programming Example
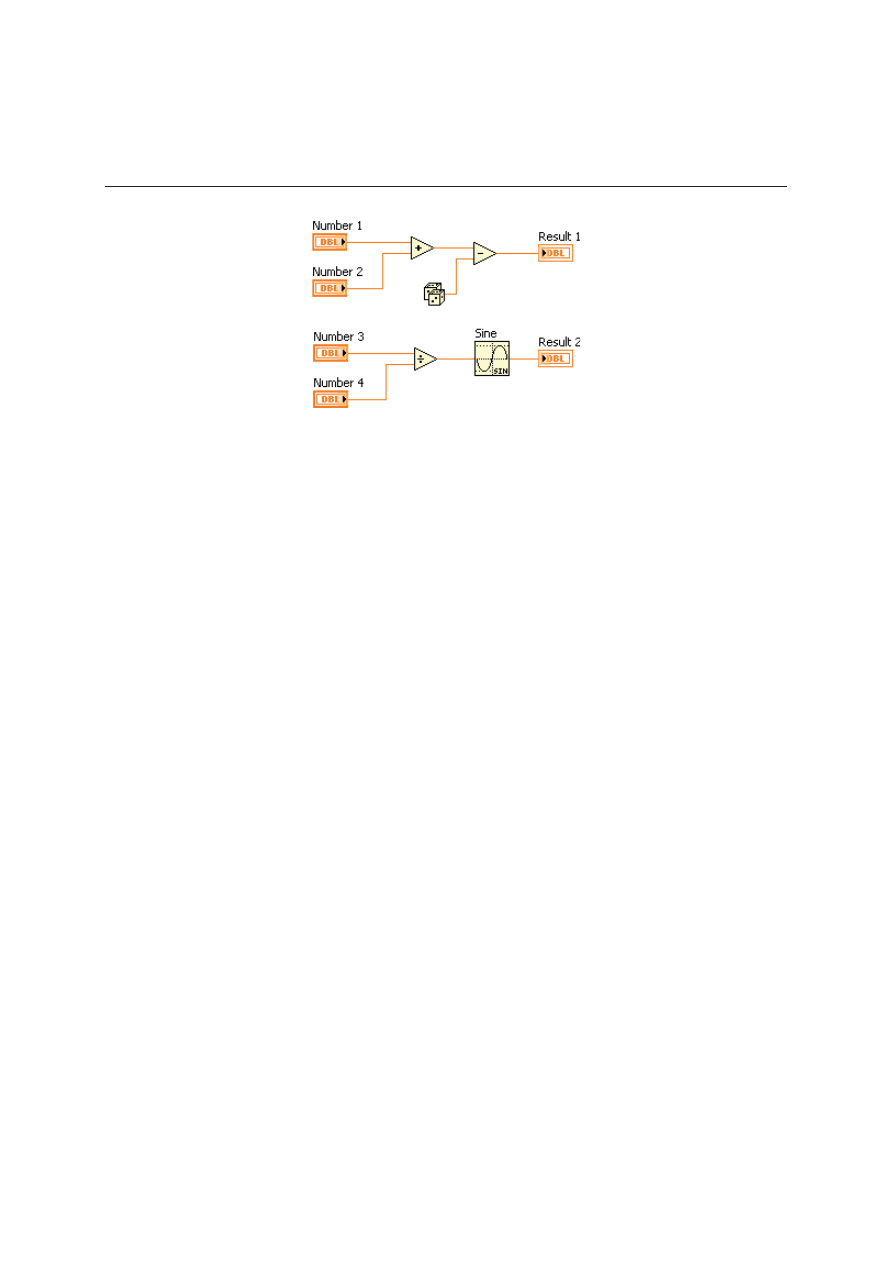
In Figure 1-32, consider which code segment would execute first—the Add, Random Number, or
Divide function. You cannot know because inputs to the Add and Divide functions are available at
the same time, and the Random Number function has no inputs. In a situation where one code
segment must execute before another, and no data dependency exists between the functions, use
other programming methods, such as error clusters, to force the order of execution. Refer to
Lesson 5, Creating and Leveraging Data Structures, for more information about error clusters.
Figure 1-32. Dataflow Example for Multiple Code Segments
I. Building a Simple VI
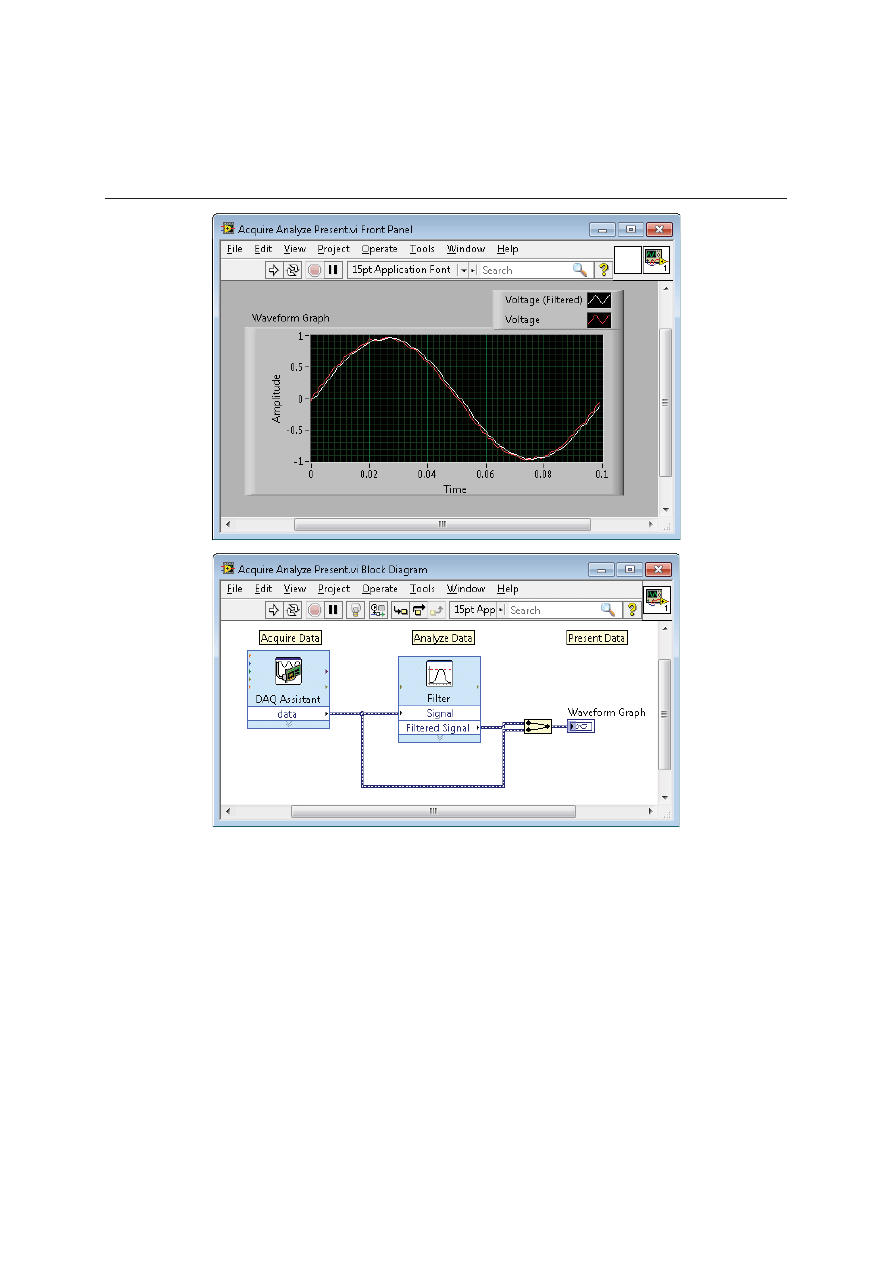
Most LabVIEW VIs have three main tasks—acquiring some sort of data, analyzing the acquired
data, and presenting the result. When each of these parts are simple, you can complete the entire
VI using very few objects on the block diagram. Express VIs are designed specifically for
completing common, frequently used operations. In this section, you learn about some Express VIs
that acquire, analyze, and present data. Then you learn to create a simple VI that uses these
three tasks, as shown in Figure 1-33.
Lesson 1
Navigating LabVIEW
1-40
| ni.com
Figure 1-33. Acquire, Analyze, and Present Example Front Panel Window and
Block Diagram Window
On the Functions palette, the Express VIs are grouped together in the Express category. Express
VIs use the dynamic data type to pass data between Express VIs.
Acquire
Express VIs used for the Acquire Data task include the following: DAQ Assistant, Instrument I/O
Assistant, Simulate Signal, and Read from Measurement File.
LabVIEW Core 1 Course Manual
© National Instruments
| 1-41
DAQ Assistant
The DAQ Assistant acquires data through a data acquisition device.You must use this Express VI
frequently throughout this course. Until you learn more about data acquisition, you only use one
channel of the data acquisition device,
CH0
. This channel is connected to a temperature sensor on
the BNC-2120. You can touch the temperature sensor to change the temperature the sensor reads.
Instrument I/O Assistant
The Instrument I/O Assistant acquires instrument control data, usually from a GPIB or serial
interface.
Simulate Signal
The Simulate Signal Express VI generates simulated data such as a sine wave.
Read From Measurement File
The Read From Measurement File Express VI reads a file that was created using the Write To
Measurement File Express VI. It specifically reads LVM or TDM file formats. This Express VI
does not read ASCII files. Refer to Lesson 6, Managing File and Hardware Resources, for more
information on reading data from a file.
Analyze
Express VIs used for the Analyze Data task include the following—Amplitude and Level
Measurements, Statistics, and Tone Measurements.
Amplitude and Level Measurements
The Amplitude and Level Measurements Express VI performs voltage measurements on a signal.
These include DC, rms, maximum peak, minimum peak, peak to peak, cycle average, and cycle
rms measurements.
Lesson 1
Navigating LabVIEW
1-42
| ni.com
Statistics
The Statistics Express VI calculates statistical data from a waveform. This includes mean, sum,
standard deviation, and extreme values.
Spectral Measurements
The Spectral Measurements Express VI performs spectral measurement on a waveform, such as
magnitude and power spectral density.
Tone Measurements
The Tone Measurements Express VI searches for a single tone with the highest frequency or
highest amplitude. It also finds the frequency and amplitude of a single tone.
Filter
The Filter Express VI processes a signal through filters and windows. Filters used include the
following: Highpass, Lowpass, Bandpass, Bandstop, and Smoothing. Windows used include
Butterworth, Chebyshev, Inverse Chebyshev, Elliptical, and Bessel.
Present
Present results by using Express VIs that perform a function, such as the Write to Measurement
File Express VI, or indicators that present data on the front panel window. The most commonly
used indicators for this task include the Waveform Chart, the Waveform Graph, and the XY Graph.
Common Express VIs include the Write to Measurement File Express VI, the Build Text Express
VI, the DAQ Assistant, and the Instrument I/O Assistant. In this case, the DAQ Assistant and the
Instrument I/O Assistant provide output data from the computer to the DAQ device or an external
instrument.
LabVIEW Core 1 Course Manual
© National Instruments
| 1-43
Write to Measurement File
The Write to Measurement File Express VI writes a file in LVM or TDMS file format. Refer to
Lesson 6, Managing File and Hardware Resources, for more information on writing to
measurement files.
Build Text
The Build Text Express VI creates text, usually for displaying on the front panel window or
exporting to a file or instrument. Refer to Lesson 6, Managing File and Hardware Resources, for
more information on creating strings.
Running a VI
After you configure the Express VIs and wire them together, you can run the VI. When you finish
creating your VI, click the Run button on the toolbar to execute the VI.
While the VI is running, the Run button icon changes to the figure shown below. After the
execution completes, the Run button icon changes back to its original state, and the front panel
indicators contain data.
Run Button Errors
If a VI does not run, it is a broken, or nonexecutable, VI. The Run button appears broken when the
VI you are creating or editing contains errors.
If the button still appears broken when you finish wiring the block diagram, the VI is broken and
cannot run.
Generally, this means that a required input is not wired, or a wire is broken. Press the broken run
button to access the Error list window. The Error list window lists each error and describes the
problem. You can double-click an error to go directly to the error. Refer to Lesson 2,
Troubleshooting and Debugging VIs, for more information on debugging VIs.

LabVIEW Core 1 Course Manual
© National Instruments
| 1-45
Self-Review: Quiz
Refer to Figure 1-34 to answer the following quiz questions.
Figure 1-34. Dataflow Questions
1. Which function executes first: Add or Subtract?
a. Add
b. Subtract
c. Unknown
2. Which function executes first: Sine or Divide?
a. Sine
b. Divide
c. Unknown
3. Which function executes first: Random Number, Divide or Add?
a. Random Number
b. Divide
c. Add
d. Unknown
4. Which function executes last: Random Number, Subtract or Add?
a. Random Number
b. Subtract
c. Add
d. Unknown
5. What are the three parts of a VI?
a. Front panel window
b. Block diagram window
c. Project
d. Icon/connector pane

LabVIEW Core 1 Course Manual
© National Instruments
| 1-47
Self-Review: Quiz Answers
1. Which function executes first: Add or Subtract?
a. Add
b. Subtract
c. Unknown
2. Which function executes first: Sine or Divide?
a. Sine
b. Divide
c. Unknown
3. Which function executes first?
a. Random Number
b. Divide
c. Add
d. Unknown
4. Which function executes last: Random, Subtract or Add?
a. Random Number
b. Subtract
c. Add
d. Unknown
5. What are the three parts of a VI?
a. Front panel window
b. Block diagram window
c. Project
d. Icon/connector pane
Wyszukiwarka
Podobne podstrony:
Cw 2 Nawigacja w LabVIEW Instrukcja
Cw 5 Struktury Danych Materiały dodatkowe
Cw 4 Implementacja VI Materiały dodatkowe
Cw 2 Nawigacja w LabVIEW Instrukcja
Cw 7 Obsługa zdarzeń Materiały dodatkowe
Cw 2 Nawigacja w LabVIEW Instrukcja
Cw 5 Struktury Danych Materiały dodatkowe
Cw 2 Nawigacja w LabVIEW Instrukcja
materiały dodatkowe sedymentologia ćw II0001
Cw 3 Wyszukiwanie błędów w VI Materiały dodatkowe
materiały dodatkowe cw 3 i 4a
Materialy dodatkowe cw 3 i 4 id Nieznany
Cw 6 Tworzenie aplikacji modułowych Materiały dodatkowe
materiały dodatkowe sedymentologia ćw II0001
więcej podobnych podstron