
Chandra S. Pareek
Novel approaches for linkage
mapping in dairy cattle.
”Selective DNA pooling”

Main sub-headings
Definition
Principle
Experimental design
Experimental design to locate the QTL region through selective
DNA pooling.
Microsatellite genotyping
Statistical methods for accurate estimation of gene frequency from
pooled samples.
Problems in determination of gene frequency.
Problems in interpreting pooling results by visual inspection.
Application of Selective DNA pooling in farm animals.
Advantages of Selective DNA pooling.
Success of selective DNA pooling in dairy cattle.

Definitio
n
•
“Selective DNA pooling” is an advanced
methodology
for
linkage
mapping
of
quantitative, binary and complex traits in
farm animals.
•
In human, this methodology is termed as DNA
pooling where it serves as mapping of
complex disease traits.
•
It is defined as densitometric genotyping of
physically
pooled
samples
from
phenotypically extreme individuals.
•
The DNA pooling is performed by taking equal
aliquots of DNA from the pooled individuals.

Principle
•
The principle is based on densitometric estimates of marker
allele frequency from the pooled phenotypically extreme
individuals.
•
In this regards, the marker of choice is:
STR or microsatellite
STR or microsatellite
markers.
markers.
•
The microsatellite allele linked to any QTL gene can be
identified by any shift or deviation of allele from the pools.
•
The QTL linked allele, and then further tested for its feasibility
by statistical analysis.
•
The power of statistics is relied on the accurate estimates of
gene frequency from the pooled samples.
•
Several methods have been described for accurate estimation
of gene frequencies (Daniels et al. 1998, Barcellos et al. 1998,
Lipkin et al. 1998, and Collins et al. 2000).
•
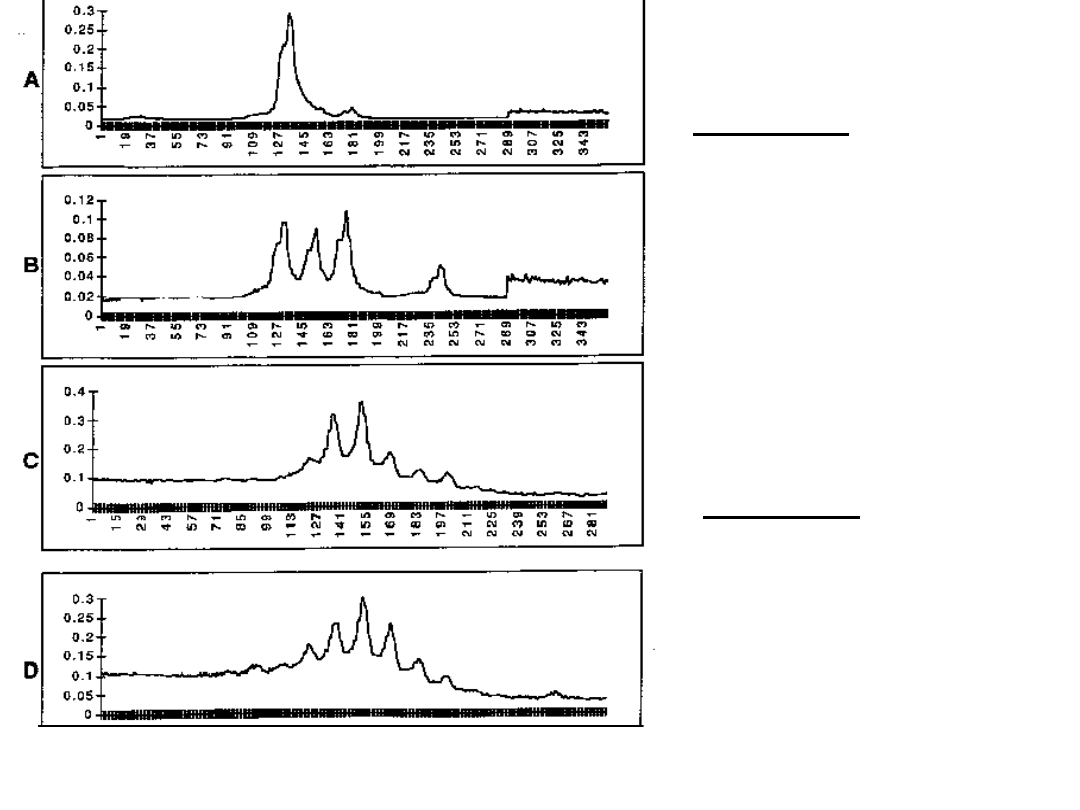
Figure A and B: showing allelic patterns
of a linked marker.
Here figure A is displaying a shift of
marker allelein affected individuals pool.
Figure C and D: showing allelic
patterns of a unlinked marker.
Here both figures are not displaying
any shift or deviation of the alleles.
Affected pool
Unaffected pool
Unaffected pool
Affected pool

Experimental design
A well-defined experimental design is an essential prerequisite
to perform the selective DNA pooling.
•
The experimental design should include the following
conditions.
• 1. Identification of resource families having extreme
phenotypic values for the given analysed trait.
• 2. Systemic selection of highly polymorphic STR markers from
the analysed genome.
•
Experimental design to locate the QTL region through
selective DNA pooling
•
Daughter design: In case of cattle, by utilizing multiple half-
sib families with multiple STR markers.
Granddaughter design: In case of cattle, poultry and swine,
by utilizing F2 full-sib daughters including sire and grand
sire.

Microsatellite
genotyping
•
The most commonly used touch
down protocol of Don et al. 1991, can
be used for typing of microsatellte
markers, followed by visualisation of
electrophoresis results in any DNA
sequencing machine (Perkin Elmer
ABI-Prism,
Pharmacia
ALF,
and
LICOR genetic analyser).

Statistical methods for accurate
estimation of gene frequency from
pooled samples
The following three methods have been
described:
By measuring the relative intensity of
shadow bands (RI):
Method proposed by Lipkin et al. 1998.
By measuring the Allelic Image Pattern
(AIP) from the pools:
Method proposed by Daniels et al. 1998.
By measuring the Total Allelic content
(TAC) from the pools:
Method proposed by Collins et al. 2000.

first Method: Lipkin et al. 1998
Measuring relative intensity of shadow
bands (RI)
By giving the densitometric values of main and
shadow bands, the relative intensity of a given
shadow band for a given allele can be calculated
as:
RI
n.i
= D
n.i
/ D
n
Where,
n = is the number of repeats in the native genomic
tract of the allele A
n
I = is the order of the shadow band
RI
n.i
= is the relative intensity of the i
th
shadow
band derived from the genomic tract of A
n
D
n
= is the densitometric intensity of the main
band derived from the genomic tract of A
n
D
n.i
=is the densitometric intensity of the i
th
shadow
band derived from the genomic tract of A
n

2nd method: Daniels et al.. 1998
Measuring Allelic Image Patterns
(AIP) from the pools
• The principle of this method is based on the
analysis of microsatellite allele image patterns
(
AIP) generated from the DNA pools.
• The
AIP statistic is calculated from the
differences in the area between two allele
image pattern expressed as a fraction of total
shared and non-shared area.
AIP = Dif / (Dif + Com)
The
AIPs from the pools and X
2
values from
individual genotyping were compared. The
results demonstrated a high correlation
between
AIPs and X
2
values.
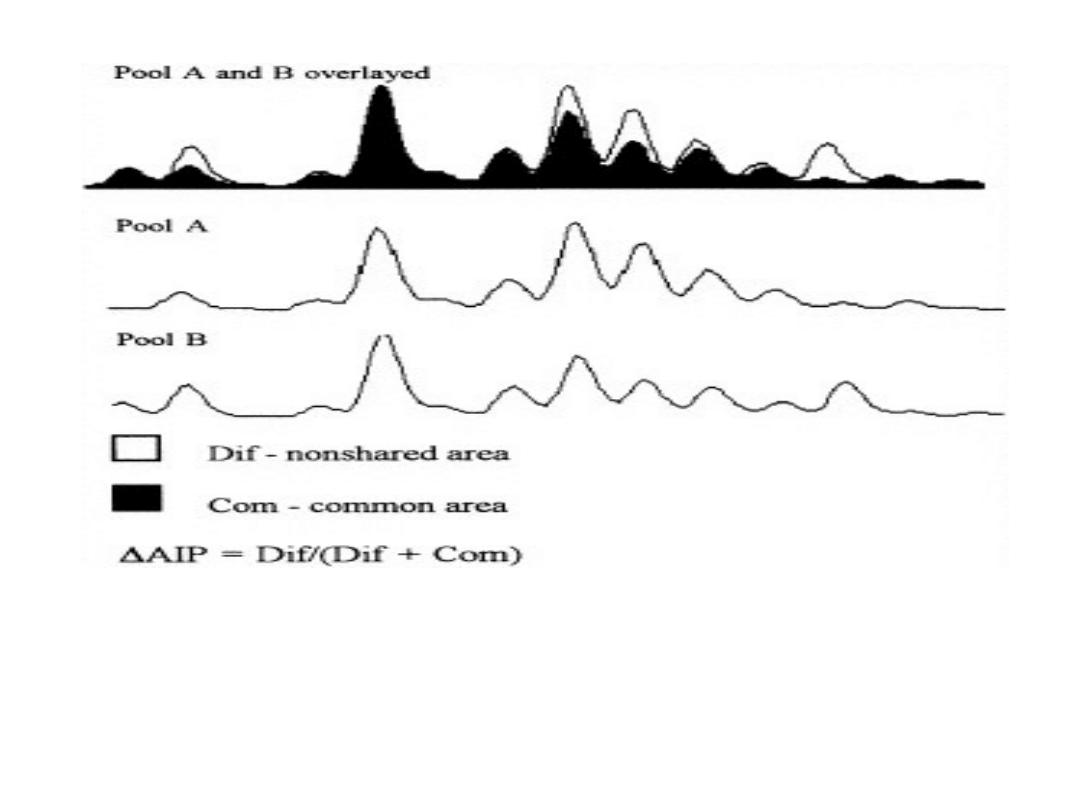
Figure showing overlaid AIPsof two different pools amplified with the
microsatellitemarker. Area ”Dif” and ”Com” are the non-shared and
common areas betweenthe two AIPs.

3rd method: Collins et al.. 2000
Measuring Total Allelic content
(
TAC) from the pools
• This is a modified method of Daniels et al..
1998.
• The principle of this method is based on
simple measurement of total allele
differences by comparing the two pools.
• The pool comparison is done by comparing
the relative peak height differences
between electrophoregrams for each allele
of a microsatellite.
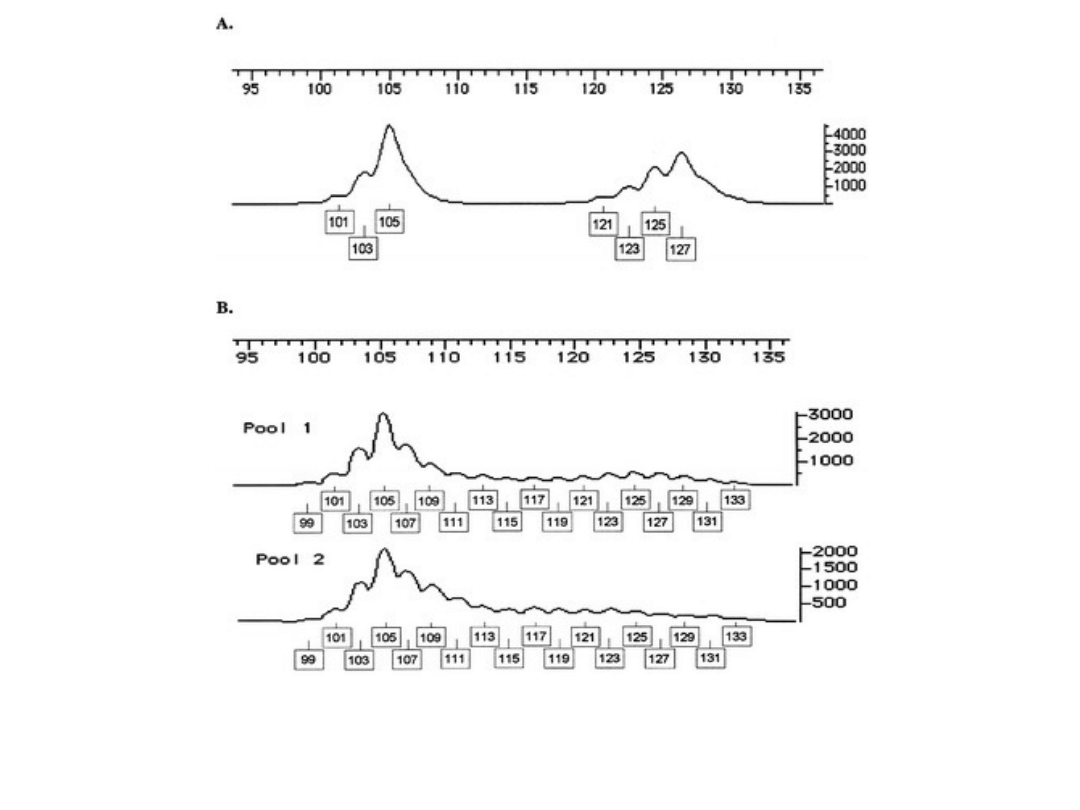
FigureA: Showing peak image profile from individual genotyping
illustrating sutter profile and amplitude variation.
Figure B: showing peak image profiles from pooled genotyping.

Problems in determination of
gene frequency
Feasibility and reliability of selective
DNA pooling is depend upon the
accurate estimates of the gene
frequency from pooled samples,
which is mostly confounded with
Sutter banding and Differential
amplification.
• 1. Sutter banding
• 2. Differential amplification.

Problems in interpretating
pooling results by visual
inspection
Visual inspection of numerous STR
genotyping of pooled samples can
be performed by visual eye balling
of the peak image files.
There are 2 problems encountered
during visual inspection of the
peak image files.
True negative peaks
False positive peaks
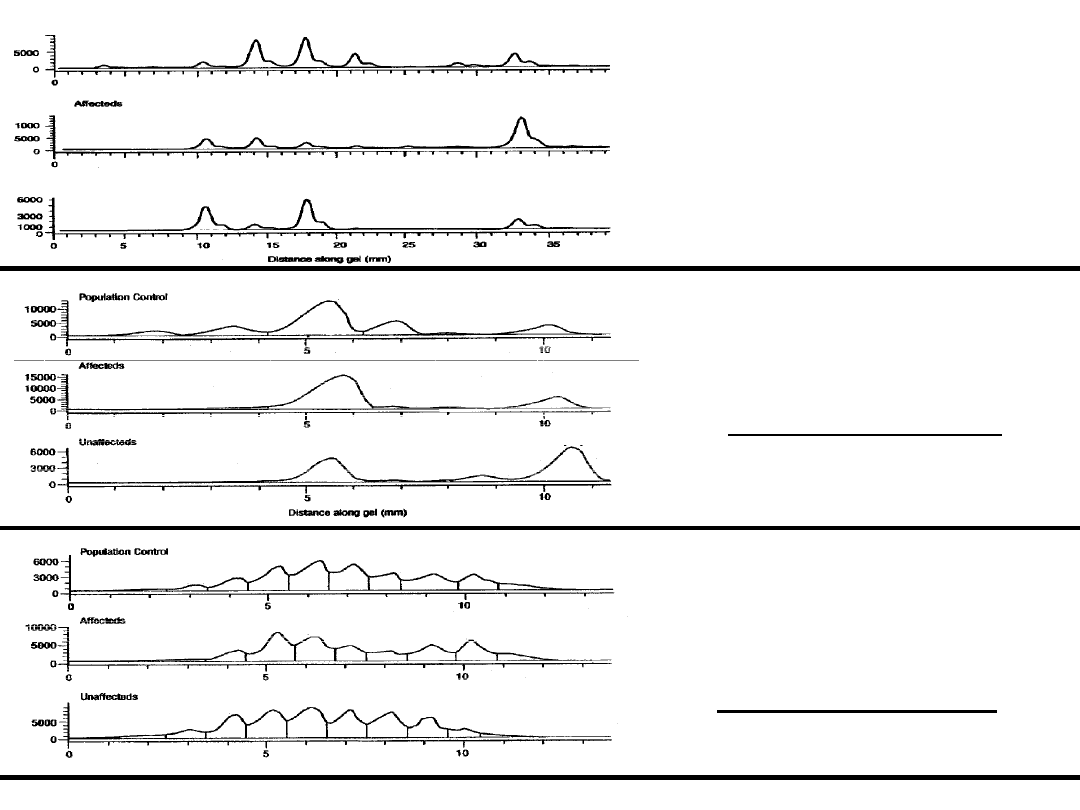
Figure1: Showing shifting of
microsatelliteallele in affected group.
This figure represents the True result
with correct peak profile image.
Figure3: Showing no shifting of
microsatellitealleles but there is one
linked marker allele in this locus.
This figure represents a good example of
True Negative peak profile image.
Shifted allele
control
unaffected
False .Shifted allele
Figure2: Showing shifting of
microsatelliteallele in affected group.
This figure represents a good example
of False positive peak profile image.
Example of correct result
Example of false positive result
Example of true negative result

Application of selective DNA pooling
in farm animals
In rapid genome scanning for the identification of
unknown gene or linked gene fragment.
In rapid estimation of STR gene frequency. More
recently in estimation of SNP frequencies as well.
In identification of complex gene fragment within
the genome through linkage analysis of STR
marker linked to that gene fragment.
In QTL mapping of the identified gene or gene
fragment.
To detect genes with small effect, for e.g., complex
disease traits in human.
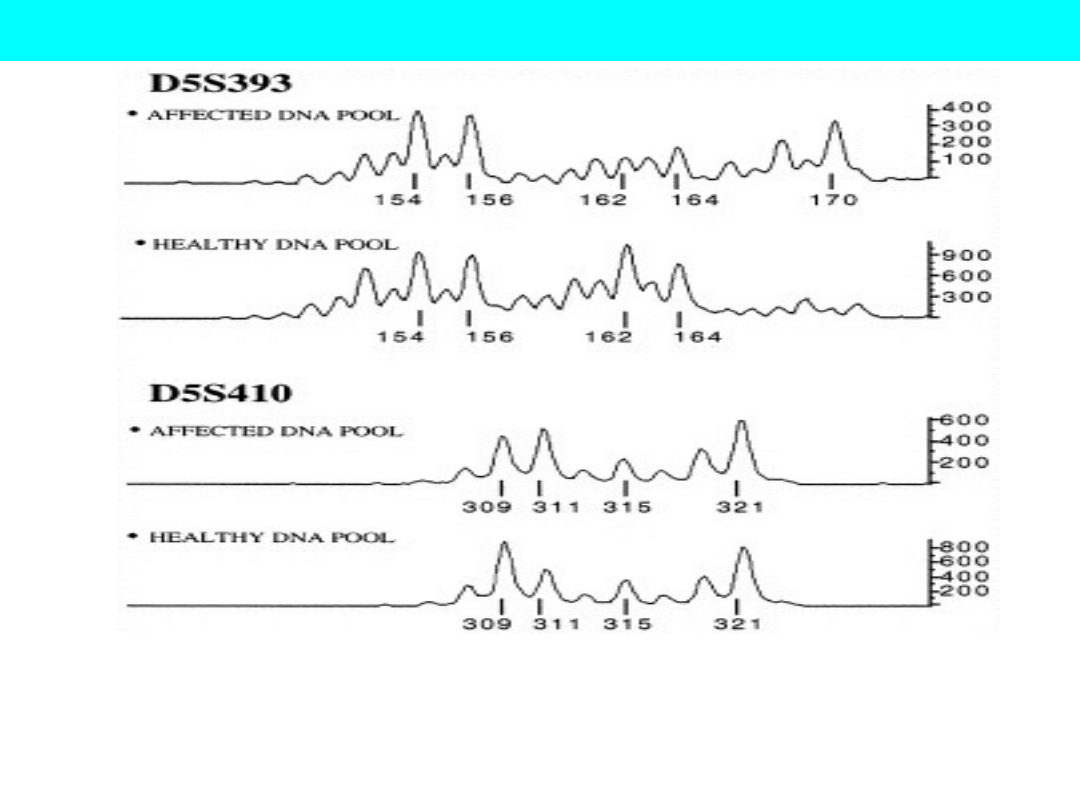
Figure representing detection of linked allele by comparing affected and
unaffected DNA pools.
In this figure: Marker D5S393 is showing the linked allele to the disease
trait whereas, marker D5S410 showing no allele linked to the disease trait.

Advantages of selective
DNA pooling
To detect any linkage between marker and QTL:
Multiple families with large numbers of daughters
are required to get reasonable statistical power.
This requirement leads to genotyping of hundreds of
thousands
individuals
with
high
cost
of
experiment.
By means of selective DNA pooling, the cost of
numerous
genotyping
can
be
substantially
reduced.
Thus selective DNA pooling is an ideal and potential
approach for analysing multiple large families with
multiple microsatellite markers.

Selective DNA pooling reduces not only the
genotype cost by many folds, but also
minimizes the valuable experimental time.
For example:individual v/s Pooled genotyping
In case of individual G: 2000 markers x 2000
individuals = 4 x 10
6
individuals
In case of Pooled G: The genotyping becomes
2000 x 2 = 4000.
Success of selective DNA pooling in
dairy cattle
Mapping of QTL genes for milk protein
percentage in Israeli HF cattle (Lipkin et al.
1998).
Detection of loci that affect quantitative traits
like milk production in New Zealand HF and
Jersey cattle population (Spelman et al. 1998).
Document Outline
- Ø Novel approaches for linkage mapping in dairy cattle. ”Selective DNA pooling”
- Main sub-headings
- Definition
- ØPrinciple
- Slide 5
- Experimental design
- ØMicrosatellite genotyping
- Ø Statistical methods for accurate estimation of gene frequency from pooled samples
- first Method: Lipkin et al. 1998 Measuring relative intensity of shadow bands (RI)
- 2nd method: Daniels et al.. 1998 Measuring Allelic Image Patterns (AIP) from the pools
- Slide 11
- 3rd method: Collins et al.. 2000 Measuring Total Allelic content (TAC) from the pools
- Slide 13
- Problems in determination of gene frequency
- Problems in interpretating pooling results by visual inspection
- Slide 16
- Application of selective DNA pooling in farm animals
- Slide 18
- Advantages of selective DNA pooling
- Slide 20
Wyszukiwarka
Podobne podstrony:
G B Folland Lectures on Partial Differential Equations
Feynman Lectures on Physics Volume 1 Chapter 04
Crowley A Lecture on the Philosophy of Magick
Feynman Lectures on Physics Volume 1 Chapter 13
Feynman Lectures on Physics Volume 1 Chapter 05
Lectures on Language
Feynman Lectures on Physics Volume 1 Chapter 02
Eight Lectures On Yoga
Feynman Lectures on Physics Complete Volumes 1,2,3 1376 pages
Lecture on Symbolism Gurdjieff
Feynman Lectures on Physics Volume 1 Chapter 01
G B Folland Lectures on Partial Differential Equations
Aleister Crowley Eight Lectures On Yoga
Wittgenstein, Ludwig Lectures On Philosophy
Alasdair MacIntyre Truthfulness, Lies, and Moral Philosophers What Can We Learn from Mill and Kant
Books Martial Arts Eight Lectures On Yoga
więcej podobnych podstron