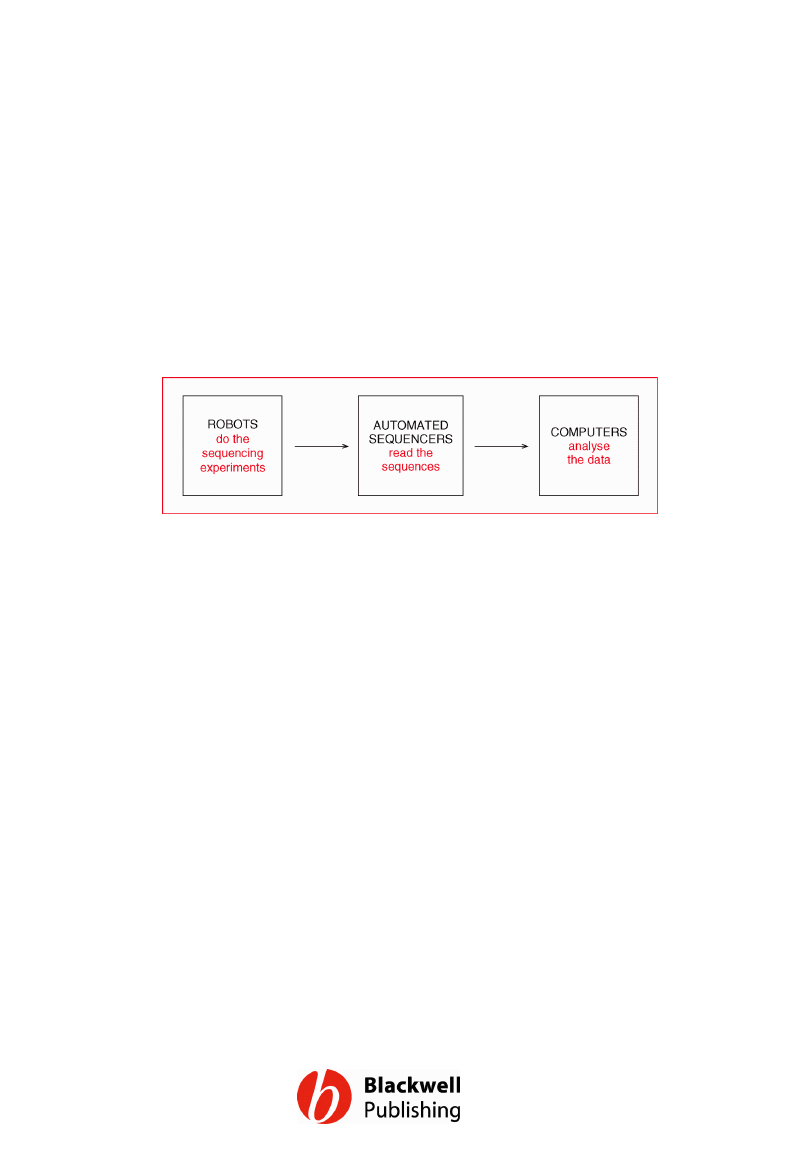
Figure 12.1 The factory approach to large
scale DNA sequencing.
Gene Cloning and DNA Analysis by T.A. Brown. © 2006 T.A.
Brown.
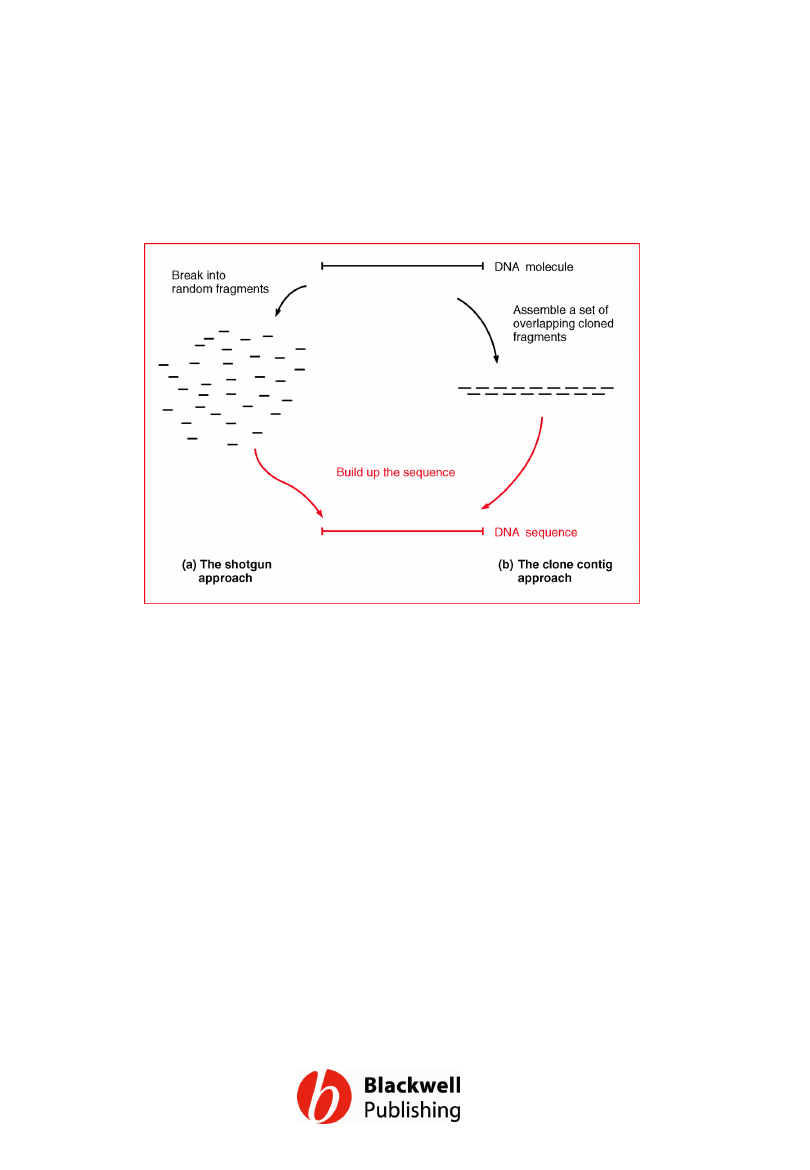
Figure 12.2 Strategies for assembly of a
contiguous genome sequence: (a) the
shotgun approach; (b) the clone contig
approach.
Gene Cloning and DNA Analysis by T.A. Brown. © 2006 T.A.
Brown.
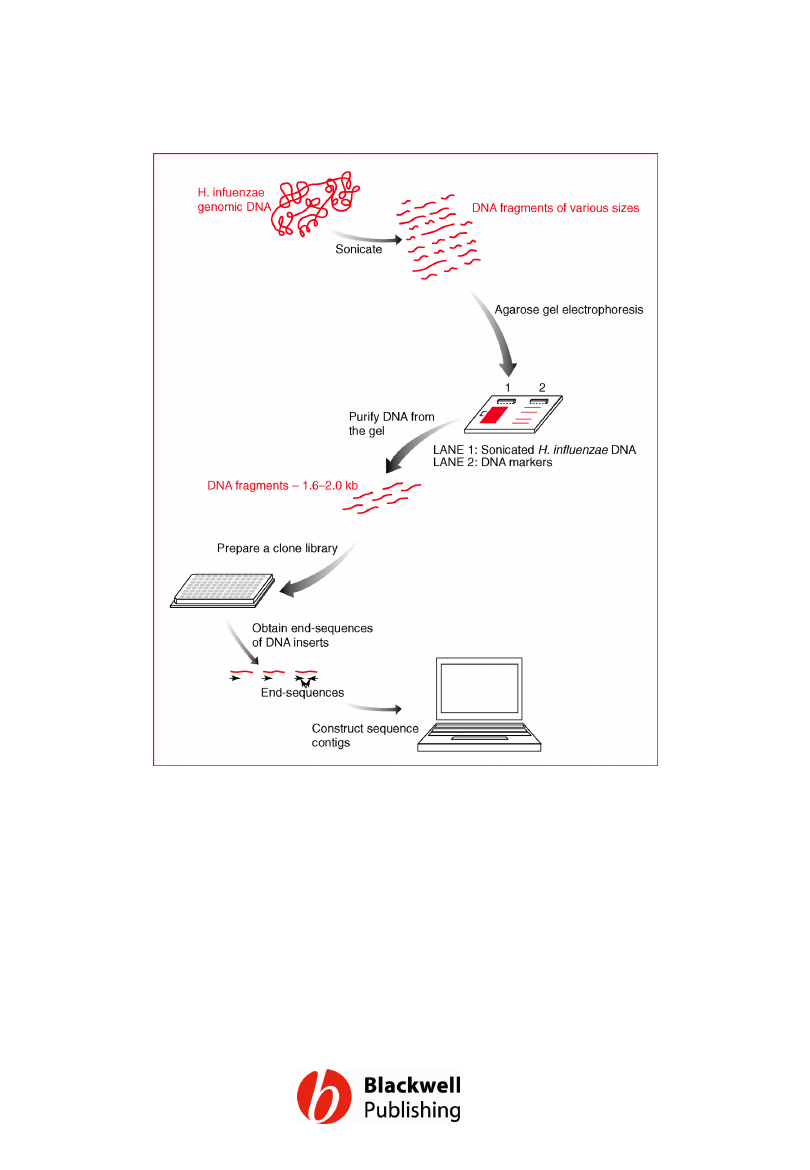
Figure 12.3 A schematic of the key steps in
the H. influenzae genome sequencing project.
Gene Cloning and DNA Analysis by T.A. Brown. © 2006 T.A.
Brown.
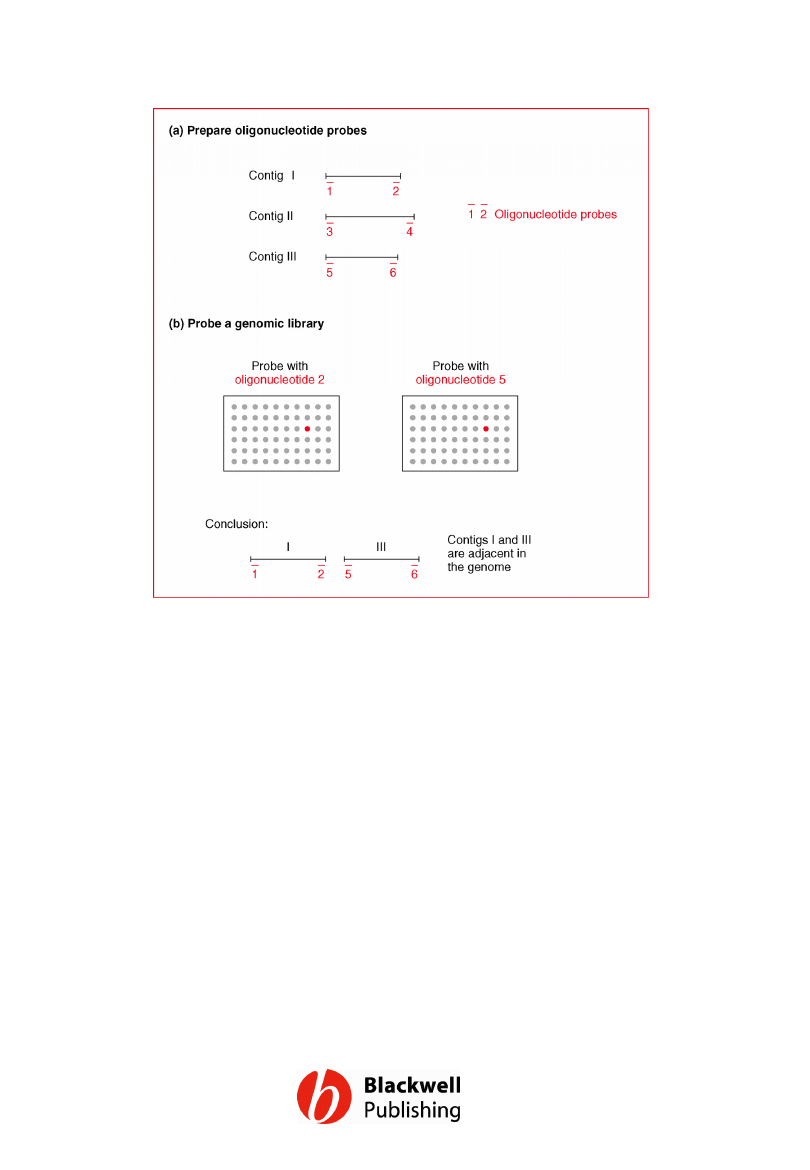
Figure 12.4 Using oligonucleotide
hybridization to close gaps in the H.
influenzae genome sequence.
Oligonucleotides 2 and 5 both hybridize to the
same l clone, indicating that contigs I and III
are adjacent. The gap between them can be
closed by sequencing the appropriate part of
the l clone.
Gene Cloning and DNA Analysis by T.A. Brown. © 2006 T.A.
Brown.
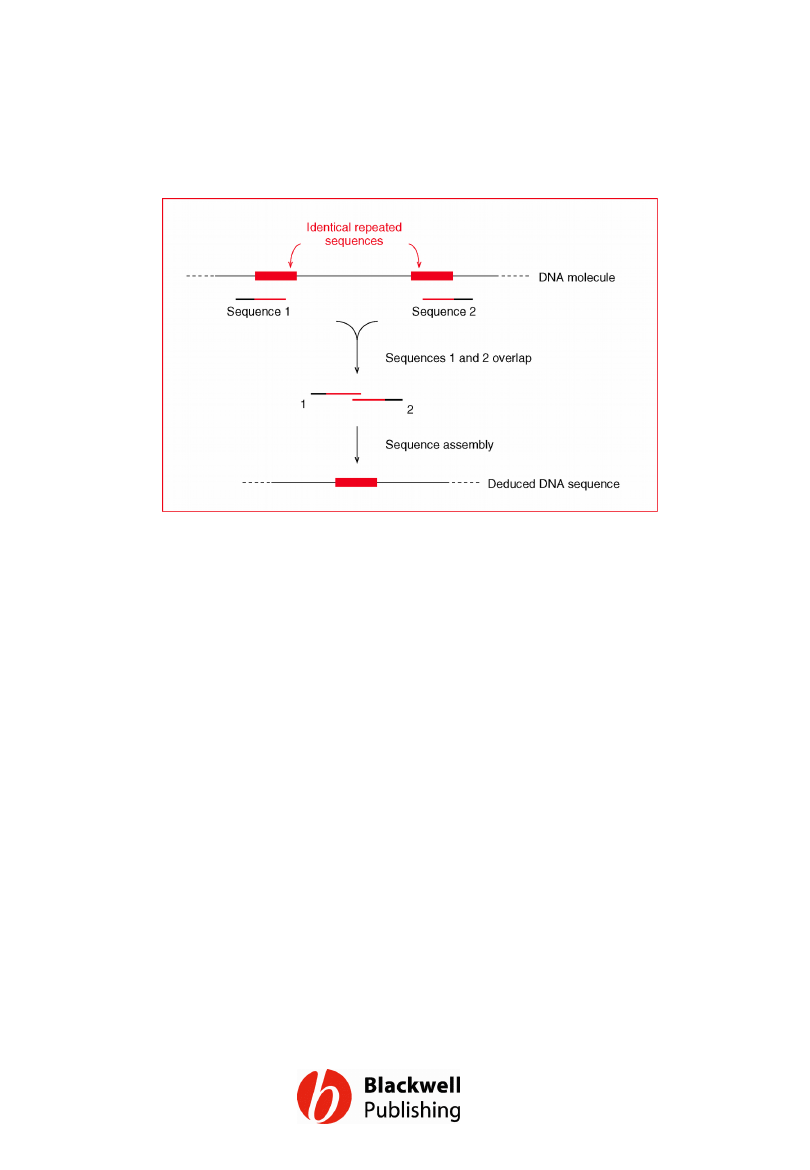
Figure 12.5 One problem with the shotgun
approach. An incorrect overlap is made
between two sequences that both terminate
within a repeated element. The result is that
a segment of the DNA molecule is absent
from the DNA sequence.
Gene Cloning and DNA Analysis by T.A. Brown. © 2006 T.A.
Brown.
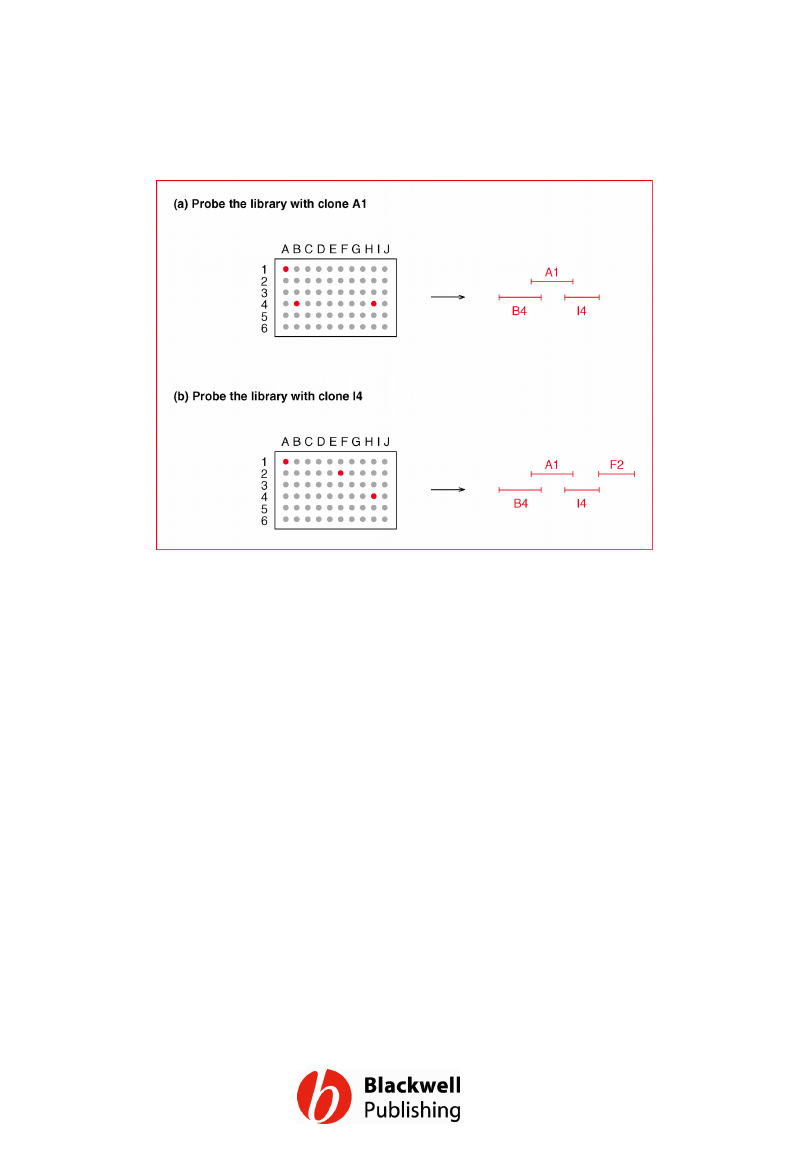
Figure 12.6 Chromosome walking.
Gene Cloning and DNA Analysis by T.A. Brown. © 2006 T.A.
Brown.
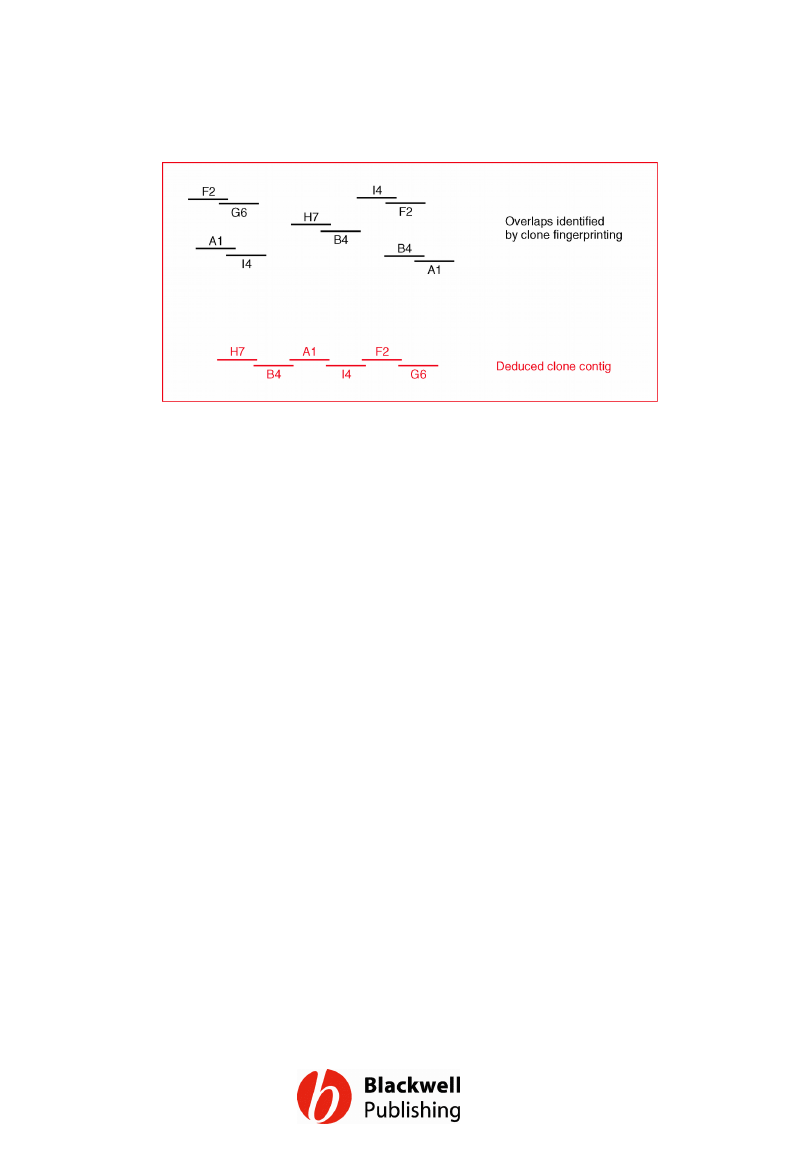
Figure 12.7 Building up a clone contig by a
clone fingerprinting technique.
Gene Cloning and DNA Analysis by T.A. Brown. © 2006 T.A.
Brown.
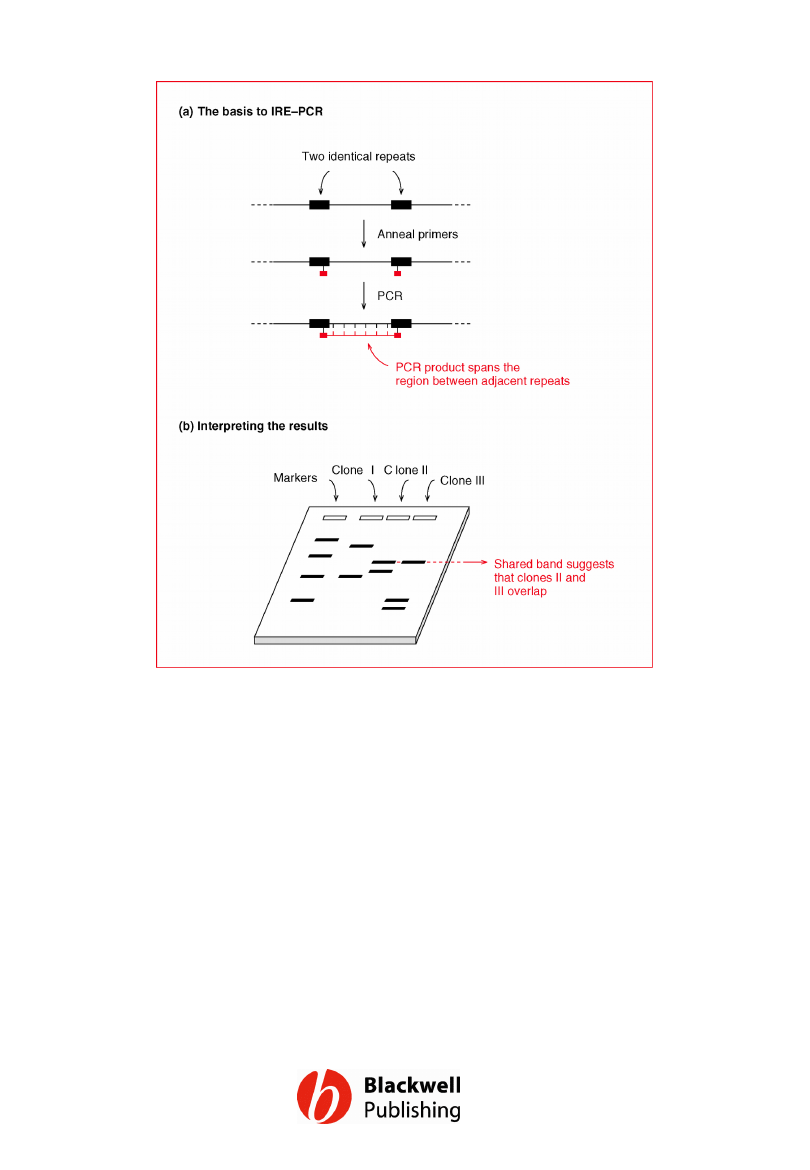
Figure 12.8 Interspersed repeat element
PCR (IRE–PCR).
Gene Cloning and DNA Analysis by T.A. Brown. © 2006 T.A.
Brown.

Figure 12.9 The basis to STS content
mapping.
Gene Cloning and DNA Analysis by T.A. Brown. © 2006 T.A.
Brown.
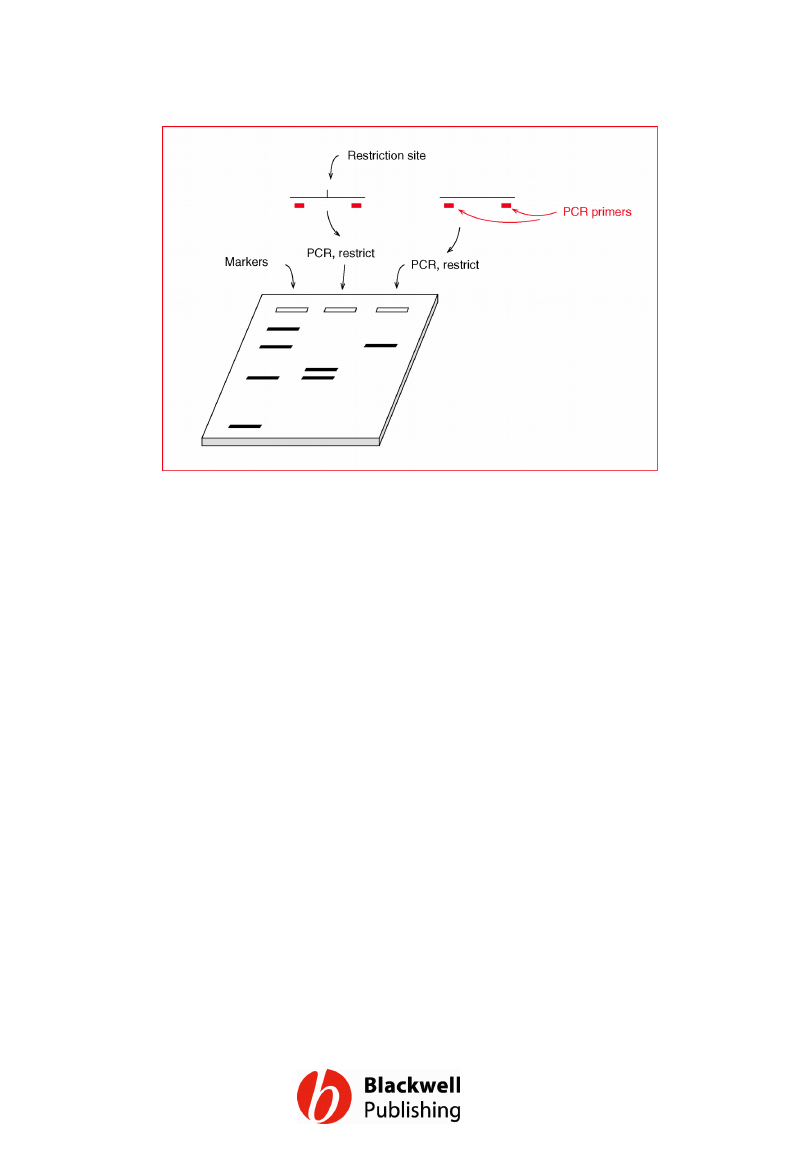
Figure 12.10 Typing a restriction site
polymorphism by PCR. In the middle lane the
PCR product gives two bands because it is cut
by treatment with the restriction enzyme. In
the right-hand lane there is just one band
because the template DNA lacks the
restriction site.
Gene Cloning and DNA Analysis by T.A. Brown. © 2006 T.A.
Brown.
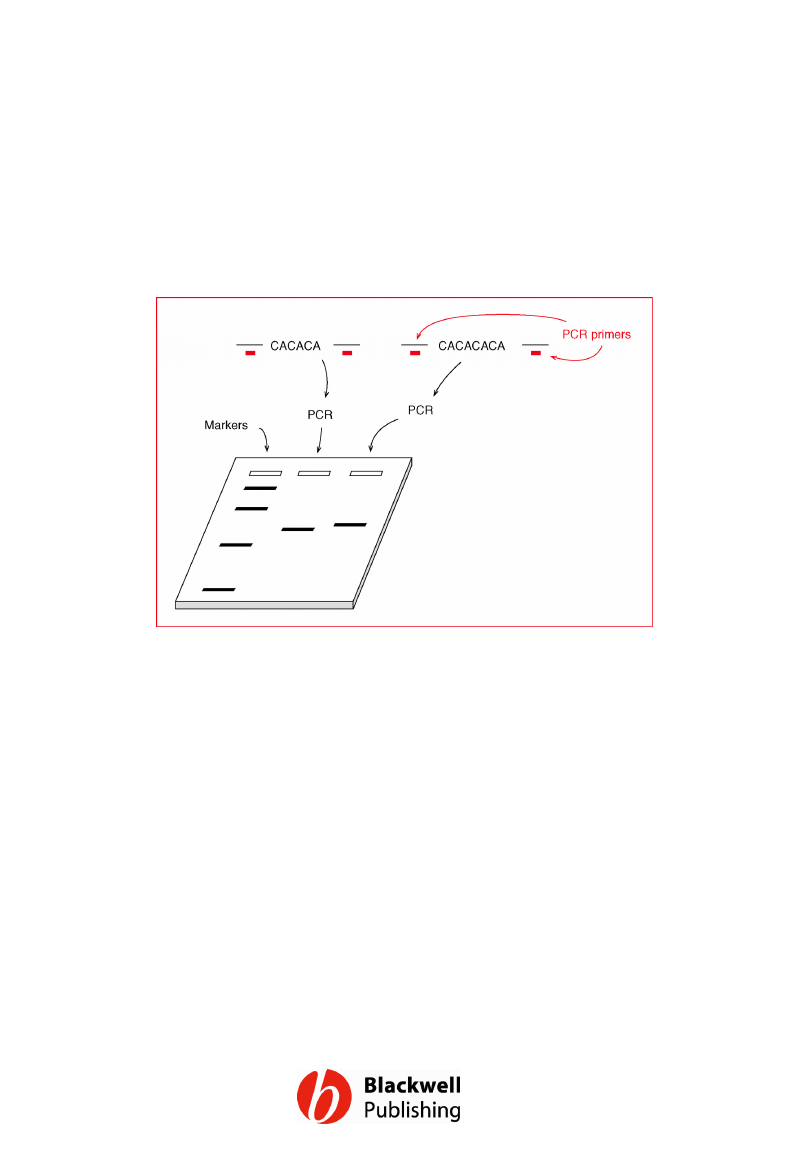
Figure 12.11 Typing an STR by PCR. The PCR
product in the right-hand lane is slightly
longer than that in the middle lane, because
the template DNA from which it is generated
contains an additional CA unit.
Gene Cloning and DNA Analysis by T.A. Brown. © 2006 T.A.
Brown.

Figure 12.12 Two versions of an SNP.
Gene Cloning and DNA Analysis by T.A. Brown. © 2006 T.A.
Brown.
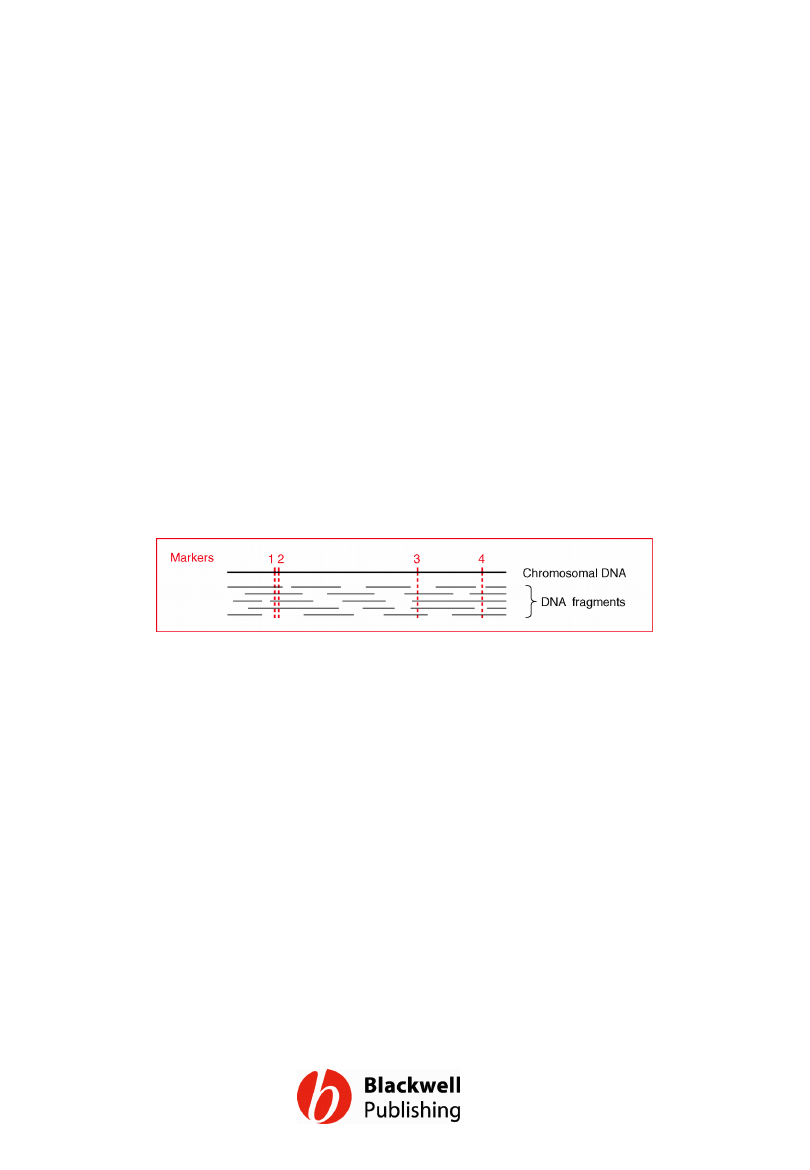
Figure 12.13 The principle behind the use of
a mapping reagent. It can be deduced that
markers 1 and 2 are relatively close because
they are present together on four DNA
fragments. In contrast, markers 3 and 4 must
be relatively far apart because they occur
together on just one fragment.
Gene Cloning and DNA Analysis by T.A. Brown. © 2006 T.A.
Brown.
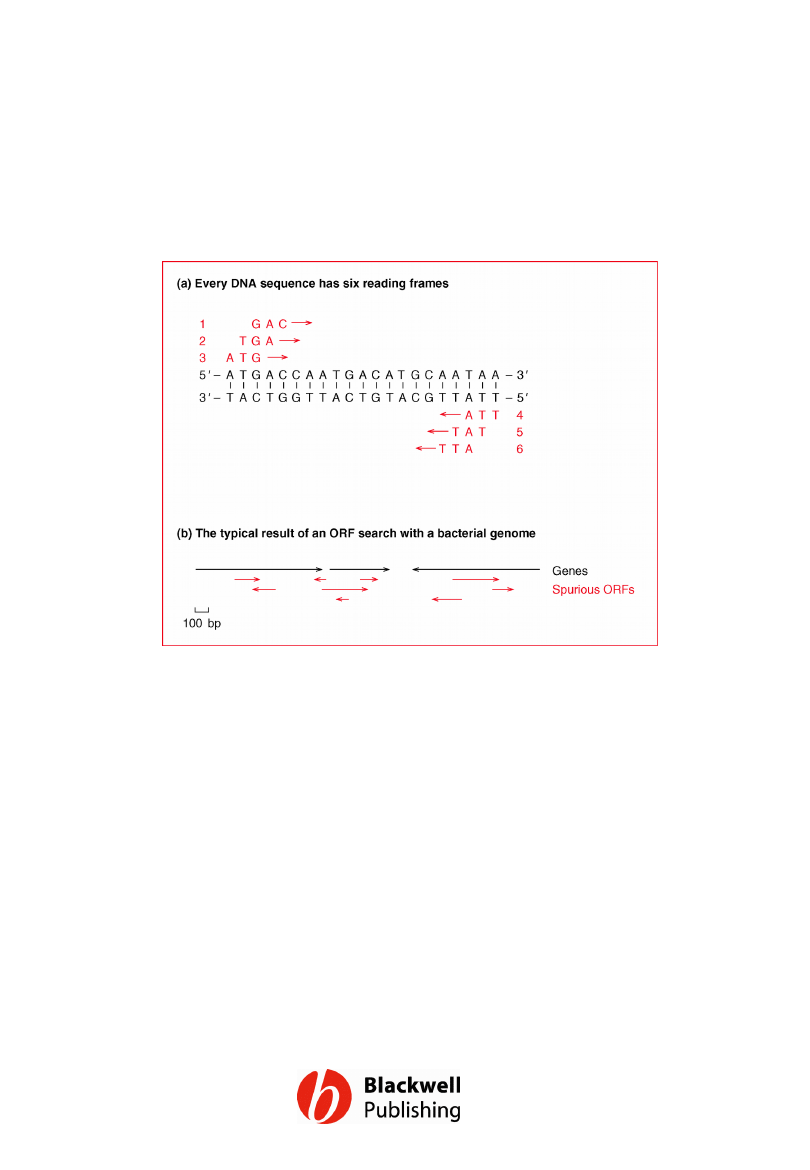
Figure 12.14 Searching for open reading
frames. (a) Every DNA sequence has six open
reading frames, any one of which could
contain a gene. (b) The typical result of a
search for ORFs in a bacterial genome. The
arrows indicate the directions in which the
genes and spurious ORFs run.
Gene Cloning and DNA Analysis by T.A. Brown. © 2006 T.A.
Brown.
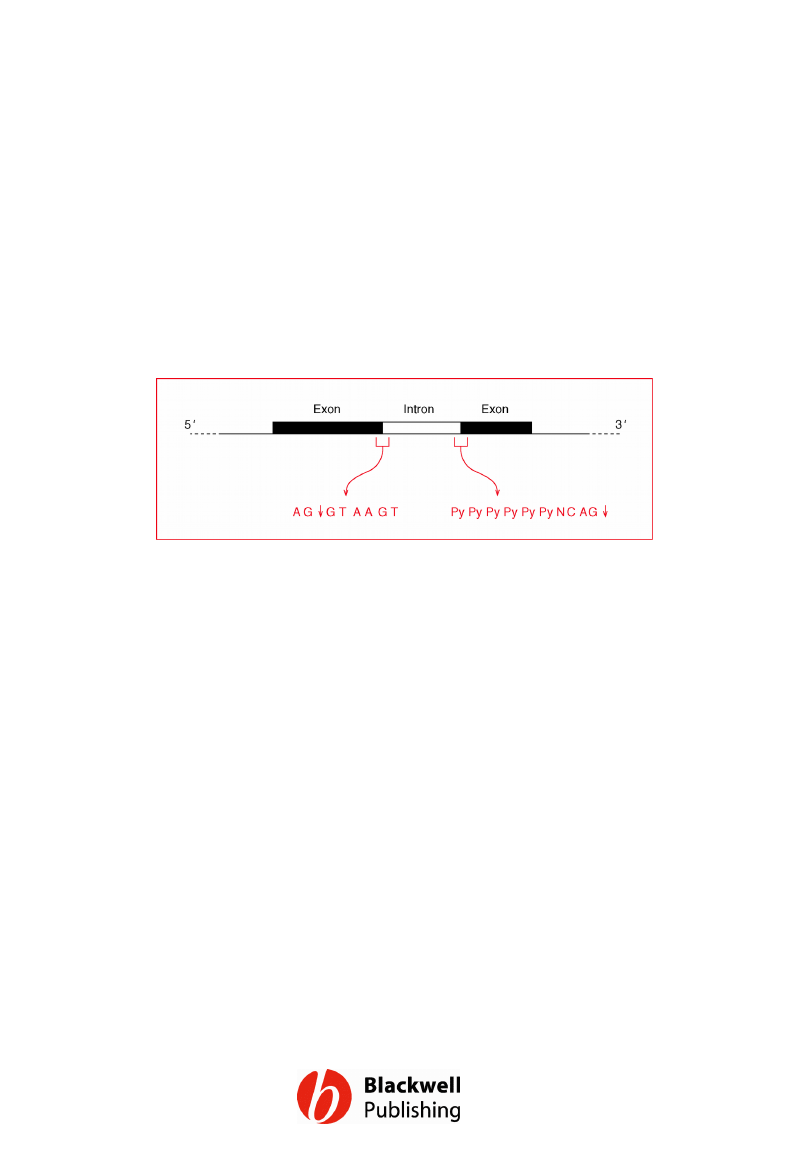
Figure 12.15 The consensus sequences for
the upstream and downstream exon–intron
boundaries of vertebrate introns. Py =
pyrimidine nucleotide (C or T), N = any
nucleotide. The arrows indicate the boundary
positions.
Gene Cloning and DNA Analysis by T.A. Brown. © 2006 T.A.
Brown.

Figure 12.16 Homology between two
sequences that share a common ancestor.
The two sequences have acquired mutations
during their evolutionary histories but their
sequence similarities indicate that they are
homologues.
Gene Cloning and DNA Analysis by T.A. Brown. © 2006 T.A.
Brown.
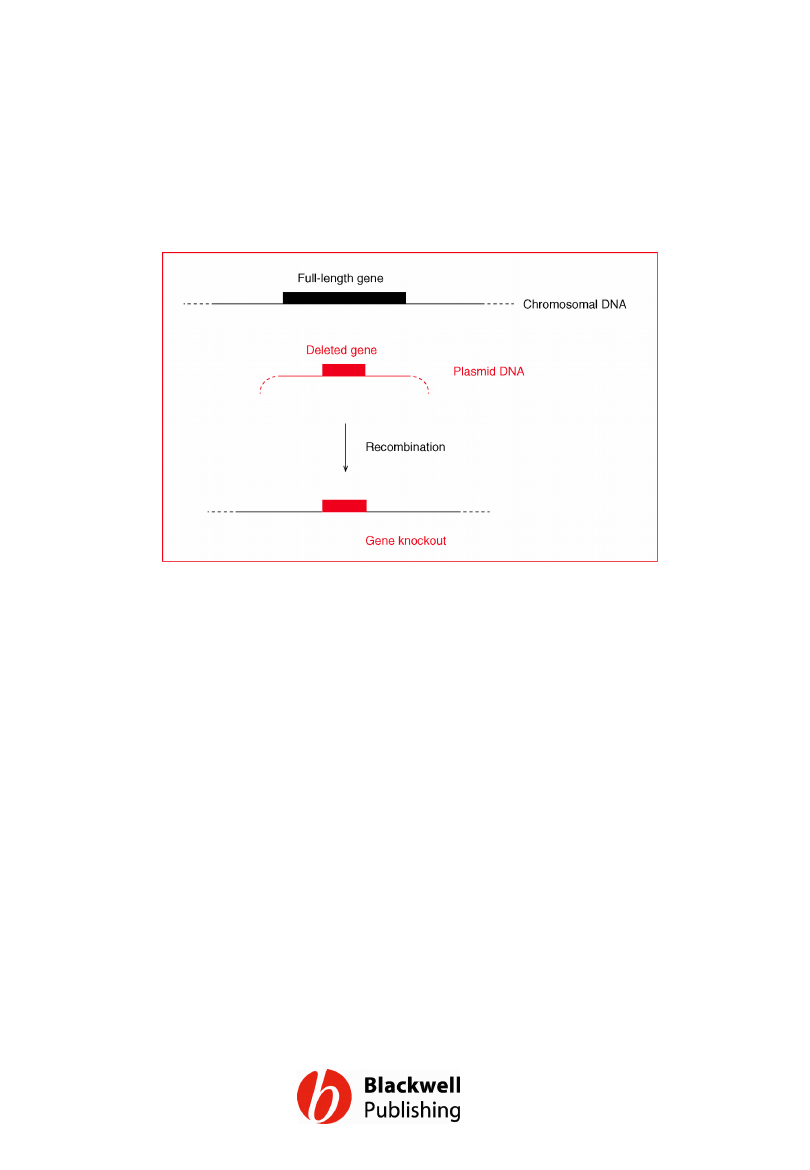
Figure 12.17 Gene knockout by
recombination between a chromosomal copy
of a gene and a deleted version carried by a
plasmid cloning vector.
Gene Cloning and DNA Analysis by T.A. Brown. © 2006 T.A.
Brown.
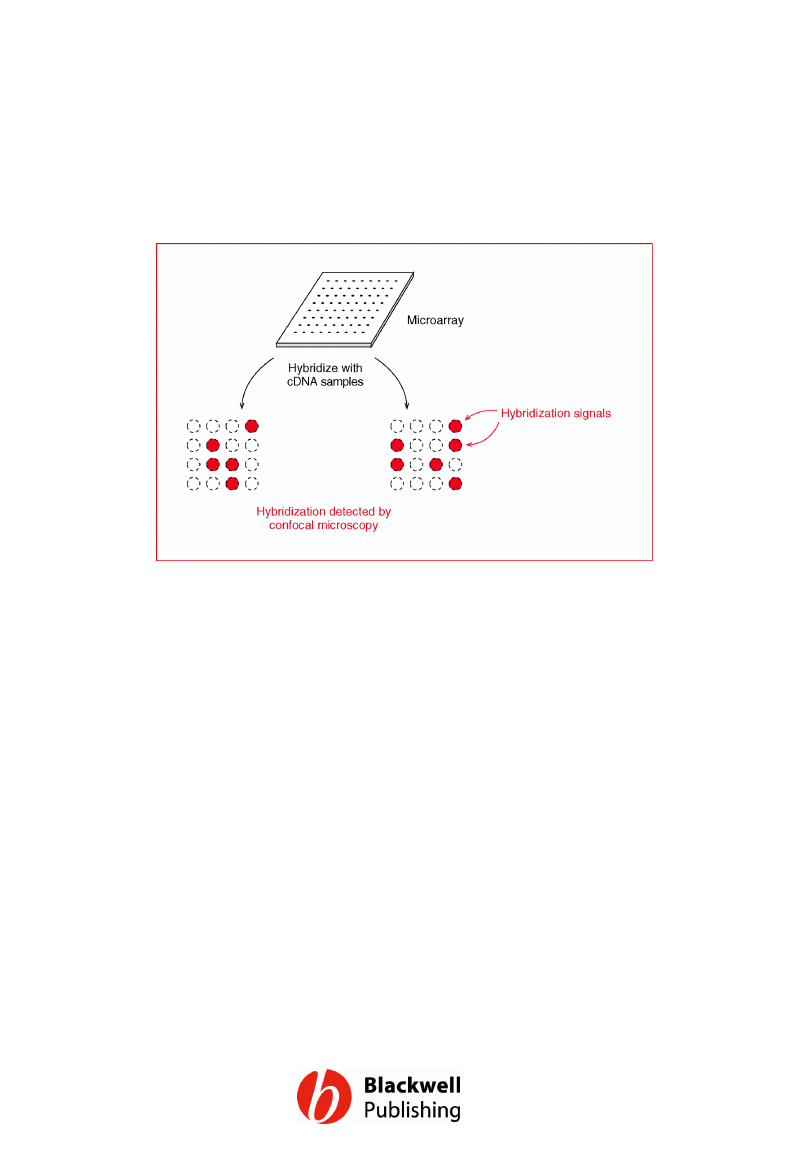
Figure 12.18 Microarray analysis. The
microarray shown here has been hybridized
to two different cDNA preparations, each
labelled with a fluorescent marker. The clones
which hybridize with the cDNAs are identified
by confocal microscopy.
Gene Cloning and DNA Analysis by T.A. Brown. © 2006 T.A.
Brown.
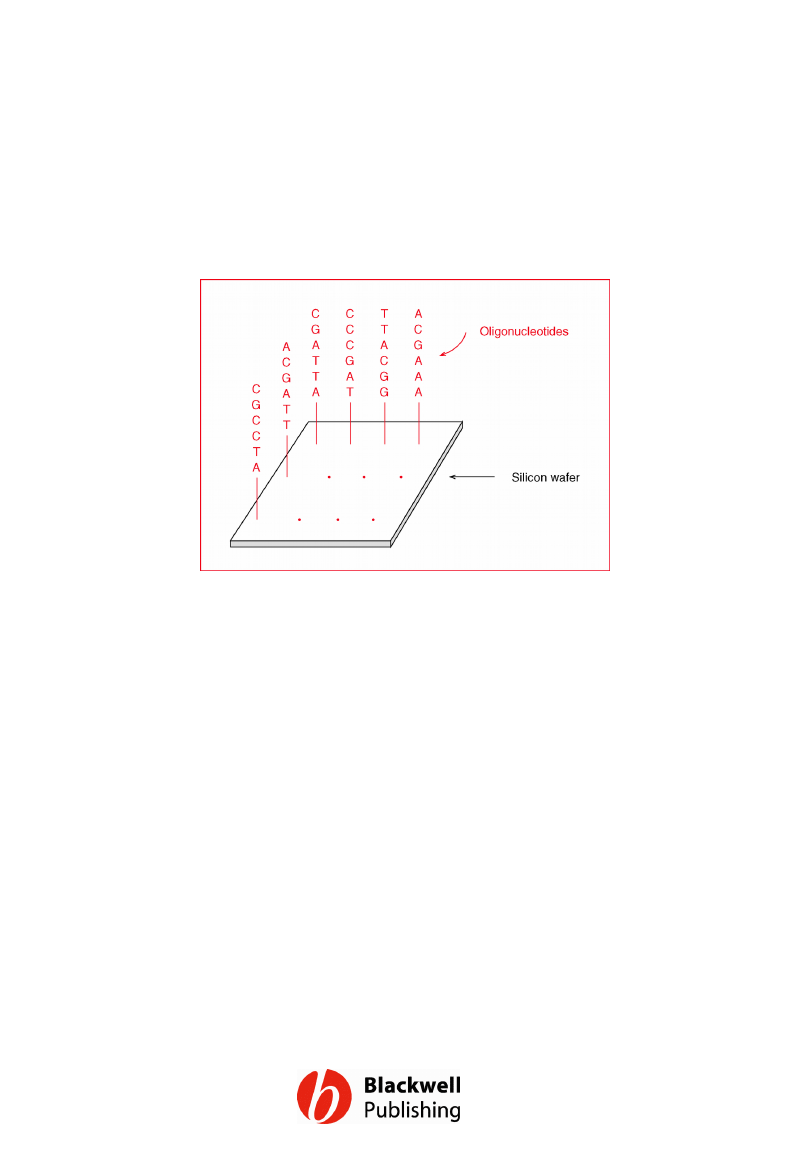
Figure 12.19 A DNA chip. A real chip would
carry many more oligonucleotides than those
shown here, and each oligonucleotide would
be 20–30 nucleotides in length.
Gene Cloning and DNA Analysis by T.A. Brown. © 2006 T.A.
Brown.
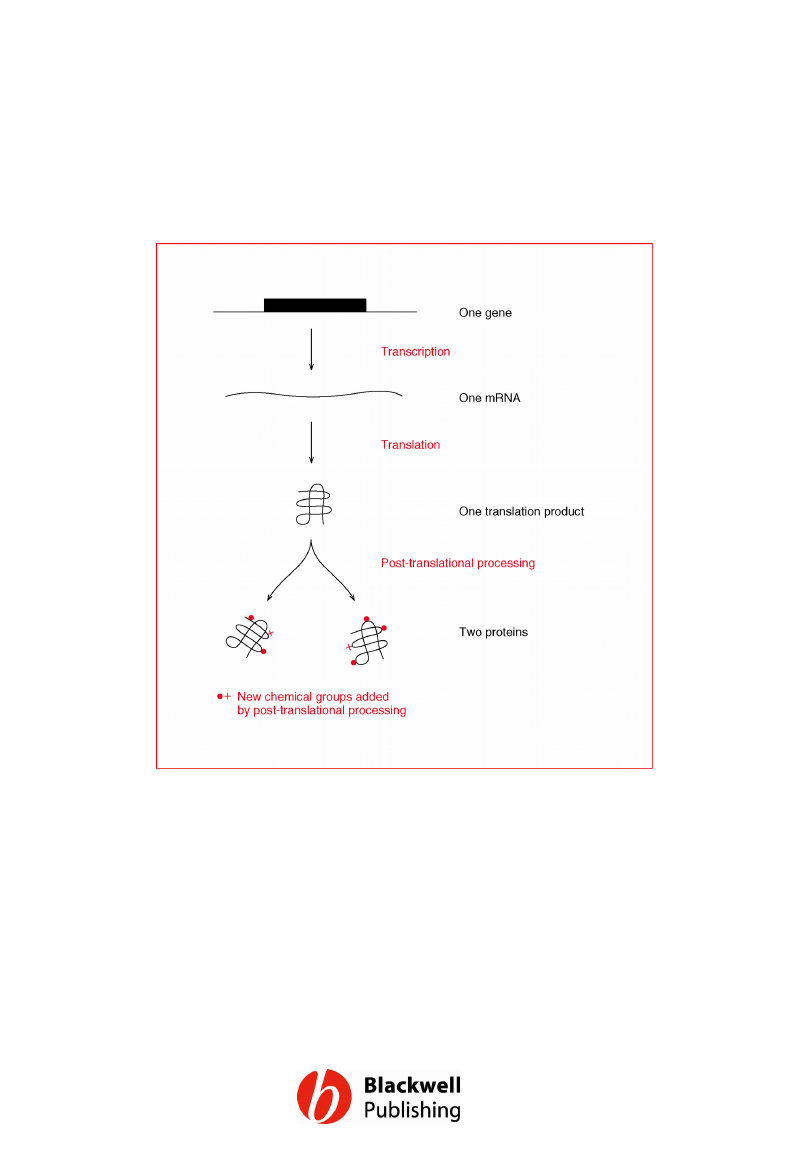
Figure 12.20 A single gene can give rise to
two proteins, with distinct functions, if the
initial translation product is modified in two
different ways by post-translational
processing.
Gene Cloning and DNA Analysis by T.A. Brown. © 2006 T.A.
Brown.
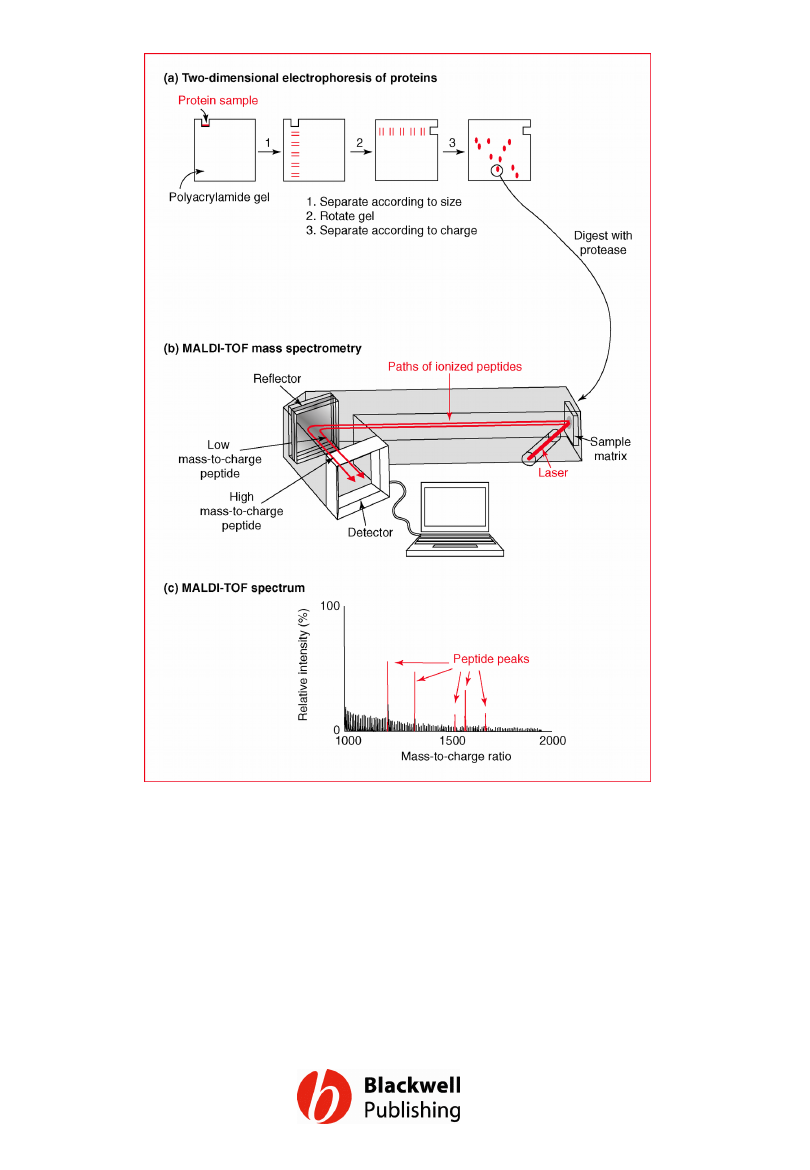
Figure 12.21 Identification of a protein by
two-dimensional electrophoresis followed by
MALDI-TOF mass spectrometry.
Gene Cloning and DNA Analysis by T.A. Brown. © 2006 T.A.
Brown.
Document Outline
- Figure 12.1 The factory approach to large scale DNA sequencing.
- Figure 12.2 Strategies for assembly of a contiguous genome sequence: (a) the shotgun approach; (b) the clone contig approach.
- Figure 12.3 A schematic of the key steps in the H. influenzae genome sequencing project.
- Figure 12.4 Using oligonucleotide hybridization to close gaps in the H. influenzae genome sequence. Oligonucleotides 2 and 5 both hybridize to the same l clone, indicating that contigs I and III are adjacent. The gap between them can be closed by sequencing the appropriate part of the l clone.
- Figure 12.5 One problem with the shotgun approach. An incorrect overlap is made between two sequences that both terminate within a repeated element. The result is that a segment of the DNA molecule is absent from the DNA sequence.
- Figure 12.6 Chromosome walking.
- Figure 12.7 Building up a clone contig by a clone fingerprinting technique.
- Figure 12.8 Interspersed repeat element PCR (IRE–PCR).
- Figure 12.9 The basis to STS content mapping.
- Figure 12.10 Typing a restriction site polymorphism by PCR. In the middle lane the PCR product gives two bands because it is cut by treatment with the restriction enzyme. In the right-hand lane there is just one band because the template DNA lacks the restriction site.
- Figure 12.11 Typing an STR by PCR. The PCR product in the right-hand lane is slightly longer than that in the middle lane, because the template DNA from which it is generated contains an additional CA unit.
- Figure 12.12 Two versions of an SNP.
- Figure 12.13 The principle behind the use of a mapping reagent. It can be deduced that markers 1 and 2 are relatively close because they are present together on four DNA fragments. In contrast, markers 3 and 4 must be relatively far apart because they occur together on just one fragment.
- Figure 12.14 Searching for open reading frames. (a) Every DNA sequence has six open reading frames, any one of which could contain a gene. (b) The typical result of a search for ORFs in a bacterial genome. The arrows indicate the directions in which the genes and spurious ORFs run.
- Figure 12.15 The consensus sequences for the upstream and downstream exon–intron boundaries of vertebrate introns. Py = pyrimidine nucleotide (C or T), N = any nucleotide. The arrows indicate the boundary positions.
- Figure 12.16 Homology between two sequences that share a common ancestor. The two sequences have acquired mutations during their evolutionary histories but their sequence similarities indicate that they are homologues.
- Figure 12.17 Gene knockout by recombination between a chromosomal copy of a gene and a deleted version carried by a plasmid cloning vector.
- Figure 12.18 Microarray analysis. The microarray shown here has been hybridized to two different cDNA preparations, each labelled with a fluorescent marker. The clones which hybridize with the cDNAs are identified by confocal microscopy.
- Figure 12.19 A DNA chip. A real chip would carry many more oligonucleotides than those shown here, and each oligonucleotide would be 20–30 nucleotides in length.
- Figure 12.20 A single gene can give rise to two proteins, with distinct functions, if the initial translation product is modified in two different ways by post-translational processing.
- Figure 12.21 Identification of a protein by two-dimensional electrophoresis followed by MALDI-TOF mass spectrometry.
Wyszukiwarka
Podobne podstrony:
Figures for chapter 5
Figures for chapter 6
Figures for chapter 14
Figures for chapter 10
Figures for chapter 11
Figures for chapter 8
Figures for chapter 9
Figures for chapter 2
Figures for chapter 16
Figures for chapter 13
Figures for chapter 3
Figures for chapter 7
Figures for chapter 15
Figures for chapter 1
Figures for chapter 5
Figures for chapter 6
Figures for chapter 14
Figures for chapter 10
więcej podobnych podstron