
Application of Magnetic Resonance Spectroscopy in the Mental Diseases of Schizophrenia
and Autism
Dick J Drost
1
,
Peter Williamson
2
, Rob Nicolson
2
1
Departments of Medical Imaging and Medical Biophysics, University of Western Ontario, London, Ontario, Canada
drost@lawsonimaging.ca
2
Department of Psychiatry, University of Western Ontario, London, Ontario, Canada,
williams@uwo.ca
,
rnicolso@uwo.ca
Abstract
Magnetic Resonance Imaging (MRI) employs a strong static magnetic field, time changing magnetic fields and RF fields
to produce diagnostic images whose grey levels represent the MR signal from hydrogen nuclei in tissue water molecules and
hydrocarbon chains (fat). MRI can also been done with MR signals from hydrogen nuclei attached to other molecules, for
example, neurotransmitters (Glutamate and GABA). Because these are present in only mM concentrations in the brain versus 100
M for tissue water, the resulting low signal to noise limits the spatial and temporal resolution below diagnostic requirements in
individuals, but is sufficient for measuring biochemical abnormalities in psychiatric diseases in patient versus control groups. MR
signals can also be measured from other nuclei with magnetic moments such as
31
P,
13
C, and
23
Na. Because these nuclei have a
weaker MR signal per nucleus than
1
H, the spatial and/or temporal resolution is much poorer.
Introduction
Two psychiatric diseases, Schizophrenia
1
and Autism
2
, are both lifelong, incurable diseases each afflicting about 1% of
the population. Schizophrenia symptoms include auditory and visual hallucinations, lack of motivation, and decreased high level
reasoning (the movie: A Beautiful Mind). Autism symptoms include restricted and repetitive behaviour, poor social interaction,
and below average IQ, especially verbal IQ. While both diseases are likely present at birth, schizophrenia symptoms typically
begin in the late teens or early twenties while autism is usually detected before the child begins school. Since drug treatments and
therapy only control some of the symptoms, patients usually cannot function in a complex society degrading personal and family
lives plus costing society billions of dollars/year in medical costs and lost productivity. Both of these diseases are classified as
brain development disorders and have a genetic component, but there is no single schizophrenia or autism gene and most theories
assume there are in uterus environmental factors. The cause or even what has gone wrong during brain development is unknown
although many theories exist. With this lack of knowledge it is difficult to improve drug treatments for symptom control and an
actual cure for either disease is not even at the conceptual stage.
Magnetic resonance has provided a non invasive set of brain measurement techniques to compare psychiatric patients with
matched control subjects. These MR techniques include the following: volumetric MRI, which measures differences in brain
volume/morphology; functional MRI (fMRI), which indirectly measures brain metabolism; quantitative T1 and T2 relaxation time
imaging, which measures changes in the biochemical environment of the water molecules; diffusion tractography imaging (DTI),
which outlines the white matter tracts (wiring) within the brain; and magnetic resonance spectroscopy (MRS), which measures
levels of some brain metabolites such as neurotransmitters. This paper will present some results from MRS measurements in
schizophrenia and autism.
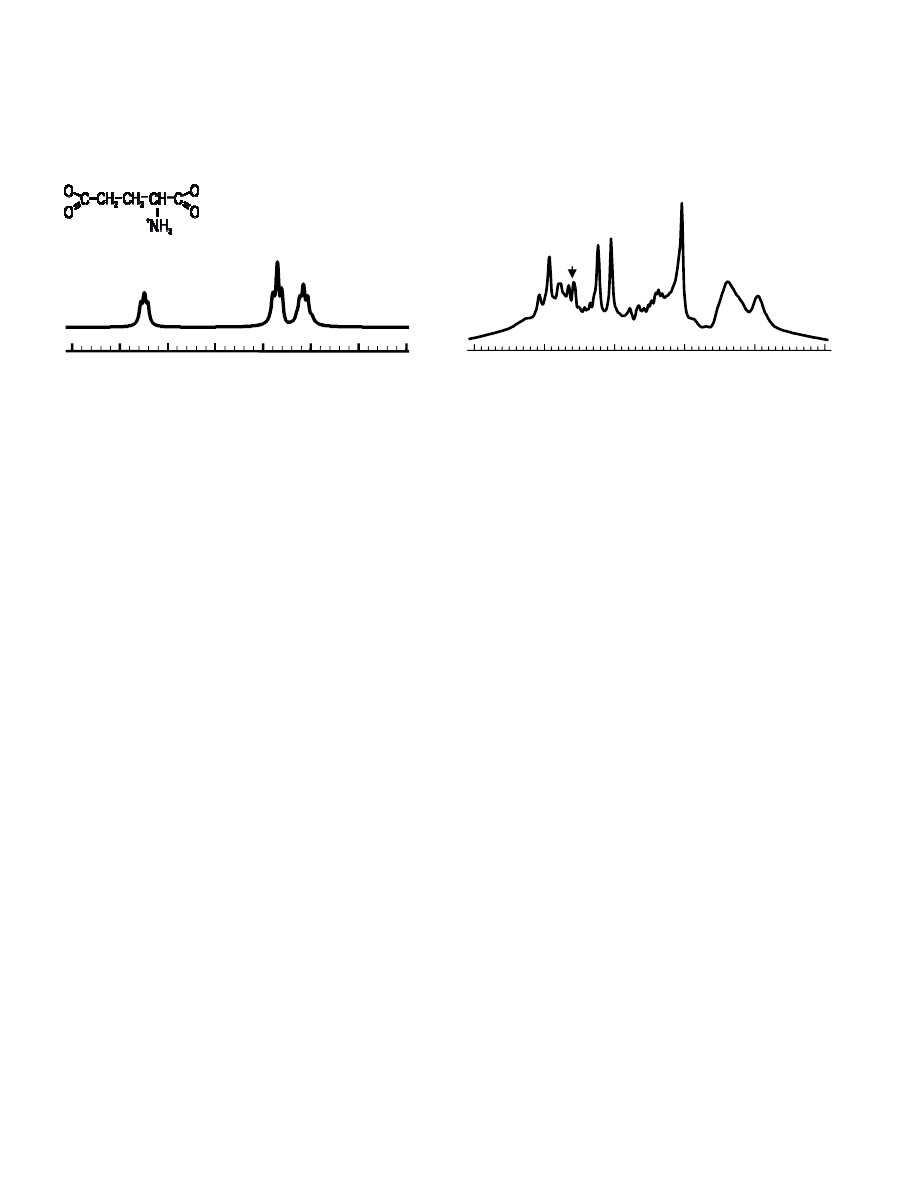
Magnetic Resonance Spectroscopy
Because the magnetic resonant frequency of a nucleus depends linearly on its local magnetic field, the resonant frequency
for each nucleus within a specific molecule will vary depending on the magnetic shielding produced by the bonding electrons
around the molecule. This means that the hydrogen nuclei in each molecule have their own unique magnetic resonance frequency
spectrum as illustrated below for the glutamate molecule. In vivo, this allows the measurement of several metabolites based on
their characteristic frequency signatures: N-acetylaspartate (NAA) considered to be a neuronal integrity marker; glutamate (Glu)
one of the excitatory neuronal transmitters; glutamine (Gln) a precursor for Glu; total creatine (tCr) involved in energy
metabolism; choline (Cho) primarily the sum of glycerolphosphorylcholine and phosphorylcholine, both involved in membrane
metabolism; and myo-inositol (mI) a glial cell marker. Glial cells are part of the supporting structure around brain neurons and
supply neurons with Gln as one of their functions.
One can also acquire in vivo spectra using
31
P, which has a 100% natural abundance in vivo, but like proton metabolites is
only present at a mM concentration in the brain.
31
P metabolites include ATP, phosphocreatine (PCr), inorganic phosphate (Pi),
phosphomonoesters (PME) and phosphodiesters (PDE). ATP, PCr, and Pi are involved in the cell’s energy metabolism. PME and
PDE are the building blocks and break down products of the lipids that compose cell membranes and as such these two metabolites
are involved to cell membrane metabolism (typically, cells renew their membrane ~ once per hour).
Chemical Shift
Glutamate Spectrum
In Vivo Proton Brain Spectrum
Proton in vivo spectra are acquired with the same hardware as required for MR imaging, but require the addition of
software for data acquisition and analysis making proton spectroscopy relatively inexpensive and accessible. Besides software,
phosphorus-31 spectroscopy requires electronics and RF coils that are tuned for a different frequency than that required for MR
imaging of protons. With this additional complexity and expense phosphorus spectroscopy is not as readily available as proton
spectroscopy for research studies. The phosphorus-31 nucleus also has a 15 times lower MR signal than a proton nucleus, which
means that for equal concentrations of nuclei either one has to signal average 225 times more with phosphorus or the spatial
volumes have to be 15 times larger with phosphorus to achieve the same signal to noise as with proton spectroscopy. In practice,
since subjects will not lie still for more than 1.5 hours, this means that the spatial resolution for MR imaging with water protons
(100 M in vivo concentration) is 0.1 mm
3
, with in vivo proton spectroscopy (1-10 mM in vivo concentration) is 1.0 cm
3
, and with
in vivo phosphorus spectroscopy (1-10 mM in vivo concentration) is 15 cm
3
.
Proton MRS in Autism
Twenty six patients ranging in age from 6 to 17 years with clinically diagnosed autism were recruited for this study along
with 29 age matched normal controls. Fourteen of the twenty-six subjects were not being treated with drugs at the time of their
MR scan. Because the total duration of the MR exam including both imaging and spectroscopy required 1.5 hours there was a 25%
drop out rate with the autism group: only 26 out of the original 35 autism subjects finished the study. The study was approved by
the Health Sciences Research Ethics Board at The University of Western Ontario.
Autism patients had a lower verbal IQ than the controls, but the same total IQ since the latter parameter was part of the
recruitment criteria. Autism patients also included more left handed subjects than the control group. Both the lower verbal IQ and
the difference in handedness were expected. Autism patients had a significantly lower NAA in frontal lobe gray matter and
occipital lobe gray matter compared to controls. Autism subjects also had significantly lower Glu + Gln in frontal lobe gray
matter, occipital lobe gray matter, and in the cerebellum. There were no significant differences in metabolite levels between
medicated and non medicated patients.
The reduced cortical gray matter Glx levels seen among patients with autism suggest widespread dysfunction of
glutamatergic neurotransmission in the disorder. Glutamate has an integral role in neurodevelopmental processes, including
neuronal migration, differentiation, axon genesis, and plasticity. Therefore, aberrant glutamatergic functioning early in
development could have significant subsequent effects on brain development. The reduced cerebral gray matter Glu + Gln levels
seen among patients with autism in the present study are also consistent with studies reporting reductions in cortical metabolism or
blood flow in autism. Given the putative status of NAA as a marker of neuronal functional integrity the reductions in cerebral gray
matter NAA seen in patients with autism suggest a reduction in neuronal number, a reduction in neuronal function, or both. As
post-mortem studies of autism have not found reductions in gray matter neuronal density it seems likely that the reduction in
cerebral NAA seen among patients with autism reflects impaired neuronal functioning rather than a reduction in the number of
neurons. Thus, the observed cortical gray matter reduction in NAA suggests widespread cortical dysfunction. Given the close
correlation between NAA synthesis and the energy status of neuronal mitochondria and the strong positive correlations observed in
the present study between the cerebral gray matter concentrations of NAA and Glx for both controls (r=0.9, p <0.00001) and
Chemical Shift
4
3
2
1
2
CH
3
CH
2
4
CH
2
NAA
tCr
Cho
mI
Glu
Gln
5
4
3
2
1
0
patients (r=0.6, p=0.001), the reduced levels of both cortical NAA and Glu + Gln observed in the autism group in this study may be
secondary to impairments in neuronal oxidative metabolism.
Proton and Phosphorus MRS in Schizophrenia
There were two unique features for this MRS study in schizophrenia: both proton and phosphorus MRS data were
collected on the same subjects plus MRS data were collected at several time points over five years. This last feature allowed us to
follow the time course of schizophrenia from the first diagnosed, never treated phase to the chronic phase under continuous drug
treatment.
Sixteen patients experiencing their first episode of schizophrenia and sixteen age and education matched healthy controls
participated in this study. The patients were never treated (NT) before their initial proton and phosphorus MRS scans. They were
also scanned after 10 months (10M) and 60 months (60M). Controls were only scanned twice with the time between the two scans
of approximately 30 months. All data were acquired at 4 Tesla whole body scanner. The proton MRS data were collected from 1.5
cm
3
volumes in the left anterior cingulate and left thalamus. The phosphorus MRS data were collected from the entire brain using
a 3D volume collection with a spatial resolution of 15 cm
3
volumes. Because of the long time duration required for both MRS
studies and the change in RF coil hardware required between proton and phosphorus acquisitions, the data was collected in two
sessions with the subject getting off the MR patient table between the proton and phosphorus sessions. The study was approved by
the Health Sciences Research Ethics Board at The University of Western Ontario.
No significant change was found in any of the proton metabolites on the univariate tests in the anterior cingulate. In the
thalamus significantly decreased levels of NAA, glutamate and creatine were found in the 60M group compared to those in 10M
group (p< .05). Myo-Inositol levels in the 10M group were significantly higher than in the NT patients group (p<0.05). We also
found that the changes in NAA between 10M and 60M in the patients correlated inversely with the length of illness at the last
assessment (r=-0.550, p=0.040, one-tailed, df=11) as well as the changes in glutamate (r=-0.523, p=0.049, one-tailed, df=11) in the
thalamus. NAA and glutamate mainly decreased in the first years of disease. There were no changes (MANCOVA, p > .500) in
proton metabolite levels in the control subjects between their two time point proton MRS measures in the thalamus.
Decreased glutamine level in the thalamus after 60 months of assessment may indicate neuronal degeneration in
schizophrenic patients over the first years of illness. Significantly decreased NAA levels at 60M compared with 10M could also
suggest neuronal loss as NAA is often considered as a marker of neuronal density. A correlation between NAA as well as
glutamate reduction from 10M to 60M and the length of illness suggests that neuronal degeneration happens in the early stage of
schizophrenia.
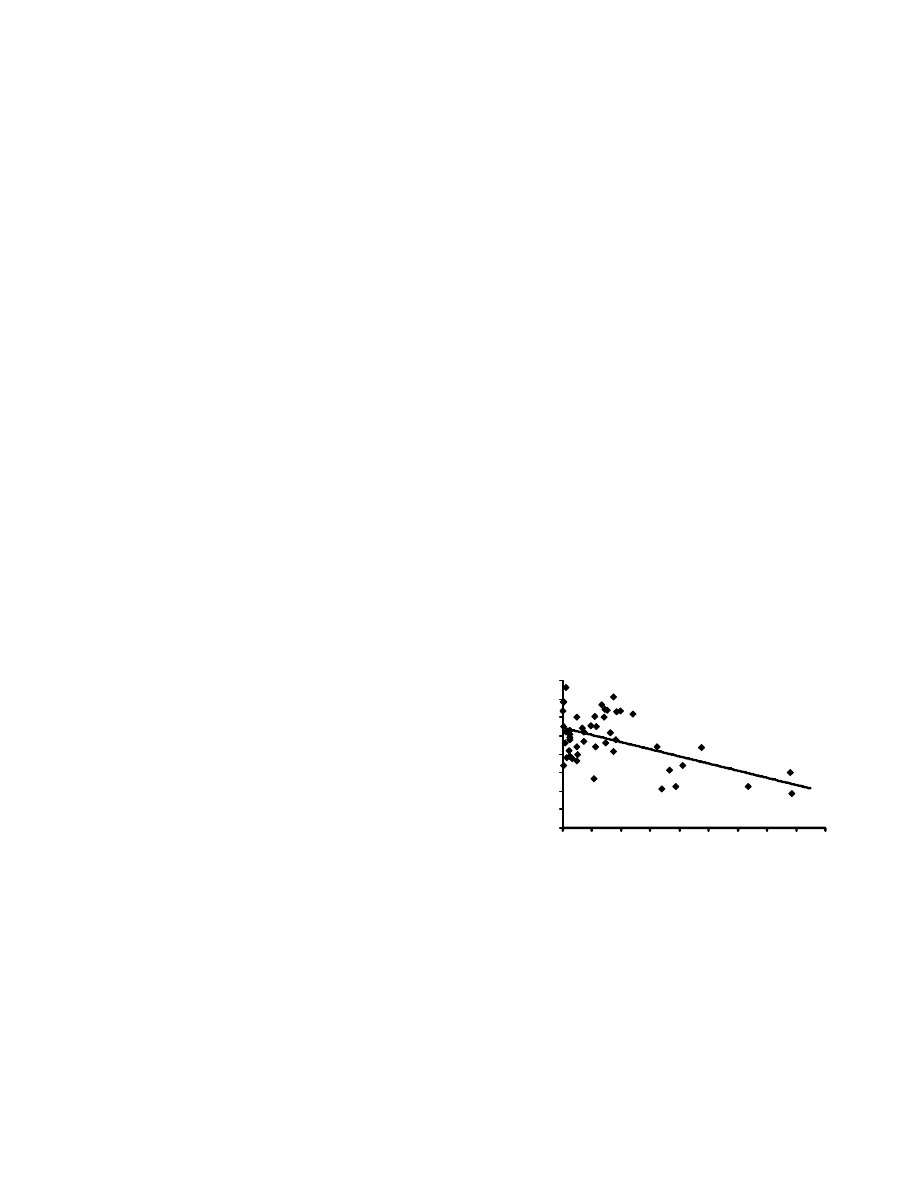
Our phosphorus MRS longitudinal study at the five year time
point revealed a decrease in glycerophosphocholine (GPCh) in the
anterior cingulate in schizophrenia patients as compared to controls (p <
0.05; df = 1.14; F = 6.429) and a decrease in
glycerophosphoethanolamine (GPEth) in the left thalamus in patients
versus controls (p < 0.05; df=1,14; F=6.528). GPCh and GPEth are both
PDE metabolites involved in cell membrane synthesis. There was also a
significant negative correlation of GPCh with length of illness (LOI) in
the anterior cingulate (Pearson correlation and Spearman’s rho p < 0.01,
r
2
= .119). There was no correlation of GPCh with age in either the
control subjects or the patient group nor was there any correlation with
medication in the patient group. Therefore, the decrease in GPCh in the
anterior cingulate supports the proton spectroscopy findings in the same location. This strengthens the interpretation that neuronal
degeneration may occur in the early stage of schizophrenia.
0
0.2
0.4
0.6
0.8
1
1.2
1.4
1.6
0
25
50
75
100
125
150
175
200
225
LOI (months)
GP
C
h
L
ev
el
(
m
M
)
Current
drug
treatments
treat the symptoms, such as hallucinations, however, the patient’s higher level functions, such as
social interactions, continues to degrade with length of illness. Our MRS measurements support this clinical observation. This
implies that if a drug could be found or developed that would stop neuronal degeneration after the initial diagnosis of the disease,
the lives of schizophrenics would be improved.
Acknowledgements
We would like to acknowledge Tim DeVito, Jodi Miller and Naoko Aoyama, the graduate students who did the work and the
financial support of the Canadian Institutes of Health Research and the Autism Society of Ontario.

References
1. DC Javitt and Coyle JT, “Decoding Schizophrenia”, Scientific American, January 2004.
2. Ramachandran VS and Oberman LM, “Broken Mirrors: A Theory of Autism”, Scientific American, November 2006.
Wyszukiwarka
Podobne podstrony:
Applications of magnetic resonance spectroscopy in radiotherapy treatment planning
Proton Magnetic Resonance Spectroscopy of the Medial Prefrontal Cortex in Patients With Deficit Schi
Clinical and neuropsychological correlates of proton magnetic resonance spectroscopy detected metabo
The Application of Domestication and Foreignization Translation Strategies in English Persian Transl
Brain to Serum Lithium Ratio and Age An In Vivo Magnetic Resonance Spectroscopy Study
Brain Proton Magnetic Resonance Spectroscopy
1 Application of Joints and Springs in ANSYS
Knowns and Unknowns in the War on Terror Uncertainty and the Political Construction of Danger Chri
więcej podobnych podstron