Magnetic resonance spectroscopy of limbic structures displays metabolite differences
in young unaffected relatives of schizophrenia probands
Aristides A. Capizzano
, Juana L. Nicoll Toscano
, Beng-Choon Ho
a
Department of Radiology, Division of Neuroradiology, University of Iowa Carver College of Medicine, 200 Hawkins Drive, Iowa City, IA 52242, USA
b
Department of Family Medicine, University of Iowa Carver College of Medicine, 200 Hawkins Drive, Iowa City, IA 52242, USA
c
Department of Psychiatry, University of Iowa Carver College of Medicine, 200 Hawkins Drive, Iowa City, IA 52242, USA
a b s t r a c t
a r t i c l e i n f o
Article history:
Received 1 April 2011
Received in revised form 19 May 2011
Accepted 23 May 2011
Available online 25 June 2011
Keywords:
Adolescence
Endophenotype
Genetics
Magnetic resonance spectroscopy
Hippocampus
Anterior cingulate cortex
Imaging studies of schizophrenia patients showed fronto-temporal brain volume de
ficits, while magnetic
resonance spectroscopy (MRS) studies of patients and unaffected biological relatives have found a decrement
of the neuronal marker N-acetyl-aspartate (NAA) in the hippocampus and frontal lobes, and increased
choline-containing phospholipids. Using a 3 T MR scanner, we determined the metabolite pro
file within
limbic regions (anterior cingulate cortex (ACC) and left hippocampus) of 36 unaffected, adolescent/young
adult relatives of schizophrenia probands (
first-degree=16, second-degree =20) and 25 healthy controls
with no family history of schizophrenia. Signi
ficant main effects of group were found on NAA/Cho ratios for
both the left hippocampus (F = 6.11, p
≤0.02) and ACC (F=4.89, p≤0.03) as well as for the left hippocampus
Cho/Cr ratio (F = 5.55, p
≤0.02). Compared to age and sex matched healthy controls without a family history
of schizophrenia,
first-degree relatives of probands had greater MRS metabolite deviations than second-
degree relatives. Greater familial proximity to the schizophrenia proband (or higher schizophrenia
susceptibility) among biological relatives was associated with stepwise lowering of NAA/Cho and elevations
in Cho/Cr ratios. The observed limbic metabolite changes among young, nonpsychotic biological relatives are
likely related to shared genetic vulnerability factors, and may assist in the early identi
fication of schizophrenia
for primary and secondary prevention.
© 2011 Elsevier B.V. All rights reserved.
1. Introduction
Schizophrenia is conceptualized as a neurodevelopmental familial
disorder with a complex mode of inheritance and variable expression.
Imaging studies of schizophrenia show whole brain and hippocampal
volume de
ficits (
). Magnetic resonance spectroscopy
(MRS) studies show a decrement of the neuronal marker N-acetyl-
aspartate (NAA) in the hippocampus and frontal lobes in schizophre-
nia patients (
Steen et al., 2005; Abbott and Bustillo, 2006
), increased
choline-containing phospholipids (
) and increased
glutamine/glutamate (
). Phosphorous MRS
studies have reported abnormal phospholipid metabolism in schizo-
phrenia (
). Biological relatives of schizophrenia
probands are at higher risk to develop schizophrenia than the general
population. Furthermore, similar but less severe neuroanatomical,
electrophysiological, neurocognitive and behavioral de
ficits have
been demonstrated in relatives compared to controls without a
family history of schizophrenia.
Proton magnetic resonance spectroscopy (
1
HMRS) detects signals
from relevant brain metabolites such as NAA
—a putative neuronal
marker (
)
—lactate (Lac), creatine (Cr),
choline (Cho), myo-inositol (mIn) and glutamate plus glutamine
(Glx). Abnormal
1
HMRS metabolite levels have been reported in a
wide variety of neurologic and psychiatric disorders. Given the
consistent reports of reduced brain NAA in schizophrenia (as re-
viewed in
), it has been hypothesized that
1
HMRS
may also be sensitive to detect the subtle metabolite changes
expected among unaffected biological relatives of schizophrenia
probands. Asymptomatic subjects at genetic risk of schizophrenia
display metabolic differences compared to controls: offspring of
schizophrenia probands have reduced medial frontal NAA/Cho
(
) and increased glutamate/glutamine (
). Signi
ficant reductions in the left hippocampus NAA/Cr
(
) and increased anterior cingulate cortex (ACC)
Glx ratios (
) were also reported in genetic risk
subjects. Also differences in Glx were detected in frontal lobe regions
in schizophrenia relatives (
Purdon et al., 2008; Lutkenhoff et al.,
). On the other hand, early and late at risk state subjects, who
display psychiatric symptoms, demonstrated reduced NAA and
increased choline in the left frontal lobe and anterior cingulate
gyrus (
Schizophrenia Research 131 (2011) 4
⁎ Corresponding author. Tel.: +1 319 384 8795; fax: +1 319 353 6275.
E-mail addresses:
(A.A. Capizzano),
(J.L. Nicoll Toscano),
(B.-C. Ho).
0920-9964/$
– see front matter © 2011 Elsevier B.V. All rights reserved.
doi:
Contents lists available at
Schizophrenia Research
j o u r n a l h o m e p a g e : w w w. e l s ev i e r. c o m / l o c a t e / s c h re s

Such metabolic differences could potentially serve as biomarkers
of disease susceptibility. Therefore, the purpose of this research is to
determine the role of
1
HMRS metabolites in the left hippocampus and
ACC as indicators of schizophrenia vulnerability. Given prior reports of
reduced NAA and increased choline signal in the hippocampus and
the frontal lobe of schizophrenia probands (
et al., 2005; Abbott and Bustillo, 2006
), we hypothesized that NAA to
choline signal ratios would be reduced in the left hippocampus and
ACC among unaffected relatives of schizophrenia patients compared to
healthy age- and sex-matched controls. Only the left hippocampus
was sampled because previous studies in relatives of schizophrenia
probands reported changes in the left cerebral hemisphere (
2006; Purdon et al., 2008; Lutkenhoff et al., 2010
). In addition, we
contrasted
1
HMRS metabolite differences between
first- and second-
degree relatives of schizophrenia probands to further investigate
whether
1
HMRS variables represent markers of familial susceptibility
for the disorder. We hypothesized that the magnitude of
1
HMRS
metabolite abnormalities would vary as a function of familial proximity
to the schizophrenia proband among biological relatives.
2. Materials and methods
2.1. Subjects
The 61 subjects in this study comprised 36 relatives of schizophrenia
probands (
first degree=16, second degree=20) and 25 healthy
normal volunteers (HNV) with no family history of schizophrenia.
After complete description of the study, all subjects provided written
informed consent for participation and the study was approved by the
local IRB. Relatives of schizophrenia probands were recruited either
through 1) schizophrenia patients who have participated in research
studies or have received psychiatric treatment at the University of Iowa
Health Care, or 2) advertisements in local newspapers or mental health
advocacy groups. Inclusion criteria for relatives were age within the age
range at-risk for developing schizophrenia (13 to 25 years), and having
at least one
first- or second-degree relative with schizophrenia. Family
history of schizophrenia was veri
fied using Family History-Research
Diagnostic Criteria (FH-RDC) (
), which has well-
established reliability and validity. Relatives were interviewed using the
SCID-IV (Structured Clinical Interview for DSM-IV), and were excluded
if they had a primary psychotic disorder (schizophrenia, schizophreni-
form disorder, schizoaffective disorder, or delusional disorder), or if they
met criteria for substance abuse or dependence currently or within the
past year. None of the relatives had schizophrenia-spectrum (schizo-
typal, schizoid or paranoid) personality disorders. Eighty percent of the
relatives had no lifetime history of any psychiatric disorders. In the
remaining 7 relatives, psychiatric diagnoses included: attention de
ficit
hyperactivity disorder (2
first- and 1 second-degree relatives); major
depressive disorder (2 second-degree relatives), depressive disorder,
not otherwise speci
fied (1 first-degree relative), and bipolar type II
disorder (1 second-degree relative). HNV without a family history of
schizophrenia were assessed using an abbreviated version of the Com-
prehensive Assessment of Symptoms and History (CASH) (
) to exclude subjects with current or past psychiatric ill-
nesses and substance misuse. FH-RDC was also used to con
firm the
absence of a family history of schizophrenia in HNV. Additional ex-
clusion criteria for all subjects in this study were: neurological disorders,
mental retardation, unstable medical conditions or contraindications
for magnetic resonance imaging (MRI).
2.2. MRI/
1
HMRS studies
All imaging studies were performed in a 3 T MRI scanner (Magnetom
Tim Trio; Siemens) using the manufacturer's 8 channel head coil. The MRI
protocol included the following sequences: 1) coronal T1 3DMPRAGE:
TR/TE/TI= 2530/3.34/1100, 1 NEX,
flip angle=10°, FOV=260 mm,
1.5 mm thick, voxel size=1.4× 1× 1.5 mm, 2) coronal T2 TSE: TR/TE=
5340/14, FOV = 260 mm, 3 mm thick, voxel size = 1.4 × 1 × 3 mm,
3) water suppressed single voxel
1
HMRS (SVS) with PRESS volume
selection centered at the left hippocampus with TR/TE = 3000/30,
128 acquisitions, VOI size = 4.5 cm
3
and 4) water suppressed single
voxel
1
HMRS with PRESS volume selection localized in the midline
including the bilateral ACC with TR/TE = 3000/30, 64 acquisitions, VOI
size= 8 cm
3
. Sequences 3 and 4 were repeated without water sup-
pression with 16 acquisitions. Localized shimming was optimized at the
preparation phase of sequences 3 and 4.
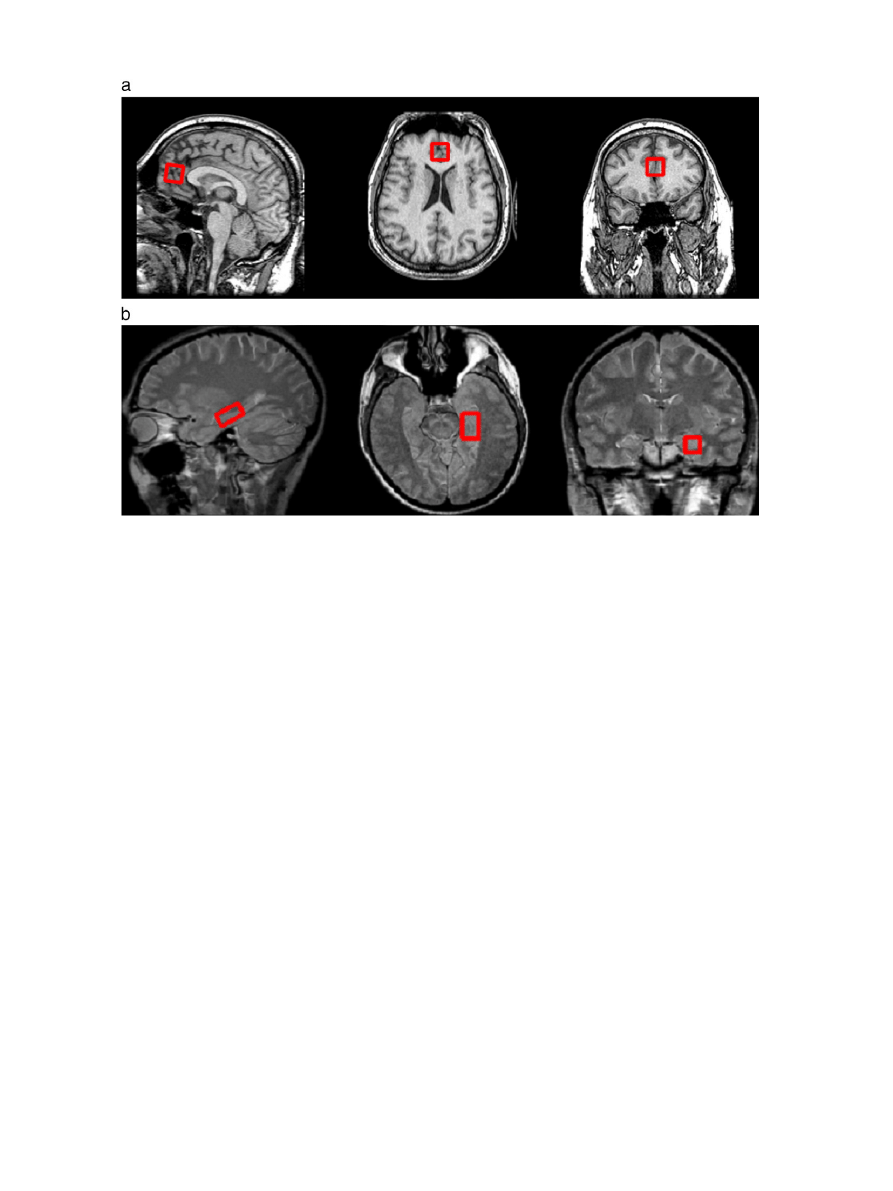
a shows placement of the
left hippocampus voxel and
b shows localization of the ACC voxel.
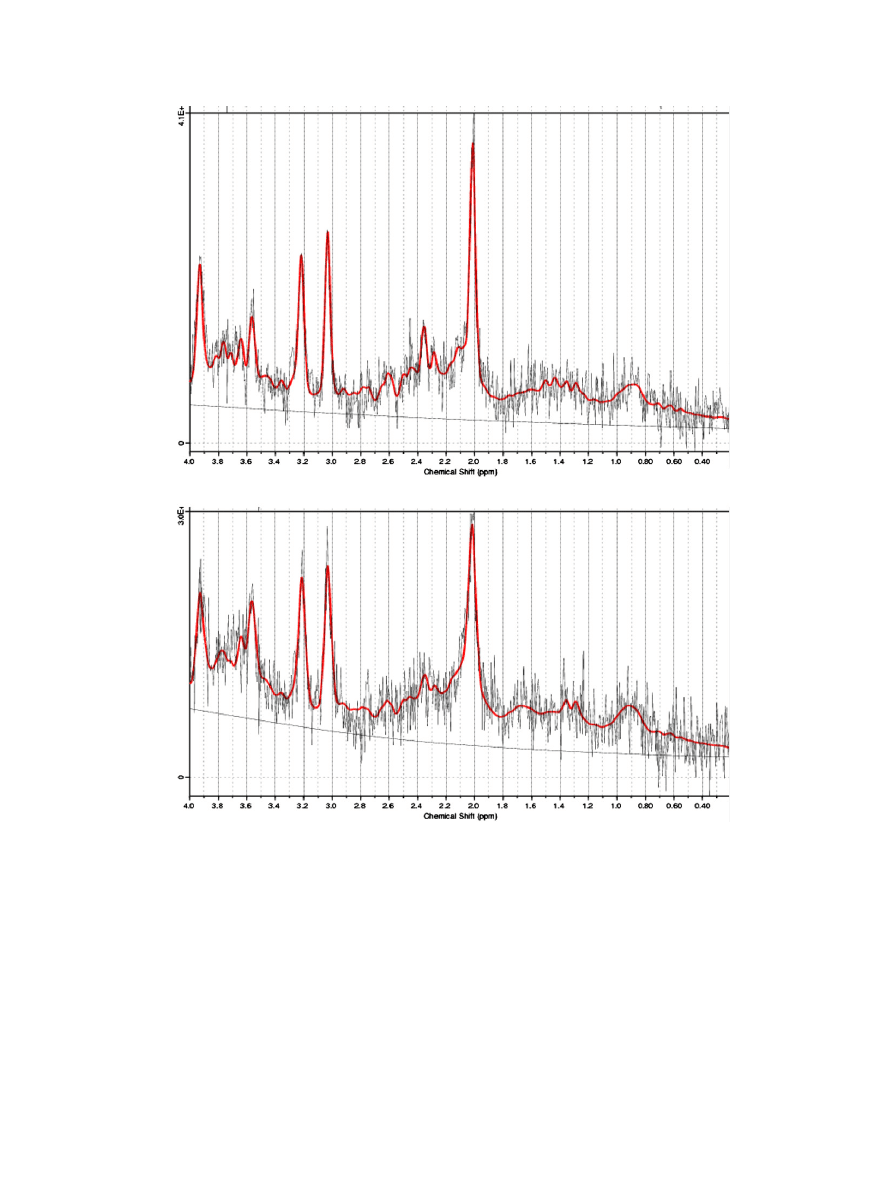
Raw spectroscopy data
files were post processed offline using the
LCModel software (
). The unsuppressed water signal
was used for signal phasing and eddy current correction. Signals from
NAA, Cr, Cho, mIn and glutamate plus glutamine (Glx) were quanti
fied.
Choline signal is automatically corrected for the number of protons (9)
by LCModel, yielding three times lower NAA/Cho ratios as when the
correction is not applied since the methyl NAA and creatine groups have
only 3 protons each. Spectra with full width half maximum (FWHM)
over 0.1 ppm or with SNR of 5 or less as calculated by LCModel were
excluded as well as
fit values with Cramer Rao lower bounds (CRLB) of
20% or higher. Using this methodology, intersubject coef
ficients of
variation for NAA of 9.5% and 5.6% were reported in HNV in the
hippocampus and ACC, respectively (
shows
LCModel output of the left hippocampus and ACC representative spectra.
2.3. Statistical analysis
The relationships between schizophrenia risk and metabolite
signal ratios (i.e. NAA/Cho, NAA/Cr, Glx/Cho, Glx/Cr and Cho/Cr)
were tested using ANCOVA (covariates were age and gender since both
factors are known to affect MRS metabolite values) (
Haga et al., 2009; Maudsley et al., 2009; Raininko and Mattsson, 2010
).
The independent measure was a dummy grouping variable in which
schizophrenia risk was coded as either low (for HNV without a family
history of schizophrenia), intermediate (second-degree relatives
of schizophrenia probands) or high (
first-degree relatives of schizo-
phrenia probands). Next, we conducted pair-wise contrasts across the
3 comparison groups using Cohen's d to assess the magnitude of group
differences. No multiple comparisons correction was done given the
a priori nature of the hypothesis of lower NAA/Cho as a function of
familial proximity to the schizophrenia proband among biological
relatives.
3. Results
3.1. Subjects studied
Sociodemographic features of the participants and metabolite ratios
from the left hippocampus and ACC are summarized in
. There
were no signi
ficant age or gender differences between the 3 comparison
groups (F= 1.18 or
χ
2
= 0.71, p
≥0.28). Total subject count in the study
was 36 relatives and 25 controls. For the left hippocampus, 2 spectra
were excluded in each group for technical reasons, therefore 35
hippocampal spectra from relatives (2nd degree relatives, N = 20; 1st
degree relatives, N = 15) and 24 from controls were used. Since 17
subjects (12 relatives and 5 controls) had the ACC MRS performed with
CSI instead of SVS technique, ACC MRS data for these subjects without
SVS data were excluded from this analysis focused on SVS data.
Therefore, 24 ACC spectra were available for relatives (2nd degree
relatives, N = 12; 1st degree relatives, N = 12) and 20 for controls.
3.2. Comparison of relatives with HNV
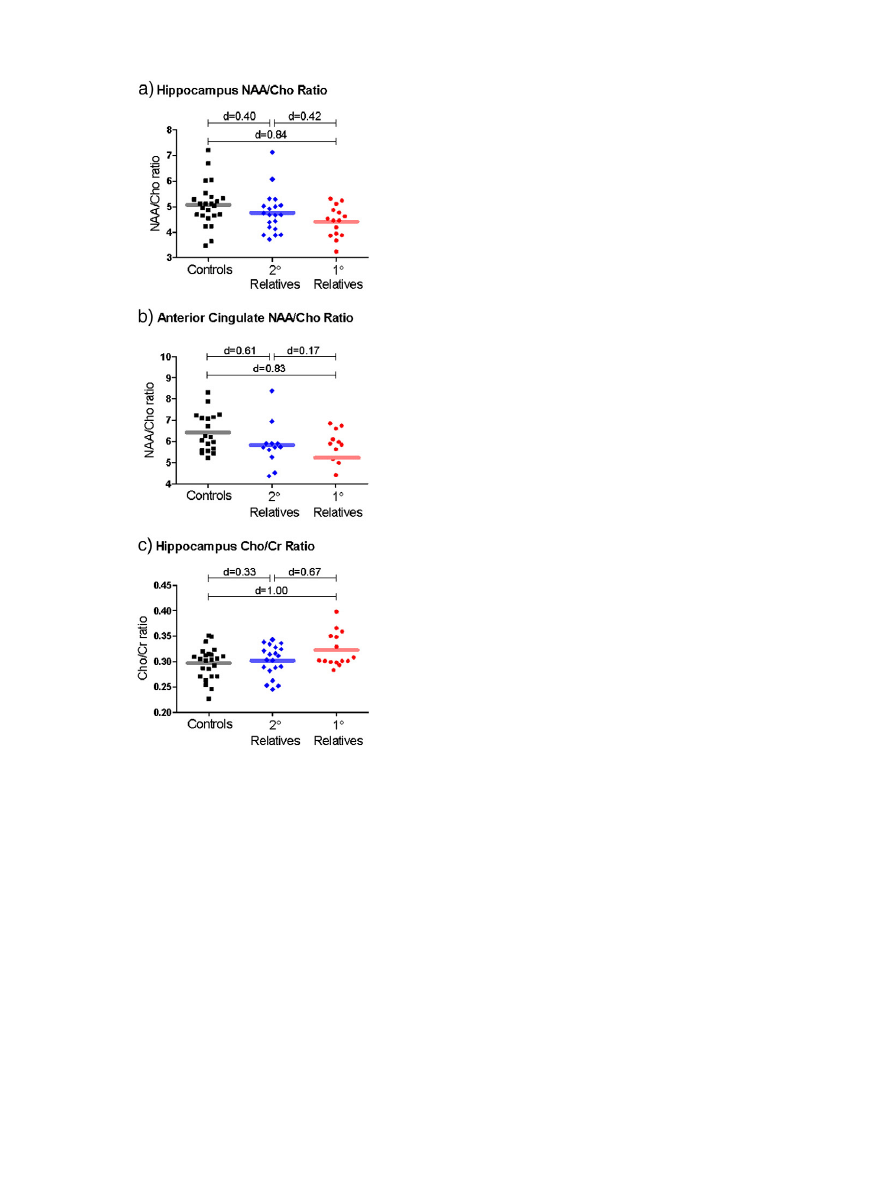
Signi
ficant main effects of group were found on NAA/Cho ratios for
both the left hippocampus and ACC (see
and
). Increased
5
A.A. Capizzano et al. / Schizophrenia Research 131 (2011) 4
–10
schizophrenia risk was associated with stepwise lowering of NAA/Cho
in the left hippocampus (F = 6.11, p
≤0.02) and ACC (F=4.89,
p
≤0.03) and elevation in Cho/Cr in the left hippocampus (F=5.55,
p
≤0.02). Mean NAA/Cho and Cho/Cr levels among second-degree
relatives of schizophrenia probands were intermediate between
metabolite levels of HNV and
first-degree relatives of probands.
Relationships between schizophrenia risk and left hippocampus Glx/
Cho approached but did not achieve statistical signi
ficance (F=3.00,
p = 0.09);
first-degree relatives had lower left hippocampus Glx/Cho.
There were no signi
ficant associations between schizophrenia risk
and the remaining metabolite ratios (F
≤2.65, p ≥ 0.11). These
findings were unchanged when the sample was restricted to rela-
tives without psychiatric diagnoses (i.e. excluding 7 relatives with
psychiatric disorders; results available from authors upon request).
The magnitude of metabolite differences between
first-degree
relatives of schizophrenia probands and HNV was of moderate to
large effect sizes (see
; range of Cohen's d = 0.39 to 1.0;
median = 0.57). First-degree versus second-degree relative metabo-
lite differences were also moderately large (median d = 0.52). In
contrast, metabolite differences between second-degree relatives and
HNV were generally of small to moderate effect sizes (range d = 0.08
to 0.61; median = 0.3). For NAA/Cho ratios, which were signi
ficantly
associated with schizophrenia risk, reductions in
first-degree relatives
compared to HNV were of large effect size (
a and b; d
≥0.83).
Similarly,
first-degree relatives had large effect size elevations in Cho/
Cr ratios compared to HNV (
c; d = 1.0).
4. Discussion
4.1. Summary of results
The main
finding of this study is that susceptibility for schizo-
phrenia is associated with reduced NAA/Cho ratio in the left
hippocampus and ACC, and with increased left hippocampus Cho/Cr
ratio. Increased familial proximity to the schizophrenia proband
among biological relatives correlated with greater magnitude of
1
HMRS metabolite abnormalities. Given that reduced NAA has been
consistently linked with schizophrenia probands, the
1
HMRS metab-
olite abnormalities observed among young, nonpsychotic biological
relatives in this study are likely related to shared genetic vulnerability
factors. Our
findings provide additional support for limbic metabolites
as an intermediate phenotype of schizophrenia potentially useful as
biomarkers for the quanti
fication of schizophrenia susceptibility.
4.2. Limitations
Before discussing these
findings, limitations of this study should be
pointed out. The possibility of inclusion of pre-morbid cases is an
unavoidable limitation given the cross sectional nature of this study. The
lack of
1
HMRS coregistration with segmented MRIs into gray and white
matter and CSF prevented determination of absolute metabolite
concentrations. Therefore, metabolic ratios were used to account for
partial volume effects. Metabolite ratios increase uncertainty since
differences may theoretically be due to change in the numerator and/or
denominator. However, ratios are particularly useful when the con-
stituent metabolites change in different directions, such as the pattern of
increased choline and reduced NAA reported in schizophrenia (
). In this scenario, larger changes are expected in the NAA/Cho
ratio than in either metabolite alone. Furthermore, metabolite ratios are
independent of brain atrophy (
). This is especially
relevant since biological relatives of schizophrenia probands have
smaller frontotemporal brain volumes than HNV, including hippocampal
volume de
ficits (
Nelson et al., 1998; Ho and Magnotta, 2010
4.3. Previous studies
Schizophrenia has been conceptualized as a neurodevelopmental
disorder (
Murray and Lewis, 1987; Weinberger, 1987; Keshavan,
Fig. 1. a: Placement of the VOI for PRES SVS at the left hippocampus. b: Placement of the VOI for PRES SVS at the anterior cingulate cortex.
6
A.A. Capizzano et al. / Schizophrenia Research 131 (2011) 4
–10
). The disorder typically presents
with the
first psychotic episode during late adolescence or early
adulthood. Anatomic studies in schizophrenia support pathologic
changes in limbic structures including the hippocampus and the ACC
as well as the dorsolateral prefrontal cortex and superior temporal
gyrus (
Wright et al., 2000; Honea et al., 2005; Steen et al., 2006;
). In keeping with neuropathological and
imaging studies, NAA de
ficits in gray and white matter of the frontal
lobes and hippocampus are consistently reported in
1
HMRS studies
of schizophrenia probands (
). Biological relatives
of schizophrenia patients are at higher risk to develop schizophrenia
than the general population. Brain structural changes have been
reported in unaffected relatives of schizophrenic subjects, who
displayed increased left ventricular volumes (
)
and reduced volume in the frontotemporal brain and hippocampus
(
Nelson et al., 1998; Ho and Magnotta, 2010
). Recent
1
HMRS studies
reported metabolite differences between unaffected relatives of
schizophrenia proband patients and HNV. Offspring of schizophre-
nia probands have reduced medial frontal NAA/Cho (
) and increased glutamate/glutamine (
)
compared to controls. Reduced metabolic concentrations in relatives
compared to HNV were demonstrated in the striatum (
) and thalamus (
). Moreover, at risk symp-
tomatic subjects demonstrated reduced NAA and increased choline
in the left frontal lobe and ACC (
). Results have
been heterogeneous mainly because of differences in anatomic
regions sampled,
1
HMRS techniques and age of relatives and HNV
included.
Fig. 2. a: LCModel output for spectrum from the anterior cingulate cortex. b: LCModel output for spectrum from the left hippocampus.
7
A.A. Capizzano et al. / Schizophrenia Research 131 (2011) 4
–10

4.4. Metabolic differences between relatives and HNV
In our study, young unaffected 1st and 2nd degree relatives of
schizophrenia probands showed reduced NAA/Cho ratio compared to
HNV in limbic brain regions including the bilateral ACC and the left
hippocampus. The graded increment in NAA/Cho and Cho/Cr effect
sizes corresponding to increased familial proximity to the schizophre-
nia proband among biological relatives suggests that these
1
HMRS
metabolites may be sensitive biomarkers of schizophrenia vulnerabil-
ity. These
findings are thus consistent with
, in
which offsprings of schizophrenia probands showed reduced ACC
NAA/Cho ratios compared to HNV. On the other hand, we did not
find
signi
ficant reductions in the left hippocampus NAA/Cr as reported
previously (
) or increased ACC Glx ratios (
). There was no signi
ficant change in Glx/Cr in relatives of
schizophrenia probands in our study; in contradistinction with two
recent studies of healthy relatives of schizophrenia probands that
sampled different areas of the prefrontal lobe (
) and the left hippocampus (
). Differences in MRS methodology including sequence param-
eters and signal quantitation strategy, anatomical areas explored, and
different study populations may explain con
flicting results.
4.4.1. NAA
The high brain NAA concentration makes the proton NAA signal a
reliable marker in
1
HMRS studies. However, the functional role of NAA
in the brain has been less clear. Several hypothesized functions have
been proposed, including involvement in neuronal osmotic regulation,
N-acetylaspartylglutamate biosynthesis, oligodendrocytic myelin pro-
duction and neuronal energy metabolism (
). Since
NAA is considered a neuronal speci
fic marker in the adult brain (
), reduced NAA suggests neuronal loss or metabolic
impairment (
). In addition, decreased NAA levels
may further re
flect compromised viability of remaining neurons or
abnormal axonal integrity. In schizophrenia, neuronal loss is not a
prominent neuropathological feature (
). Therefore, the
underlying basis for reduced NAA remains uncertain and could re
flect
reduced neuropil and/or neuronal size. Lower NAA in schizophrenia
probands (and by extension their biological relatives) has been thought
to be a marker for neurodevelopmental disruption in neuronal
proliferation, and/or synaptic connectivity and neuroxonal myelin
maintenance (
Keshavan et al., 1997; Jessen et al., 2006
). Furthermore,
NAA/Cho levels in the left hippocampus are modulated by the SNAP-25
genotype (
). The SNAP-25 protein is part of the
neurotransmitter exocytosis machinery and is down-regulated in the
post-mortem hippocampus in schizophrenia and bipolar disorder.
4.4.2. Choline
The observed increment in the left hippocampal Cho/Cr together
with a lower NAA/Cho and an unchanged NAA/Cr suggests that the
lower NAA/Cho may be driven by a higher choline signal in relatives
compared to HNV. Increased choline resonance (consisting mostly
of glycerophosphocholine and phosphocholine) re
flects accelerated
membrane turnover, however, in vivo
1
HMRS is insensitive for dis-
tinguishing among speci
fic choline-containing phospholipid moieties.
Increased choline has been reported in frontal and temporal regions in
schizophrenia patients and at-risk subjects (
O'Neill et al., 2004; Jessen et al., 2006; Shirayama et al., 2009
).
31
PMRS
studies in schizophrenia probands showed differences in concentra-
tion of choline-containing phosphomonoesthers and phosphodiesters
(
) which underlie the change in the choline
proton signal. By combining the likelihood of both NAA and choline
change in a single ratio, such strategy is expected to increase
sensitivity to detect subtle metabolite changes. This is consistent
with previous reports on NAA/Cho differences between schizophrenia
patients and/or their relatives and HNV (
et al., 2000; Jessen et al., 2006
). Furthermore, in clinically-de
fined at
risk groups of symptomatic subjects, NAA/Cho in the ACC was
signi
ficantly reduced among those who converted to schizophrenia
compared to those who did not convert, while there were no
signi
ficant differences in NAA/Cr (
5. Conclusion
The rates of schizophrenia among
first-degree biological relatives
of schizophrenia probands range between ~50% in monozygotic
Table 1
Comparison of sociodemographic characteristics and magnetic resonance spectroscopy metabolite ratios between healthy normal volunteers (HNV) without a family history of
schizophrenia and
first- and second-degree relatives of schizophrenia probands.
HNV (1)
2nd degree (2)
1st degree (3)
χ
2
/F (p)
N
25
20
16
Age (years)
20.23 (2.86)
19.51 (3.06)
19.31 (2.34)
1.18 (0.28)
Males (%)
60.00
55.00
68.75
0.71 (0.70)
Psychiatric diagnosis (%)
0
Mean (SD)
Mean (SD)
Mean (SD)
F (p)
Effect size (Cohen's d)
(1) v (2)
(1) v (3)
(2) v (3)
Left hippocampus
NAA/Cho
5.09 (0.84)
4.76 (0.81)
4.45 (0.62)
6.11 (0.02)
0.40
0.84
0.42
NAA/Cr
1.49 (0.19)
1.43 (0.21)
1.42 (0.16)
1.21 (0.28)
0.30
0.39
0.05
Glx/Cho
6.41 (1.16)
6.52 (1.24)
5.54 (1.29)
3.00 (0.09)
0.09
0.72
0.78
Glx/Cr
1.89 (0.30)
1.96 (0.31)
1.76 (0.30)
0.87 (0.36)
0.23
0.43
0.65
Cho/Cr
0.29 (0.03)
0.30 (0.03)
0.32 (0.03)
5.55 (0.02)
0.33
1.00
0.67
Anterior cingulate
NAA/Cho
6.44 (0.88)
5.87 (1.03)
5.70 (0.91)
4.89 (0.03)
0.61
0.83
0.17
NAA/Cr
1.45 (0.21)
1.37 (0.11)
1.34 (0.16)
2.69 (0.11)
0.44
0.57
0.22
Glx/Cho
9.44 (1.96)
9.01 (2.15)
10.18 (1.53)
0.69 (0.41)
0.21
0.41
0.62
Glx/Cr
2.11 (0.41)
2.08 (0.34)
2.33 (0.32)
2.09 (0.16)
0.08
0.58
0.76
Cho/Cr
0.22 (0.03)
0.24 (0.04)
0.24 (0.02)
1.32 (0.26)
0.29
0.33
0.00
Note: choline signal is automatically corrected for the number of protons (9) by LCModel, yielding three times lower NAA/Cho ratios as when the correction is not applied since the
NAA group has only 3 protons, same as creatine. Bold font indicates statistically signi
ficant findings at pb0.05.
a
2 subjects with major depressive disorder, 1 attention de
ficit hyperactivity disorder, 1 bipolar II disorder.
b
1 depressive disorder, not otherwise speci
fied, 2 attention deficit hyperactivity disorder.
c
Sample size: HNV, N = 24; 2nd degree relatives, N = 20; 1st degree relatives, N = 15.
d
Sample size: HNV, N = 20; 2nd degree relatives, N = 12; 1st degree relatives, N = 12.
8
A.A. Capizzano et al. / Schizophrenia Research 131 (2011) 4
–10
twins, 15% in offsprings, and ~10% among siblings. Second-degree
relatives show lower rates of the disorder (2
–5%). In the current study,
left hippocampus and ACC NAA/Cho ratios and left hippocampus Cho/
Cr ratios in second-degree relatives were intermediate between levels
of HNV and
first-degree relatives. The magnitudes of
1
HMRS
metabolite abnormalities among second-degree relatives compared
to HNV were smaller than those in
first-degree relatives. Such graded
increments in NAA/Cho and Cho/Cr effect sizes corresponding to
increased familial proximity to the schizophrenia proband among
biological relatives suggest that
1
HMRS variables may be sensitive
biomarkers of schizophrenia vulnerability. Further longitudinal
research is warranted to assess the value of these metabolite changes
as predictors of conversion to schizophrenia.
Role of funding source
This research was supported in part by NIMH grant MH68380, a NARSAD
Independent Investigator Award and the Nellie Ball Research Trust. The NIMH had no
further role in the study design; in the collection, analysis and interpretation of data; in
the writing of the report; and in the decision to submit the paper for publication.
Contributors
Author Beng-Choon Ho designed the study, recruited the subjects, performed
statistical analysis and contributed to the discussion and revision of the manuscript.
Author Aristides A. Capizzano set up the imaging protocol, oversaw the technical aspect
of imaging and spectral acquisitions, performed the postprocessing of imaging data,
generated the image database, managed the literature searches and wrote the
first draft
of the manuscript. Author Juana L. Nicoll Toscano performed most of the patient
imaging and spectroscopy studies and collaborated with literature searches and edition
of the manuscript. All authors contributed to and have approved the
final manuscript.
Con
flict of interest
Author Beng-Choon Ho was supported in part by NIMH grant MH68380, a NARSAD
Independent Investigator Award and the Nellie Ball Research Trust. All authors declare
that they have no con
flicts of interest.
Acknowledgments
This research was supported in part by NIMH grant MH68380, a NARSAD
Independent Investigator Award and the Nellie Ball Research Trust. The authors
thank Lindsey Fuhrmeister and Marla Kleingartner for their kind assistance with
imaging data processing and data collection.
References
Abbott, C., Bustillo, J., 2006. What have we learned from proton magnetic resonance
spectroscopy about schizophrenia? A critical update. Current Opinion in Psychiatry
19 (2), 135
–139.
Andreasen, N.C., Endicott, J., Spitzer, R.L., Winokur, G., 1977. The family history method
using diagnostic criteria. Reliability and validity. Archives of General Psychiatry 34 (10),
1229
–1235.
Andreasen, N.C., Flaum, M., Arndt, S., 1992. The comprehensive assessment of
symptoms and history (CASH). An instrument for assessing diagnosis and
psychopathology. Archives of General Psychiatry 49 (8), 615
–623.
Barker, P.B., Bizzi, A., De Stefano, N., Gullapalli, R.P., Lin, D.D.M., 2010. Clinical MR
Spectroscopy Techniques and Applications, 1st ed. Cambridge University Press,
New York.
Birken, D.L., Oldendorf, W.H., 1989. N-acetyl-
L
-aspartic acid: a literature review of a
compound prominent in
1
H-NMR spectroscopic studies of brain. Neuroscience and
Biobehavioral Reviews 13 (1), 23
–31.
Block, W., Bayer, T.A., Tepest, R., Träber, F., Rietschel, M., Müller, D.J., Schulze, T.G.,
Honer, W.G., Maier, W., Schild, H.H., et al., 2000. Decreased frontal lobe ratio
of N-acetyl aspartate to choline in familial schizophrenia: a proton magnetic
resonance spectroscopy study. Neuroscience Letters 289 (2), 147
–151.
Braun, C.M., Boulanger, Y., Labelle, M., Khiat, A., Dumont, M., Mailloux, C., 2002. Brain
metabolic differences as a function of hemisphere, writing hand preference, and
gender. Laterality 7 (2), 97
–113.
Callicott, J.H., Egan, M.F., Bertolino, A., Mattay, V.S., Langheim, F.J.P., Frank, J.A.,
Weinberger, D.R., 1998. Hippocampal N-acetyl aspartate in unaffected siblings of
patients with schizophrenia: a possible intermediate neurobiological phenotype.
Biological Psychiatry 44 (10), 941
–950.
Capizzano, A.A., Jorge, R.E., Acion, L., Magnotta, V., 2006. Reproducibility of short TE MRS
at 3 Tesla: comparison of hippocampal with cingulate spectra. Proceedings of the
XIV Scienti
fic Meeting of the ISMRM.
Demougeot, C., Garnier, P., Mossiat, C., Bertrand, N., Giroud, M., Beley, A., Marie, C., 2001.
N-acetylaspartate, a marker of both cellular dysfunction and neuronal loss: its
relevance to studies of acute brain injury. Journal of Neurochemistry 77 (2),
408
–415.
Fatemi, S.H., Folsom, T.D., 2009. The neurodevelopmental hypothesis of schizophrenia,
revisited. Schizophrenia Bulletin 35 (3), 528
–548.
Haga, K.K., Khor, Y.P., Farrall, A., Wardlaw, J.M., 2009. A systematic review of brain
metabolite changes, measured with
1
H magnetic resonance spectroscopy, in
healthy aging. Neurobiology of Aging 30 (3), 353
–363.
Harrison, P.J., 1999. The neuropathology of schizophrenia: a critical review of the data
and their interpretation. Brain 122 (4), 593
–624.
Ho, B., Magnotta, V., 2010. Hippocampal volume de
ficits and shape deformities in
young biological relatives of schizophrenia probands. NeuroImage 49 (4),
3385
–3393.
Honea, R., Crow, T.J., Passingham, D., Mackay, C.E., 2005. Regional de
ficits in brain
volume in schizophrenia: a meta-analysis of voxel-based morphometry studies.
American Journal of Psychiatry 162 (12), 2233
–2245.
Jessen, F., Scherk, H., Traber, F., Theyson, S., Berning, J., Tepest, R., Falkai, P., Schild, H.H.,
Maier, W., Wagner, M., et al., 2006. Proton magnetic resonance spectroscopy in
subjects at risk for schizophrenia. Schizophrenia Research 87 (1
–3), 81–88.
Keshavan, M.S., 1999. Development, disease and degeneration in schizophrenia: a
unitary pathophysiological model. Journal of Psychiatric Research 33 (6), 513
–521.
Keshavan, M.S., Montrose, D.M., Pierri, J.N., Dick, E.L., Rosenberg, D., Talagala, L.,
Sweeney, J.A., 1997. Magnetic resonance imaging and spectroscopy in offspring at
risk for schizophrenia: preliminary studies. Progress in Neuro-Psychopharmacology
& Biological Psychiatry 21 (8), 1285
–1295.
Keshavan, M.S., Stanley, J.A., Pettegrew, J.W., 2000. Magnetic resonance spectroscopy
in schizophrenia: methodological issues and
findings—part II. Biological Psychiatry
48 (5), 369
–380.
Keshavan, M.S., Dick, R.M., Diwadkar, V.A., Montrose, D.M., Prasad, K.M., Stanley, J.A.,
2009. Striatal metabolic alterations in non-psychotic adolescent offspring at risk for
schizophrenia: a
1
H spectroscopy study. Schizophrenia Research 115 (1), 88
–93.
Fig. 3. Metabolite ratios and Cohen's d effect sizes in the left hippocampus and anterior
cingulate in 1st and 2nd degree relatives of schizophrenia probands and HNV.
9
A.A. Capizzano et al. / Schizophrenia Research 131 (2011) 4
–10

Lutkenhoff, E.S., van Erp, T.G., Thomas, M.A., Therman, S., Manninen, M., Huttunen, M.O.,
Kaprio, J., Lonnqvist, J., O'Neill, J., Cannon, T.D., 2010. Proton MRS in twin pairs
discordant for schizophrenia. Molecular Psychiatry 15 (3), 308
–318.
Maudsley, A., Domenig, C., Govind, V., Darkazanli, A., Studholme, C., Arheart, K., Bloomer,
C., 2009. Mapping of brain metabolite distributions by volumetric proton MR
spectroscopic imaging (MRSI). Magnetic Resonance in Medicine 61 (3), 548
–559.
Moffett, J.R., Ross, B., Arun, P., Madhavarao, C.N., Namboodiri, A.M.A., 2007. N-acetylaspartate
in the CNS: from neurodiagnostics to neurobiology. Progress in Neurobiology 81 (2),
89
–131.
Murray, R.M., Lewis, S.W., 1987. Is schizophrenia a neurodevelopmental disorder?
British Medical Journal (Clinical Research Ed.) 295 (6600), 681
–682.
Nelson, M.D., Saykin, A.J., Flashman, L.A., Riordan, H.J., 1998. Hippocampal volume
reduction in schizophrenia as assessed by magnetic resonance imaging: a meta-
analytic study. Archives of General Psychiatry 55 (5), 433
–440.
O'Neill, J., Levitt, J., Caplan, R., Asarnow, R., McCracken, J.T., Toga, A.W., Alger, J.R., 2004.
1
H MRSI evidence of metabolic abnormalities in childhood-onset schizophrenia.
NeuroImage 21 (4), 1781
–1789.
Provencher, S.W., 2001. Automatic quantitation of localized in vivo
1
H spectra with
LCModel. NMR in Biomedicine 14 (4), 260
–264.
Purdon, S.E., Valiakalayil, A., Hanstock, C.C., Seres, P., Tibbo, P., 2008. Elevated 3T proton
MRS glutamate levels associated with poor continuous performance test (CPT-0X)
scores and genetic risk for schizophrenia. Schizophrenia Research 99 (1
–3), 218–224.
Raininko, R., Mattsson, P., 2010. Metabolite concentrations in supraventricular white
matter from teenage to early old age: a short echo time
1
H magnetic resonance
spectroscopy (MRS) study. Acta Radiologica 51 (3), 309
–315.
Scherk, H., Backens, M., Zill, P., Schneider-Axmann, T., Wobrock, T., Usher, J., Reith, W.,
Falkai, P., Moller, H.J., Bondy, B., et al., 2008. SNAP-25 genotype in
fluences NAA/Cho in
left hippocampus. Journal of Neural Transmission (Vienna, Austria: 1996) 115 (11),
1513
–1518.
Sharma, T., Lancaster, E., Lee, D., Lewis, S., Sigmundsson, T., Takei, N., Gurling, H., Barta,
P., Pearlson, G., Murray, R., 1998. Brain changes in schizophrenia. Volumetric MRI
study of families multiply affected with schizophrenia
—the Maudsley Family Study
5. The British Journal of Psychiatry 173 (2), 132
–138.
Shirayama, Y., Obata, T., Matsuzawa, D., Nonaka, H., Kanazawa, Y., Yoshitome, E.,
Ikehira, H., Hashimoto, K., Iyo, M., 2009. Speci
fic metabolites in the medial
prefrontal cortex are associated with the neurocognitive de
ficits in schizophrenia:
a preliminary study. NeuroImage 49 (2010), 2783
–2790.
Steen, R.G., Hamer, R.M., Lieberman, J.A., 2005. Measurement of brain metabolites by
1
H
magnetic resonance spectroscopy in patients with schizophrenia: a systematic
review and meta-analysis. Neuropsychopharmacology: Of
ficial Publication of the
American College of Neuropsychopharmacology 30 (11), 1949
–1962.
Steen, R.G., Mull, C., McClure, R., Hamer, R.M., Lieberman, J.A., 2006. Brain volume in
first-episode schizophrenia: systematic review and meta-analysis of magnetic
resonance imaging studies. The British Journal of Psychiatry: The Journal of Mental
Science 188, 510
–518.
Tibbo, P., Hanstock, C., Valiakalayil, A., Allen, P., 2004. 3-T proton MRS investigation of
glutamate and glutamine in adolescents at high genetic risk for schizophrenia. The
American Journal of Psychiatry 161 (6), 1116
–1118.
Weinberger, D.R., 1987. Implications of normal brain development for the pathogenesis
of schizophrenia. Archives of General Psychiatry 44 (7), 660
–669.
Wright, I.C., Rabe-Hesketh, S., Woodruff, P.W., David, A.S., Murray, R.M., Bullmore, E.T.,
2000. Meta-analysis of regional brain volumes in schizophrenia. The American
Journal of Psychiatry 157 (1), 16
–25.
Yoo, S.Y., Yeon, S., Choi, C.H., Kang, D.H., Lee, J.M., Shin, N.Y., Jung, W.H., Choi, J.S., Jang, D.
P., Kwon, J.S., 2009. Proton magnetic resonance spectroscopy in subjects with high
genetic risk of schizophrenia: investigation of anterior cingulate, dorsolateral
prefrontal cortex and thalamus. Schizophrenia Research 111 (1
–3), 86–93.
10
A.A. Capizzano et al. / Schizophrenia Research 131 (2011) 4
–10
Document Outline
- Magnetic resonance spectroscopy of limbic structures displays metabolite differences in young unaffected relatives of schiz...
Wyszukiwarka
Podobne podstrony:
Gender and Racial Ethnic Differences in the Affirmative Action Attitudes of U S College(1)
Derrida, Jacques Structure, Sign And Play In The Discourse Of The Human Sciences
Differences in the note taking skills of students with high achievement,
Statistical testing of individual differences in sensory profiling
1H MRSI evidence of metabolic abnormalities in childhood onset shisophrenia
Differences in mucosal gene expression in the colon of two inbred mouse strains after colonization w
Cultural Differences in Television?vertising
Intertrochanteric osteotomy in young adults for sequelae of Legg Calvé Perthes’ disease—a long term
PEAR, Gender Differences In Human Machine Anomalies
Differences In Sexual Harassment
Lateralized Caudate Metabolic Abnormalities in Adolescent Major Depressive Disorder A Proton MR Spec
(autyzm) Hadjakhani Et Al , 2005 Anatomical Differences In The Mirror Neuron System And Social Cogn
Breast and other cancers in 1445 blood relatives of 75 Nordic patients with ataxia telangiectasia
What Curiosity in the Structure The Hollow Earth in Science by Duane Griffin MS Prepared for From
Geographical Differences in Human Oral Yeast Flora
(psychology, self help) 10 Little Things That Can Make a Big Difference in Your Marriage
Cerebral Phosphate Metabolism in First Degree Relatives
więcej podobnych podstron