
Cooperative Automated worm Response and
Detection ImmuNe ALgorithm(CARDINAL)
inspired by T-cell Immunity and Tolerance
Jungwon Kim*, William O. Wilson
†
, Uwe Aickelin
†
and Julie McLeod
‡
*Department of Computer Science, University College London, UK
j.kim@cs.ucl.ac.uk
†
School of Computer Science, University of Nottingham, UK
wow,uxa@cs.nott.ac.uk
‡
Faculty of Applied Science, University of the West England, UK
julie.mcleod@uwe.ac.uk
Abstract.
The role of T-cells within the immune system is to confirm
and assess anomalous situations and then either respond to or tolerate
the source of the effect. To illustrate how these mechanisms can be har-
nessed to solve real-world problems, we present the blueprint of a T-cell
inspired algorithm for computer security worm detection. We show how
the three central T-cell processes, namely T-cell maturation, differen-
tiation and proliferation, naturally map into this domain and further
illustrate how such an algorithm fits into a complete immune inspired
computer security system and framework.
1
Introduction
Self-propogating malicious code represents a significant threat in recent times
as the ability of these programs to spread and infect systems has increased dra-
matically. The recent SQL Slammer worm infected more than 90% of vulnerable
hosts on the Internet within 10 minutes [10], and at its peak the Code-Red worm
infected over 2,000 hosts every minute [11]. Under such a constantly hostile en-
vironment, the traditional manual patching approach to protecting systems is
clearly not effective.
An alternative solution to this problem is to have an automated detection
and response system which could identify malicious self propogation and stop
the spread of the worm as early as possible. Current automated detection and
response systems involve such actions as blocking unsecure ports, dropping po-
tentially threatening packets, and eliminating emails carrying malicious codes,
breaking communication between infected and non-infected hosts to slow down
worm propagation and minimise potential damage [12]. This appears to be a sim-
ple and obvious solution, however there are a number of significant hurdles to
overcome in order to employ such automated responders. The most noteworthy
obstacle is the high false positive error problem [16]. If an automated responder
disconnects communication between two hosts based on a false positive result,

the effect of this inappropriate disconnection could be as bad, if not worse than,
the damage caused by the worm itself.
The objective of this paper is to propose a solution to this problem by tak-
ing inspiration from the Human Immune System (HIS). Previous research into
computer security in the context of Artificial Immune Systems (AIS) has been fo-
cused on detecting unknown intrusions [2] [8]; detecting anomalous events such
as abnormal network traffic patterns or abnormal sequences of system calls.
However the reliability of these systems to handle non trivial problems is still
in question as they have not yet passed tests to indicate that low false positives
are achievable in a real environment [2] [8].
Instead of developing these existing AIS, we propose a novel AIS model that
adopts numerous mechanisms inspired from the differentiation states of T cells.
These differentiation states can be grouped into particular status subsets which
can be used to classify the types of T cell. From these classifications, the various
roles of the diverse T cell types can be seen in terms of their contribution to
the unique aspects of overall immunity and tolerance within the HIS. In this
paper we carefully study the significant properties and physiological mechanisms
of each T cell subset, with regard to the way they influence the interaction
of immunity and tolerance. This study allows us to design a new AIS model,
CARDINAL(Cooperative Automated worm Response and Detection ImmuNe
ALgorithm) which has the potential to operate as a cooperative automated worm
detection and response system. The paper starts by addressing the research issues
associated with such a system. Section 3 introduces the different differentiation
states of T cells within the HIS. Section 4 presents a novel cooperative automated
worm detection and response system which adopts CARDINAL and finally the
paper concludes with details of future work planned.
2
Cooperative Automated Worm Detection and
Responses
In order to detect the presense of a novel worm virus various automated anomaly
detection and response based systems have been developed [12]. These systems
trigger automated responses when they observe such things as abnormal rates
of outbound connections, emails sent, or port scanning, etc. In order to improve
the false positive error rate made by local anomaly detectors, an alternative
cooperative strategy has also been suggested [3] [13] [14]. The motivation behind
this approach is that additional information on the infectious status of the worm,
and the responding states of other peer hosts, would help local responders make
better decisions by taking into account the collective evidence on an attack’s
severity and certainty, and an infection growth rate. Indeed, some work has
already reported that such a suggestion reduces false positive errors [16].
However, there are some significant issues to be tackled in order to make
a cooperative strategy truly effective. Firstly, information shared between peer
hosts should be lightweight, as the transfer of unnecessary and excessive informa-
tion can create the potential for self denial-of-service attacks [3] [13]. Secondly

response mechanisms should be robust against inaccurate information passed
amoung hosts [3]. If the reaction to a false positive error is isolated to a sin-
gle host, the impact is minimal. However because of the cooperative nature of
the system, this inappropriate response could be disseminated to the rest of the
network, causing other hosts to react in a similar fashion and exascerbate the
problem. Thus, a cooperative system needs to localise the negative impact of
such errors, and this could be done by constantly redefining the range of infor-
mation to be shared in terms of an estimated certainty of detection results. In
order to address these issues, we identify the following to be studied:
– Optimise the number of peer hosts polled: the CARDINAL system
needs to determine which peer hosts are able to share information, and
how many peer hosts should be selected to share that information. These
decisions are directly aimed at preventing a possible break of self denial-of-
service attack. Determining the set of peer hosts is done by identifying all the
possible peer hosts that can be directly contacted and thus infected by a given
host. However, the number of all possible peer hosts may be unnecessarily
large as information shared by a smaller number of peer hosts might be
sufficient to mitigate and stop worm propagation. An optimal number of
peer hosts is desirable to mitigate the propogation of a worm to a sufficient
degree whilst minimising the number of resources that are required to achieve
that objective. The determination of the size of this optimal set of peer hosts
would be influenced by factors such as the severity of the worm’s threat, the
certainty of attack detection, and the growth rate of the infection. The more
severe an attack, the more certain we are of it being detected, or the faster
is its propagation, then the larger the peer set needs to be so information
can be shared by more peer hosts to counterattack the worm successfully.
– Types of system responses should be determined by attack sever-
ity and certainty: in order to reduce the negative effects of false detection
results, CARDINAL selects its response to the threat depending on the cer-
tainty of an attack being detected and the severity of that attack. CARDI-
NAL would respond to severe and certain attacks with strong actions, such
as blocking ports showing anomalous outbound connection patterns, elimi-
nating emails appearing to carry worms, or dropping hostile network packets
containing attack signatures. Alternatively, when presented with relatively
uncertain or less severe attacks, CARDINAL would take less severe action,
such as logging the potential situation for an administrator or limiting the
network connection rates.
– For performing adequate magnitudes of responses, both local and
peer information needs to be taken into account: the severity and
certainty of attacks should not be staticly measured. A worm detected at a
local host, at a given time, might appear to be relatively less severe, however
if CARDINAL later observes that the number of peer hosts infected by the
worm greatly increases within a short time frame, responses to this worm
should be upregulated in terms of detection certainty and attack severity.
The total number of infected peer hosts could be estimated based on the

collective information passed between the peer set. Alternatively, when a
severe attack is detected by a particular host, which disseminates this infor-
mation to the remaining designated peer hosts, those hosts do not necessarily
have to take the same corrective action as the original host. If the infectious
symptoms are not shown at the peer hosts receiving this information, and
the total number of infected peer hosts does not increase quickly, the peer
host can change its response from a very strong reaction to a weaker one.
In turn this host would decrease the number of other peer hosts to which
it sends its detection and response information, curtailing the response to
the worm and returing the system to a stable state. Considering these fac-
tors together, we see CARDINAL will determine the apppropriate number
of hosts to be polled and the degree of response to a worm according to the
severity and certainty of attacks, which are dynamically measured based on
both local and peer information.
CARDINAL
HIS
Optimise the number of peer hosts polled Dynamically adjust the proliferation rate
for each effector T cell
Types of system responses should be de-
termined by attack severity and certainty
Differentiate appropriate types of effector
T cells depending on interaction with cy-
tokines and other molecules during the
maturation proccess
For performing adequate magnitudes of re-
ponses, both local and peer information
needs to be taken into account
T cell effector function is amplified and
suppressed via interaction among different
types of effector T cells
Table 1.
Mapping between CARDINAL and HIS
We believe that several mechanisms constituting T cell immunity and toler-
ance of the HIS could provide insight into intelligent approaches to implementing
the previous three properties. Table 1 shows these three specific properties of T
cells in the HIS, which were used to design CARDINAL. Section 4 discusses the
details of these properties together with the proposed model of CARDINAL. Be-
fore this discussion, section 3 briefly reviews the various differentiation states of
T cells and how they contribute to the HIS in balancing immunity and tolerance.
3
T-cell Immunity and Tolerance of HIS
The immune response is an incredibly complex process that one can argue begins
with the dendritic cell (DC). DC’s are a class of antigen presenting cell that
migrate to tissue in order to ingest antigen or protein fragments. Whilst ingesting
the antigen, DC’s are also receptive to molecules in the environment that may be

associated with the circumstances of that antigen’s existence. These molecules
are identified as a form of danger signal [9]. Once the antigen has been ingested
in the tissue, the DC’s travel back to the lymph nodes where they present the
antigen peptides to naive or memory T cells via their MHC molecules, this allows
a T cell to be able to identify that antigen. In addition, the DC will interpret
the molecules it experienced during the ingestion process, and release particular
cytokines
1
to influence the differentiation of the T cell it is presenting antigen
to. In this way, the DC drives the T cell to react to the antigen in an appropriate
manner and as such the DC can be seen as the interpretative brain behind the
immune response. Given we now know what drives the T cell differentiation
process, we turn to look at the different T cell differentiation stages. Much of
this information has been taken from [5] [7] and reference to that work should
be made if further detail is required.
3.1
Naive T cells
Naive T cells are T cells that have survived the negative and positive selec-
tion processes within the thymus, and have migrated to continuously circulate
between the blood and lymphoid organs as they await antigen presentation by
DC’s. The important fact is that naive T cells have not experienced antigen and
they do not as yet exhibit effector function.
3.2
Activated T cells
Naive T cells reach an activated state when the T cell receptor (TCR) on the sur-
face of the naive T cell successfully binds to the antigen peptide-MHC molecules
on the surface of the DC, and co-stimulatory molecules are sufficiently upregu-
lated on the surface of the DC to reflect the potential danger signal. The degree
of signaling from the DC influences the degree of activation of the T cells. T cells
that receive high signal strengths adopt the potential for effector function and
gain the ability to migrate from their current location in the lymph node to the
periphery. These activated T cells gain the ability to proliferate and their clones
will begin to differentiate into either helper T cells or cytotoxic T cells. These
cells will finally reach effector status when they interact with a second antigen
source. T cells that receive excessive levels of signalling die through a process of
activation induced cell death (AICD) to prevent an excessive immune response
taking place.
3.3
Helper T cells (Th)
Naive T cells express either CD4 or CD8 co-receptor molecules on their surface,
so called as they are clustered with the TCR and bind to the MHC molecules
1
Cytokines are chemical messengers within the HIS [5]. They are proteins produced
by virtually all cells in the HIS and they play an important role in regulating the
development of effector immune cells

presented on the DC. Naive T cells expressing CD4 differentiate into Th cells
after activation. When they achieve effector status, through further antigenic
stimulation, Th cells can develop into either Th1 or Th2 cells. The divergence
between Th1 and Th2 is driven by the cytokines released from the DC when the
T cell is first activated. Th1 and Th2 cells have different functionality as Th1
cells release cytokines that activate cytotoxic T cells whilst Th2 cells release
cytokines that activate B cells.
In addition, a cross regulation mechanism exists between Th1 and Th2 cells.
Cytokines released by Th1 cells directly impede the proliferation of Th2 cells,
whilst Th1 cytokines downregulate the production of the cytokine IL-12 in DC’s
which in turn downregulates the proliferation of Th2 cells. This feedback mech-
anism leads to an immune response dominated by the particular Th cell subtype
that is primarily stimulated, ensuring the more suitable immune response is
initiated to resolve the current threat.
3.4
Cytotoxic T cells (CTL)
Naive cells that express the CD8 molecule on their surface are predestined to
become CTL cells after activation. If the DC’s themselves do not express suffi-
cient co-stimulatory molecules to cause activation, then DC’s can be induced to
upregulate those signals by Th1 cells who also bind to the DC. Activated CTL’s
will undergo proliferation and migrate to inflamed peripheral tissues. When they
receive stimulation from subsequent antigen, they will reach an effector status
and develop the ability to produce antiviral cytokines and cytotoxic molecules,
which when released will kill infected host cells that exhibit the antigen trace
identified by the CTL. A CTL can bind to, and therefore kill, more than one
infected cell at a time.
Current theories disagree as to whether, after reaching an effector state and
carrying out their helper or killer function, CTL and Th cells either die as they
have reached a terminally differentiated state or whether some proportion of the
CTL / Th effector cell population differentiate into longer lived memory cells to
facilitate a suitable secondary response.
3.5
Summary of T cell states
From the above sections, we can see that given the presentation of antigen by
an APC and the existence of sufficient signals that indicate the presence of
danger, a naive cell will become activated, will proliferate and differentiate into
effector cells which can take on numerous alternative states. Depending on the
co-receptors expressed on the effector T cell surface, these cells will either differ-
entiate into Th or CTL cells. CTL cells lead the immune response by eliminating
antigenic threats. Th cells provide assistance to this protective process but also
provide regulation via a comprehensive feedback mechanism to ensure stabili-
sation. Naive cells that do not receive sufficient danger signals do not become
activated and so the system becomes tolerant to such antigen strains. All these
cells interact in a competitive environment that results in tolerance and immu-
nity within the system.
4
Cooperative Automated worm Response and Detection
ImmuNe ALgorithm(CARDINAL)
As described in the previous section, different differentiation statuses of T-cells
play varying roles in evoking overall immunity and tolerance in the HIS. This sec-
tion introduces the overall architecture and components of the AIS that adopts
CARDINAL, which employs various the T-cell immunity and tolerance mechan-
ims reviewed in the previous section.
4.1
Overall Architecture
Worm
Safe data
Safe data
Host 3
Periphery
Lymph Node
T cells
DCs
Periphery
Lymph Node
T cells
DCs
Periphery
Lymph Node
T cells
DCs
Worm
Host 1
T cells
T cells
T cells
Host 2
Worm
Safe data
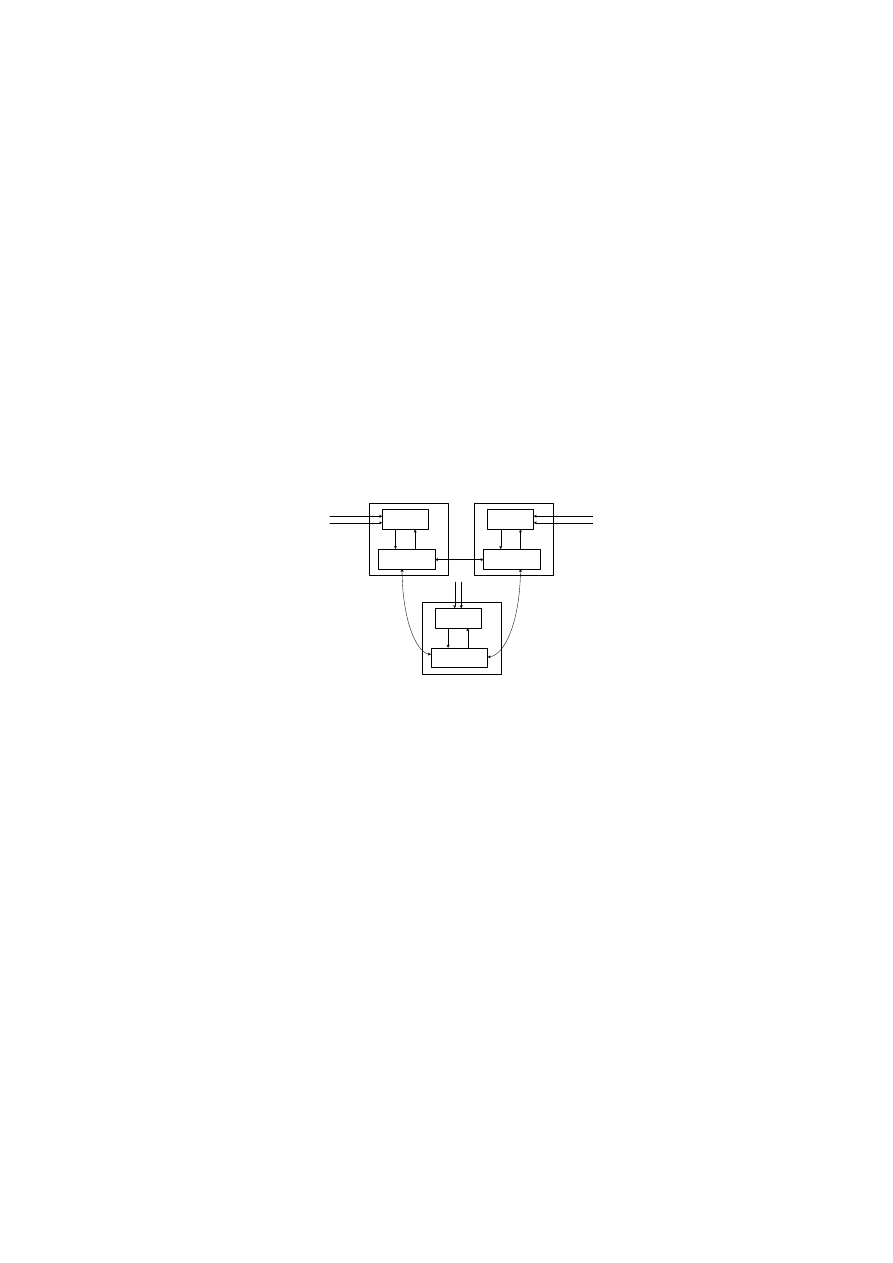
Fig. 1.
Overview Architecture of CARDINAL.
The overall architecture of CARDINAL is presented in Fig. 1. It consists of
periphery
and lymph node processes [15]. Both processes reside on a monitoring
host and any host running these two processes becomes a part of an artificial
body which CARDINAL monitors. The periphery is comprised of DCs and var-
ious types of artificial T cells and they directly interact with input data such as
network packets, email outbox or TCP connection requests etc. The input data
also exists as a part of the periphery. DCs gather and analyse the input data
and carry their analysis results to the lymph node. At the lymph node, naive
T cells
are created which subsequently differentiate into various types of effec-
tor T cells
based on the input data analysis results continuously passed from
DCs. Within CARDINAL, effector T cells are automated responders that react
to worm related processes in the periphery. Effector T cells are assigned to a
response target, a response type, and the number of peer hosts polled. Before
Tissue
Local
CTLs
DCs
Local
Th2 Cells
Periphery
9
DCs
Naive
T cells
Local
CTLs
Local
Th 1 Cells
Local
Th 2 Cells
3
4
5
6
Lymph Node
Interaction
Differentiation
Host 1
Peer
Th1 Cells
Peer
Th2 Cells
Peer
CTLs
Worm
Safe
Data
Peer CTLs
Peer Th1 cells
Peer Th2 cells
Host 2
Host 3
Peer CTLs
Peer Th1 cells
Peer Th2 cells
Danger
Signals
Antigens
1
2
4
4
5
5
7
7
8
8
7
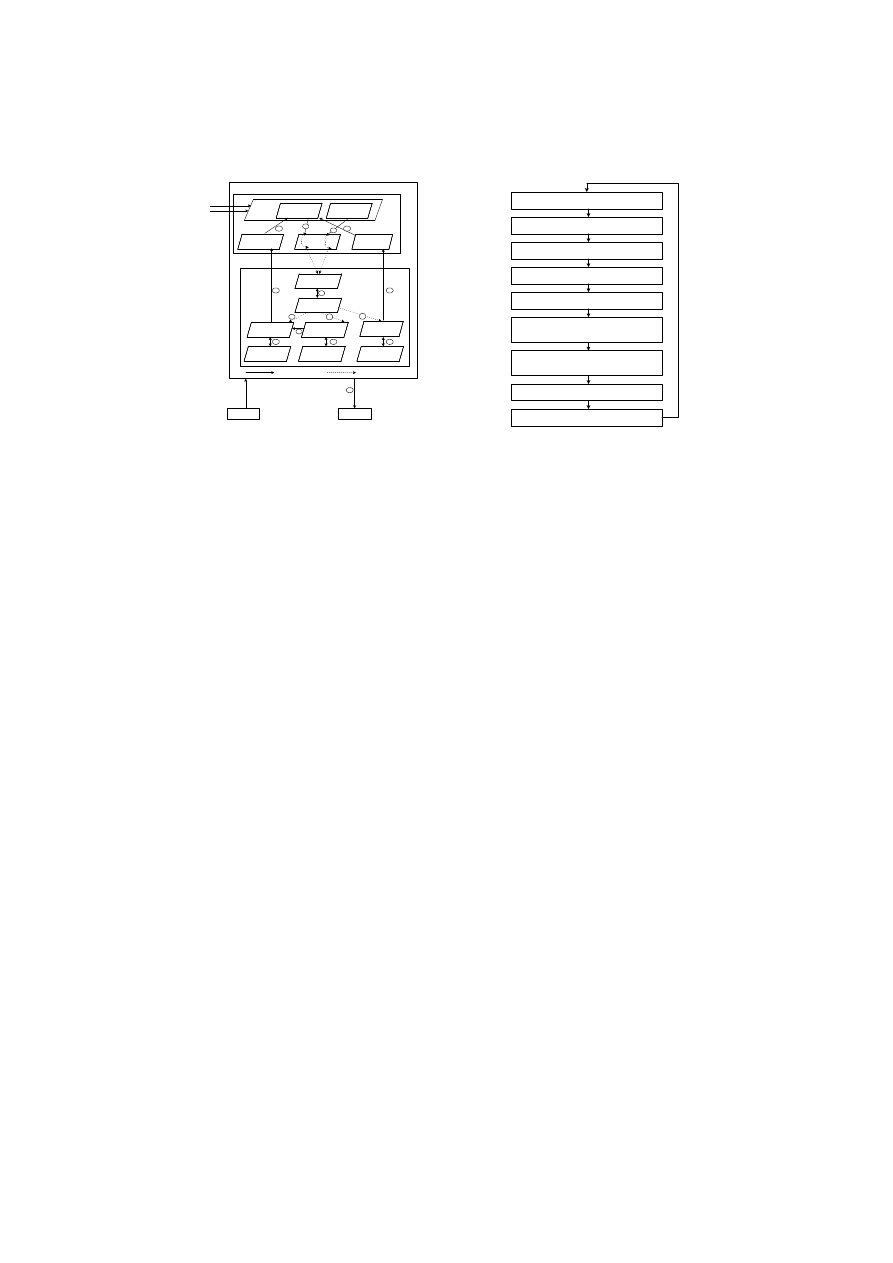
Fig. 2.
Periphery and Lymph Node Processes in
CARDINAL
1. DCs sense danger signals
2. DCs capture antigens
3. Naive T cell creation
3. Naive T cell maturation
4. Effector T cell differentiation
5. Interaction between local effector T cells
and peer effector T cells
6. Interaction between updated local CTLs
and updated local Th1 cells
7. Effector T cell Migration
8. Effector T cell response
Fig. 3.
A flow chart of CARDINAL
the effector T cells migrate from the lymph node to the periphery, they inter-
act with other effector T cells passed from peer hosts. This interaction allows
locally generated effector T cells to determine whether they should perform as-
signed types of responses or not, and the numbers of peer hosts to be polled
if they decide a response is appropriate. The local effector T cells assigned to
particular responses, and the number of peer hosts to be polled are passed to
the periphery processes at the local host and the peer hosts. These effector T
cells now respond to the response targets, which are also defined as a part of the
periphery process. In the next section, we provide more detailed descriptions of
artificial cell interactions occuring at the periphery and lymph node processes
within CARDINAL.
4.2
Periphery and Lymph Node Processes
DCs sense danger signals and capture antigens The artificial tissue layer
provides the location for two primary activities, the monitoring of danger signals
(see 1
°
in Fig. 2) and the collection of antigen in the form of input data (see 2
°
in Fig. 2). Here danger signals are seen in the context of the symptoms arising
from a worms infection. Well known worm infection symptoms include exces-
sive cpu load at the host level, bandwidth saturation at the network level, and
abnormal rates of email communication etc. Mechanisms of converting infection
symptoms into danger signals that can be acted upon can be seen in [6] and
are not discussed here. The DC’s within CARDINAL then assess these danger
signals and ascertain the severity of the attack and the certainty of its detection.
The second purpose of the tissue layer is to provide a mechanism for the DC’s
to gain access to the input data reflecting the antigens, so that the threat level
derived from the danger signal can be associated with its respective source and

remembered. The extraction of antigen from the tissues by DC’s is discussed
in [4] [6].
Naive T cell creation Once collected in the periphery, DCs carry the danger
signal assessment results and captured antigens to the lymph node. At the lymph
node, naive T cells are created and these are subsequently differentiated based on
the danger signal assessment results into their various states (see 3
°
in Fig. 2).
In nature, the receptors on naive T cells (TCR’s) allow the cell to identify a
particular type of antigen. For the sake of simplicity, our model assumes that
the system will target the worm which always has a consistent attack signature
and so can be detected by our naive T cells via these receptors. This assumption
will be changed in future work to allow for the detection of polymorphic worms,
which constantly change their form or functionality. In this way, the receptors
of the naive T cells are simply copies of the antigens presented by DCs.
Naive T cell maturation Naive T cells continuously encounter DCs passed
from the periphery (see 3
°
in Fig. 2). During this process, DCs present danger
signal assessment results to the naive T cells in three forms, as a form of a
costimulatory signal
and as two types of cytokines that reflect the potential
danger signal, and each is affected differently based on the scale of the attack.
The costimulatory signal is increased if a DC detects a severe attack, needing
a strong response, and the certainty of that attack is assessed to be high. The
cytokine IL-12 increases when a DC detects a severe attack requiring a strong
response but with a relatively lower certainty, whereas the value of the cytokine
IL-4 is incremented when a DC detects a less severe attack which only needs a
weak response
2
.
Naive T cells have three numerical values associated with them, these repre-
sent the “accumulated” certainties and severities of attacks recognised for each
cell type: CTL activation values, Th1 activation values, and Th2 activation val-
ues
. Whenever naive T cells interact with DCs, they evaluate whether the antigen
presented by DCs are identical to their TCRs. If they are identical, naive T cells
adjust these three activation values by taking account into the values of the
costimulatory signals and the cytokines IL-12 and IL-4 produced by the DC’s
(see 3
°
in Fig. 2). The costimulatory signal will influence the CTL activation
value whilst IL-12 and IL-4 will influence the Th1 and Th2 activation values
respectively. After a suitable period of time, these naive T cells are considered
as ready to respond and differentiate.
Effector T Cell differentiation There are three different types of local effector
T cells : local CTL, local Th1, and local Th2 cells (see 4
°
in Fig. 2). The CTL
activation , Th1 activation and Th2 activation values associated with the naive
2
For a less severe attack, CARDINAL does not take into account the certainty of this
kind of attack since a negative effect of a response triggered by a false positive error
would be minor.

T cells will determine the types of local effector T cells that naive T cells will
differentiate into. When one of these activation values exceeds a given threshold,
via stimulation from the costimulatory molecules or cytokines from DCs, naive
T cells will differentiate into the respective type of cell for which the threshold
was exceeded. The newly differentiated local effector T cell will have an identical
TCR pattern to the orginal naive T cell. In addition, they are cloned, and the
number of clones
reflects the numbers of polled peer hosts. This clonal rate is
determined by the CTL, the Th1, and the Th2 activation values respectively. The
larger the CTL activation value, the larger is the number of clones allocated to
that CTL. Similarly, the larger the Th1 or Th2 cell activation values, the larger
is the numbers of clones assigned to the Th1 cell or Th2 cell.
Interaction between local effector cells and peer effector cells Each
type of local effector T cell only interacts with the same corresponding type
of peer effector T cell transferred from the peer hosts (see 5
°
in Fig. 2). This
interaction takes place over four distinct stages. During the initial stage, at each
host, CARDINAL selects local effector T cells whose numbers of clones are large
enough to indicate that the antigens recognised by those effectors are severe in
terms of their attack, and that the evidence of this attack is certain. During
the second stage, CARDINAL reviews the local effector T cells that were not
selected during the first stage and compares them to the peer effector T cells.
Local effector T cells are then chosen if they match the required number of
peer effector T cells, which detect the same antigens recognisied by local effector
T cells. During the third stage, CARDINAL recalculates the number of clones
assigned to the local effector T cells that were selected during stages one and
two. The numbers of clones produced is determined by comparing the historical
growth rate of the worm infection against the historical effector cell clone growth
rate
3
. If the worm infection growth rate exceeds, or is equal to, the clone growth
rate, CARDINAL increases the numbers of clones currently assigned to local
effector T cells, otherwise CARDINAL decreases the numbers of clones of local
effector T cells.
During the fourth and final stage, CARDINAL reviews the peer effector T
cells received by the local host and identifies those cells that do not have a local
effector T cell that are capable of detecting the same antigen. The numbers of
clones assigned to these peer effector T cells is then decreased because those
antigen have not been detected at this local host, and so are not considered a
threat. Therefore, CARDINAL starts to suppress the response to that antigen.
After this suppression, CARDINAL examines the the number of clones assigned
to the peer effector T cells sent to the local host. If the number of clones exceeds
zero, then this reflects a potential threat that the local host has yet to experience.
In order to prepare the local host for this potential threat the local host will
3
The worm infection growth rate is estimated from the total number of responses
which the peer hosts made during the previous two time steps. The clone growth
rate is also measured as the change in the number of clones over the previous two
time steps.

create a local naive T cell that is an exact copy of a peer effector T cell. This naive
cell will have lower activation thresholds for its CTL, Th1 and Th2 activation
values to ensure a rapid response is initiated to any subsequent antigen exposure.
In this way, we create a form of memory within the CARDINAL system.
Interaction between updated local CTLs and updated local Th1 cells
Up to this point, effector T cells have only interacted with other effector T cells
of the same type. However, CARDINAL also incorporates interactions amongst
different types of effector cells. Before local effector T cells migrate to the pe-
riphery, another interaction between local CTLs and local Th1 cells occurs at
the lymph node. During this interaction, the local Th1 cells can further increase
the number of clones assigned to local CTL’s if the two cells recognise the same
antigen (see 6
°
in Fig. 2). As the certainty of an attack detected by a local Th1
cell is lower compared to that detected by a CTL, some fraction of the number of
clones which a local Th1 cell has could be added to the number of clones of the
local CTL. This variation in attack certainty between CTL’s and Th1’s depends
on the type and timing of the danger signals’ occurrence (infection symptoms).
The interaction between a local Th1 and a local CTL would result in the fusion
of various information related to an antigen, which is collected from diverse in-
put sources over different time steps. This additional support from a Th1 cell
reinforces the response of a CTL by increasing the number of CTL clones spe-
cific to that antigen. This is because they provide additional evidence as to the
existence of an antigen threat.
Effector T cell migration and response After the cell interaction phase
is complete, local and peer effector T cells with positive clone values begin a
migration process either to respond to a threat in the periphery at a local level
(see 7
°
8
°
in Fig. 2) or communicate the existence of such a threat to other
peer hosts (see 7
°
in Fig. 2). Local CTLs and local Th2 cells migrate to the
periphery of the local host and commence their assigned response roles to counter
the antigen attack. Th1 cells influence the number of CTL clones whilst in the
lymph node, so their impact on the periphery is indirect. If the numbers of
clones assigned to local effectors are positive, and there are no matching peer
effector cells detecting identical antigens, CARDINAL creates new peer effectors
which are copies of the local effectors. These new peer effector T cells, along with
the existing peer effector T cells, migrate to other peer hosts if the number of
clones associated with these cells is positive. This ensures that the knowledge
of the antigen attack is communicated to the selected peer hosts. As described
previously, the number of peer hosts selected for migration is determined by the
severity and certainty of an attack. The actual hosts chosen for this migration
subset are selected randomly from “all the possible peer hosts”.
4.3
T cell Immunity and Tolerance within CARDINAL
As illustrated in previous sections, CARDINAL adopts various immune inspired
components in order to implement an effective cooperative strategy for worm

CARDINAL
CARDINAL
Components
Roles
Components
Roles
Periphery
Input data access and re-
ponding targets
Lymph Node
T cell creation, differen-
tiation and interaction
Tissue
Local anomaly detectors DC
Costimula-
tory Signals
Frequencies of severe and
certain attacks
DC
Cytokine
IL12
Frequencies of severe and
less certain attacks
DC Cytokine IL4 Frequencies of less severe
attacks
Danger Signals
Infection symptoms
Antigens
Attack Signatures
TCRs
Attack signatures
CTLs
Strong Automated Re-
sponders
Th1 Cells
CTL controller
Th2 Cells
Weak Automated Re-
sponders
Activation Values
of a Naive T cell
Accumulated
severities
and certainties of attacks
Number of clones
of an Effector T
cell
Number of polling peer
hosts
Table 2.
CARDINAL components and their roles
detection and response. Table 2 summarises these components and their roles
within CARDINAL. In section 2, we highlighted three properties desirable for
an effective worm detection and response system. We believe that CARDINAL
would provide these properties through implementing T cell immunity and tol-
erance as follows:
– Types of system responses should be determined by attack sever-
ity and certainty: CARDINAL determines appropriate types of responses
based on the attack severity and certainty assessed by DCs. DCs exposed
to various types of danger signals produce different levels of costimulatory
signals and cytokines, which in turn stimulate naive T cells recognising the
antigen presented by DCs. The different degrees of accumulated costimu-
latory signals and cytokines reflect the severity and certainty of an attack
measured collectively over multiple time steps and data sources. This kind of
collective measurement would provide more accurate grounds to determine
appropriate types of responses.
– For performing adequate magnitudes of reponses, both local and
peer information needs to be taken into account: a local effector
T cell assigned to a specific type of response can be further stimulated or
suppressed by the interaction with peer effector T cells. This stimulation
and suppression is realised through updating the number of clones assigned
to each effector T cell, which performs a specific type of response.
– Optimise the number of peer hosts polled: CARDINAL optimises the
number of clones(=the number of peer hosts polled) assigned to each ef-
fector T cell by dynamically estimating the severity of the worm’s threat,
the certainty of attack detection, and the growth rate of the infection. This

estimation is implemented via several stages of different types of cell interac-
tions. These interactions include tissue and DC, DC and naive T cell, local
effector T cell and peer effector T cell, and local CTL and local Th1 cell
interactions. As a result of these interactions, if CARDINAL considers the
identified attacks to be more severe, certain, and to propagate faster, CAR-
DINAL triggers a larger number of hosts to evoke an automated reponse.
In addition, CARDINAL immediately suppresses the number of peer hosts
polled when it observes that the severity and certainty of an attack becomes
less, and the propagation speed of an observed attack becomes slower.
The current mechanisms within CARDINAL, inspired by T cell immunity
and tolerance, would provide these three desirable properties, which will help an
automated worm detection and response system to reduce a false positive error.
5
Conclusion
In this paper, we have shown how the link between the the innate immune
system(DCs) and the adaptive immune systems(T-cells), can be computationally
modelled to form the basis of a novel worm detection algorithm. In particular, we
identified three key properties of T- cell and mapped these into the CARDINAL
system: *T-cell proliferation - to optimise the number of peer hosts polled. *T-cell
differentiation - to assess attack severity and certainty and *T-cell modulation
and interaction - to balance local and peer information.
Further extensions of the presented T-cell algorithm are possible. In partic-
ular, performance could be enhanced by including the notion of antigen gener-
alisation leading to T-cell memory. Additionally, immunologists have recently
discovered a potentially third T-cell line in the shape of regulatory T-cells. It is
currently thought that these cells form an important part in inducing tolerance
by regulating other T-cell behaviour. However, more details have yet to emerge
before this class of cell can be efficiently incorporated into our computational
model.
It is also worth noting here that the proposed T-cell algorithm does not
operate in isolation, but in unison as a part of the novel danger theory inspired
system [1]. Thus, it is essential for the algorithm to work with artificial tissue [4]
and dendritic cell algorithms [6]. Once integrated, these systems should mirror
the robustness and effectiveness of their human counterparts.
Current work is focusing on implementing a simulated model of AIS adopting
CARDINAL. To reflect worm propagation in the real world, the simulated model
needs to accommodate a number of settings and parameters such as the type of
worm (random-scan worm or topology-based worm), a network topology, a rate
of worm infection depending on selected worm types and the network topology
etc. In order to provide such a realistic environment in the CARDINAL simu-
lated model, the epidemic models defining the state transitions and conditions
of infections are being currently studied [3] [13] [14].

Acknowledgements
This project is supported by the EPSRC (GR/S47809/01), Hewlett-Packard
Labs, Bristol, and the Firestorm intrusion detection system team. Special thanks
to Jamie Twycross for initiating the study of worm detection problems. Great
thanks to all the members of the “Danger Project” (www.dangertheory.com) for
their helpful feedback and inspiring discussion.
References
1. U. Aickelin, P. Bentley, S. Cayzer, J. Kim, and J. McLeod. Danger theory: The link
between ais and ids. In Proceedings of the International Conference on Artificial
Immune Systems (ICARIS’03), pages 156–167, Edinburgh, UK, 2003.
2. U. Aickelin, J. Greensmith, and J. Twycross. Immune system approaches to intru-
sion detection - a review. In Proceedings of ICARIS’04, pages 316–329, Catania,
Italy, September 2004.
3. K. G. Anagnostakis, M. B. Greenwald, S. Ioannidis, A. D. Keromytis, and D. Li. A
cooperative immunization system for an untrusting internet. In Proceedings of the
11th International Conference on Networks (ICON), 2003, Sydney, October 2003.
4. P. J. Bentley, J. Greensmith, and S. Ujjin. Two ways to grow tissue for artificial
immune systems. In Proceedings of ICARIS’05, 2005.
5. R. Coico, Sunshine G., and E. Benjamini. Immunology : A Short Course. John
Wiley & Son, fifth edition, 2003.
6. J. Greensmith, U. Aickelin, and S. Cayzer. Introducing dendritic cells: A novel
immune-inspired algorithm for anomaly detection. In Proceedings of ICARIS’05,
2005.
7. C. A. Janeway, P. Travers, M. Walport, and M. J. Shlomchik. Immunobiology : the
immune system in health and disease. Garland Science Publishing, sixth edition,
2005.
8. J. Kim. Integrating Artificial Immune Algorithms for Intrusion Detection. PhD
thesis, Department of Computer Science, University College London, 2002.
9. P. Matzinger. An innate sense of danger. Seminars in Immunology, 10:399–415,
1998.
10. D. Moore, V. Paxson, S. Savage, C. Shannon, S. Staniford, and N. Weaver. Inside
the slammer worm. IEEE Security and Privacy, 1(4):33–39, August 2003.
11. D. Moore and C. Shannon. Code-red: a case study on the spread and victims of an
internet worm. In Proceedings of the 2002 ACM SIGCOMM Internet Measurement
Workshop, pages 273–284, Marseille, France, November 2002.
12. J. Nazario. www.wormblog.com, 2005.
13. D. Nojiri, J. Rowe, and K. Levitt. Cooperative response strategies for large scale
attack mitigation. In DARPA Information Survivability Conference and Exposi-
tion, pages 293–302, 2003.
14. P. Porras, L. Briesemeister, K. Skinner, K.Levitt, J. Rowe, and Y. A. Ting. A
hybrid quarantine defense. In Proceedings of the 2004 ACM workshop on Rapid
malcode (WORM’04), pages 73 – 82, Washington DC, USA, October 2004.
15. J. Twycross. Soma - a self-orgnasing mobile agent immune system for computer
networks. Unpublished working report, September 2004.
16. N. Weaver, S. Staniford, and V. Paxson. Very fast containment of scanning worms.
In Proceedings of the 13th Usenix Security Conference, 2004.
Wyszukiwarka
Podobne podstrony:
Collaborative Defense Against Zero Day and Polymorphic Worms Detection, Response and an Evaluation F
Glow Worm installation and service manual Hideaway 70CF UIS
Glow Worm installation and service manual Ultimate 50CF UIS
Glow Worm installation and service manual Ultimate 60CF UIS
Glow Worm installation and service manual Glow micron 60
Glow Worm installation and service manual Glow micron 40
Glow Worm installation and service manual Hideaway 80BF UIS
Glow Worm installation and service manual Hideaway 50CF
Glow Worm installation and service manual Energy Saver 60 UI
Glow Worm installation and service manual Hideaway 120BF UIS
Glow Worm installation and service manual Hideaway 120CF UIS
Glow Worm installation and service manual 45 BBU 2
Glow Worm installation and service manual Ultimate 40CF UIS
Glow Worm installation and service manual Glow micron 70
Kradin Placebo Response and the Power of Unconscious Healing (Routledge, 2008)
Glow Worm installation and service manual Hideaway 100CF UIS
Glow Worm installation and service manual Miami GF UIS
więcej podobnych podstron