
Take the Best or Look at the Rest? Factors Influencing “One-Reason”
Decision Making
Ben R. Newell and David R. Shanks
University College London
Aspects of an experimental environment were manipulated in 3 experiments to examine the parameters
under which the “take-the-best” (TTB) heuristic (e.g., G. Gigerenzer & D. G. Goldstein, 1996) operates.
Results indicated TTB use to be more prevalent when the cost of information was high, when validities
of the cues were known, and when a deterministic environment was used. However, large individual
variability in strategy use was observed as well as a significant proportion of behavior inconsistent with
TTB, expecially its stopping rule. The results demarcate some of the heuristic’s boundary conditions and
also question the validity of TTB as a psychologically plausible and pervasive model of behavior.
When faced with the need to make a decision under conditions
of uncertainty, there are typically several sources of information to
which we can turn. Take, for example, predicting the winner of a
horse race. We can gather information concerning the jockey, the
trainer, the course, and the recent performance of the horse. We
might then choose to integrate all this information, perhaps weight-
ing some pieces, such as the identity of the trainer, as more
important than others to reach a conclusion about the likelihood of
the horse winning the race. An alternative to this integrative
process is to single out a piece of information, such as the identity
of the jockey, that we believe to be the best predictor of winning
and base our decision solely on this information. Intuitively, bas-
ing a decision on a single piece of information seems to be an
unwise policy. However, Gigerenzer and Goldstein (1996) have
shown persuasively that such a simple “take-the-best” (TTB) heu-
ristic can, under certain circumstances, prove to be as effective and
sometimes better than integrating across a variety of sources of
information. In this article, we explore the parameters within
which this counterintuitive heuristic operates.
Gigerenzer (2000) claimed that we make decisions through the
selection and application of a variety of fast and frugal heuristics
contained in our cognitive “adaptive toolbox.” The adaptive tool-
box is a repertoire of rules or heuristics available to a species at a
given point in its evolution (Gigerenzer & Selten, 2001). One of
the most basic algorithms in the adaptive toolbox, and the one that
is the focus of this article, is the TTB strategy.
TTB is an extremely simple one-stop decision rule whose policy
is “to take the best and ignore the rest” (Gigerenzer & Goldstein,
1996). In contrast to the more classically rational decision strate-
gies in which information is integrated (e.g., linear regression,
Bayesian reasoning), TTB simply uses the “best” piece of infor-
mation applicable in a given situation (e.g., the identity of the
jockey in our example). TTB operates according to two principles.
The first—the recognition principle—states that in any given de-
cision made under uncertainty, if only one among a range of
alternatives is recognized, then the recognized alternative should
be chosen (Goldstein & Gigerenzer, 2002). That is, if you only
recognize one jockey in the race, then choose the horse that he or
she is riding. The second principle is invoked when more than one
of the alternatives are recognized and the recognition principle
cannot provide discriminatory information. In such cases, people
are assumed to have access to a reference class of cues or features
subjectively ranked according to their validities (where validity is
defined as the probability that the feature will identify the correct
alternative on a random selection of alternatives that differ on this
feature). People are then thought to search the cues in descending
order of feature validity until they discover a feature that discrim-
inates one alternative from the others. Once this single discrimi-
nating feature has been found, it is used to make the decision.
Thus, in our example, if the identity of the trainer is the most valid
feature and one trainer has a better record than the others, then
choose that trainer’s horse.
TTB is, therefore, frugal because it bases the decision on a
single feature and fast because it does not bother searching through
and integrating information about other alternatives (i.e., it is
noncompensatory). Thus, the TTB strategy can be thought of as
comprising three basic building blocks: the search rule (search in
order of validity), the stopping rule (stop after the first discrimi-
nating cue is discovered), and the decision rule (choose the out-
come indicated by the first cue that discriminates). These elements
of the strategy ensure that the demands placed on the cognitive
system (e.g., working memory, processing capacity) are minimal
and have led Gigerenzer and Todd (1999) to argue that TTB
represents one of the purest forms of “bounded rationality,” the
term that Simon (1956) used to highlight the interconnectedness of
the limitations of the mind and the structure of the environment in
his model of human decision making. (For a full discussion of the
fast, frugal, and rational nature of TTB, see Chater, Oaksford,
Nakisa, & Redington, in press.)
Ben R. Newell and David R. Shanks, Department of Psychology,
University College London, London, United Kingdom.
The support of the Economic and Social Research Council (ESRC) and
The Leverhulme Trust is gratefully acknowledged. The work was part of
the program of the ESRC Research Centre for Economic Learning and
Social Evolution. We thank Mike Dougherty and Gerd Gigerenzer for their
helpful comments on an earlier version of this article.
Correspondence concerning this article should be addressed to Ben R.
Newell, Department of Psychology, University College London, Gower
Street, London WC1E 6BT, United Kingdom. E-mail: b.newell@ucl.ac.uk
Journal of Experimental Psychology:
Copyright 2003 by the American Psychological Association, Inc.
Learning, Memory, and Cognition
2003, Vol. 29, No. 1, 53– 65
0278-7393/03/$12.00
DOI: 10.1037/0278-7393.29.1.53
53

Given the explicit and precise nature of TTB as described
previously, it is straightforward to formulate and test hypotheses
about its implementation (Bro¨der, 2000). Despite this apparent
ease, there are few empirical tests of TTB, a situation that has not
passed unnoticed (Bro¨der, 2000; Jones, Juslin, Olsson, & Winman,
2000; Shanks & Lagnado, 2000). It is true that a number of
persuasive simulation studies have been carried out that show TTB
to be a surprisingly accurate short-cut decision rule (e.g., Giger-
enzer & Goldstein, 1996), but such simulation data indicate noth-
ing about TTB’s adequacy as a description of actual human
behavior.
Some evidence about the use of TTB-consistent strategies
comes from a process-tracing experiment reported by Rieskamp
and Hoffrage (1999). A task involving four alternatives (compa-
nies) and six cues (company variables, e.g., share capital, number
of employees) was used, and participants were required to choose
the company with the highest yearly profit. Participants’ search
patterns through the cues and alternatives were found to be con-
sistent with noncompensatory decision strategies. For example,
under high time pressure to make a decision compared with low
time pressure, the time spent looking at each cue was more closely
associated with the validities of the cues. Furthermore, participants
adopted a “cuewise” search pattern (Payne, 1976), in which they
tended to look at information about the same cue for different
alternatives rather than amassing several pieces of information
about the same alternative. This emphasis on examining the most
valid cues is a hallmark of noncompensatory strategies and thus of
TTB. However, as Rieskamp and Hoffrage (1999) readily pointed
out, because of the overlap of these hallmark features with a
number of strategies, such as Fishburn’s (1974) lexicographic
strategy and Tversky’s (1972) elimination by aspects strategy, the
process-tracing technique is limited in identifying a specific heu-
ristic like TTB.
Jones et al. (2000), in a classification experiment, reported a
more specific test of the TTB strategy. Limited support was found
for TTB use, but given that all the cue information was presented
simultaneously, it is debatable whether Jones et al.’s design con-
stituted a fair test of TTB. Gigerenzer and Todd (1999) stressed the
importance of the step-by-step nature of cue discovery in TTB.
They argued that tasks in which the need for search is obviated are
unsuitable for testing the boundedly rational TTB strategy because
limited search through information is a central component of such
heuristics (i.e., the search rule). Ensuring that cognitive, or better
still economic, effort is necessary for the acquisition of informa-
tion guarantees an appropriate environment for an empirical test
of TTB.
Bro¨der (2000) used a design with the sequential presentation of
information and combined it with a statistical inference technique
to test the empirical validity of TTB. He tested both a strong
hypothesis—that all participants in an experimental situation
would adopt a TTB strategy—and a weak hypothesis—that only
some participants would adopt TTB. Across four experiments,
Bro¨der found no evidence for the strong hypothesis. In all Bro¨der’s
experimental conditions, a substantial number of participants ex-
hibited behavior that violated the assumptions of TTB. In the final
two experiments, participants took on the role of a stockbroker and
were required to predict which of two shares from two fictional
companies was the most profitable. To help them make their
predictions, participants were able to buy information relating to
the companies’ financial status. This information took the form of
binary cues (e.g., Is it an established company? Yes/No). On each
trial participants were able to buy up to four pieces of information
before making their prediction. This sequential buying of pieces of
information, rather than the simultaneous and automatic provision
of information, is the key element of the design that makes these
experiments perhaps the best test of TTB to date.
Bro¨der (2000) recorded participants’ search patterns from the
share profitability task and used a multiple regression technique to
analyze individual response vectors (for a detailed discussion of
the statistical technique, see Bro¨der, 2002). Bro¨der classified 65%
of participants as conforming to a TTB strategy when the cost of
information was high in both Experiments 3 and 4. In contrast,
when the cost of information was lower or information was free,
the number of TTB users dropped markedly to about 15%.
The environment of Bro¨der’s Experiments 3 and 4 was highly
constrained to promote the use of TTB. First, participants were
told the validities of the four cues before the start of the trials,
allowing the subjective rank ordering of cues assumed by TTB to
be established. Second, participants were only allowed to buy
information in the order of the cue validities. Participants were
forced to buy the best first, the second best second, and so on, thus
presumably creating a bias to stop buying information upon reach-
ing a discriminating cue. Despite these two elements of the envi-
ronment strongly favoring TTB, 33% of participants did not use
TTB even when the cost of buying information was high.
Bro¨der’s data are intriguing but they leave a number of ques-
tions unanswered. First, can participants learn the cue validities if
they are not provided directly? Gigerenzer, Hoffrage, and Klein-
bo¨lting (1991) proposed that people construct the hierarchy of cue
validities in their reference class through the operation of some
frequency-encoding mechanism. This monitoring of the frequen-
cies of co-occurrences in the environment appears plausible given
the research into the effectiveness of frequency estimation (e.g.,
Hasher & Zacks, 1984), but it remains to be tested empirically
within this particular paradigm. Second, if participants can learn
the correct validities, will they then buy information about each
cue in the order of their validities as the search rule of TTB
predicts? One can imagine a scenario in which a participant
decides always to buy two or three pieces of information and is
thus unconcerned about the order in which he or she obtains them,
which would be a violation of TTB. Third, can we shed light on
why a substantial proportion of participants fail to terminate their
search (stop buying information) once they have discovered a
discriminating cue, thereby violating the stopping rule of TTB?
Rather than relying on the statistical inference technique used by
Bro¨der, we decided to investigate these questions using a process-
oriented approach (Payne, Bettman, & Johnson, 1988; Rieskamp
& Hoffrage, 1999). As noted previously, some caveats are in-
volved with such an approach; however, we reasoned that, by
using an adapted form of Bro¨der’s share prediction task, we could
closely monitor the three key aspects of participants’ behavior that
are indicative of TTB use: (a) the amount of information bought on
each trial, (b) the order in which information is bought, and (c)
whether or not information is bought after information discrimi-
nating between the two options has been discovered. We argue that
these three directly observable aspects of behavior provide perhaps
a better, and certainly a complementary, insight into TTB use than
that derived from Bro¨der’s statistical inference procedure.
54
NEWELL AND SHANKS

Experiment 1
Method
Participants.
Sixteen members of the University College London com-
munity took part in the experiment and were assigned equally to two
groups: a high relative cost (HRC) group and a low relative cost (LRC)
group. The 5 men and 11 women had a mean age of 22.7 years (SD
⫽ 2.9;
range
⫽ 19–28).
Stimuli and design.
The experiment used a share profitability predic-
tion task similar to that used by Bro¨der (2000). Participants were presented
with a series of two-alternative forced-choice decisions between the shares
of two fictional companies (Share A and Share B). The shares were
described by four binary cues with semantic labels concerning aspects of
the company’s financial status. The cues had validities of .80, .75, .70, and
.69. The assignment of the validities to the four nominal cues was coun-
terbalanced across participants, but the screen position of the cues was
constant. For each share there were 16 distinct cue patterns and thus 120
possible paired comparisons. For each comparison, there was an associated
probability of Share A being the most profitable. After each choice the
posterior probabilities that the chosen share was most profitable were
calculated according to Bayes’s rule, assuming stochastic independence of
the cues. A random number generator then determined which share became
most profitable according to this probability. (See the Appendix for details
of the patterns and probability calculations.) Participants were motivated
by the incentive of winning UK 5p or 10p (depending on the group they
were assigned to) for every correct prediction. (UK£1
⫽ approximately
U.S.$1.54.)
In the training phase, cue information was supplied automatically and
simultaneously to participants. At test, information was not provided
automatically, but participants were able to buy information about each cue
in any order. The cost of each piece of information was 1p. Thus, the
relative cost of information in the HRC condition was one fifth of the
potential 5p profit for making a correct prediction, and in the LRC
condition each piece cost one tenth of the potential 10p profit.
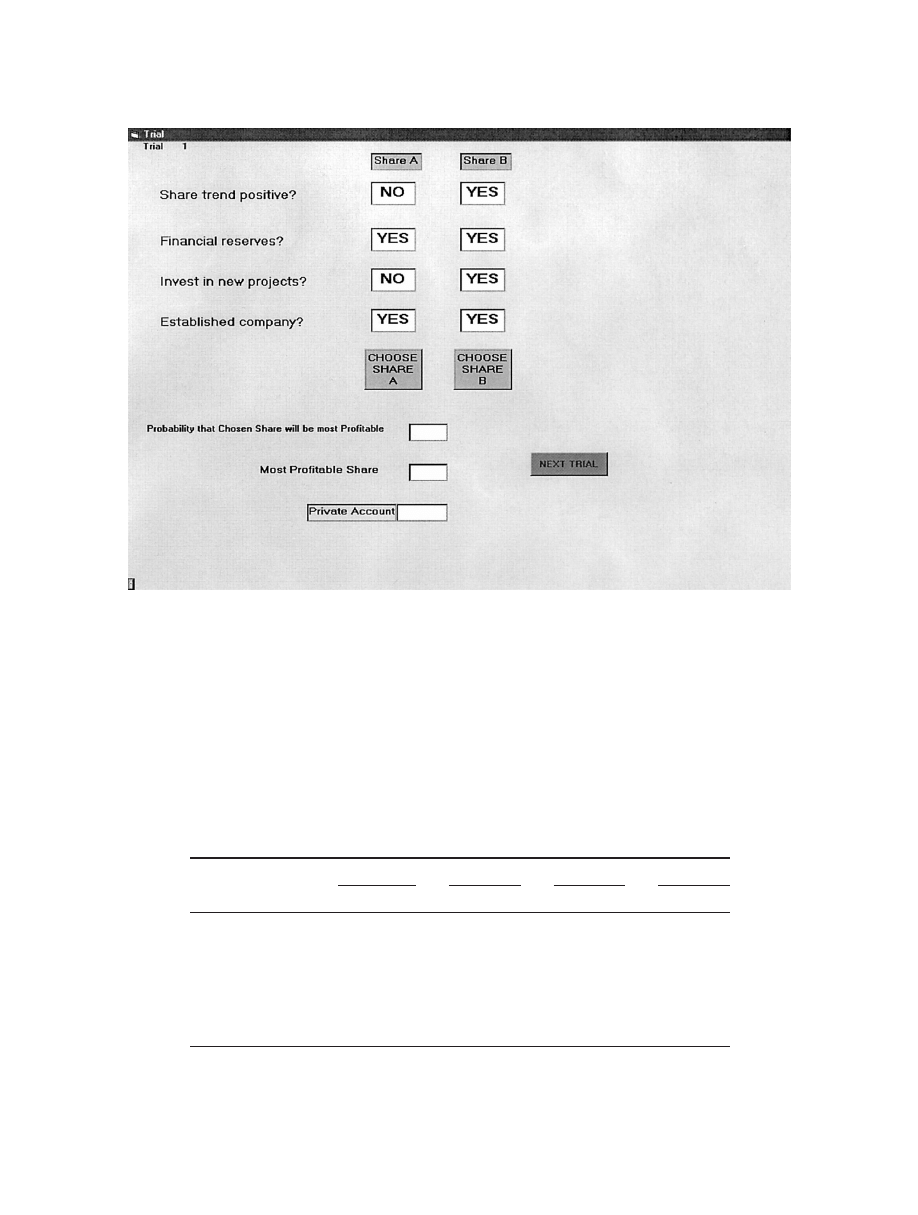
Procedure.
At the start of the experiment, participants were given a
brief verbal description of the experiment and were told they would be
making decisions about the profitability of company shares. Participants
were then given full written instructions on the screen, which they read
through with the experimenter. Participants were told that on each trial they
would be asked to choose a share (one of two alternatives) that they
thought would turn out to be the most profitable. To help them make this
choice, participants were provided with four pieces of information about
the two companies that the shares were from: (a) Was the share trend
positive over the last few months?, (b) does the company have financial
reserves?, (c) does the company invest in new projects?, and (d) is it an
established company? Participants were told that in making their predic-
tions they should try to work out which pieces of information were most
useful because not all the pieces were equally informative.
Participants then clicked a button to advance to the first trial. The screen
layout for the training trials is shown in Figure 1. Sixty training trials were
selected at random from the 120 possible paired comparisons of all 16-cue
patterns. The trials were presented in an order randomly selected for each
participant. Participants were required to make a choice by clicking on the
“Choose Share A” or “Choose Share B” button. On clicking either button,
the two windows below the choice buttons displayed the probability
(expressed as a percentage) that the chosen share would be most profitable
and the share computed by the program as most profitable on that trial. If
the correct share was chosen, the private account window was incremented
by 5p. On completion of the 60 training trials, a further set of instructions
was displayed telling participants that for the next 120 trials, the informa-
tion would no longer be automatically supplied to them but that instead
they had to buy each piece. Participants were told that they could buy as
many or as few pieces as they desired and in any order.
The screen for the test trials preserved the same basic layout as in Figure
1; however, to the right of the information windows four “Buy informa-
tion” buttons were added (one for each piece of information). Clicking on
these buttons changed the contents of the information window from ? to
either Yes or No. Having bought as much or as little information as they
wanted, participants made their choice. The most profitable share for that
trial was then displayed in the window. If the correct share was chosen, the
private account was incremented by 5p in the HRC condition and 10p in
the LRC condition minus any money that had been “invested” to buy
information. For example, a participant in the HRC condition who bought
all four pieces of information and made a correct prediction had his or her
account incremented by 1p, that is, 5p
⫺ (4 ⫻ 1p). The probability
(expressed as a percentage) of the chosen share being most profitable was
not provided in the test phase. All 120 possible comparisons of the 16 cue
patterns were presented in a different random order for each participant.
On completion of the 120 trials, participants were presented with a new
screen and were asked to type in ratings (a number between 1 and 100) of
the usefulness of each piece of information for helping them make their
predictions. The discrimination rates for each cue (i.e., how often a cue had
Yes for one company and No for the other) were the same (.5); thus, we
assumed that participants would understand usefulness in terms of validity.
Results and Discussion
Earnings.
Participants earned an average of £4.17 (SD
⫽
£0.52) in the HRC condition and £6.94 (SD
⫽ £1.77) in the LRC
condition in addition to their fee for participation.
Proportion correct.
The proportion of times that the share
chosen was most profitable was 68.8% across the 60 training trials
and 66.8% across the 120 test trials. Both proportions were well
above the chance level of 50%, training t(15)
⫽ 14.34, test
t(15)
⫽ 7.01, both ps ⬍ .0001.
Estimated usefulness of information.
The usefulness ratings of
the four pieces of information were normalized by summing the
ratings given to each cue and dividing each rating by this total for
each participant. The mean normalized usefulness ratings for the
four pieces of information are displayed in Table 1. We used the
nonparametric Jonckheere test for ordered alternatives (Siegel &
Castellan, 1988) to analyze the ratings data. This test indicated a
significant trend (J
⫽ 2.075, p ⬍ .05) across the four ratings in the
predicted descending order from the objectively most useful to the
objectively least useful piece of information, although the ratings
for Cues 1 and 2 were slightly inverted. Even though we found a
significant trend, planned comparisons between the usefulness
ratings for pairs of cues (most valid vs. second most valid, second
vs. third most valid, and third vs. least valid) failed to reveal any
significant differences (all ps
⬎ .2).
Online ranking.
During the test phase, participants were able
to buy up to four pieces of information before making their share
choice. The computer recorded the order in which information was
bought and the cue value associated with the information. The
computer recorded a value of 1 each time information about the
most valid cue was bought, a value of 2 for the second most valid,
a value of 3 for the third most valid, and a value of 4 for the least
valid cue. These data provided an online measure of participants’
ranking of the usefulness of each cue. A participant who has
learned the usefulness of each piece of information perfectly
should always buy information about the most valid cue first, then
the second most valid, and so on, thus providing mean online
rankings of 1, 2, 3, and 4, respectively. Table 1 displays the mean
online rankings derived from this measure. A Jonckheere test for
55
TESTING TAKE THE BEST
ordered alternatives indicated a significant trend (J
⫽ 2.053, p ⬍
.05) across the four rankings in the predicted ascending order from
the most valid to the least valid cue, although the rankings for the
third and fourth most valid cues were quite markedly inverted. We
acknowledge that this inversion may simply have been a reflection
of the difficulty in learning the difference in validity between
Cues 3 and 4 given that they differed only by .01 (.69 and .70,
respectively). Again, although the trend was significant, planned
comparisons revealed a significant difference only between the
rankings for the second and third most valid cues, t(15)
⫽ 3.38,
p
⬍ .01.
Amount of information bought.
The mean numbers of pieces
of information bought on each trial in the HRC and the LRC
conditions are shown in Table 2. A one-way analysis of variance
(ANOVA) on the amount of information bought revealed a group
difference, F(1, 15)
⫽ 8.42, p ⬍ .05, supporting the prediction that
Table 1
Group Data for Estimated Usefulness and Online Ranking of the Four Cues in Experiments 1–3
Experiment and
Variable
Cue 1
Cue 2
Cue 3
Cue 4
M
SD
M
SD
M
SD
M
SD
Experiment 1
Estimated usefulness
.28
.10
.29
.11
.22
.09
.21
.09
Online ranking
2.21
1.14
2.23
.60
2.82
.82
2.66
.92
Experiment 2
Estimated usefulness
.41
.07
.28
.10
.21
.10
.10
.07
Online ranking
1.10
.28
2.05
.22
2.94
.25
3.85
.27
Experiment 3
Estimated usefulness
.36
.07
.30
.05
.20
.04
.13
.07
Online ranking
1.06
.20
2.12
.30
3.19
.37
3.58
.78
Note.
Estimated usefulness is the rating provided by participants at the end of the experiment (normalized
across participants). Online ranking is derived from the order in which participants bought information in the test
phase. Cue 1 is the most valid; Cue 4 is the least valid.
Figure 1.
Screen layout during training trials of Experiment 1, Experiment 2, and the common labels condition
of Experiment 3.
56
NEWELL AND SHANKS

participants in the LRC condition would buy more information per
trial than those in the HRC condition.
In addition to the amount of information bought per trial, we
examined the order in which participants bought information so
that we could ascertain the proportion of trials on which partici-
pants continued to buy information after discovering a discrimi-
nating cue. In particular, we were interested in those trials on
which a participant bought information about a discriminating cue
(e.g., Yes for Share A and No for Share B) and then went on to buy
information about another cue. Note that this measure does not
take into account whether participants buy information in the order
of their cue validities; it simply records those trials on which
another piece of information was bought after a discriminating cue
had already been found. The mean proportion of trials on which
these unnecessary (as far as TTB is concerned) pieces of informa-
tion were bought is shown in Table 2.
A one-way ANOVA on the unnecessary information revealed a
group difference, F(1, 15)
⫽ 26.33, p ⬍ .001, indicating that
participants in the LRC condition bought unnecessary information
on a greater proportion of trials than those in the HRC condition.
The buying of unnecessary information on almost two thirds of
trials indicates that participants in the LRC condition exhibited
behavior clearly inconsistent with a TTB strategy. For those in the
HRC condition, the amount of unnecessary information bought is
much lower and plausibly within the limits of what might be
expected from response errors or fluctuations in attention during
the test phase.
1
When information had a low cost relative to the profit available
for a correct decision, only 1 participant (13%) bought unnecessary
information on less than 20% of trials. In contrast, when the
relative cost was high 6 participants (75%) exhibited this behavior.
These figures compare favorably with the 15% and 65% of TTB
users classified by Bro¨der (2000) in his low and high information
cost conditions, respectively. Although this group level analysis is
informative, an analysis of individual participant data revealed a
more complex picture.
Individual participant data.
The TTB algorithm assumes a
subjective rank ordering of cues and a search through these cues in
the order of their validities. At the group level, the data from
Experiment 1 provide partial support for this assumption. The
statistical analysis revealed significant trends in the predicted
direction for both the estimation of information usefulness and the
online ranking. However, although these trends were significant,
inspection of the means reveals only a small range in both the
estimations and rankings and indeed an order reversal in both the
estimation of usefulness of Cues 1 and 2 and in the online ranking
for Cues 3 and 4. Individual participant data revealed that only
Participant 9 provided estimations of usefulness in the order 1
⬎
2
⬎ 3 ⬎ 4 and an online ranking in the order 1 - 2 - 3 - 4. As Table
3 shows, this participant bought no information (i.e., guessed) on
68% of test trials. On the remaining 32% of trials on which he did
buy information, he continued to buy information after discovering
a discriminating cue on 28% of trials. Thus, although displaying
very fast and frugal behavior, it was clearly inconsistent with TTB.
Of the remaining 15 participants, 2 (Participants 6 and 5) provided
the correct online ranking but estimated the order of information
usefulness incorrectly. Table 3 shows that Participant 6 bought
unnecessary information on 68% of trials and Participant 5
guessed on more than 80% of trials. Both participants, therefore,
behaved in a manner inconsistent with a strict TTB strategy.
Only Participant 14, who never violated the stopping rule
(bought no unnecessary information) and only violated the search
rule for cues that were extremely close in validity (Cues 3 and 4),
can be accurately classified as behaving in a manner wholly
consistent with TTB.
In sum, analysis of individual data indicates that, even though
participants in the HRC condition only bought unnecessary infor-
mation on approximately 15% of trials, this value is an underes-
timate because of the contributions from participants who searched
randomly through cues or simply guessed without buying any
information on a large proportion of trials. It is also worth noting
that even in the HRC condition 5 of 8 participants bought unnec-
essary information on more trials than the 5% baseline we com-
puted (see footnote 1).
The results of Experiment 1 highlight the difficulties partici-
pants have in establishing and searching through a subjective rank
order of cues. This could be taken as problematic for the TTB
heuristic because the heuristic assumes the establishment of such
rank orderings in situations involving a much larger number of
cues with greatly varying validities. Alternatively, as we have
suggested, it may just be that our experimental environment does
not lend itself easily to the learning of cue validities. In his
Experiments 1 and 2 (in which an extraterrestrial research cover
story was used), Bro¨der (2000) provided participants with 50
training trials per cue to establish the correct cue hierarchy. Given
that the dispersion in validities between our cues was only .11
(.80 –.69) and that our participants had 60 trials to learn about four
cues, it is quite possible that many participants found learning the
validities too difficult.
In acknowledgment of this difficulty, in Experiment 2 we de-
cided to help participants learn the usefulness of each piece of
information by giving them a hint about the correct rank ordering.
If we can be confident that participants search through cues in their
order of usefulness, we will be able to obtain a more accurate
assessment of the consistency of participants’ behavior with the
TTB heuristic, especially its stopping rule.
1
In the General Discussion section we present an estimate of .05 (SD
⫽
.07) for the rate of such error responses.
Table 2
Group Data for Amount and Type of Information Bought
at Test in Experiment 1
Variable
High relative
cost
Low relative
cost
M
SD
M
SD
Amount of information
1.36
.63
2.54
.61
Unnecessary information
.15
.12
.64
.24
Note.
Amount of information refers to the mean number of pieces of
information bought on each trial. Unnecessary information refers to the
proportion of trials on which information was bought after discovering a
discriminating cue. This measure is conditionalized on whether any infor-
mation was bought at all.
57
TESTING TAKE THE BEST

Experiment 2
Method
Participants.
Twelve members—5 men and 7 women— of the Univer-
sity College London community took part in the experiment (mean age
⫽
27.5 years, SD
⫽ 5.7; range ⫽ 21–39).
Stimuli, design, and procedure.
Experiment 2 was a replication of
Experiment 1 with three exceptions. First, an LRC group was not included;
for all participants information cost 1p, and the payoff for a correct
prediction was 5p. Second, a hint regarding the rank order of usefulness of
the four cues was provided on the computer monitor halfway through
training (after 30 trials) and again at the start of the test phase. This hint
indicated, for example, that knowing whether a company has a positive
share trend was more useful than knowing whether it is an established
company and so on. Usefulness was explained in terms of predictive utility.
Third, participants were given a posttest questionnaire asking them about
the strategy they had used in the test phase of the experiment.
Results and Discussion
Proportion correct.
The proportion of times that the share
chosen was the most profitable was 70.8% across the 60 training
trials and 72.5% across the 120 test trials. These proportions were
slightly higher than those obtained in Experiment 1, suggesting
that the hint had a positive effect on participants’ behavior. Con-
sistent with Experiment 1, both proportions were well above the
chance level of 50%, training t(11)
⫽ 10.50, test t(11) ⫽ 24.52,
ps
⬍ .0001.
Estimated usefulness of information and online ranking.
Ta-
ble 1 shows the mean estimated usefulness of each piece of
information (normalized across participants) and the mean online
ranking of the usefulness of each cue. Jonckheere tests for ordered
alternatives indicated significant trends (J
⫽ 6.54 and 7.82, re-
spectively, ps
⬍ .001) in the predicted order for both measures.
The ranges between the four means for both measures are consid-
erably larger than those observed in Experiment 1, suggesting that
the hint about the usefulness of the information succeeded in
encouraging participants both to buy information in the correct
order and to estimate usefulness correctly. Further support for
this interpretation comes from the planned comparisons, which
revealed significant differences between the most valid and sec-
ond most valid cues, second and third most valid cues, and
third and least valid cues in all the comparisons for online rank-
ing, ts(11)
⫽ 8.54, 7.53, and 9.87, respectively, ps ⬍ .0001, and
in two of the three comparisons for estimated usefulness,
ts(11)
⫽ 3.08, 1.36 (not significant), and 2.40, respectively,
ps
⬍ .05.
Amount of information bought.
The mean amount of informa-
tion bought per trial was 2.39 (
⫾.68 SD) of a maximum of 4 and
a minimum of 0. This value is considerably higher than the amount
bought in the HRC condition of Experiment 1 (1.36). One possi-
bility for this increase is that providing participants with the hint
about the usefulness of the information implied that all pieces of
information had some value and were thus worth buying. In
Experiment 1 some participants reported that they believed at least
some of the pieces of information were of no help in making the
correct predictions and so they never bought them. In extreme
cases this led to some participants guessing on a large proportion
of test trials. In Experiment 2 all participants bought at least one
piece of information per trial on average.
The mean proportion of trials on which participants bought
unnecessary information (i.e., continued to buy information after
Table 3
Individual Participant Data for Experiment 1
Participant
no.
Condition
Online
ranking
Estimated
usefulness
Unnecessary
information
No
information
(guessing)
1
HRC
2–1–3–4
2
⬎ 1 ⬎ 3 ⬎ 4
.23
.36
3
HRC
2–3–4–1
3
⬎ 1 ⬎ 2 ⬎ 4
.05
0
5
HRC
1–2–3–4
1
⬎ 3 ⬎ 2 ⬎ 4
.24
.81
7
HRC
4–1–3–2
2
⬎ 3 ⫽ 4 ⬎ 1
.08
0
9
HRC
1–2–3–4
1
⬎ 2 ⬎ 3 ⬎ 4
.28
.68
12
HRC
3–2–4–1
4
⬎ 1 ⫽ 3 ⬎ 2
.04
.08
14
HRC
1–2–4–3
1
⬎ 2 ⬎ 4 ⬎ 3
0
0
15
HRC
3–2–1–4
2
⬎ 1 ⬎ 3 ⬎ 4
.30
0
2
LRC
1–2–4–3
1
⬎ 3 ⬎ 4 ⬎ 2
.78
.01
4
LRC
4–2–3–1
4
⬎ 2 ⬎ 3 ⬎ 1
.83
0
6
LRC
1–2–3–4
1
⫽ 2 ⬎ 4 ⬎ 3
.68
0
8
LRC
2–3–4–1
2
⬎ 3 ⬎ 4 ⬎ 1
.75
0
10
LRC
2–3–1–4
1
⫽ 3 ⬎ 2 ⬎ 4
.70
0
11
LRC
3–2–4–1
4
⬎ 2 ⬎ 1 ⬎ 3
.56
0
13
LRC
1–3–4–2
1
⬎ 3 ⬎ 4 ⫽ 2
.08
0
16
LRC
3–2–1–4
1
⫽ 2 ⫽ 3 ⫽ 4
.76
.82
Note.
Online ranking is derived from the order in which participants bought information in the test phase.
Estimated usefulness is the rating provided by participants at the end of the experiment (normalized across
participants). Unnecessary information refers to the proportion of trials on which information was bought after
discovering a discriminating cue. This measure is conditionalized on whether any information was bought at all.
For example, Participant 16 guessed on 82% of trials (99 of 120); on the remaining 18% of trials (21 of 120),
she bought unnecessary information on 76% (16 of 21). No information (guessing) refers to the proportion of
trials on which participants did not purchase any information before making their decision. HRC
⫽ high relative
cost; LRC
⫽ low relative cost.
58
NEWELL AND SHANKS

discovering a discriminating cue) was .44 (
⫾.28 SD). This increase
from the .15 observed in Experiment 1 is again perhaps due to the
hint boosting participants’ confidence in the relevance of all the
pieces of information to the decision. The finding that participants
bought unnecessary information on more than 40% of trials sug-
gests that at a group level participants are displaying behavior
inconsistent with a TTB strategy. However, in line with Experi-
ment 1, the group level analysis does not convey the spread of
individual variability present in the data.
Individual participant data.
Table 4 presents the individual
participant data for Experiment 2. In contrast to Experiment 1, in
which only 1 participant satisfied the assumption of rank ordering
and search through cues in order of their usefulness, in Experi-
ment 2 8 participants satisfied the assumption. Of these, 4 (Par-
ticipants 4, 6, 8, and 10) bought unnecessary information on less
than 20% of trials (mean
⫽ 12%, range ⫽ 2–18%) and 4 (Partic-
ipants 2, 9, 11, and 12) on more than 30% of trials (mean
⫽ 54%,
range
⫽ 31–82%). We argue that the proportion of trials in this
latter group is higher than could reasonably be attributed to re-
sponse error or attention lapses (see footnote 1) and that these
participants are, therefore, exhibiting behavior inconsistent with a
TTB strategy, in particular with the strategy’s stopping rule.
Of the remaining participants, 2 (Participants 1 and 2) produced
the correct online ranking but estimated Cue 4 as more useful than
Cue 3, and 2 (Participants 5 and 7) produced inaccurate rankings
and estimations. All 4 of these participants bought unnecessary
information on more than 50% of trials. Also shown in Table 4
is the reduction in the amount of guessing: It was almost com-
pletely eliminated. Presumably this is again a reflection of the
usefulness hint implying that all pieces of information had some
value and that, therefore, at least one piece was worth buying on
each trial.
Posttest questionnaires.
Participants were given a question-
naire in which they were asked to indicate the statement that best
described their strategy or policy in the phase in which they had to
buy information. Participants 4, 6, 7, 8, 9, and 10 classified their
strategies as completely or predominantly consistent with a TTB
strategy, and another 6 (Participants 1, 2, 3, 5, 11, and 12) classi-
fied their strategies as completely or predominantly inconsistent
with a TTB strategy. In the latter case, participants explicitly stated
that they always or predominantly bought more information after
discovering a cue that discriminated between the two alternatives.
Comparison of questionnaire responses with behavioral data dem-
onstrated a high degree of coherence, with only 1 participant
misclassifying her strategy as predominantly consistent with TTB
(Participant 7) and another (Participant 9) misclassifying his strat-
egy as completely consistent with TTB.
Both the behavioral and the questionnaire data point to a fairly
clear division, with half of our participants behaving in a manner
consistent with TTB and half behaving in a manner inconsistent.
Why do some participants use a TTB strategy and some not? The
participants who did use a strategy consistent with TTB earned an
average of £4.60 compared with £3.56 earned by the nonusers. If
financial gain was an important motivator in this environment (as
the difference in amount of information bought between the LRC
and HRC conditions in Experiment 1 seemed to indicate), all
participants should use the TTB strategy. Anecdotal evidence from
debriefing suggested that what some participants referred to as the
“random element” of the experiment often led them to buy more
information after discovering a discriminating cue. For example,
they were frustrated by the fact that even if one share had Yes for
all its pieces of information and the other had No, the latter share
could still turn out occasionally to be most profitable. Thus,
because the wrong share turned out to be most profitable on a few
occasions, some participants were simply not confident enough in
just one piece of discriminating information. Thus, we could say
that these participants adopted a weight-of-evidence strategy
whereby they bought extra information to increase their confi-
dence in their choice.
Table 4
Individual Participant Data for Experiment 2
Participant
no.
Online
ranking
Estimated
usefulness
Unnecessary
information
No
information
(guessing)
1
1–2–3–4
1
⬎ 2 ⬎ 4 ⬎ 3
.78
0
2
1–2–3–4
1
⬎ 2 ⬎ 3 ⬎ 4
.53
0
3
1–2–3–4
1
⬎ 2 ⬎ 4 ⬎ 3
.51
0
4
1–2–3–4
1
⬎ 2 ⬎ 3 ⬎ 4
.02
0
5
1–3–2–4
1
⫽ 3 ⬎ 2 ⫽ 4
.80
0
6
1–2–3–4
1
⬎ 2 ⬎ 3 ⬎ 4
.18
0
7
2–1–3–4
2
⬎ 1 ⬎ 3 ⬎ 4
.61
0
8
1–2–3–4
1
⬎ 2 ⬎ 3 ⬎ 4
.16
0
9
1–2–3–4
1
⬎ 2 ⬎ 3 ⬎ 4
.31
0
10
1–2–3–4
1
⬎ 2 ⬎ 3 ⬎ 4
.12
0
11
1–2–3–4
1
⬎ 2 ⬎ 3 ⬎ 4
.82
.01
12
1–2–3–4
1
⬎ 2 ⬎ 3 ⬎ 4
.52
0
Note.
Online ranking is derived from the order in which participants bought information in the test phase.
Estimated usefulness is the rating provided by participants at the end of the experiment (normalized across
participants). Unnecessary information refers to the proportion of trials on which information was bought after
discovering a discriminating cue. This measure is conditionalized on whether any information was bought at all.
No information (guessing) refers to the proportion of trials on which participants did not purchase any
information before making their decision.
59
TESTING TAKE THE BEST

Experiment 3
In Experiment 3 we decided to remove the random element from
the experiment by creating a deterministic environment. The struc-
ture of the task remained the same as in Experiments 1 and 2, but
the random number generator used to determine the most profit-
able share was removed from the program. On selecting Share A
or Share B, the probability of that share being most profitable was
still displayed to participants; however, instead of being referred to
as a probability, it was termed the share value. If participants
selected the share with the higher value, they made a correct
prediction and their account was incremented by 5p. In contrast to
Experiments 1 and 2, every time participants selected the share
with the higher value their account was incremented.
This deterministic environment allows us to make further pre-
dictions about the performance of a TTB strategy. In our stimulus
set there were eight critical instances in which strict adherence to
a TTB strategy led to an incorrect prediction. The most extreme
example of these instances is the pair 1 - 0 - 0 - 0 versus 0 - 1 -
1 - 1: Basing one’s choice on the information provided by the first
(and most valid) cue inevitably leads to an incorrect prediction
because the remaining cues point in the opposite direction (i.e.,
they compensate for the first cue). Thus, if a participant’s behavior
is consistent with TTB, they should get all eight of these critical
instances incorrect. Furthermore, their overall proportion correct
should be in the region of the 93.3% (i.e., 120
⫺ 8/120) predicted
by a TTB strategy.
One disadvantage with the deterministic environment, however,
is that it allows participants, to an even greater extent than in
Experiments 1 and 2, to rely on a simple strategy of counting the
number of Yes and No responses and then choosing the share with
the greater number of Yes responses. Intuitively, it seems unlikely
that people use such a simple summing strategy in real-world
environments. For this reason, we included a further condition in
Experiment 3 in which the cue labels were less transparent and,
therefore, required participants to learn which value of each cue
was indicative of a more profitable share. We suggest that distinct
labels of this kind are potentially less susceptible, at least initially
while the cue values are being learned, to a simple summing
strategy.
Method
Participants.
Twenty-four members—10 men and 14 women— of the
University College London community took part in the experiment and
were assigned to two groups of 12 each (mean age
⫽ 25.7 years, SD ⫽ 6.0,
range
⫽ 16–39).
Stimuli, design, and procedure.
The difference of principal interest
between the design of Experiment 3 and those of Experiments 1 and 2 was
the removal of the stochastic element in the experimental environment. A
random number routine was no longer used to generate the outcome on
each trial; quite simply the share with the predetermined highest value was
the winner, and every time a participant selected this share he or she earned
5p. Two conditions were included: one in which the labels for the pieces
of information were the same as those used in Experiments 1 and 2
(common labels, i.e., yes/no), and one in which a new set of semantic labels
was used (distinct labels). This latter condition used the following distinct
labels and answers: (a) Where does the company have the bulk of its
operations? (0
⫽ US, 1 ⫽ UK); (b) on which index are the company’s
shares listed? (0
⫽ FTSE, 1 ⫽ NASDAQ); (c) is it an established com-
pany? (0
⫽ yes, 1 ⫽ no); (d) what is the employee turnover rate? (0 ⫽ high,
1
⫽ low). Thus, the pattern 1 - 0 - 0 - 1, for example, yielded the cues
UK/FTSE/yes/low. The cue validities for the four pieces of information
were the same as those used in Experiments 1 and 2. The distinct labels
condition was included to provide a situation in which participants could
not rely on a simple summing of Yes and No responses to arrive at a
decision. Instead, participants were forced to learn the direction in which
cues pointed before they were able to decide which share had the higher
value. For example, they had to learn that a company with a low employee
turnover was likely to have a higher share value than a company with a
high employee turnover. Consistent with Experiment 2, participants in both
conditions were provided with a hint after 30 training trials and again at the
start of the test phase, indicating the order of usefulness of the four pieces
of information.
A further modification in Experiment 3 was the extension of the posttest
questionnaire to include the eight critical comparisons that are indicative of
TTB use. Of the 120 comparisons in the test set, there are 8 in which use
of a TTB strategy results in the wrong share selection. The questionnaire
contained a sheet with all 8 critical comparisons displayed with their values
(Yes/No or the appropriate label in the distinct labels condition) for each
cue. We were interested in whether this simultaneous presentation of cue
information in the paper format would affect participants’ tendencies to use
a TTB strategy. That is, even if participants used TTB while obtaining
sequential information using the computer, would this behavior persist
when all the necessary information was available simultaneously and at no
cost?
Results and Discussion
Proportion correct.
Table 5 shows the proportion of times that
the share chosen was the share with the highest value. At test, it
can be seen that neither group achieved the maximum proportion
correct predicted by strict adherence to a TTB strategy (93.3%).
Test performance in both groups differed significantly from the
maximum predicted by TTB but only marginally so in the common
labels group, t(11)
⫽ 1.86, p ⫽ .09, t(11) ⫽ 2.66, p ⬍ .01, for the
distinct labels group. All proportions correct were well above the
chance level of 50% (all ps
⬍ .05). The difference in proportion
correct between the common and distinct labels conditions was
significant across the training trials, t(11)
⫽ 3.56, p ⬍ .01, but not
across the test trials, t(11)
⫽ 1.29, p ⬎ .1. The difference in
performance at training appears to have arisen from participants’
initial difficulty in learning which value of a cue was best (e.g.,
whether NASDAQ or FTSE was indicative of share profitability)
in the distinct labels condition. Mean proportion correct after the
first 10 trials was only .59 in the distinct labels condition compared
with .81 in the common labels condition. Our contention that the
values of distinct labels would be more difficult to learn than the
common labels and, therefore, less susceptible to a simple sum-
ming strategy is supported by the training trials data.
Estimated usefulness of information and online ranking.
Ta-
ble 1 shows the mean estimated usefulness of each piece of
information (normalized across participants) and the mean online
Table 5
Proportion of Times Chosen Share Had Highest Value Across
the 60 Training Trials and 120 Test Trials in Experiment 3
Conditions
Training
Test
Common labels
.88
.87
Distinct labels
.74
.82
60
NEWELL AND SHANKS

ranking of the usefulness of each cue. These means are collapsed
across the two labels conditions because the measures did not
differ. Jonckheere tests for ordered alternatives indicated a signif-
icant trend (J
⫽ 9.86 and 9.19, respectively, ps ⬍ .001) in the
predicted order for both measures. Consistent with Experiment 2,
the ranges between the means for both measures indicate that the
hint had the desired effect on participants’ behavior. Further sup-
port for the effectiveness of the hint was indicated by the planned
comparisons, which revealed significant differences between the
most valid and second most valid cues, second and third most valid
cues, and third and least valid cues in all the comparisons both for
online ranking, ts(23)
⫽ 24.30, 12.95, and 1.83, respectively, ps ⬍
.05, one-tailed, and estimated usefulness, ts (23)
⫽ 3.02, 7.02,
and 3.96, respectively, ps
⬍ .05.
Amount of information bought.
The mean amount of informa-
tion bought per trial was 1.98 (SD
⫽ .91) in the common label
condition and 1.92 (SD
⫽ .74) in the distinct label condition. The
difference between these means was not significant, t(11)
⫽ .13,
p
⬎ .1. The mean proportion of trials on which participants bought
unnecessary information was .24 (SD
⫽ .34) in the common labels
condition and .26 (SD
⫽ .33) in the distinct labels condition. Again
the difference between these means was not significant, t(11)
⫽
.14, p
⬎ .1. Thus, at .25, the mean proportion of trials on which
unnecessary information was bought, collapsed across the two
labels conditions, was higher than could reasonably be attributed to
response error or attention lapses; therefore, at a group level
behavior again appears to be inconsistent with adherence to a strict
TTB strategy.
We suggested that the change to a deterministic environment in
Experiment 3 would remove the random element of decision
outcomes mentioned by some participants and thus lead to a
reduction in both the mean amount of information bought per trial
and the mean proportion of trials on which unnecessary informa-
tion was bought. To test this suggestion, we performed a cross-
experiment comparison between Experiment 2 and the common
label condition of Experiment 3. A cross-experiment comparison is
justified here because the experiments were run under the same
conditions by the same experimenter using participants from the
same pool. The only difference was that Experiment 3 used a
deterministic environment and Experiment 2 a stochastic one. The
mean proportion of trials on which unnecessary information was
bought was considerably lower in Experiment 3 than in Experi-
ment 2 (.26 vs. .44), and the difference was significant on a
one-tailed test, t(11)
⫽ 1.79, p ⬍ .05. In the case of amount of
information bought per trial, even though the value was numeri-
cally lower in Experiment 3 (1.98 vs. 2.39), the difference was not
significant, t(11)
⫽ 1.32, p ⬎ .1, although it is likely that with
more participants this difference would have reached significance.
We found partial support, therefore, for our suggestion, but the
change to a deterministic environment did not completely elimi-
nate the tendency for some participants to adopt a weight-of-
evidence strategy.
Individual participant data.
In line with Experiments 1 and 2,
analysis at the group level, although suggestive of nonadherence to
a TTB strategy, does not serve to illustrate the high degree of
individual variability across participants. Table 6 displays the
individual data for the two label conditions.
Sixteen participants (6 from the distinct labels condition and 10
from the common labels condition) satisfied the assumption of
rank ordering and search through cues in order of usefulness. Of
these 16 participants, 11 (Participants 1, 5, 6, and 12 from the
distinct labels condition and 2, 4, 5, 6, 7, 8, and 9 from the
common labels condition) bought unnecessary information on less
than 20% of trials (mean
⫽ 2%, range ⫽ 0–18%), and 4 (Partic-
ipants 4 and 7 from the distinct labels condition and 10 and 11
from the common labels condition) bought unnecessary informa-
tion on more than 40% of trials (mean
⫽ 65%, range ⫽ 44–81%).
The remaining participant guessed on 86% of trials (Participant 3,
common labels).
Of the 8 participants who did not satisfy the assumption of
ordering and search, 2 (Participants 2 and 11, distinct labels)
provided incorrect rankings and estimations, 2 (Participants 3 and
8, distinct labels) inverted the ranking of Cues 3 and 4, 2 (Partic-
ipants 1 from common labels and 9 from distinct labels) provided
incorrect estimations, and 1 (Participant 10, distinct labels)
guessed on 75% of trials and thus produced limited and incorrect
ranking data. Finally, Participant 12 from the common labels
condition provided the correct estimation of usefulness, but her
online ranking data, rather than reflecting the validity of the cues,
reflected the descending order of the “Buy information” buttons on
the screen for her particular counterbalanced condition. It appears
that having decided on a strategy to buy every piece of information
on each trial (as supported by her posttest questionnaire) this
participant simply bought the information in the most convenient
manner given the screen layout.
Posttest questionnaires.
Participants 2, 4, 5, 6, 7, 8, and 9 from
the common labels condition and Participants 1, 2, 5, 6, 8, 9, 10,
11, and 12 from the distinct labels condition classified their be-
havior as predominantly or completely consistent with a TTB
strategy. The remaining participants from both conditions classi-
fied their behavior as predominantly or completely inconsistent
with a TTB strategy. Comparison of behavioral data with ques-
tionnaire responses revealed, in line with Experiment 2, a high
degree of coherence: Only 3 participants misclassified their strat-
egies: Participant 2 in the distinct labels condition reported using
a TTB strategy when she was clearly not doing so, and Partici-
pant 3 in the common labels condition and Participant 10 in the
distinct labels condition reported always buying at least one piece
of information when, in reality, both participants guessed on more
than 75% of trials.
Critical comparisons.
TTB received some support from the
critical comparison data. The use of TTB with Cue 1 as the most
valid cue should yield incorrect selections on comparisons such as
0-1-1-1 versus 1-0-0-0 and 0-1-1-0 versus 1-0-0-0. The mean
number of correct selections for these critical comparisons
was 1.50 of 8 during the sequential trials on the computer and 3.96
of 8 when the comparisons were presented on paper. The lower
number of correct selections in the computer trials indicates that,
as predicted, TTB use was evident when information was pre-
sented sequentially and at a cost. Overall, in the computer trials 11
participants (46%) made the incorrect selection on all eight critical
comparisons. In contrast, only 2 participants (8%) classified all
eight comparisons incorrectly in the paper presentation. This large
difference in TTB-consistent behavior between the simultaneous
(paper) and sequential (screen) presentation of information high-
lights the importance of the step-by-step discovery of cue values
for testing TTB (Gigerenzer & Todd, 1999). Experiments in which
information is presented simultaneously (e.g., Bro¨der, 2000, Ex-
61
TESTING TAKE THE BEST

periments 1 and 2; Jones et al., 2000) do not, therefore, provide a
completely fair test of TTB.
Experiment 3 was designed to strongly favor the use of a TTB
strategy. The random element of the stochastic environment used
in Experiments 1 and 2 was replaced with a deterministic one; the
hint explaining the usefulness of the pieces of information re-
mained as did the training phase and motivating financial payoffs.
These modifications appeared to promote the use of TTB. At an
individual level, an impressive 75% of participants adhered to the
TTB strategy, leaving only 25% of participants who preferred to
err on the side of caution by seeking further weight of evidence.
It is important to emphasize that our results do not question the
powerfulness of the TTB heuristic. Across the 120 test trials it was
necessary to buy a minimum of 208 pieces of information (of a
possible 480 [120
⫻ 4]) to uncover information that discriminated
between the alternatives on every trial. Such a strategy has a 93.3%
accuracy because of the eight misleading comparisons and, there-
fore, in a deterministic environment leads to a profit of £3.50
([120
⫻ .93] ⫻ 5p ⫺ [208 ⫻ 1p]). In contrast, buying one extra
piece of information per trial (when there is another piece left to
buy) leads to a profit of £2.49 ([120
⫻ .93] ⫻ 5p ⫺ [309 ⫻ 1p]).
Of course, buying all four pieces of information on every trial
results in a profit of only £1.20 ([120
⫻ 5p] ⫺ [480 ⫻ 1p]). These
latter two strategies both result in considerably lower profits than
the £3.00 ([120
⫻ .5] ⫻ 5p) that would be expected by simply
guessing (buying no information) on every trial. Thus, in terms of
financial gain, TTB is the best possible strategy, and it achieves
this with more than 90% accuracy. However, even with this
unambiguous financial advantage, not all participants adopted the
strategy.
To illustrate this point, consider Participants 12 and 7 from the
common labels condition. Participant 12 bought all four pieces of
information on every trial and earned £0.75 at test. Participant 7,
who never bought unnecessary information (and never guessed),
earned £3.47. This increase in profit of almost five times was
achieved at the same level of accuracy across the test trials: 91.6%.
General Discussion
The experiments presented here used a process-oriented ap-
proach to examine whether behavior in a two-alternative forced-
choice task with four information cues was consistent or inconsis-
tent with a TTB strategy. Our key indicator of consistency with
TTB was whether or not participants continued to search for (buy)
information after discovering a cue that discriminated between the
two alternatives. Such a weight-of-evidence strategy clearly vio-
lates the stopping rule of TTB.
Experiment 1 supported Bro¨der’s (2000) finding that the relative
cost of information affected the prevalence of TTB use: The higher
the cost of information relative to the potential profit for making a
Table 6
Individual Participant Data for Experiment 3
Participant
No.
Condition
Online
ranking
Estimated
usefulness
Unnecessary
information
No
information
(guessing)
1
CL
1–2–3–4
1
⬎ 2 ⫽ 4 ⬎ 3
.71
0
2
CL
1–2–3–4
1
⬎ 2 ⬎ 3 ⬎ 4
.01
0
3
CL
1–2–3–4
1
⬎ 2 ⬎ 3 ⬎ 4
.12
.86
4
CL
1–2–3–4
1
⬎ 2 ⬎ 3 ⬎ 4
.06
0
5
CL
1–2–3–4
1
⬎ 2 ⬎ 3 ⬎ 4
0
.05
6
CL
1–2–3–4
1
⬎ 2 ⬎ 3 ⬎ 4
0
0
7
CL
1–2–3–4
1
⬎ 2 ⬎ 3 ⬎ 4
0
0
8
CL
1–2–3–4
1
⬎ 2 ⬎ 3 ⬎ 4
0
.02
9
CL
1–2–3–4
1
⬎ 2 ⬎ 3 ⬎ 4
.02
0
10
CL
1–2–3–4
1
⬎ 2 ⬎ 3 ⬎ 4
.66
0
11
CL
1–2–3–4
1
⬎ 2 ⬎ 3 ⬎ 4
.44
.01
12
CL
2–3–4–1
1
⬎ 2 ⬎ 3 ⬎ 4
.93
0
1
DL
1–2–3–4
1
⬎ 2 ⬎ 3 ⬎ 4
.18
0
2
DL
1–2–3–4
1
⬎ 4 ⬎ 2 ⬎ 3
.83
0
3
DL
1–2–3–4
1
⬎ 2 ⬎ 3 ⬎ 4
.32
0
4
DL
1–2–3–4
1
⬎ 2 ⬎ 3 ⬎ 4
.72
0
5
DL
1–2–3–4
1
⬎ 2 ⬎ 3 ⬎ 4
.01
0
6
DL
1–2–3–4
1
⬎ 2 ⬎ 3 ⬎ 4
0
0
7
DL
1–2–3–4
1
⬎ 2 ⬎ 3 ⬎ 4
.82
0
8
DL
1–2–4–3
1
⬎ 2 ⬎ 3 ⬎ 4
.22
0
9
DL
1–2–3–4
1
⫽ 2 ⫽ 3 ⫽ 4
0
0
10
DL
1–4–2–3
1
⬎ 2 ⬎ 3 ⬎ 4
0
.75
11
DL
1–2–4–3
1
⬎ 2 ⬎ 3 ⬎ 4
.01
0
12
DL
1–2–3–4
1
⬎ 2 ⬎ 3 ⬎ 4
.04
.27
Note.
Online ranking is derived from the order in which participants bought information in the test phase (see
text for clarification). Estimated usefulness is the rating provided by participants at the end of the experiment
(normalized across participants). Unnecessary information refers to the proportion of trials on which information
was bought after discovering a discriminating cue. This measure is conditionalized on whether any information
was bought at all. No information (guessing) refers to the proportion of trials on which participants did not
purchase any information before making their decision. CL
⫽ common labels; DL ⫽ distinct labels.
62
NEWELL AND SHANKS

correct choice, the higher is the number of TTB users. Experi-
ment 1 also highlighted the difficulty participants had in learning
the validities of the cues and thus the correct order in which to
search through them. In much of the work on fast and frugal
heuristics (Gigerenzer, 2000; Gigerenzer, Todd, & the ABC Re-
search Group, 1999), rather little attention is paid to how people
learn validities and create the cue hierarchy in a particular refer-
ence class. Often the learning and decision/judgment aspects of
tasks are amalgamated, and it is simply assumed that information
relevant to the decision has been acquired through some unspec-
ified or ill-specified experiential process. Experiment 1 demon-
strated that only 1 participant (6%) both estimated the validities of
the cues correctly and searched through cues in the order of the
validities. Even equipped with this knowledge, this participant
chose to guess on more than 65% of test trials.
In Experiment 2 we attempted to promote the use of TTB’s
search rule further by telling participants the order of cue validities
once during training and again before the test phase. This hint
succeeded in leading the majority of participants to buy informa-
tion in the correct order and estimate the usefulness of information
correctly, but again 50% of participants continued to buy unnec-
essary information on more than 50% of the test trials on average.
Finally, in Experiment 3 we gave the TTB strategy the best
possible chance by eliminating the probabilistic nature of the
outcome of each choice. As predicted, this experiment had the
highest proportion of TTB users—an impressive 75%— but we
still found that 25% of those participants who satisfied the assump-
tion of rank ordering and search violated the stopping rule on an
average of 66% of test trials. In addition, fewer than half of the
participants made the incorrect choice (an indicator of TTB ad-
herence) for all eight critical comparison trials.
Our conclusions rest partly in determining the appropriate re-
sponse error rate for our experimental environment. It is unrealistic
to assume that TTB is a completely error-free heuristic; therefore,
presumably unnecessary information will sometimes be bought by
mistake. To estimate the frequency of such occasions, we calcu-
lated the proportion of trials on which unnecessary information
was bought by those participants across all experiments whose
online ranking, estimation, and self-report data were consistent
with systematic use of TTB. These 15 participants bought unnec-
essary information on an average of 5% of trials (
⫾7% SD). Thus,
our absolute upper limit for response error was 19% (i.e., 5% plus
2 SD).
We also observed wide individual differences in all experi-
ments, with some participants conforming very closely to the TTB
strategy and others plainly violating it. Although the fast and frugal
framework (Gigerenzer et al., 1999) allows for people to have
access to numerous strategies or heuristics in their adaptive tool-
box, it assumes that it is the environment that determines strategy
selection and not the individual. Therefore, the individual differ-
ences we observed are not easily reconciled with the fast and
frugal framework.
Potential Limitations
One potential criticism of our findings is our implicit assump-
tion that when participants buy information this information is then
incorporated into the decision-making process. As Rieskamp and
Hoffrage (1999) pointed out, “Even if someone acquires a large
amount of information, this does not necessarily mean that all of
this information is used to make the decision” (p. 151). We agree
that this criticism is valid but argue that, in the experimental
environment used here, there is no reason (that we can think of)
why participants would willingly sacrifice profit to buy informa-
tion that they had no intention of using.
We are aware that dichotomizing participants into TTB-
consistent and TTB-inconsistent groups is perhaps an oversimpli-
fication, and that it is quite possible that participants used a
combination of both types of strategies (and others) in making
their decisions. We also acknowledge that behavior can be con-
sistent with one of the building blocks of TTB (e.g., the search
rule) but inconsistent with another (e.g., the stopping rule). There-
fore, classifying individuals as overall TTB or non-TTB users
perhaps belies the complete picture. For example, Table 5 indi-
cates that 10 of 12 participants in Experiment 2 exhibited behavior
consistent with the search rule of TTB (as evidenced by the online
rankings) but none satisfied the stopping rule (as evidenced by the
purchase of unnecessary information). Similar patterns can be seen
in Experiment 3 (e.g., Participants 9 and 11; see Table 6). We
concede this point but stress that our aim in these experiments was
to test TTB as a unitary heuristic (albeit one composed of three
building blocks), and that observing behavior that is inconsistent
with any aspect of the heuristic constitutes a violation of the
explicit and precise patterns of behavior predicted by TTB.
We reiterate that our results do not challenge the power of the
TTB heuristic. Those participants in Experiments 2 and 3 who
exhibited TTB-consistent behavior earned an average of £3.11
across the 120 test trials compared with £1.92 for their non-TTB-
using counterparts. This substantial increase in profit was achieved
at a minimal loss in accuracy; in Experiments 2 and 3, TTB users
achieved 81% correct and non-TTB users 83%. We acknowledge
that financial gain is not always perceived by participants as
sufficient motivation for performing well (Friedman & Massaro,
1998), but given the clear group difference between the relative
cost conditions in Experiment 1, we argue that the payoff structure
in the design we used was motivating to participants. If our
assumptions about motivation are valid, then our results clearly
show that some participants required a greater weight of evidence
before making their choice than others.
Weight-of-Evidence Strategy
Is there any other evidence for the use of a weight-of-evidence
strategy of the kind we observed in the three experiments? Harvey
and Bolger (2001) identified “facilitating discrimination” as the
key factor involved in motivating decision makers to improve their
judgments and decisions. They proposed that “people’s apprecia-
tion of the relative advantage of taking different options is subject
to noise and that they collect information to increase their ability
to discriminate between the attractiveness of options in the face of
this uncertainty” (p. 296). Svenson’s (1992, 1996) differentiation
and consolidation theory also assumes a process in which alterna-
tives are gradually differentiated from one another and people
continue to acquire information until a particular candidate is
“sufficiently superior for a decision” (Svenson, 1992, p. 143).
Although these theories are typically applied to situations involv-
ing a greater number of alternatives and attributes (e.g., Harvey &
Bolger, 2001) than in the experiments presented here, it is clear
63
TESTING TAKE THE BEST

that they support the conjecture that people are not always satisfied
to make a decision on the basis of one piece of discriminating
information, even when acquiring further information is poten-
tially both financially and cognitively (in terms of effort)
disadvantageous.
Speed and Frugality
TTB is said to be fast because it only searches for the amount of
information necessary to discriminate between two alternatives.
However, as Chater et al. (in press) noted, this assumption of speed
is based on one particular view of cognitive architecture, namely
that it is serial and that information in memory is searched at a
constant rate. Such a serial architecture would give TTB an ad-
vantage over multiple regression for example, but presupposing
seriality is perhaps premature. There is wide-ranging evidence for
the viability of parallel architectures in which massive amounts of
information can be searched simultaneously (e.g., Hopfield &
Tank, 1985; Rumelhart & McClelland, 1986). Chater et al. (in
press) also raised similar questions about the proposed advantage
of the frugality of TTB. Several domains exist in which effective
integration across multiple sources of information has been dem-
onstrated experimentally and modeled successfully (e.g., face per-
ception; Burton, Bruce, & Hancock, 1999).
The claim that the classical rationality view of the mind is
untenable because of the unrealistic amounts of computation re-
quired to perform, for example, Bayesian or regression calculation
(Gigerenzer et al., 1999) can also be challenged. Shanks and
Lagnado (2000) used the following example to demonstrate that a
regression solution can be found in minimal time without any
computation. Imagine a set of points, each represented by a peg on
a two-dimensional board. Then attach a long, thin rod to the pegs
using elastic bands at intervals along the rod. Minimizing the
allocation of tension to the bands will then align the rod exactly
according to the regression equation. Yet the elastic bands plainly
do not compute the regression in any explicit sense.
Chater et al. (in press) mounted a similar line of argument
against Gigerenzer et al.’s (1999) “cognitive limitations” claim.
Chater et al. made the distinction between an algorithmic (cf. Marr,
1982) and rational (cf. Anderson, 1990) level of explanation of
cognition. They noted that in a rational analysis calculating opti-
mal behavior functions is extremely complex, and thus there does
appear to be a contradiction between the intractability of these
explanations and the time and memory limitations of the cognitive
system. However, they argued that this contradiction ceases to be
problematic when one realizes that people do not need to be able
to calculate optimal behavior functions; they simply have to use
successful algorithms. Consider, for example, a bird’s ability to
fly: A bird can fly perfectly well without knowing anything about
aerodynamics or the computational intractability of aerodynamic
calculations (Chater et al., in press).
Both these examples serve to illustrate that purportedly complex
decision processes can be performed in simple ways, and that
when a distinction is drawn between algorithmic and rational
levels of explanation the perceived contradiction between the
limitations of the cognitive system and the “demonic” proportions
of required computations evaporates.
Conclusion
The fast and frugal heuristics program developed by Gigerenzer
(2000) and colleagues (Gigerenzer & Selten, 2001; Gigerenzer et
al., 1999) is both important and influential. Our results highlight
the powerfulness of one of the most fundamental heuristics—
TTB— but also demonstrate that it is clearly not universally
adopted by participants, even under conditions strongly con-
strained to promote its use. We acknowledge that Gigerenzer and
his group do not assume that TTB is universal in the sense that it
will be used by everyone regardless of the environment; neverthe-
less, our failure to find any circumstances, however restricted, in
which the heuristic is almost universally used is, we believe, a real
issue for TTB in particular and the fast and frugal approach in
general (see also Newell, Weston, & Shanks, in press).
Further experimental investigations of the kind reported here are
necessary to ensure that the seductive appeal of “simple heuristics
that make us smart” does not obscure the importance of empirical
validation or distract us from our goal of understanding how,
when, and why different decision heuristics and algorithms are
successful.
References
Anderson, J. R. (1990). The adaptive character of thought. Hillsdale, NJ:
Erlbaum.
Bro¨der, A. (2000). Assessing the empirical validity of the “take-the-best”
heuristic as a model of human probabilistic inference. Journal of Ex-
perimental Psychology: Learning, Memory, and Cognition, 26, 1332–
1346.
Bro¨der, A. (2002). Take the best, Dawes’ rule, and compensatory decision
strategies: A regression-based classification method. Quality & Quan-
tity, 36, 219 –238.
Burton, A. M., Bruce, V., & Hancock, P. J. B. (1999). From pixels to
people: A model of familiar face recognition. Cognitive Science, 23,
1–31.
Chater, N., Oaksford, M., Nakisa, R., & Redington, M. (in press). Fast,
frugal and rational: How rational norms explain behavior. Organiza-
tional Behavior and Human Decision Processes.
Fishburn, P. C. (1974). Lexicographic orders, utilities and decision rules.
Management Science, 20, 1442–1471.
Friedman, D., & Massaro, D. W. (1998). Understanding variability in
binary and continuous choice. Psychonomic Bulletin & Review, 5, 370 –
389.
Gigerenzer, G. (2000). Adaptive thinking: Rationality in the real world.
Oxford, England: Oxford University Press.
Gigerenzer, G., & Goldstein, D. G. (1996). Reasoning the fast and frugal
way: Models of bounded rationality. Psychological Review, 103, 650 –
669.
Gigerenzer, G., Hoffrage, U., & Kleinbo¨lting, H. (1991). Probabilistic
mental models: A Brunswikian theory of confidence. Psychological
Review, 98, 506 –528.
Gigerenzer, G., & Selten, R. (2001). Rethinking rationality. In G. Giger-
enzer & R. Selten (Eds.), Bounded rationality: The adaptive toolbox (pp.
1–13). Cambridge, MA: MIT Press.
Gigerenzer, G., & Todd, P. M. (1999). Fast and frugal heuristics: The
adaptive toolbox. In G. Gigerenzer, P. M. Todd, & the ABC Research
Group (Eds.), Simple heuristics that make us smart (pp. 3–34). Oxford,
England: Oxford University Press.
Gigerenzer, G., Todd, P. M., & the ABC Research Group. (1999). Simple
heuristics that make us smart. Oxford, England: Oxford University Press.
Goldstein, D. G., & Gigerenzer, G. (2002). Models of ecological rational-
ity: The recognition heuristic. Psychological Review, 109, 75–90.
64
NEWELL AND SHANKS

Harvey, N., & Bolger, F. (2001). Collecting information: Optimizing outcomes,
screening options, or facilitating discrimination. Quarterly Journal of Experi-
mental Psychology: Human Experimental Psychology, 54(A), 269–301.
Hasher, L., & Zacks, R. T. (1984). Automatic processing of fundamental
information. American Psychologist, 39, 1327–1388.
Hopfield, J. J., & Tank, D. W. (1985). “Neural” computation of decisions
in optimization problems. Biological Cybernetics, 52, 141–152.
Jones, S., Juslin, P., Olsson, H., & Winman, A. (2000, August). Algorithm,
heuristic or exemplar: Process and representation in multiple cue judgment. In
L. R. Gleitman & A. K. Joshi (Eds.), Proceedings of the 22nd Annual Confer-
ence of the Cognitive Science Society (pp. 244–249). Mahwah, NJ: Erlbaum.
Marr, D. (1982). Vision: A computational investigation into the human
representation and processing of visual information. San Francisco:
Freeman.
Newell, B. R., Weston, N. J., & Shanks, D. R. (in press). Empirical tests of
a fast and frugal heuristic: Not everyone “takes the best.” Organizational
Behavior and Human Decision Processes.
Payne, J. W. (1976). Task complexity and contingent processing in deci-
sion making: An information search and protocol analysis. Organiza-
tional Behavior and Human Performance, 16, 366 –387.
Payne, J. W., Bettman, J. R., & Johnson, E. J. (1988). Adaptive strategy
selection in decision making. Journal of Experimental Psychology:
Learning, Memory, and Cognition, 14, 534 –552.
Rieskamp, J., & Hoffrage, U. (1999). When do people use simple heuristics
and how can we tell? In G. Gigerenzer, P. M. Todd & the ABC Research
Group (Eds.), Simple heuristics that make us smart (pp. 141–167).
Oxford, England: Oxford University Press.
Rumelhart, D. E., & McClelland, J. L. (1986). On learning the past tenses
of English verbs. In D. E. Rumelhart, J. L. McClelland, & the PDP
Research Group (Eds.), Parallel distributed processing: Explorations in
the microstructure of cognition. Vol. 2: Psychological and biological
models (pp. 216 –271). Cambridge, MA: MIT Press.
Shanks, D. R., & Lagnado, D. (2000). Sub-optimal reasons for rejecting
optimality. Behavioral and Brain Sciences, 23, 761–762.
Siegel, S., & Castellan, N. J. (1988). Nonparametric statistics for the
behavioral sciences (2nd ed.). New York: McGraw-Hill.
Simon, H. A. (1956). Rational choice and the structure of environments.
Psychological Review, 63, 129 –138.
Svenson, O. (1992). Differentiation and consolidation theory of human
decision making: A frame of reference for the study of pre- and post-
decision processes. Acta Psychologica, 80, 143–168.
Svenson, O. (1996). Decision making and the search for fundamental
psychological regularities: What can be learned from a process perspec-
tive? Organizational Behavior and Human Decision Processes, 65,
252–267.
Tversky, A. (1972). Elimination by aspects: A theory of choice. Psycho-
logical Review, 79, 281–299.
Received October 26, 2001
Revision received July 10, 2002
Accepted July 14, 2002
䡲
Appendix
Table A1
Probabilities That Share A or B Is More Profitable for the Different Cue Patterns, and the
Likelihood Ratio (LR) Favoring A Over B
Cue
Pattern
P(A
⫽ 1/C
i
)
P(B
⫽ 1/C
i
)
LR (A:B)
C
1
10
.80
.20
4/1
01
.20
.80
1/4
C
2
10
.75
.25
3/1
01
.25
.75
1/3
C
3
10
.70
.30
7/3
01
.30
.70
3/7
C
4
10
.69
.31
69/31
01
.31
.69
31/69
Note. C
1
-C
4
refer to the individual cues (e.g., Established company?). A cue is diagnostic only when there is a YES
for one share and a NO for the other share. The Pattern column displays the two diagnostic patterns for each of the
four cues (1
⫽ YES, 0 ⫽ NO). P(A ⫽ 1/C
i
) refers to the probability that share A is more profitable (i.e., A
⫽ 1) for
a given cue pattern; P(B
⫽ 1/C
i
) refers to the probability that share B is more profitable (i.e., B
⫽ 1) for a given cue
pattern. To calculate the likelihood of a share from Company A being more profitable than one from Company B, the
likelihood ratios corresponding to the particular patterns are multiplied. For example, if the pattern for Company A
was 1111 and for Company B was 0000, then all four cues would be diagnostic, and the share from Company A would
be (4/1
⫻ 3/1 ⫻ 7/3 ⫻ 69/31) ⫽ 62 times more likely to be more profitable. In contrast, if the patterns were 0001
for Company A and 0000 for Company B only C
4
would be diagnostic and the share from Company A would be
69/31 or approximately twice as likely to be the more profitable.
65
TESTING TAKE THE BEST
Wyszukiwarka
Podobne podstrony:
Newell, Shanks On the Role of Recognition in Decision Making
Newell, Shanks On the Role of Recognition in Decision Making
Quick Look at Gun Control Analyzing the Issue From Both Si
A Critical Look at the Concept of Authenticity
Gambling in the United States A Quick Look at the Problem
Meditation An indepth look at the 5�0 year old remedy for
Brief Look at the Code of Hammurabi
Brief Look at the European Renaissance
Software Licensing and Piracy An Indepth Look at the Issue
A Look at the Articles of Confederation and the U S Constit
Brief Look at the Holocaust
Brief Look at the Aztec Indians
Brief Look at the Olmec Civilization
A Look at the Celtic Past
The Scud Battery An inside look at the treat US Field Artillery, Jan Feb 1998
Always look at the bright side of life
a quick look at the five basic drill operations
więcej podobnych podstron