Roman Theatre Acoustics; Comparison of acoustic measurement
and simulation results from the Aspendos Theatre, Turkey
Anders Chr. Gade, Martin Lisa, Claus Lynge, Jens Holger Rindel
Section of Acoustic Technology, Oersted•DTU
Technical University of Denmark, DK 2800 Lyngby
acg@oersted.dtu.dk
Abstract
2. The acoustic computer model
Room acoustic measurements have been carried out in
the best preserved of all Roman theatres, the Aspendos
Theatre in Turkey. The results are compared with
simulated values from a rough as well as a very detailed
ODEON model of the theatre.
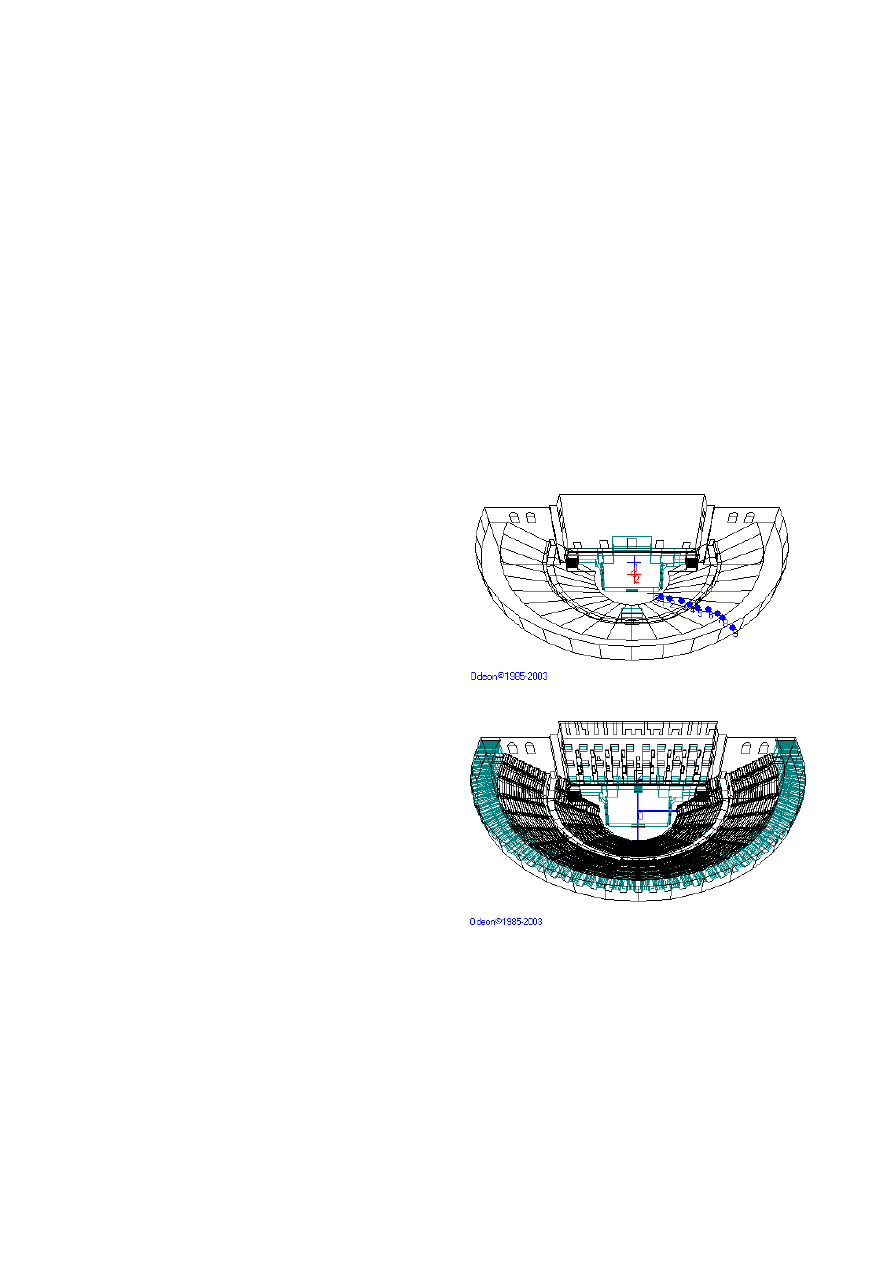
Two versions of the “Odeon” Aspendos model have
been built: a rough version (362 surfaces) with the
Cavea formed as sloping surfaces and only few details
in the skene facade, see Fig. 1, and a far more detailed
model (6049 surfaces) in which each step in the Cavea
and all niches and columns in the skene facade are
included, Fig. 2.
1. Introduction
In the context of a large, international, research project
called “ERATO”: “identification, Evaluation and
Revival of the Acoustical heritage of ancient Theatres
and Odea” funded by the European Union, acoustic
measurements have been carried out in the Aspendos
Theatre in Turkey.
The project is aiming at virtual restoration of
ancient open and roofed Roman theatres and the
purpose of the measurements in the Aspendos Theatre
was to calibrate our room acoustic simulation model
(created in ODEON). This model will later be used to
auralize the sound in virtual presentations of what
theater goers might have experienced in ancient times.
Fig. 1: Crude ODEON model of the Aspendos.
The Aspendos Theatre situated in the Southern
part of Anatolia was built 155 a.d. and it seats about
7000 people. It is the best preserved of all Roman
Theatres, as all parts of the structure are still standing in
full height.
The measurements and simulations to be
presented here concentrate on the room acoustic
parameters described in ISO 3382. Among these, the
strength, G, as a function of distance is believed to be a
key parameter in this open space which at first was
expected to generate little reflected sound energy.
Besides, the degree of detailing in the model and the
choice of diffusion coefficients is believed to influence
the propagation over the empty cavea (the semi circular
seating area).
Fig. 2: Detailed ODEON model of the Aspendos.
Earlier studies dealing with simulation of
Greek and Roman theatres exist [1], [2]; but we have
not yet seen any direct comparison of measured and
simulated data to guide us in how to generate a properly
detailed and tuned computer model. It should be
emphasized that the tuning of this model has not yet
finished at the time of writing. Therefore, the simulated
results presented here just indicate the current state of
the model work.
Absorption coefficients of all surfaces were chosen after
inspection on the site and subsequently adjusted until
the simulated T values in the detailed model were
roughly equal to the measured data. Thus, the current α
values for the highly porous stone surfaces of the Skene
façade and of the vaulted colonnade behind the cavea is
0.2, whereas the value for the more smooth and hard
cavea is equal to 0.05 (constant with frequency in both
cases). These absorption values were subsequently
applied in the rough model as well.
10
2
10
3
0.5
1
1.5
2
Frequency [Hz]
T30 [s]
T30 (Average of all receivers)
Measured (Dirac)
Simulated (High Detail)
Simulated (Low Detail)
As the theatre is frequently used for concerts
and shows, it was equipped with a large mobile stage
during our measurement visit. Consequently, this stage
was also included in the two ODEON models.
3.
Acoustic measurements
The “Dirac” software installed on a portable PC was
used for most of the acoustic measurements. A two
channel microphone with omni and Fig. 8 capsules
(AKG C34) and a (custom built) omni directional
dodecahedron loudspeaker with power amplifier were
connected to the system via an external Edirol UA-5
sound card. The system was calibrated in a
reverberation chamber at DTU (for the sake of the G-
measurements) both before and after the trip to Turkey.
(As we did not trust the calibration process of the Dirac
system completely we also measured G more directly by
means of steady state noise and a B&K 2260 sound
level meter with octave filters. However, apart from
deviations in the 125 Hz octave, the two systems gave
similar results (within about one dB).
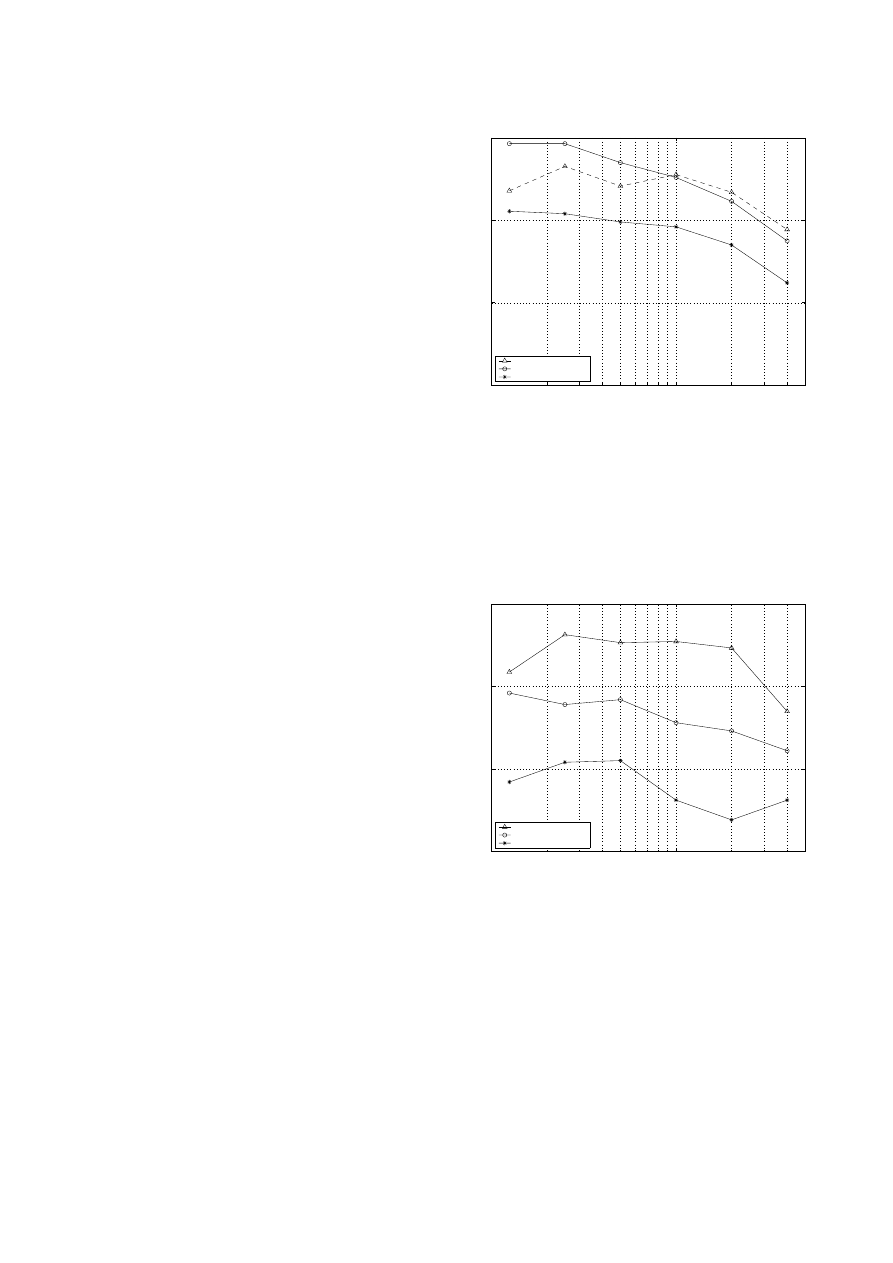
Fig. 3: Measured and simulated Reverberation Time
versus frequency in the Aspendos Theatre (average of
16 receiver positions with source placed center stage).
4.2. Early Decay Time, EDT, versus distance
Also the EDT results from the rough model are far
below the measured values as seen in Fig. 4; but here
also the values from the detailed model are
substantially lower than measured.
The measurement positions were chosen as
points along each of two radial lines in the cavea, one
line was placed in the left side of the theatre (seen from
the audience) about 65
° off the center line whereas the
other line of receivers points formed an angle of 35
° on
the right side of the center line. For most of the results
presented here, the source position was placed 2m to the
right from the center line and about 15m from the Skene
wall. These positions were also used in the simulations,
and one of the lines of receiver points is shown as small
dots in Fig. 1.
10
2
10
3
0.5
1
1.5
2
Frequency [Hz]
EDT [s]
EDT (Average of all receivers)
Measured (Dirac)
Simulated (High Detail)
Simulated (Low Detail)
4. Results
In the following, the simulation results will be presented
along with the measured data. In all graphs, measured
data are marked by “∆”, data from the detailed model by
“□” and values from the rough model by “*”.
4.1.
Reverberation Time, T
The position averaged values of Reverberation Time
(T30) versus frequency are shown in Fig. 3.
Fig. 4: Measured and modeled Early Decay Time
versus frequency in the Aspendos Theatre.
First of all we observe that this theatre has
substantial reverberation in terms of the rate of sound
decay. It is also seen that whereas T in the detailed
model follows the measured values quite well (as a
result of the
α modifications), T in the rough model
comes out far lower – probably because the sloping
cavea in this model quickly directs most of the reflected
sound towards the totally absorbing “ceiling”.
As EDT often varies with position, the 1 kHz octave
values have been plotted against source receiver
distance in Fig. 5. All three sets of data are represented
by two curves, one for each of the lines of receiver
positions described earlier. I all cases the source was
placed center stage.
The results from both models agree with the
measured data that in general EDT increases slightly
with distance; but the measured difference between the
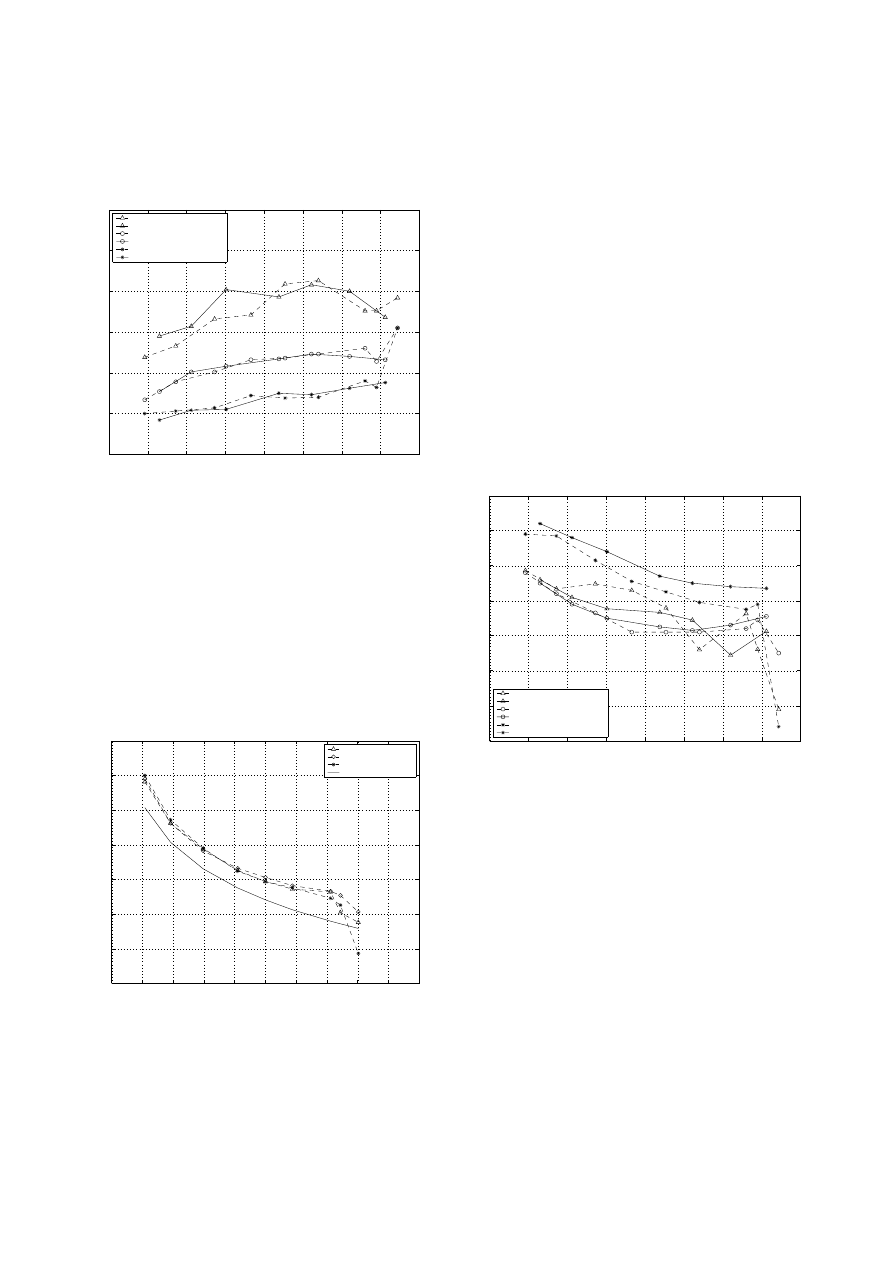
two lines of receiver points at distances below 30m are
not reflected in any of the models. Besides, the general
offsets between the measured data and the two models
as described in Fig. 4 are seen to be highly significant
compared to the variation between receiver positions.
10
15
20
25
30
35
40
45
50
0
0.5
1
1.5
2
2.5
3
Distance from Source [m]
EDT [dB]
EDT at 1000 Hz
Measured (Dirac) DS S2
Measured (Dirac) KS S2
Simulated (High detail) DS S2
Simulated (High detail) KS S2
Simulated (Low detail) DS S2
Simulated (Low detail) KS S2
Fig. 5: Early Decay Time at 1000 Hz versus distance in
the Aspendos Theatre
4.3. Strength, G, versus distance
In connection with measurements and simulations in
the line of receiver points shown in Fig. 1, an
alternative source position in the orchestra area and
near the front edge of the cavea was also used as we
expected it to be a tough test for the models to predict
the attenuation with distance for grazing sound
incidence. However, as seen in Fig. 6, this turned out
not to be the case as the values from both the rough and
the detailed model closely follow the measured data.
0
5
10
15
20
25
30
35
40
45
50
−20
−15
−10
−5
0
5
10
15
Distance from Source [m]
G [dB]
G at 1000 Hz from S3 (DS series)
Measured (Dirac)
Simulated (High detail)
Simulated (Low Detail)
Free Field
Fig. 6: Strength at 1000 Hz versus distance in the
Aspendos Theatre. Source in orchestra. Full line
without points corresponds to G in free field.
Only in the 125 Hz band, substantial
deviations between simulations and measurements
occurred; but these could well be due to measurement
calibration problems, as the curves were simply offset
from each other.)
The lower curve in fig. 5 indicates the
theoretical value of G in a free field. It is seen that the
measured and predicted level is at least 2-3 dB louder;
but the attenuation with distance is almost as steep as
for the direct sound alone, i.e. far steeper than the about
1 dB per 10m which, according to Barron's revised
theory [3], would have been expected beyond the
critical distance (equal to about 12 m) in a closed room
with similar volume (about 80,000 m
3
) and
reverberation time (1.75 Sec.).
The average reverberant level is also lower
than the -2 dB predicted according to empirical models
based on experience in concert spaces [4].
4.4. Clarity, C, versus distance
The measured and ODEON simulated values of Clarity
(C80) at 1kHz versus distance are illustrated in Fig. 7.
Like in Figure 5, the data for each of the two lines of
receiver points are shown separately.
10
15
20
25
30
35
40
45
50
−2
0
2
4
6
8
10
12
Distance from Source [m]
C80 [dB]
C80 at 1000 Hz
Measured (Dirac) DS S2
Measured (Dirac) KS S2
Simulated (High detail) DS S2
Simulated (High detail) KS S2
Simulated (Low detail) DS S2
Simulated (Low detail) KS S2
Fig. 7: Measured and simulated Clarity (1kHz) versus
distance in the Aspendos Theatre.
As observed for the reverberation time, the detailed
model is better than the rough in matching the
measured data; but the fit is not too impressing. Still,
the deviations between measurements and the detailed
model are not systematic as seen for EDT.
The average C value being about 5dB is
certainly high compared with the expected value of -0,6
dB in a closed room with a purely exponential decay
and similar T. Taking into account the large width of the
theatre (about 100 m) and the steeply sloped seating,
higher C values can be expected according to regression
formulae derived from experience in closed halls [4];
but even this empirical approach would suggest the
position averaged C to be no higher than 3 dB.

5. Discussion
Although the tuning of the model(s) to improve the fit
to the measured data is still in progress, the differences
between measured and predicted results reported here
are probably typical for what can be achieved. Thus it
is likely that adjustment of model parameters to obtain
a better fit of one acoustic parameter may result in
larger differences for other parameters.
Besides the degree of geometrical detailing
and the absorption coefficients, also the choices of the
diffusion coefficients and the reflection order at which
the calculation method goes from an image model to
pure ray tracing can influence the simulation results
substantially. The possibilities of adjusting all of these
variables - in a meaningful way - have not yet been
exhausted.
6. Conclusions
The soundfield in the Aspendos theatre is
characterized by a considerable long reverberation time
and Early Decay Time, EDT, but compared with roofed
theatres or concert halls, the sound strength, G, is low
and the clarity of the sound, C, (and presumably the
speech intelligibility) is high due to a low level of the
reverberant field - obviously caused by the absence of a
ceiling.
Regarding computer simulations of the theatre,
we have found it important - at least when modeling the
empty theatre – to include the actual steps in the cavea
as otherwise the T and EDT values turned out far too
low. However, at least in the current state of
development, also the detailed model gives too low
EDT values. Contrary to our expectations, both models
are capable of predicting the attenuation of level with
distance from the source with proper accuracy in all
octave bands above 125 Hz.
In the aural presentation, we hope also to be
able to present values of RT in the occupied theatre,
values of the Speech Transmission Index, STI, and
perhaps even some live recordings and ODEON
auralizations from this fine ancient theatre.
7. Acknowledgements
The ERATO project is financed through the European
Union, INCO-MED contract number ICA3-CT-2002-
10031. We wish to express warm thanks to our
colleagues from the Yildiz Technical University in
Istanbul for organizing the measurement session in the
Aspendos Theatre. The measurements were performed
in parallel with our ERATO partners from the
University of Ferrara; but all the ERATO partners from
Turkey, Italy, Switzerland, France and Jordan present
on the site during our measurement session in October
2003 deserve thanks for their assistance - not least by
keeping the many tourists quiet during the recordings.
8. References
[1] Chourmouzladou, P & Kang, J., “Acoustic
Simulation of Ancient Greek and Chinese
Performance Spaces”, Proceedings of the IOA,
Vol. 24, Pt. 4, 2002.
[2] Vassilantonopoulos, S.L. and Mourjopoulos, J.N.,
“A Study of Ancient Greek and Roman Theater
Acoustics" Acta Acustica Vol. 89 (2003) p. 123-
135.
[3] Barron, M.F.E. and Lee, L.-J., ``Energy relations in
Concert Auditoria'', J. Acoust. Soc. Am. Vol. 84
(1988). p. 618-628.
[4] Gade, A. C., “The influence of basic design
variables on the acoustics of concert halls; New
results derived from analysing a large number of
existing halls" Proceedings of the IOA, Vol. 19, Pt.
3, 1997.
Document Outline
- Introduction
- The acoustic computer model
- Acoustic measurements
- Results
- Discussion
- Conclusions
- Acknowledgements
- References
Wyszukiwarka
Podobne podstrony:
Comparison of Human Language and Animal Communication
Alta J LaDage Occult Psychology, A Comparison of Jungian Psychology and the Modern Qabalah
Rahmani, Lavasani (2011) The comparison of sensation seeking and five big factors of personality bet
Comparison of Adolf Hitler and Joseph Stalin doc
The Comparison of Karl Mark and Matthew Arnold
Angelo Farina Acoustic Measurements In Opera Houses Comparsion
AJA Results of the NPL Study into Comparative Room Acoustic Measurement Techniques Part 1, Reverber
comparison of PRINCE2 against PMBOK
A Comparison of two Poems?out Soldiers Leaving Britain
A Comparison of the Fight Scene in?t 3 of Shakespeare's Pl (2)
Comparison of the Russians and Bosnians
Articulation and acoustics Ladefoged and Johnson (2011; 8 17)
43 597 609 Comparison of Thermal Fatique Behaviour of Plasma Nitriding
Comparision of vp;atile composition of cooperage oak wood
1 3 16 Comparison of Different Characteristics of Modern Hot Work Tool Steels
więcej podobnych podstron