
CAIA Technical Report 040804A
August 2004
page 1 of
10
The impact of Microsoft Windows
infection vectors on IP network traffic patterns
John Nguyen
1
Centre for Advanced Internet Architectures. Technical Report 040804A
Swinburne University of Technology
Melbourne, Australia
jnguyen@swin.edu.au
Abstract- This technical report describes a set of tools and
techniques to capture and analyse virus-generated IP network
traffic. We analyse seven viruses, worms, trojans and spyware
that are common in Microsoft Windows environments. We log
and analyse the IP traffic generated in the roughly 15 minutes
after each infection. Based on the resulting IP traffic patterns we
estimate the likely financial impact of having an infected PC
connected to a consumer-grade, broadband Internet connection.
Keywords- Viruses, Worms, Trojans, Spyware, Traffic Patterns,
Financial Impact
I.
I
NTRODUCTION
Over the past few years, the number of computer
virus, worm, trojan and spyware attacks is on a very sharp
rise. These so-called “malicious programs” have now
been equipped with sophisticated techniques in order to
trick any computer users. Along with the increasing
popularity of the Internet, they are also becoming more
network-aware than ever before. Despite tremendous
defensive efforts from worldwide anti-virus vendors and
computing security community, the impacts of many
virus attacks are still very significant at the global scale.
How would the IT industry embracing its vision of
revolutionising the way people work while at present,
usability of computers, availability of networks and
confidentiality of information are still at a substantial risk
from computer viruses.
We all know how dangerous & widely spread some
network viruses are. But, what is the bottom line of their
attacks? In less than 5 years, we have witnessed many
severe economical impacts that viruses and worms have
created.
According
to
an
estimate
from
computereconomics.com, Melissa, the first major
Internet virus spreading via emails in 1999 resulted in a
loss of approximately 1.5 billion US dollars for
corporations and government agencies around the world.
Damage estimates for LoveBug, CodeRed, Nimda,
SoBig, Slammer.etc. are also very significant with more
than a billion US dollars for each virus [1]. One of the
most recent Internet worms, MyDoom (appeared in 2004)
is claimed to reach the mark of 4 billion US dollars.
MyDoom and its variants spread wildly over the Internet
via emails and had DoS attacks targeted at corporate
websites such as Microsoft, SCO.etc. and search engines
such as Google, Yahoo, Lycos, AltaVista.etc. [3][4]
On the other hand, trojan horses and spyware have
been rapidly propagating through emails, instant
messaging, P2P applications, browser hijacking.etc. Once
executed, these small malicious programs can exploit
various potential vulnerabilities of the victim. (Such
programs are quite common among PCs running the
Microsoft Windows operating system.) They can
bombard users with popups, redirect client browsers, log
key presses, send out confidential information, and open
backdoors for unauthorised access to the victim’s
computer. The costs of these attacks are much harder to
quantify and varied from case to case depending on the
real value of lost information, productivity and time.
The task to determine the overall cost impact when a
computer system was hit with one or a combination of
viruses, worms, trojan horses, spyware etc. is not trivial.
In many situations, IT security professionals working in
commercial environment have the responsibility and
obligation to come up with a meaningful figure in order to
quantify the bottom line of virus damages. Many home
computer users also need to have an in-depth
understanding of the threats and consequences imposed
by virus infection and therefore being able to protect
themselves from serious troubles and unjustified charges
from their Internet providers..
In reality, network traffic generated by viruses,
worms, trojans, etc is accounted for a large part of the
overall damage cost figure. Therefore the aim of our
research is to come up with a structured process to assist
the victim to estimate network damages by virus
infection. In order to demonstrate this process, seven
well-known Internet viruses, worms, trojan horses and
spyware were chosen for the study of their network
behaviours and traffic patterns.
Ultimately we aim to answer the following questions
from the perspective of a Microsoft Windows machine
infected with a typical virus, trojan or worm:
•
What type of network attacks, traffic patterns and
network loads are caused by each infection?
•
How many Mbytes per hour, day or month would be
consumed and how much would this cost a typical,
broadband-attached ‘always on’ PC?
1. The author is currently a final year Telecommunications Engineering student at Swinburne University of Technology
CAIA Technical Report 040804A
August 2004
page 2 of
10
This technical report is organised to explain in details
various steps of the study process including: setup of the
controlled testbed, selection of viruses, experimental
procedure and analysis of the information collected from
experiments. The final results will then be used to derive
potential financial impacts on typical home broadband
Internet users.
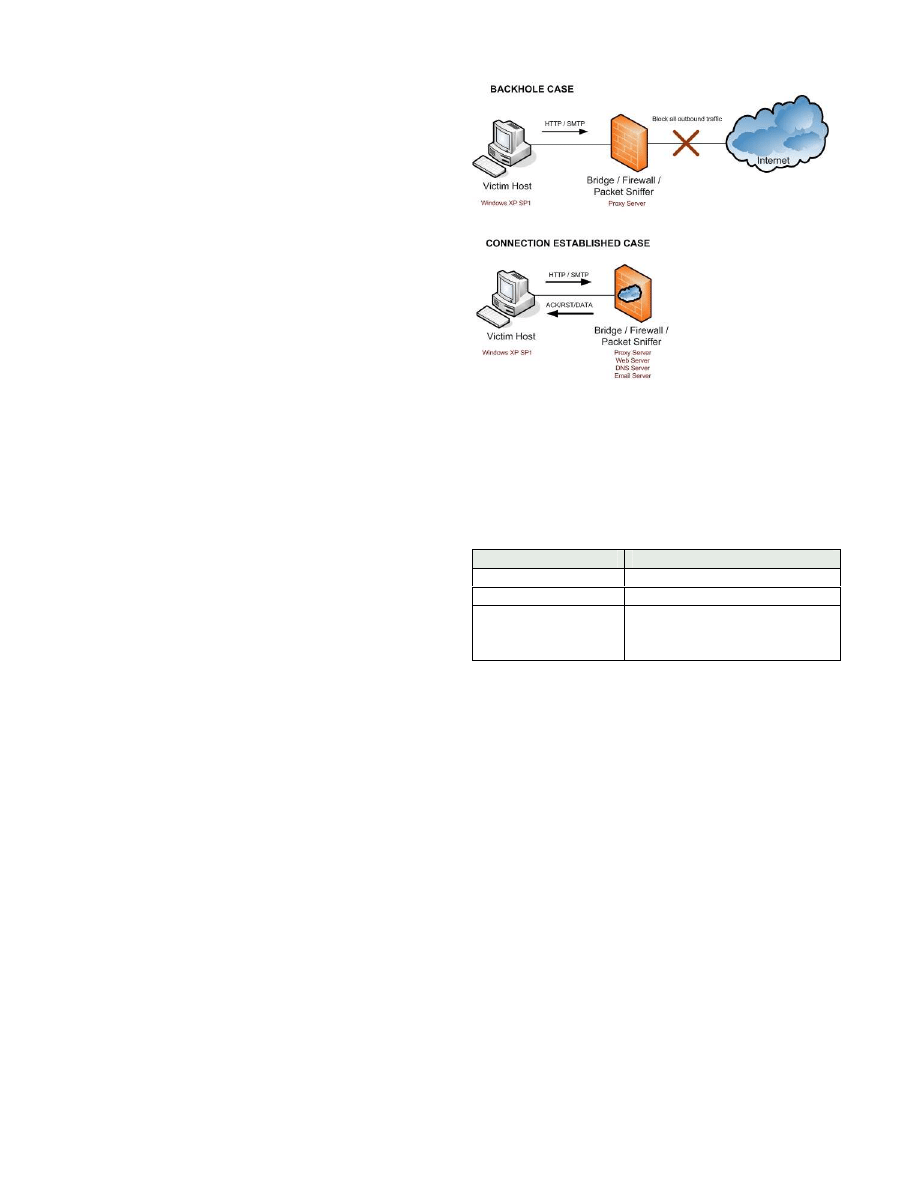
II.S
ETUP OF THE CONTROLLED TESTBED
The testbed consists of 2 computers connected via a
crossover cable. This setup is shown on in Figure 1. Using
this testbed setup we have been able to perform many
experiments on various type of viruses, worms, trojans
and spyware. Depending on the observation of malicious
network activity, the experimental strategies are changed
in order to record all possible actions from viruses.
The victim host runs Windows XP (version 5.1 2600
Service Pack 1) with all the latest patches and security
updates at 29th of June 2004. It is injected with a copy of
the virus under each experiment.
The sniffing host runs FreeBSD OS (v4.10) with the
following components installed and enabled:
•
Bridging and ipfw (Firewall)
•
tcpdump packet sniffer
•
thttpd (Web server)
•
sendmail (Email server)
•
BIND (DNS server)
•
tinyproxy (Proxy server)
Initially, we enable bridging support and firewall
(with ipfw) on the sniffing host. Tcpdump is the
packet-sniffing tool used to log inbound and outbound
Ethernet traffic originated from or destined to the victim.
Only DNS traffic is allowed to be forwarded beyond the
firewall so the domain names and IP addresses of the
virus targets can be determined. This configuration is
referred to as “blackhole” case. Because all of outgoing
TCP connections are blocked hence there are no
responses coming back to the victim host. A few tiny
proxy services are run on some regular ports such as 80,
8000, 8080 in order to log web traffic requests from the
victim host.
As the experiments evolved, we setup various network
services such as DNS, Web and Email on the sniffing host
to trick the viruses into thinking this is their ultimate
target. We configured the victim host to send its DNS
requests to a local DNS server on the sniffing host, which
then returned its own address in response to specific DNS
requests issued by the infected host. In this manner we
tricked the viruses into using the mail and web servers on
the sniffing host. This configuration is refered to as the
“connection established” case due to successful http (DoS
attack) and smtp (mass mailing) established connections
between the victim and the sniffing host.
III.S
ELECTION OF VIRUSES
,
WORMS
,
TROJAN HORSES AND
SPYWARE
An important step before the experiments is to select a
set of well-known viruses, worms, trojans and spyware to
conduct the study on. Table 1 shows the main selection
criteria and the list of malicious software chosen for the
experiments.
Selection criteria
Virus/Worm/Trojan/Spyware
Popularity
Sasser.A, MyDoom.E
Financial impact
Lovesan, MyDoom.E
Types of propagation
and attack
NetSky.R (mass mailing worm),
Gator (Spyware), SpyBot (P2P
Worm) and SubSeven (Trojan)
Table 1 Selection Criteria
Subsequently, virus samples can be obtained from the
following sources:
•
Virus Exchange Board (VX Discussion Board)
•
Virus Collection Website (e.g.: VX Heavens at
http://vx.netlux.org)
•
Viri collection hobbyist and trader (many post
their email & collection information on the
Internet)
It is an interesting fact that many of these viri sources
are created and maintained to serve a very legitimate
purpose, to facilitate the study and understanding of
computer viruses. The following note extracted from the
homepage of Virus Heaven has reflected this principle.
“Some of you might reasonably say that it is illegal to
offer such content on the net. Or that this information can
be misused by "malicious people". I only want to ask that
person: "Is ignorance a defence?" (vx.netlux.org)
Figure 1 Testbed Configuration

CAIA Technical Report 040804A
August 2004
page 3 of
10
IV.E
XPERIMENTAL PROCESS
&
TOOLS
A process and a collection of tools have been setup for
all experiments to ensure the collected results are
consistent and accurate. They are described as below:
A. The process
Step
Procedure
1. Baseline the
test
Re-image the victim host to a clean
installation of MS Windows. Measure
all traffic, currently running processes,
threads and opened ports of the
Windows host before any infection
2. Execute &
observe
behaviours of
viruses
Activate virus sample and observe
changes done to registry, file system,
CPU usage, threads, TCP ports. etc.
3. Sniff traffic
from/to the
victim host
Run tcpdump from the sniffing host to
collect all traffic coming in and out of
the victim.
4. Analyse
captured
traffic
Use Ethereal to analyse traffic
patterns, TCP flows, frequency and
destination of attacks.
5. Refine the
experiment
From results of step 4 refine the
experiment: capture for longer period,
simulate the target by installing
network services such as DNS, Web,
Email to respond to virus requests. etc.
Table 2 Experimental Process
B. The Tools
•
Fport: used to display all victim’s opened ports
•
Process Explorer: used to display processes &
threads under Win32 OS
•
tcpdump: used to sniff traffic from the victim’s
host and write it to a file for later analysis. It is
running on the sniffing host with the following
syntax:
tcpdump –i <interface> –s0 –w <file> host <victim ip>
•
Ethereal: used to analyse traffic patterns and
TCP flows
•
PacketPlotter: an Excel VBA application to
graph exported data from Ethereal.[8]
V.R
ESULTS AND ANALYSIS
Using the raw data collected from the experiments,
information visualisation techniques have been applied to
gain meaningful insights into various virus traffic
patterns. The final results can be represented in the 2
types of graphs:
•
Traffic Profile Graph to show the patterns and
fluctuation of traffic in a period of time
•
Accumulative Traffic Graph to show the net total
of traffic so far vs. time.
Quantitative analysis of the financial and link speed
impact imposed on the victims can be done based on the
following scenarios.
Scenario
Plan Details
Typical Home
broadband ISP
scenario 1
•
Used to quantify how much extra
dollars to pay a month
•
Telstra ADSL 500MB Limited Plan
•
256/64 Kbps speed (in real life ~
217/54
Kbps
max
for
85%
efficiency factor)
•
15 cent for extra Megabyte upload /
download
Typical Home
broadband ISP
scenario 2
•
Used to quantify how many days
virus consume all allowed quota
•
Optus ADSL Value 1GB Plan
•
512/128 Kbps speed (~ 435/108
Kbps max for 85% efficiency
factor)
•
Rate limited to 28.8 Kbps until the
rest of the month when quota
exceeded
Table 3 Assumption scenarios
Note that the maximum charge is calculated based on
scenario 1. We further assume that the user has already
consumed 50% of his or her allocated monthly quota.
Therefore, all virus-generated traffic need to consume the
rest of the allowed quota (50%) before the user is charged
15 cents for any extra megabyte.
We calculate the actual speed of the plan in scenario 1
as 85% of 256/64 Kbps (217/54 Kbps), roughly taking
into account Ethernet framing and ATM
overheads used
in ADSL links. The percentage utilisation of upstream
and downstream bandwidth is then calculated as the
percentage of 217/54 Kbps.
The results and analysis obtained from all the
experiments
are
summarised
in
the
following
subsections.
C. Sasser.A
Sasser.A is a worm designed to exploit Windows
Directory Service vulnerability. It can only successfully
infect Windows XP and Windows 2000 systems. The
worm constantly scans a range of IP addresses on port
444, 50% of them are deduced from the host; the other
50% are generated randomly.
The worm firstly tries to connect to the generated IP
address on TCP port 445 to determine if a remote
computer is online. If a connection is made to a remote
computer, the worm will send shell code to open a remote
shell on TCP port 9996. It then uses the shell on the
remote computer to reconnect to the infected computer's
FTP server, running on TCP port 5554, and retrieve a
copy of the worm.
CAIA Technical Report 040804A
August 2004
page 4 of
10
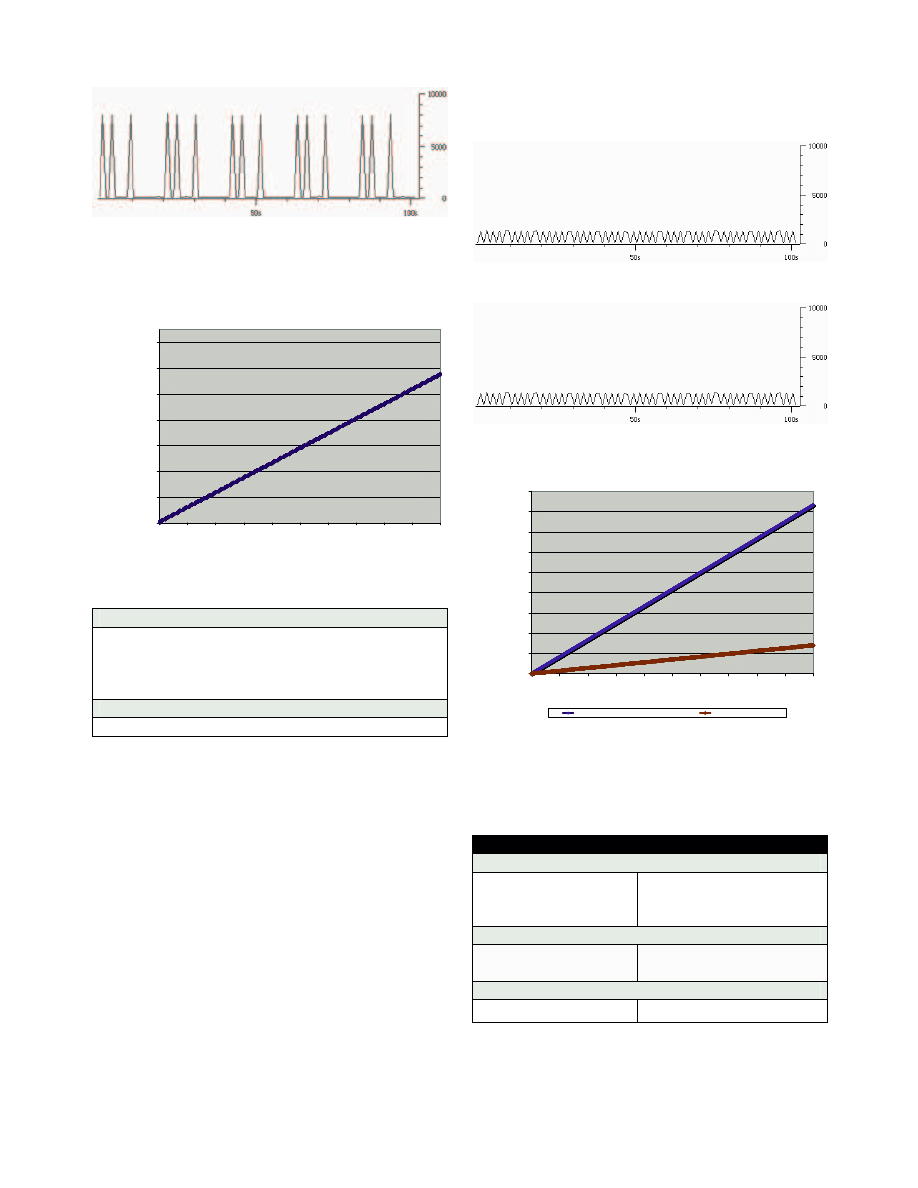
Observation of Sasser.A’s traffic profile shows that
there is a pattern of three TCP traffic bursts every 20
seconds, after this the worm sleeps roughly 20 seconds
before launching the next attack.
Table 4 shows a summary of the results analysis:
Upstream Traffic
99.9 % TCP
1.146 Kbytes/sec
3.06 Gbytes/month
17% BW
Max Charge
$458 / month
Table 4 Sasser.A Analysis
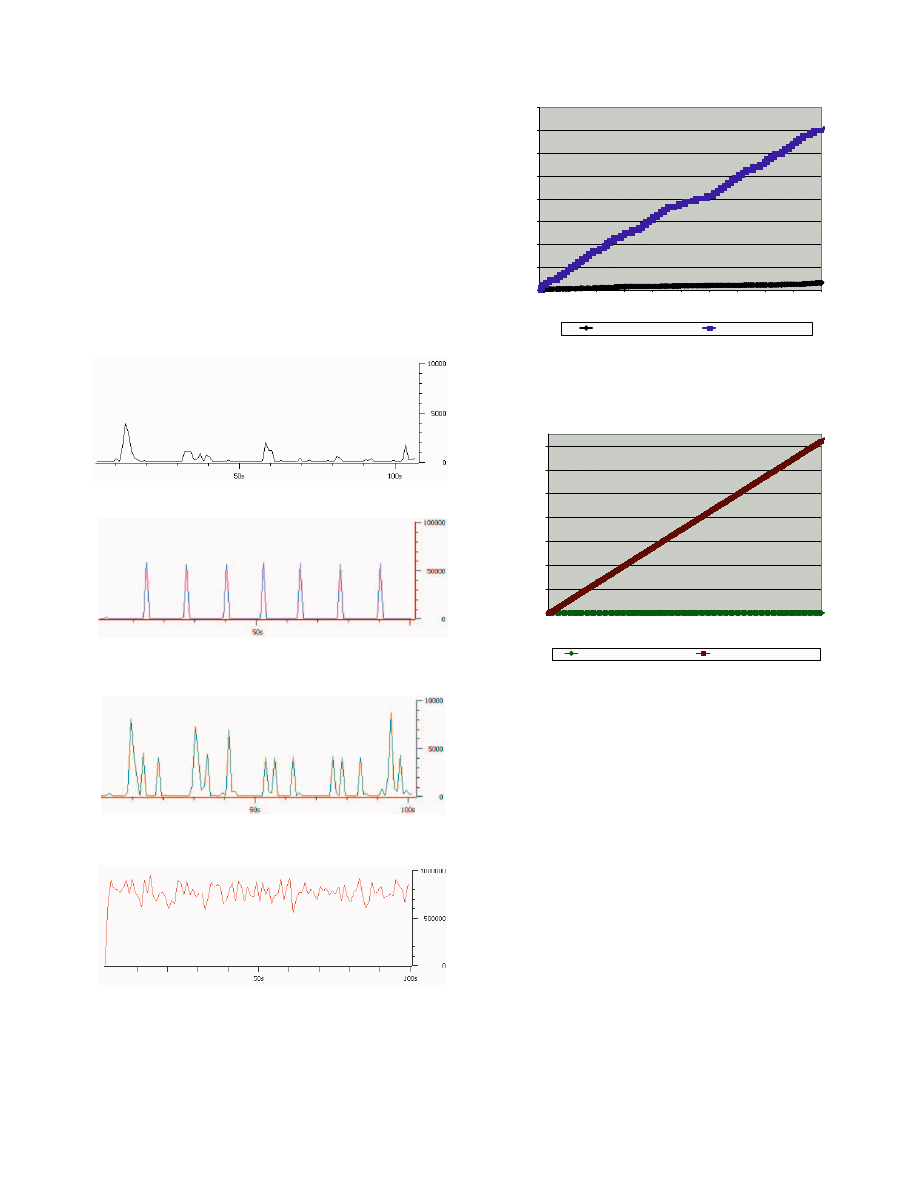
D. Lovesan
Lovesan is a Blaster worm variant designed to exploit
Windows’ NETBIOS vulnerability. It constantly scans a
range of IP addresses on port 135. Two out of five cases
are deduced from the host the other three are generated
randomly.
The worm works by sending a buffer-overrun request
to TCP port 135 of a vulnerable victim machine. If this
succeeds, the victim machine starts a command shell on
TCP port. The worm runs the thread that opens the
connection on port 4444 and waits for FTP "get" request
from victim machine. The worm then sends a special
request to the victim machine to force it to send this "FTP
get" request to download the worm copy from infected
machine, and then activated it. The worm can also launch
Denial of Service attack against windowsupdate.com.
We tested Lovesan in 2 cases: blackhole case and
another case where there are ACK/RST packets coming
back.
We see that when ACK/RST packets are returned the
total traffic is five times greater than the blackhole case.
Table 5 summarises these results.
Blackhole case
ACK/RST returned case
Upstream Traffic
0.7 Kbytes/sec
1.86 Gbytes/month
10.3% BW
2 Kbytes/sec
30.5% BW
Downstream Traffic
None
2 Kbytes/sec
7.7% BW
Max Charge
$458 / month
$1665 / month (11.1Gb)
Table 5 Lovesan Analysis
Figure 3 Sasser.A traffic profile
0
200,000
400,000
600,000
800,000
1,000,000
1,200,000
1,400,000
0
100
200
300
400
500
600
700
800
900
1000
Time [s]
A
c
c
u
m
u
la
ti
v
e
T
ra
ff
ic
[
b
y
te
s
]
Figure 4 Sasser.A accumulative traffic(bytes) v.s time(s)
Figure 5 Sasser.A traffic profile (blackhole case)
Figure 6 Lovesan traffic profile (returned ACK/RST pkts)
0
500,000
1,000,000
1,500,000
2,000,000
2,500,000
3,000,000
3,500,000
4,000,000
4,500,000
0
100
200
300
400
500
600
700
800
900
1000
Time [s]
A
c
c
u
m
u
la
ti
v
e
T
ra
ff
ic
[
B
y
te
s
]
Returned ACK/RST case
Blackhole case
Figure 7 Lovesan accumulative traffic v.s time (blackhole and returned
ACK/RST pkts case)
CAIA Technical Report 040804A
August 2004
page 5 of
10
E. MyDoom.E
MyDoom.E is a mass mailing worm and is also
capable of carrying out DoS (Denial of Service) attacks to
origin2.microsoft.com site between the 17th and 22nd of
the month. It uses its own SMTP engine to construct
outgoing messages with attached copy of viruses and
send it directly to the recipient's email server.
Due to the different modes of attack, MyDoom has
been proclaimed as the most virulent e-mail virus ever.
According to onlinesecurity.com, by 27 January 2004,
MyDoom had reached more than 160 countries and, at
one point, may have represented more than one-tenth of
all e-mail traffic worldwide.[2] We tested MyDoom in 4
cases:
mass-mailing
into
blackhole
(case
1),
mass-mailing successfully (case 2), DoS attack into a
blackhole (case 3) and DoS attack successfully (case 4).
From observation of the 4 different traffic profiles
(Figure 12 and Figure 13), we can conclude that the most
dangerous case would be when MyDoom carry out the
DoS attack successfully (case 4). As the worm spawns out
multiple “HTTP GET” requests to a particular web site
and got the responses coming back; both upstream and
downstream bandwidth of a user’s Internet connection
can be consumed totally. If the attack target is down,
blocked or not responding (case 3), we observed that the
worm also tried to send out emails with attached copies of
itself, however most of the worm generated traffic was
still DoS attack.
The second worst case is when the worm successfully
establishes smtp connections to carry out mass mailing
(case 2). Although the traffic load is not as intense as a
successful Dos attack (case 4), mass-mailing mode can
generate many flows of DNS (dominantly in case 1) and
SMTP traffic, which results in bursts every 10 second
when emails are sent successfully.
Figure 8 Mydoom traffic profile (case 1)
Figure 9 Mydoom traffic profile (case 2)
Figure 10 Mydoom traffic profile (case 3)
Figure 11 Mydoom traffic profile (case 4)
0
500,000
1,000,000
1,500,000
2,000,000
2,500,000
3,000,000
3,500,000
4,000,000
0
100
200
300
400
500
600
700
800
900
1000
Time [s]
A
c
c
u
m
u
la
ti
v
e
T
ra
ff
ic
[
B
y
te
s
]
Blackhole (case 1)
Successful (case 2)
Figure 12 MyDoom accumulative traffic(bytes) v.s time(s) (case 1 and 2)
0
100,000,000
200,000,000
300,000,000
400,000,000
500,000,000
600,000,000
700,000,000
0
100
200
300
400
500
600
700
800
900
1000
Time [s]
A
c
c
u
m
u
la
ti
v
e
T
ra
ff
ic
[
b
y
te
s
]
Blackhole DoS (case 3)
Successful DoS (case 4)
Figure 13 MyDoom accumulative traffic(bytes) v.s time(s) (case 3 and 4)
CAIA Technical Report 040804A
August 2004
page 6 of
10
Successful emails sent out by the worm contain a
subject generated from a list such as “Read it
immediately!”, “Important”, “Accident”, “For you”,
“Expired Account”, etc. The email attachments
(approximately 20 Kbytes each) with the worm copy are
named details.zip, notes.zip, product.zip, etc.
Table 6 summarises these results.
Case 1
Case 2
Upstream Traffic
52.02 % DNS
0.15 Kbytes/sec
0.38 Gbytes/month
2.2% BW
56% SMTP, 9% DNS
5.78 Kbytes/sec
15.47 Gbytes/month
78.8% BW
Max Charge
$57 / month
$2320 / month
Case 3
Case 4
Upstream Traffic
99.4 % TCP (HTTP)
0.72 Kbytes/sec
1.9 Gbytes/month
9% BW
99.9 % TCP (HTTP)
23.67 Kbytes/sec
100% BW
Downstream Traffic
None
27(<709) Kbytes/sec
100% BW
Max Charge
$285 / month
$19500 / month
Table 6 MyDoom Analysis
F. Netsky.R
Netsky is another widespread mass mailing worm
(similar to myDoom). It is written by the same author of
the Sasser worm, an 18 year old teenager (Sven Jaschan)
living in the village of Waffensen, Germany[11].
According to anti-virus vendor Sophos, up to 70% of all
virus activity in the first six months of 2004 is linked to
Sasser, Netsky and their variants[12].
Netsky worm works by searching through victim files
in order to obtain valid email addresses. It also uses its
own SMTP engine to construct outgoing messages with
attached copy of itself (usually with .pif extension). These
emails are sent directly to the recipient's email server.
Email source spoofing is utilised by this worm to trick
users about the origin of the infected emails they receive.
In this case, the situation is similar to case 2 of
MyDoom experiment. The traffic profile shows constant
flows of DNS requests from the worm to try resolving
MX records of the domains where its victims belong.
Table 7 shows a summary of the results collected from the
experiment:
Upstream Traffic
72.5 % UDP (DNS)
0.547 Kbytes/sec
1.45 Gbytes/month
8% BW
Max Charge
$217 / month
Table 7 NetSky Analysis
G. Gator
Gator is a program in the adware / spyware category.
Gator includes a software component from GAIN
advertising, which is also bundled with other free
software like DivX player; WeatherBug, Kazaa .etc.
GAIN displays lots of pop-up advertising and gathers
extensive details about user’s computer setup and
browsing habits. Although Gator claims that it collects no
personally identifiable information, their privacy policy
state that they collect the following information: some of
the Web pages viewed, the amount of time spent at some
Web sites, response to GAIN Ads, standard web log
information (excluding IP Addresses) and system
settings, what software is on the personal computer,
software usage characteristics and preferences [13].
Figure 14 Netsky traffic profile (blackhole)
0
100,000
200,000
300,000
400,000
500,000
600,000
700,000
0
100
200
300
400
500
600
700
800
900
1000
Time [s]
A
c
c
u
m
u
la
ti
v
e
T
ra
ff
ic
[
B
y
te
s
]
Figure 15 Netsky accumulative traffic(bytes) v.s time(s) (blackhole)
Figure 16 Gator traffic profile
CAIA Technical Report 040804A
August 2004
page 7 of
10
It is seen that that there are 2 distinct processes
running at the same time after Gator installation.
GMT.EXE is used to pull down advertising content from
GAIN, the Gator Advertising Information Network and
CMESYS.EXE is used to track the visited web sites and
send the information to the GAIN servers.
The observation shows that in a period of 1000
seconds (~16 minutes), there are 5 “HTTP GET” requests
to pull down data from the servers such as bc2.gator.com,
ss.gator.com, etc. There are also occasional “HTTP
POST” actions that occurred randomly during the
experiment. Table 8 shows a summary of the results
collected from the experiment:
Downstream Traffic
99.9 % TCP (HTTP)
62 bytes/sec
150 MB/month
0.2% BW
Max Charge
$22 / month
Table 8 Gator Analysis
H. Spybot
Spybot combines characteristics of a virus, a worm
(P2P type) and a keylogger program. It currently has
more than 1000 variants. Once activated, the worm copies
itself into "kazaabackupfiles". Copies have enticing
names such as "porn.exe", "Matrix Screensaver 1.5.scr",
"Smart Ripper v2.7.exe", etc. to attract people to
download the worm through Kazaa P2P file sharing
network.
Once the downloaded copy of the worm is executed,
the cycle repeats itself. The worm also tries to connect to
a few specified IRC servers to report successful infection
in order to join a channel to receive commands (DoS
attacks, copying itself to hardcode Windows folders.etc.).
Spybot worm also continuously logs user’s keypress
records into a short text file "keylog.txt" which is stored
under Windows system folder.
Table 9 shows an example of keylog.txt file
[02:Jul:2004, 13:15:31] Keylogger Started
[13:19:33] Google Search: Worm.P2P.SpyBot - Microsoft Internet Explore irc (Return)
[13:22:49] Google Search: irc - Microsoft Internet Explorer d 10.0.1.128 (Return)
[13:22:53] Google Search: ircd 10.0.1.128 - Microsoft Internet Explore [Del] (Return)
[13:23:13] Worm.P2P.SpyBot - Microsoft Internet Explorer [CTRL]c (Changed window)
[13:23:20] Google Search: ircd - Microsoft Internet Explorer v[CTRL] irc (Return)
[13:23:48] Find f[CTRL]irc (Return)
[13:26:13] C:\WINDOWS\System32\cmd.exe - fport -a [Up] (Return)
[13:26:48] Symantec Security Response - W32.Spybot.Worm - Microsoft In c[CTRL]
(Changed window)
[13:26:52] Google Search: Worm.P2P.SpyBot - Microsoft Internet Explore remove
v[CTRL] (Return)
Table 9 Spybot key logging example
From the experiment, we see that Spybot has a list of
IRC server’s IP addresses that it keeps rotating through in
order to establish connections on port 6667. Table 10
shows a summary of the results collected from the
experiment:
Upstream Traffic
99.9 % TCP (HTTP)
0.344 Kbytes/sec
0.91 GB/month
5% BW
Max Charge
$136 / month
Can be substantial if victim instructed to download
files or function as FTP Server
Table 10 SpyBot Analysis
0
500,000
1,000,000
1,500,000
2,000,000
2,500,000
3,000,000
3,500,000
4,000,000
0
10000
20000
30000
40000
50000
60000
Time [s]
A
c
c
u
m
u
la
ti
v
e
t
ra
ff
ic
[
B
y
te
s
]
Figure 17 Gator accumulative traffic(bytes) v.s time(s)
0
50,000
100,000
150,000
200,000
250,000
300,000
350,000
0
100
200
300
400
500
600
700
800
900
1000
Time [s]
A
c
c
u
m
u
la
ti
v
e
T
ra
ff
ic
[
B
y
te
s
]
Figure 18 Spybot accumulative traffic(bytes) v.s time(s)
Figure 19 Spybot Traffic Profile
CAIA Technical Report 040804A
August 2004
page 8 of
10
I.
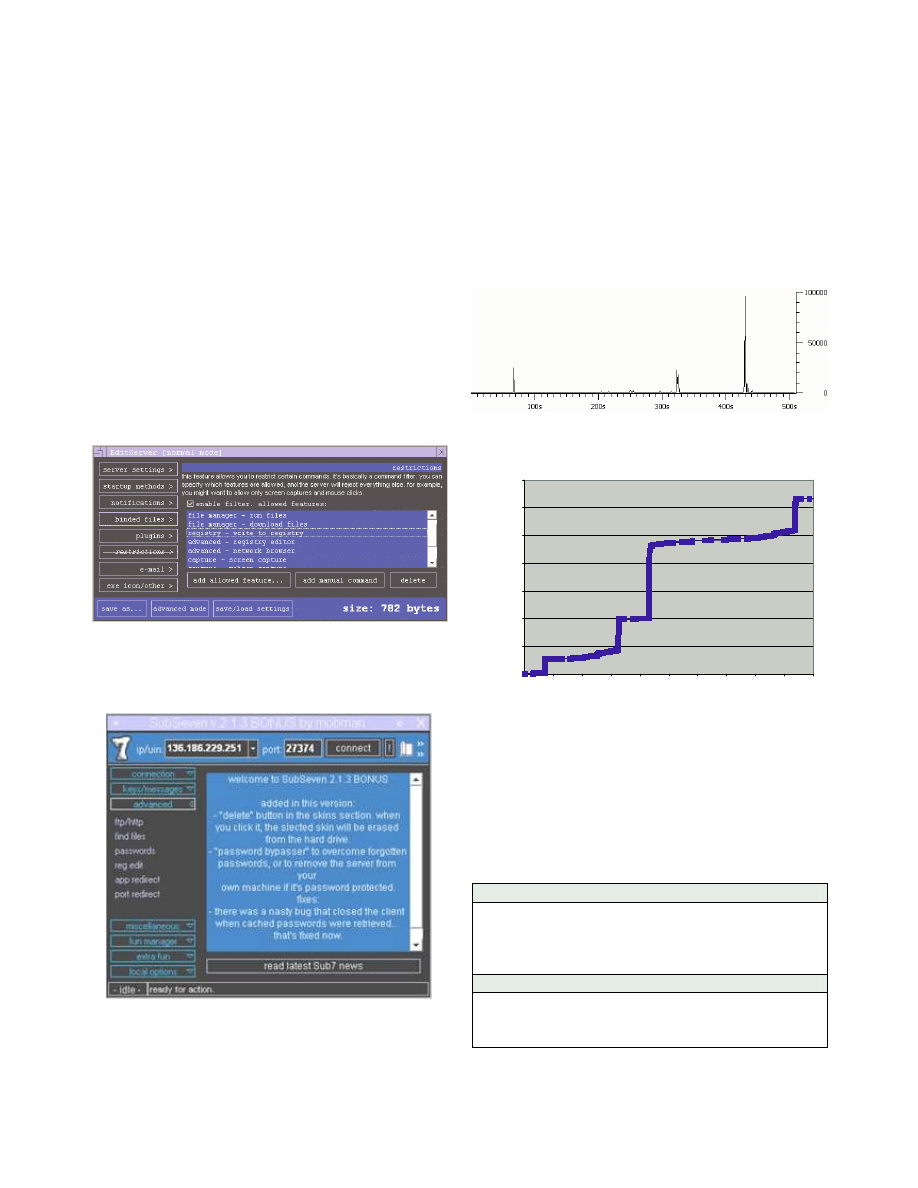
SubSeven
SubSeven is a trojan that belongs to the
Backdoor.SubSeven trojan horse family. Like other
trojans, SubSeven is divided into two parts: a client
program that the attacker runs on his own machine, and a
server that is run on the victim's computer. SubSeven is
usually spread via emails, P2P networks, Instant
Messaging. etc.
There are various versions of the software package
that is used to create the server component of the trojan.
There are also many options to customise the trojan
appearance and functionalities such as:
•
The icon of the server executable can be changed.
•
Server.exe file can be bind with other files (mp3.
jpeg.etc)
•
ICQ can be set to notify hacker when the Trojan
first activates
Figure 20 shows a screenshot of the software used to
create the server component of SubSeven.
Figure 21 shows a screenshot of the SubSeven v2.2
control program
When the server portion of SubSeven runs on a
computer, the individual who uses the SubSeven control
program can remotely access the victim’s computer. He
or she can do the following: [15]
•
Set it up as an FTP server
•
Browse/Edit/Delete files on that system
•
Capture real-time screen information
•
Open and close programs
•
Edit information in currently running programs
•
Hang up a dial-up connection
•
Remotely restart a computer
•
Edit the registry information
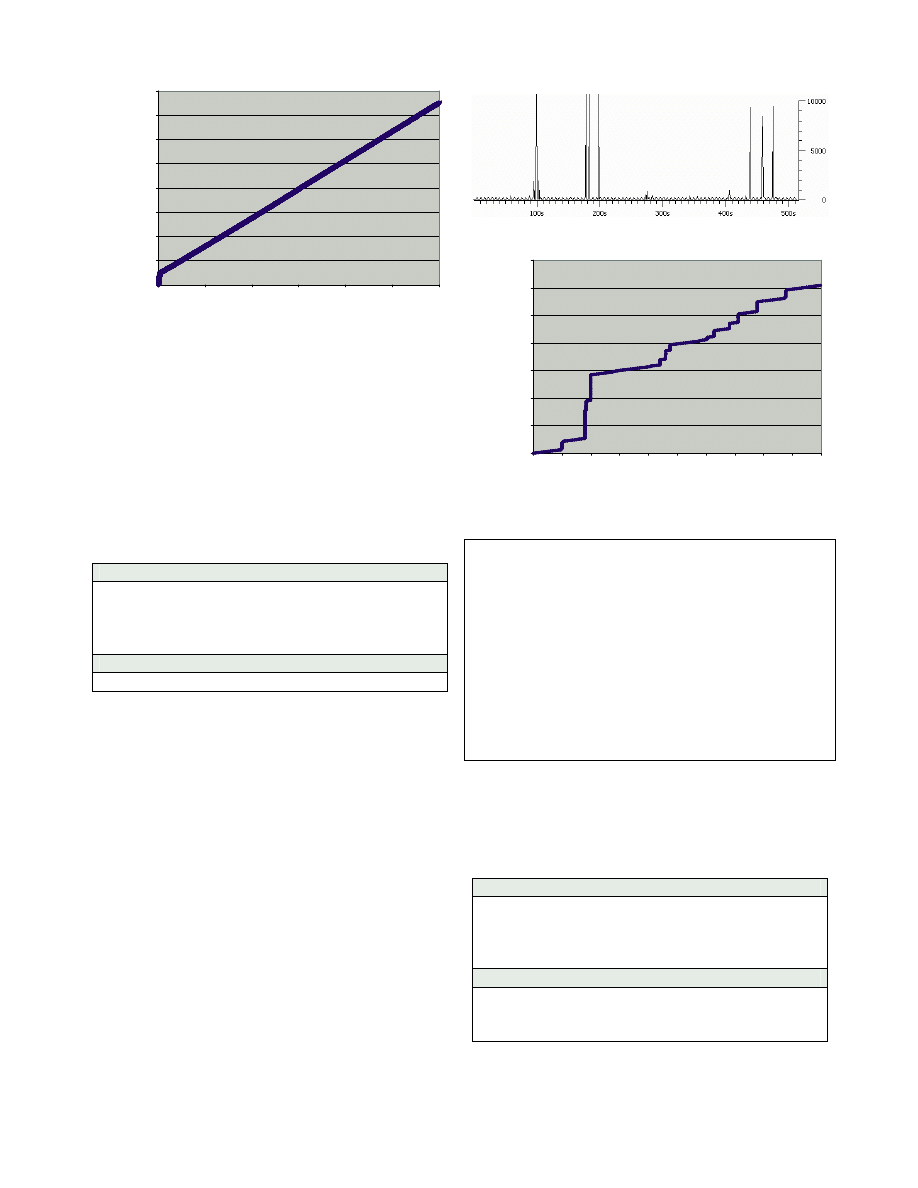
The spikes in the traffic profile show various actions
in the experiment such as sending a command to display a
text message on the victim’s screen or request to browse
files on the victim’s computer. SubSeven’s control
program can instruct the victim to transfer files in and out,
therefore the impact of these types of traffic on the
network can be quite substantial in those cases.
Table 11 shows a summary of the results collected from
the experiment:
Downstream Traffic
99.9 % TCP (HTTP)
0.346 Kbytes/sec
0.91 GB/month
8% BW
Max Charge
$137 / month
Can be substantial if victim instructed to download
files or function as FTP Server
Table 11 SubSeven Analysis
Figure 20 Software to create SubSeven server component
Figure 21 SubSeven Control Program
Figure 22 SubSevenTraffic Profile
0
50,000
100,000
150,000
200,000
250,000
300,000
350,000
0
100
200
300
400
500
600
700
800
900
1000
Time [s]
A
c
u
m
u
la
ti
v
e
T
ra
ff
ic
[
b
y
te
s
]
Figure 23 SubSeven accumulative traffic(bytes) v.s time(s)
CAIA Technical Report 040804A
August 2004
page 9 of
10
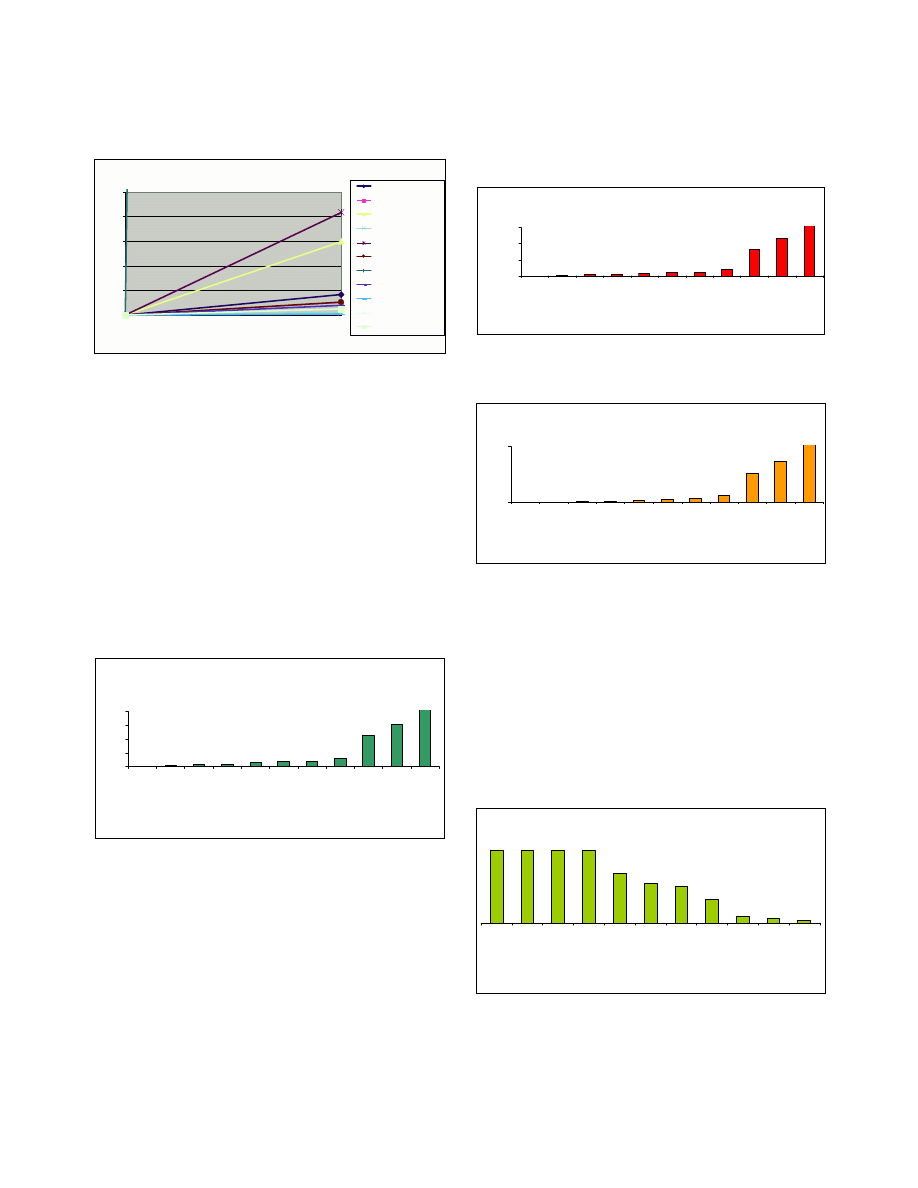
VI.IMPACT COMPARISON
Figure 24 shows a comparison of how various studied
viruses, worms, trojans, and spyware can generate
different amount of traffic load on the network in an hour.
It would be interesting to extrapolate the experimental
results and see the potential impact on a normal Internet
link if one of these malicious programs is active for a
month. Figure 26 shows these results. It is shown that
when myDoom is in its successful DoS attack mode, it
can consume all the upstream and downstream bandwidth
that is available to the user. This resulted in the maximum
amount of traffic load the user can generate (~
130GB/month in our calculation).
The second worst case goes with the mass-mailing
mode when myDoom floods the link with DNS and
SMTP traffic. This can add an extra of 15.47 Gigabytes
into the current traffic load. Thirdly, Lovesan IP address
scans with returned acknowledgement can also bring in to
the network an addition of 11.13 Gigabytes of traffic.
Based on the assumption that an Internet user already
uses 50% of his or her allocated quota on the Telstra 500
MB limited ADSL 256/64 plan and each extra megabyte
of traffic is charged at 15 cents, Figure 28 and Figure 25
show a comparison of the estimated amount of money the
users have to pay. Figure 28 is based on the worst-case
assumption that the infected computer is left online 24
hours a day for an entire month. Figure 25 assumes a
moderate user who only turns their infected computer on
for 8 hours of Internet usage a day.
These graphs have shown that in cases of successful
DoS attack, mass mailing and IP/Port scan, substantial
extra charges can be added to one’s monthly Internet bill.
Although an adware like Gator seems to cost nothing for
the user, nevertheless if many of the same type programs
are installed, the cost can add up very quickly.
Figure 27 shows the number of days the viruses takes
to consume the entire allocated quota of an Internet plan,
based on the assumption that the user is on the Optus 1
GB limited ADSL 512/128 plan. The assumption is the
user is online 24 hours a day. A continuous and successful
DoS attack, mass-mailing or IP/port scanning can use all
allocated quota within one to three days. The impact left
for the users is that after the monthly quota exceeded the
limit, their Internet link speed is capped at 28.8 Kbps until
the end of the month.
Acumulative Traffic generated in one hour
0
4.129
0
14.984
0
0.537
0
20.812
0
2.578
0
1.970
0
1.248
0
5
10
15
20
25
0
Tim e [1 hour]
T
o
ta
l
T
ra
ff
ic
[
M
b
]
Sasser.a
Lovesan.a (Blackhole)
Lovesan.a (RST/ACK)
MyDoom.e (Blackhole)
MyDoom.e (ACK)
MyDoom.e (DoS/Blackhole)
MyDoom.e (DoS/ACK)
NetSky.r
Gator
SpyBot
SubSeven
Figure 24 Impact of viruses on network traffic load (Number of Gb(s)hourly)
Financial Impact of v iruses on Internet users (8 hrs online a day)
(base d on Te lstra ADSL 256/64 500MB Limite d Plan)
$0
$0
$8
$8
$35
$56
$58
$115
$519
$736
$0
$1,000
G
a
to
r
M
y
D
o
o
m
.e
(
M
a
s
s
m
a
ili
n
g
/B
la
c
k
h
o
le
)
S
p
y
B
o
t
S
u
b
S
e
v
e
n
N
e
tS
k
y
.r
L
o
v
e
s
a
n
.a
(B
la
c
k
h
o
le
)
M
y
D
o
o
m
.e
(D
o
S
/B
la
c
k
h
o
le
)
S
a
s
s
e
r.
a
L
o
v
e
s
a
n
.a
(R
S
T
/A
C
K
)
M
y
D
o
o
m
.e
(
M
a
s
s
m
a
ili
n
g
/A
C
K
)
M
y
D
o
o
m
.e
(D
o
S
/A
C
K
)
Figure 25 Impact of viruses on moderate Internet users (online 8 hours/day and
on the Telstra ADSL 256/64 500MB Limited Plan)
Impact of virus on network traffic load
(Number of Gigabytes monthly)
0.15
0.38
0.91
0.91
1.45
1.86
1.90
3.06
11.13
15.47
0.00
5.00
10.00
15.00
20.00
G
a
to
r
M
y
D
o
o
m
.e
(
M
a
s
s
m
a
ili
n
g
/B
la
c
k
h
o
le
)
S
p
y
B
o
t
S
u
b
S
e
v
e
n
N
e
tS
k
y
.r
L
o
v
e
s
a
n
.a
(B
la
c
k
h
o
le
)
M
y
D
o
o
m
.e
(D
o
S
/B
la
c
k
h
o
le
)
S
a
s
s
e
r.
a
L
o
v
e
s
a
n
.a
(R
S
T
/A
C
K
)
M
y
D
o
o
m
.e
(
M
a
s
s
m
a
ili
n
g
/A
C
K
)
M
y
D
o
o
m
.e
(D
o
S
/A
C
K
)
Figure 26 Impact of viruses on network traffic load (Number of Gb(s) monthly)
How many days to use up my monthly quota?
(based on Optus ADSL 512/128 1GB Limited Plan)
31
31
31
31
21
17
16
10
3
2
1
G
a
to
r
M
y
D
o
o
m
.e
(
M
a
s
s
m
a
ili
n
g
/B
la
c
k
h
o
le
)
S
p
y
B
o
t
S
u
b
S
e
v
e
n
N
e
tS
k
y
.r
L
o
v
e
s
a
n
.a
(B
la
c
k
h
o
le
)
M
y
D
o
o
m
.e
(D
o
S
/B
la
c
k
h
o
le
)
S
a
s
s
e
r.
a
L
o
v
e
s
a
n
.a
(R
S
T
/A
C
K
)
M
y
D
o
o
m
.e
(
M
a
s
s
m
a
ili
n
g
/A
C
K
)
M
y
D
o
o
m
.e
(D
o
S
/A
C
K
)
Figure 27 How many days to use up my monthly quota? (based on Optus
ADSL512/128 1GB Limited Plan)
Financial Impact of viruses on Internet users (24 hrs online a day)
(based on Telstra ADSL 256/64 500MB Limited Plan)
$0.00
$19.50
$98.50
$99.50
$179.50 $241.50 $247.50
$420.50
$1,632.50
$2,282.50
$0.00
$1,000.00
$2,000.00
$3,000.00
G
a
to
r
M
y
D
o
o
m
.e
(
M
a
s
s
m
a
ili
n
g
/B
la
c
k
h
o
le
)
S
p
y
B
o
t
S
u
b
S
e
v
e
n
N
e
tS
k
y
.r
L
o
v
e
s
a
n
.a
(B
la
c
k
h
o
le
)
M
y
D
o
o
m
.e
(D
o
S
/B
la
c
k
h
o
le
)
S
a
s
s
e
r.
a
L
o
v
e
s
a
n
.a
(R
S
T
/A
C
K
)
M
y
D
o
o
m
.e
(
M
a
s
s
m
a
ili
n
g
/A
C
K
)
M
y
D
o
o
m
.e
(D
o
S
/A
C
K
)
Figure 28 Impact of viruses on heavy Internet users (online 24 hours/day and
on the Telstra ADSL 256/64 500MB Limited Plan)

CAIA Technical Report 040804A
August 2004
page 10 of
10
VII.C
ONCLUSION
In this technical report, we have proposed a structured
process along with tools and techniques used to determine
the characteristics and amount of network traffic load that
viruses, worms, trojans and spyware can generate. The
experiments on some of the most common “malicious
programs” have shown a lot of clarity about their network
behaviours as well as their traffic patterns. Our
experimental trials were short-lived, and we intend to
pursue more long-lived data gathering trials in the future
to further refine our traffic load estimates.
Modern viruses and worms are becoming more
complex and exhibit different network behaviours
depending on the modes of attack. MyDoom in its DoS
attack mode floods the network with continuous HTTP
traffic while in mass mailing mode, it creates a mixture of
DNS and SMPTP traffic with bursts in a regular interval.
The financial impact for Internet users can be
quantified by calculating the accumulative traffic load
generated by viruses in a period of time. The analyis and
comparison show that the financial impact depends not
only on the virus itself but also on its modes of attack at
particular points in time (e.g: between 17th and 22nd of a
month for MyDoom DoS attack to be activated). The
bottom line is that if users are charged by their ISP on the
amount of traffic a virus generates, there can be a
bill-shock for him or her at the end of the month. We also
note that trojans and spyware such as Spybot or SubSeven
can create additional damages if they open up backdoors
for unauthorised access to the victim’s computers.
There is a saying that “if you know the enemy and
know yourself, you need not fear the result of a hundred
battles”[18]. There is a continuous battle between the
computer users and computer viruses. Without detailed
knowledge of viruses, we will not be able to respond to
new attacks when they happen. Studying previous viruses
is one of the important steps to improve our ability to deal
with the virus problems of the near future. The idea of our
research was to address the needs to understand threats
and consequences imposed on the network by virus
attacks. Our hope is to use this as a stepping-stone for our
future research.
A
CKNOWLEDGMENTS
I would like to thank Associate Professor Grenville
Armitage who designed this project and defined the
overall research direction. I am also appreciative of the
technical assistance from Warren Harrop and Lawrence
Stewart.
R
EFERENCES
(all web references are as of the date of publication of this technical report)
[1]"Cost Impact of Major Virus Attacks Since 1995”
http://www.computereconomics.com/images/default/cmr/IT%20Bytes%20Ap
ril%202004.pdf
[2]”Mydoom virus biggest in months”
http://news.bbc.co.uk/1/hi/technology/3432639.stm
[3]"MyDoom is most expensive virus yet”
http://www.vnunet.com/news/1152514
[4]"MyDoom.0 Hammers Search Sites”
http://www.pcworld.com/news/article/0,aid,117066,pg,1,RSS,RSS,00.asp
[5]"Email Virus Propagation Modeling and Analysis”
http://tennis.ecs.umass.edu/~czou/research/emailvirus-techreport.pdf
[6]”Evaluation of a Pentium PC for use as an Ethernet Bridge”
http://caia.swin.edu.au/reports/030326A/CAIA-TR-030326A.pdf
[7]”Developing an Effective Incident Cost Analysis Mechanism”
http://www.securityfocus.com/infocus/1592
[8]”Packet Plotter”
http:// home.intergga.ch/kummerj/packetplotter/
[9]”Consumers and ISPs go head-to-head on bill-shock”
http://www.zdnet.com.au/news/communications/print.htm?TYPE=story&AT
=39148078-2000061791t-10000003c
[10]”Reverse Engineering Malware”
http://www.zeltser.com/sans/gcih-practical/revmalw.html
[11]”70% of viruses written by one man”
http://itvibe.com/default.aspx?NewsID=2769
[12]”Virus writing on the increases”
http://www.sophos.com/pressoffice/pressrel/uk/20040728topten.html
[13]”Gator eWallet”
http://www.scumware.com/apps/scumware.php/action::view_article/article_id
::1068605442/topic::Scumware,-Spyware,-Adware-&-Malware-Applications/
[14]”SubSeven Official Site”
http://www.subseven.ws/
[15]”Backdoor.SubSeven”
http://www.symantec.com/avcenter/venc/data/backdoor.subseven.html
[16]”FreeBSD Ports”
http://www.freebsd.org/ports
[17]"Email Virus Propagation Modeling and Analysis”
http://tennis.ecs.umass.edu/~czou/research/emailvirus-techreport.pdf
[18]"Art of War”
http://www.marxists.org/reference/archive/sun-tzu/works/art-of-war/ch03.htm
Wyszukiwarka
Podobne podstrony:
Eleswarapu And Venkataraman The Impact Of Legal And Political Institutions On Equity Trading Costs A
THE IMPACT OF SOCIAL NETWORK SITES ON INTERCULTURAL COMMUNICATION
Marina Post The impact of Jose Ortega y Gassets on European integration
The Impact of Mary Stewart s Execution on Anglo Scottish Relations
Latour The Impact of Science Studies on Political Philosophy
L R Kominz The Impact of Tourism on Japanese Kyogen (Asian Ethnology Vol 47 2, 1988)
social networks and planned organizational change the impact of strong network ties on effective cha
The Impact of Countermeasure Spreading on the Prevalence of Computer Viruses
Begault Direct comparison of the impact of head tracking, reverberation, and individualized head re
The Impact of Countermeasure Propagation on the Prevalence of Computer Viruses
Interfirm collaboration network the impact of small network world connectivity on firm innnovation
The impact of network structure on knowledge transfer an aplication of
The Impact of Migration on the Health of Voluntary Migrants in Western Societ
Karpińska Krakowiak, Małgorzata The Impact of Consumer Knowledge on Brand Image Transfer in Cultura
Gallup Balkan Monitor The Impact Of Migration
Fraassen; The Representation of Nature in Physics A Reflection On Adolf Grünbaum's Early Writings
A systematic review and meta analysis of the effect of an ankle foot orthosis on gait biomechanics a
The influence of British imperialism and racism on relationships to Indians
więcej podobnych podstron