
Managing the total Cost of ownership
of Business intelligenCe
A 360-Degree PersPective
SAP White Paper
Business intelligence


Content
5 What Is My Business Intelligence
5 Business Need Drives it spend
8 Data Explosion and Strategic
9 capitalizing on the Data explosion
11 Understanding the Cost Drivers of
About the Author
Dr. Wayne Applebaum is a principal business consultant with over 25 years of
experience in business intelligence and business analytics strategy. He develops
analytic frameworks that allow clients to take action by merging the key elements
of business analytics, data design, and technology into a cohesive whole.
Dr. Applebaum takes a systemic view of enterprise information management and
works closely with each client to ensure a complete solution, combining the
talents of both the client and sAP to create a unique perspective.
He holds a doctorate in research methodology from the University of Pittsburgh.

4
SAP White Paper – Managing the total cost of Ownership of Business intelligence
A major question that companies are
asking business intelligence (Bi) pro-
viders is, “What is your total cost of
ownership?”
For many companies, total cost of
ownership (tcO) is out of control.
And the problem is growing, fueled by
ever-increasing demands from the user
community, massive new sources for
data, new capabilities, shadow it land-
scapes, and the cost of keeping people
abreast of all the changes.
User expectations are growing. Bi users
expect all information to be available all
the time and in a format that can be
easily understood and easily accessed.
in addition, the data must be of high
quality, transparent, and relevant to
their jobs.
these demands are not that unreason-
able considering the culture we live in
today, with information coming at us
from the time we wake in the morning
to until the end of the day.
How does an organization position itself
to deliver a cost-effective Bi solution
that can meet its user community’s
thirst for information and offer the
lowest tcO? How does it manage the
tcO of Bi? For it professionals, this is
a problem that keeps us awake at night.
the purpose of this paper is to focus
on developing a framework for monitor-
ing and managing the tcO of Bi.
exeCutive suMMary
iF YOU DON’t Meet YOUr NeeDs,
cOst DOesN’t MAtter
For many companies, total cost of ownership is out
of control. And the problem is growing, fueled by
ever-increasing demands from the user community,
massive new sources for data, new capabilities,
shadow it landscapes, and the cost of keeping
people abreast of all the changes.

5
SAP White Paper – Managing the total cost of Ownership of Business intelligence
as archiving data, that can increase
system performance signif i cantly while
saving hundreds of gigabytes of storage
at the data ware house level, to say
nothing of the back ups, change logs,
and duplicate copies.
Another example is the use of the right
tool for the right job. Most business
intelligence enterprises put the burden
of developing analytics on the it depart-
ment or power users within the busi-
ness units. A tool that uses in-memory
analytics and an intuitive interface
lets users explore and analyze large
data sets and save the view for future
refer ence. this could eliminate the
need for hundreds of reports to be
generated.
A number of metrics have been pro-
posed for determining total cost of
owner s hip of business intelligence, such
as cost per user and cost per report.
While calculating the tcO of Bi – or for
that matter any it solution – may be
interesting, the real issue is more about
the management of tcO. to manage
Bi tcO, just like managing any organi-
za tional expenditure, we have to look
at business need.
Business Need Drives IT Spend
the tcO of Bi is tightly coupled to
business need. it is business need that
drives it spend in this area. in general,
the maturity of a company’s Bi capa-
bilities has a large impact on tcO.
Business intelligence tools are scalable
with respect to capacity, so the cost as
load or users increase is fairly propor-
tional. Once a Bi effort reaches critical
mass in a company, the increase in
cost per headcount, per query, or per
report remains relatively constant.
therefore, a key driver for managing
the total cost of business intelligence is
a company’s ability to effectively incor-
porate business need into a flexible yet
sustainable solution. this is not to say
we are advocating limiting business
need to control costs, but we advocate
that the cost of business intelligence,
like any other part of business opera-
tions, be controlled by assessing and
understanding the business need and
letting that drive the priority of spend.
Business need changes and shifts over
time and so does the need for Bi within
an enterprise. New needs arise, while
others disappear as does the need
for certain types of data. One of the
quickest ways to decrease the cost of
Bi within an enterprise is to thoroughly
examine each area and determine what
portions of it are no longer required to
support business needs. these could
include obsolete reports, tools, and data.
in some cases, there may even be the
opportunity to simplify solution sets,
standardize the data model, and rethink
the user community delivery model.
For example, if a data warehouse is five
years old, and if we assume that most
reports are run only over this year’s
and last year’s data, then only 40% of
the data in the data warehouse may
actually be required within the produc-
tion system. some of the data, like that
used in reports on shipped items or
closed sales orders, might have a shorter
useful life. By examining the useful life
of the data, we can take actions, such
what is My Business intelligenCe total
Cost of ownership?
ANsWeriNg tHe rigHt QUestiON
A key driver for managing
the total cost of business
intelligence is a company’s
ability to effectively incor-
porate business needs into
a flexible yet sustainable
solution.

6
SAP White Paper – Managing the total cost of Ownership of Business intelligence
in an ideal world, we would have a
struc ture for enterprise business intelli-
gence that is similar to the structure in
Figure 1.
enterprise business intelligence is
framed by business processes and
business decisions, which dictate the
requirements for information technol-
ogy. information flows from transaction
systems and other data sources to the
target data store under the guidance of
extraction, transformation, and loading
(etL) activities; governance; and docu-
mented data processes. the focus is
on providing quality data and a single
version of the truth. this data store
feeds carefully constructed measure-
ment frameworks and analytics, which
are then combined to provide accurate,
business-relevant information that
helps support business decisions.
how should enterprise Business
intelligenCe run?
MANAgiNg tcO FOr Bi reQUires
A sYsteMic vieW
Figure 1: The Structure of Enterprise Business Intelligence
Business decisions
Measurement
Analytics
Data
target data store
transactional systems and other data sources
extraction, transformation,
loading
governance
Processes
Business processes
A spreadsheet culture has
evolved over time to bridge
the gap between the busi-
ness need and what Bi
pro vides. the result is an
increase in the actual tcO
of Bi that is rarely measured.
7
SAP White Paper – Managing the total cost of Ownership of Business intelligence
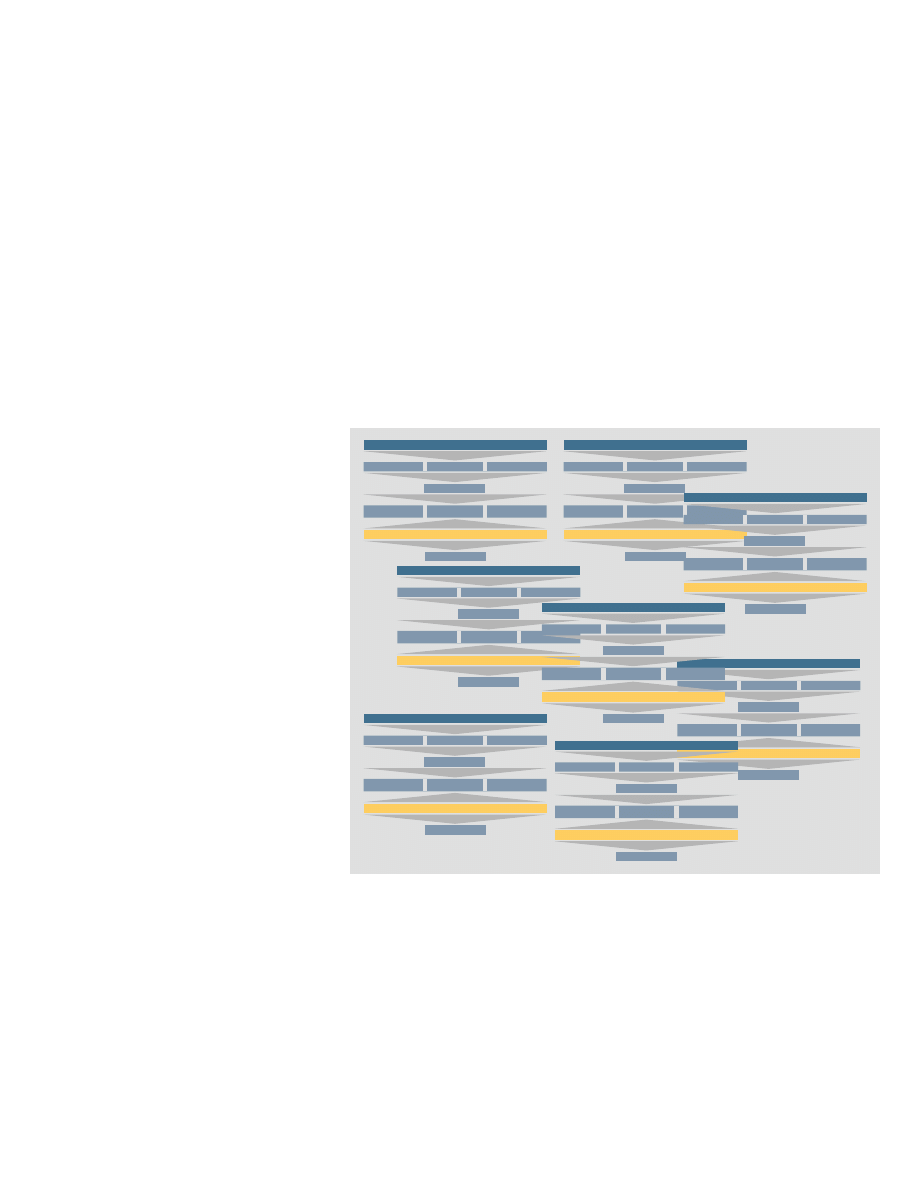
Unfortunately, Bi has historically started
as a departmental effort. in this case,
there was an over-emphasis on achiev-
ing quick wins but little emphasis on
how to organize the efforts to form a
single structure. this has resulted in
enterprise Bi structures more similar
to Figure 2.
When viewed from the enterprise level,
the business intelligence structure
appears as a series of disjointed over-
lapping silos. Often different software
tools support this type of Bi structure.
this is neither a simple nor a sustain-
able landscape. this type of structure
leads to multiple versions of the truth,
requiring reconciliation of reports and
duplicate data sets. the cost of main-
taining this kind of structure is higher
than necessary. to make matters worse,
as more business needs arise and
are met, complexity and duplication
con tinue to grow.
even if we normalize this landscape,
a deeper problem may not be solved
as easily. Bi often is used to provide
information that feeds a spreadsheet.
spreadsheet-driven processes have a
high cost, inhibit information sharing,
are subject to higher error rates, and
often require a substantial amount of
staff time to maintain. A spreadsheet
culture has evolved over time to bridge
the gap between the business need
and what Bi provides. the result is an
increase in the actual tcO of Bi that is
rarely measured.
Figure 2: Typical Business Intelligence Structure
Business decision
Measurement
Analytics
Data
target data store
Transactional systems and other data sources
extraction,
transformation, loading
governance
Processes
Business processes
Business decision
Measurement
Analytics
Data
target data store
Transactional systems and other data sources
extraction,
transformation, loading
governance
Processes
Business processes
Business decision
Measurement
Analytics
Data
target data store
Transactional systems and other data sources
extraction,
transformation, loading
governance
Processes
Business processes
Business decision
Measurement
Analytics
Data
target data store
Transactional systems and other data sources
extraction,
transformation, loading
governance
Processes
Business processes
Business decision
Measurement
Analytics
Data
target data store
Transactional systems and other data sources
extraction,
transformation, loading
governance
Processes
Business processes
Business decision
Measurement
Analytics
Data
target data store
Transactional systems and other data sources
extraction,
transformation, loading
governance
Processes
Business processes
Business decision
Measurement
Analytics
Data
target data store
Transactional systems and other data sources
extraction,
transformation, loading
governance
Processes
Business processes
Business decision
Measurement
Analytics
Data
target data store
Transactional systems and other data sources
extraction,
transformation, loading
governance
Processes
Business processes
8
SAP White Paper – Managing the total cost of Ownership of Business intelligence
data explosion and strategiC
inforMation ManageMent
tAkiNg ADvANtAge OF DAtA tO BecOMe AN
ANALYtic cOMPetitOr
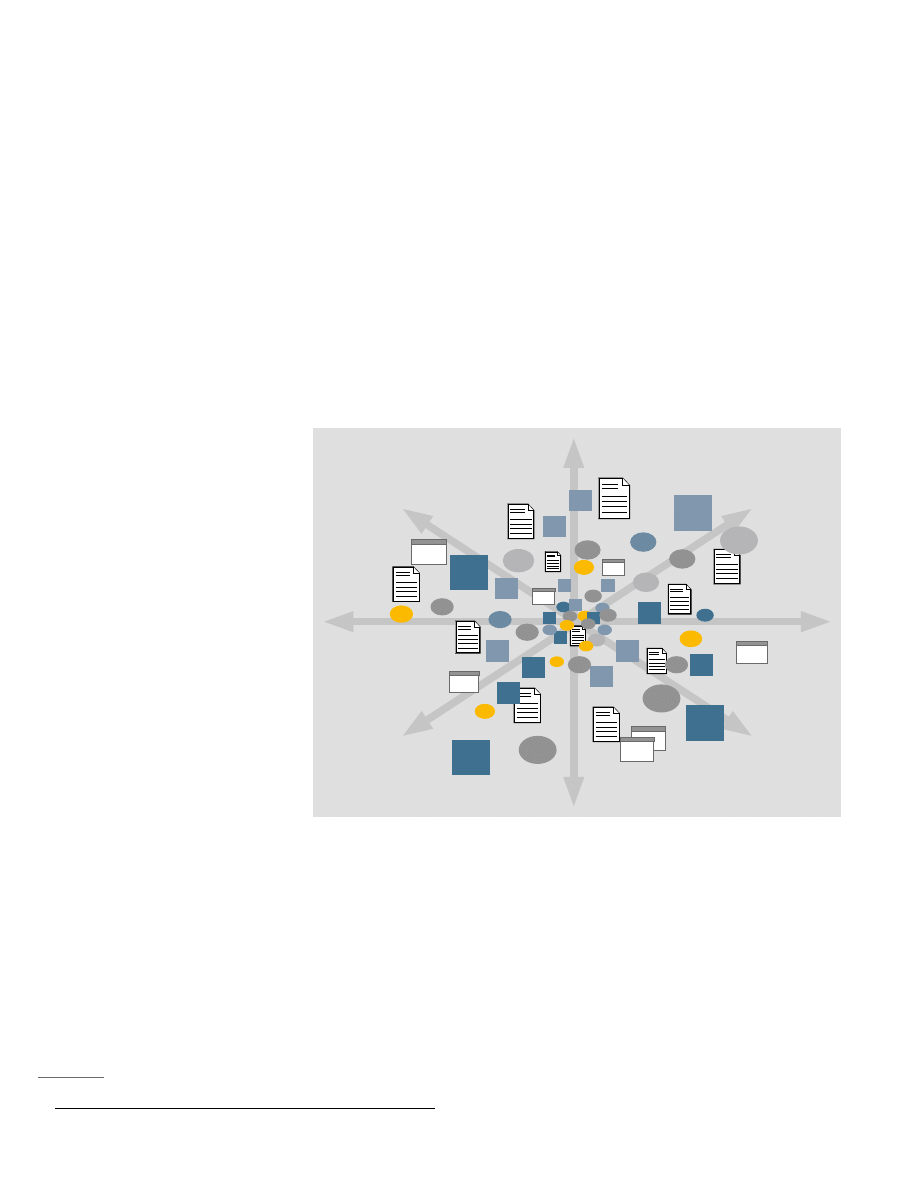
creating additional urgency to managing
tcO is the increased burden created
by the data explosion depicted in
Figure 3.
the digital universe (defined as all con-
tent stored in digital form) will expand
by a factor of 44 between 2009 and
2020.
1
this growth creates both an
opportun ity and a challenge. the oppor-
tunity is to glean value out of this data
and improve business processes. the
chal lenge is that this explosion taxes
current business intelligence practices
by creat ing more demand for already
scarce resources. With this greater
demand comes increased cost. the
alternative, not leveraging this newly
available data, leaves an organization at
risk of losing a competitive advantage.
Not long ago, data was scarce. Data
was coveted because it was difficult to
obtain and difficult to capture in digital
form, and tools for analysis were in the
hands of a few experts. While the cir-
cumstances have changed drastically,
the sociology of data has not. We still
hoard data, and we still rely on experts,
whether it or power users, to convert
data to information. this creates it cost
as well as multilayered and siloed struc-
tures, increasing the cost of Bi and
preventing organizations from realizing
their true potential.
1. iDc white paper sponsored by eMc,
the Digital Universe Decade – Are You ready?, May 2010. the most recent version of the study can be found at
www.emc.com/collateral/demos/microsites/idc-digital-universe/iview.htm
.
the digital universe (defined
as all content stored in digital
form) will expand by a factor
of 44 between 2009 and
2020.
Figure 3: The Data Explosion

9
SAP White Paper – Managing the total cost of Ownership of Business intelligence
Capitalizing on the Data Explosion
with Top-Down Development
Understanding business needs is critical
to the entire process. But how should
business needs be constructed and
normalized? Many Bi efforts start with
and perpetuate a bottom-up approach.
A bottom-up approach has the adverse
effect of creating disjointed, overlapp ing
siloed structures and multiple data
sets. it fails to capitalize on the cross-
functional use of data. this results in
duplicated efforts to collect, store, and
analyze data while increasing tcO.
implementing a top-down approach
may be easier for an organization just
embarking on its Bi processes than for
an organization that has a substantial
embedded base. For example, consider
a company that has over 20 installations
of different Bi tools. there are multiple
definitions of items such as revenue
and income. there are also multiple
data stores that support thousands of
reports. in short, without appropriate
coordination the company’s Bi efforts
evolved into a very expensive and
inefficient system.
One of the success factors critical to
managing Bi tcO is establishing a Bi
center of excellence (coe) to provide
a top-down focus. this requires com-
mitted senior executive sponsorship,
especi ally in a mature Bi organization.
in an organization with multiple data defi-
nitions, data stores, and tools, senior
leadership is necessary to resolve differ-
ences and prevent a stalemate between
different constituencies.
One of the first activities of a coe is
conducting an inventory of what exists
in the Bi landscape for the entire com-
pany. Focusing on and understanding
the cost drivers, described in a follow-
ing section, provides a solid framework
for conducting such an inventory.
Another activity is understanding and
aligning the inventoried items to the busi-
ness. How does the entire Bi infra struc-
ture compare to best-practice principles?
While this is a time-consuming process,
it is necessary if the organization is going
to normalize practices and streamline
costs. For cross-functional areas, large
savings can be made by leveraging
information and analysis, eliminating
the need for the duplication of data
stores, metadata, and analytics.
simplifying the tools in the
it landscape is a power-
ful cost driver, not only in
license and maintenance
costs but in training, usabil-
ity, and staff ing. it avoids
the expense of training
people on different analysis
tools when they change
organizations.

10 SAP White Paper – Managing the total cost of Ownership of Business intelligence
busi ness value. Part of being respon-
sive to business needs may be accom-
plished quickly by providing the appro-
priate analytical tools to the right people.
this can trigger a process of discovery
that is highly relevant to bridging the gap
between it and the rest of the business.
Dashboards have gained great popular-
ity over the last few years. they are a
powerful tool that allows an individual
to easily explore a limited information
domain. Dashboards are particularly
use ful when you have a good handle on
the guided analysis that the user requires.
guided analysis relies on anticipating
users’ questions and providing them with
an easy way of accessing the infor ma-
tion, whether through the use of drill-
down techniques, dynamic links, or
parameterized reports.
creating a dashboard assumes you have
enough knowledge of the analytical
process to anticipate the next question.
sometimes the questions are not easily
anticipated, or the number of possible
views is extremely large. in these cases,
different tools, such as in-memory
analytics, might provide the user with
the ability to explore data more freely
and easily.
Additionally, you need to be careful not
to confuse understanding of tools with
understanding of data. Both are neces-
sary. it can take users longer to under-
stand the definitions of data they are
analyzing than to learn about the tools
that they use to analyze it. training
people on both the data and analytics
tools is necessary. it’s not just about
the availability of data; it’s about under-
standing business relevancy as well.
gaining a competitive advantage in
today’s accelerated data explosion is a
huge opportunity. companies must effi-
ciently manage the influx of data while
also controlling costs. this requires
taking a holistic view of bringing data
and an analytic architecture together
with business needs and training. in this
way you can manage and reduce the
tcO of Bi while still fulfilling increas ingly
complex business needs. there is even
a possibility of being able to reduce
tcO while expanding functionality.
Controlling the Cost of Business
intelligenCe
OPtiMizeD DAtA MODeL AND APPrOPriAte
ANALYticAL tOOLs
One of the keys to controlling the cost
of Bi involves examining the data archi-
tecture to determine what is necessary
and what is not. tracing how many times
a piece of information is duplicated and
stored is a powerful method to under-
stand the complexity of the data model
and provides the opportunity to opti-
mize the model without destroying the
ability to provide effective information
to users.
Another area of focus is understanding
data’s intrinsic value in answering busi-
ness questions. Not all data has the
same value, and a thoughtful business
understanding allows organizations to
effectively prioritize their burgeoning
list of requests for information.
Providing Appropriate Analytical
Tools
A typical complaint about using data
analysis to solve business problems is
that by the time the data is collected,
cleaned, and analyzed, the deadline for
making the decision has passed. this
issue can be overcome by creating an
analytical architecture that is respon sive
to business needs and is driven by
11
SAP White Paper – Managing the total cost of Ownership of Business intelligence
understanding the Cost drivers of
Business intelligenCe
A cOMPLete vieW OF tHe Bi cOst strUctUre
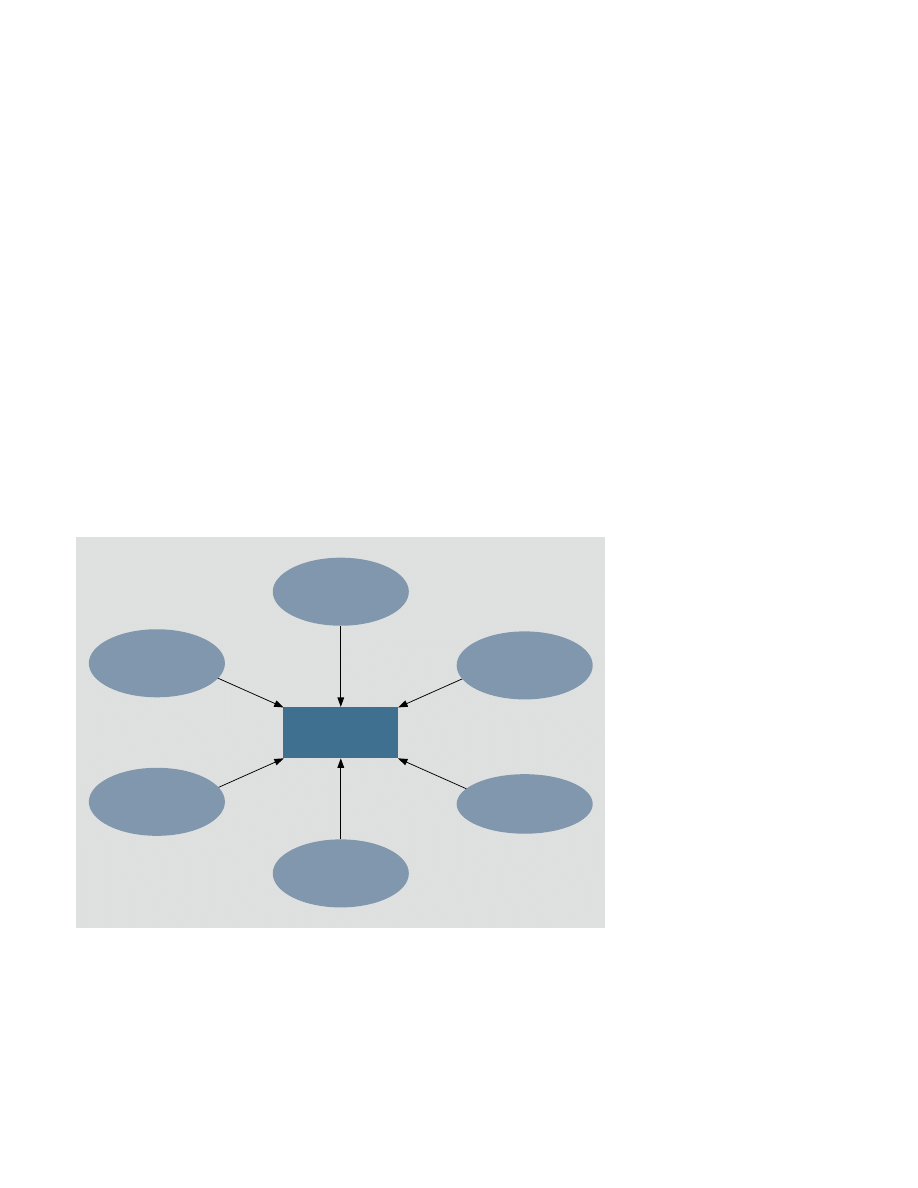
Figure 4 provides an overview of the
cost drivers for business intelligence.
each of the cost drivers in Figure 4
provides a different view of the Bi cost
structure. While each of these views
has a different focus, it is important to
keep in mind that they are interdepen-
dent and must be balanced. Policies
and efforts in one area affect how
things work in another. Business needs
permeate all of the areas.
Business Needs
A key function of a Bi center of excel-
lence is the alignment of projects to
business needs. there are a number of
ways to structure a Bi coe to coordi-
nate and prioritize business needs.
At one extreme, the coe acts as the
coordinator of all Bi projects. this type
of organization has a mandate that
nothing happens without the coe’s seal
of approval. At the other extreme is a
coe that seeks only to foster aware-
ness. this type of coe acts more like
an information exchange rather than
like a governing body. it provides trans-
parency into and accessibility of the Bi
activities of different groups so that
efforts can be leveraged throughout
the company. Different combinations of
these structures should be examined
against the backdrop of your own orga-
nizational and change management
culture to effectively control the
business-need element of the cost
framework.
Analytics Tools
Managing the strategy for using analyt-
ics tools is also critical to controlling
cost. As a rule, an organization should
strive to maintain the minimum number
of tools that will satisfy business needs.
simplifying the tools in the it landscape
is a powerful cost driver, not only in
license and maintenance costs but in
training, usability, and staffing. it avoids
having to train people on different analy -
sis tools when they change organiza-
tions. it also provides for a large core
of people who understand the tools
and are available to mentor newcomers.
the key is to understand and match
tools and techniques with business
needs. What are the consequences of
eliminating or adding a tool? Does the
current tool set allow for the flexibility
and hands-on analysis demanded by
today’s users?
Figure 4: The Cost Drivers of Business Intelligence
total cost of
ownership
Analytic tools
Data
Processes, data quality,
and quality tools
People
Developers and
consumers
Hardware
storage and
processing
Business needs
Governance
Data process
portfolio

12 SAP White Paper – Managing the total cost of Ownership of Business intelligence
People
People costs fall into two categories:
developers of Bi reports and analytics
and consumers of information. in some
cases, developers and users are the
same people, but in many cases they
are not.
According to a survey conducted by
sAP and the Americas’ sAP Users’
group of more than 230 companies,
users of Bi and reports outnumber
developers of reports by 5 to 1 (per
1000 employees in a company):
2
•
Percentage of people that create Bi
reports: 6%
•
Percentage of people that consume
the information in Bi reports: 29%
this finding raises the following ques-
tions. is this ratio too high or is it not
high enough? What should be the cor-
rect target for the ratio of creators to
consumers of Bi reports and analytics?
the answer to these questions depends
upon the nature of the analytics that
are being performed, the extent of user
self-services that are involved, and how
effective the work products are in deliv-
ering analytics. One way to measure
effectiveness is how well the work
products match users’ needs in terms
of providing users with the necessary
information to take action.
if the work product is complete, a user
should be able to obtain the information
without any additional processing of
the data. However, in many cases, it is
necessary to employ an additional tool
such as Microsoft excel. this leads to
questions about the effectiveness of
the work product itself, since the end
user must perform additional steps or
use a second product. the calculation
of Bi tcO should take into account this
additional work time.
Hardware
the cost of hardware includes storage,
processing, and networking. While
hardware cost has decreased per unit,
the amount of hardware required keeps
increasing. Many companies find them-
selves buying additional hardware on a
quarterly or semiannual basis to keep
up with data growth. While some of this
added hardware is leveraged to the
organization’s bottom line, there is no
doubt some waste. storing unneeded
data in production systems, running
and maintaining analytics that are not
used, and maintaining underutilized
data sources add to the cost.
As the investment in hardware grows,
the cost to execute on Bi projects also
grows because of additional hardware
and an increasingly complex environ-
ment. By taking a more thoughtful
approach to data rationalization and
near-line storage options, you can free
up system resources to increase per-
for mance and give more focus to data
and information quality.
Data
For the purpose of this paper, we define
the cost of data as the cost of the pro-
cesses it takes to manage data and
make it available in a usable form. this
includes the cost of the tools, pro cess es,
and people that go into creating a data
warehouse and into developing and
maintaining tools for etL and data quality.
Governance
governance completes the circle.
these are the rules of operation for
enterprise business intelligence. they
are very much a part of the Bi center
of excellence and align with an orga ni-
zation’s business needs.
2. the Bi survey was launched in January 2007 and continues to be actively administered through the AsUg and sAP benchmarking program Web sites.
respondents to this survey are from many different industries and geographies and range from small businesses to large enterprises.

13
SAP White Paper – Managing the total cost of Ownership of Business intelligence
in 2005 a study conducted by sAP in
collaboration with AsUg studied best
practices for managing tcO.
3
it included
30 companies with incomes ranging
from Us$100 million to more than
$100 billion and the number of employ-
ees ranging from 400 to 150,000. the
companies represented a variety of
industries. While this study looked at
tcO in general, its conclusions appear
to apply to tcO for Bi. Although the
study was conducted almost five years
ago, these findings are still extremely
relevant today.
the study cites four primary best prac-
tices that industry leaders in tcO have
in common:
•
to achieve the optimal balance
between it cost and business benefit,
focus on the business impact of every
it solution and ensure that c-level
decision makers understand the
issues that arise throughout the
entire lifecycle.
•
to manage critical processes and
limit dependency on external resources
after an it initiative, make it a priority
to leverage, build, and retain in-house
talent.
•
to minimize tcO, develop centers
of excellence (shared services
operations).
•
simplify the business intelligence
land scape and standardize on
common tools.
the study states that business align ment
is critical to success. it becomes even
more important when companies have
either geographically or legally disparate
entities. in these cases a strong central-
ized governance structure is a critical
factor to manage tcO.
the balance between it cost and busi-
ness benefit means continually involving
the business in determining the port-
folio of projects. this allows it to better
allocate scarce resources. care must be
taken on setting standards for the defi-
nition of business value to prevent inter-
departmental arguments over resources.
the study points out the importance of
maintaining an internal core of people
and limiting the dependency on external
resources after the initial initiative. the
key here is to avoid expensive external
resources to do continuing jobs beyond
the initial bubble. it also points out the
importance of maintaining and retaining
a group of well-trained individuals.
We have already spoken about the
importance of establishing a center of
excellence. the study concludes that
companies with a center of excellence
had a 47% lower tcO per active employ-
ee than companies that lacked one.
Lastly, simplifying the landscape creates
benefits at all levels in the organization.
these are summarized in the table
below, which shows that benefits of
landscape simplification are present in
many areas across the c-level.
Best praCtiCes for Managing tCo
LeArNiNg FrOM iNDUstrY LeADers
3. Hercules Bothma,
Best Practices in Managing the total cost of Ownership, AsUg and sAP, June 2005.
Principal
Benefit
Process
Standardization
Increased
Efficiency
Faster
Growth
Risk
Reduction
IT Portfolio
Simplification
key Driver
evP or ceO
cFO
ceO
cFO
ciO
Benefits
•
global design,
local flexibility
•
Acquired back-
office operations
•
replication of
business practices
•
Optimal cost
structure
•
collaboration
•
speed of acquisition
•
global and timely
visibility
•
Acceleration of
change initiatives
•
Ability to take
advantage of
opportunities
•
No disruption of
production and
delivery
•
compliance with
sarbanes-Oxley Act
•
international
compliance
•
simpler it
architecture
•
More responsive it
•
More funds for
innovation
•
reduction of it
cost base

14 SAP White Paper – Managing the total cost of Ownership of Business intelligence
suMMary
rOAD MAP FOr cONtiNUAL tcO iMPrOveMeNt
the key to managing tcO is inter-
depen dently managing its six drivers:
•
Business needs
•
Analytics
•
People
•
Hardware
•
tools
•
governance
For companies that have a mature
embedded base of business intelli-
gence, managing tcO requires a care-
ful examination of how they stand in
relation to managing these six factors.
the gaps between the current state
and best practices can be assessed.
A road map of continual tcO improve-
ment can be put in place to migrate the
organization to an efficient and effec-
tive environment.
For More Information
to learn more about the software and
tools that can help you manage tcO
for Bi while enhancing the availability
and quality of enterprise Bi for better-
informed decision making, please
contact your sAP services represen-
tative today or go to
.
to achieve the optimal
bal ance between it
cost and business
benefit, focus on the
business impact of
every it solution and
ensure that c-level
decision makers
understand the issues
that arise throughout
the entire lifecycle.

www.sap.com/contactsap
50 101 513 (10/08) Printed in UsA.
©2010 sAP Ag. All rights reserved.
sAP, r/3, sAP NetWeaver, Duet, Partneredge, ByDesign,
sAP BusinessObjects explorer, and other sAP products and services
mentioned herein as well as their respective logos are trademarks or
registered trademarks of sAP Ag in germany and other countries.
Business Objects and the Business Objects logo, BusinessObjects,
crystal reports, crystal Decisions, Web intelligence, Xcelsius, and
other Business Objects products and services mentioned herein
as well as their respective logos are trademarks or registered trade -
marks of Business Objects software Ltd. in the United states and
in other countries.
All other product and service names mentioned are the trademarks
of their respective companies. Data contained in this document serves
informational purposes only. National product specifications may vary.
these materials are subject to change without notice. these materials
are provided by sAP Ag and its affiliated companies (“sAP group”)
for informational purposes only, without representation or warranty of
any kind, and sAP group shall not be liable for errors or omissions with
respect to the materials. the only warranties for sAP group products and
services are those that are set forth in the express warranty statements
accompanying such products and services, if any. Nothing herein should
be construed as constituting an additional warranty.
Wyszukiwarka
Podobne podstrony:
the opportunity cost of social relations on the effectiveness of small worlds
The Real Cost of a Virus Outbreak
Competition The Cutting Edge of Business
Signs of Success The Remarkable Power of Business Astrology by Steven Mark Weiss (2008)
The Wharton School Of Business Innovation In Retail Banking
The Wharton School Of Business Efficiency, Profitability And Quality Of Banking Services
DV8 Physical Theatre the cost of living, STUDIA Pedagogika resocjalizacyjna
Total eclipse of the heart Bonnie Tyler
[Форекс] The Cost of Technical Trading Rules in the Forex Market
ashel 13 Total Eclipse of the Heart
The Cost of Doing Business Leslie What
Total number of students in tertiary education, as a percentage of the population aged 20–24, by EU
Crystal Jordan [In the Heat of the Night 01] Total Eclipse of the Heart [pdf](1)
980 Bonnie Tyler Total eclipse of the heart
Kwiek, Marek The Two Decades of Privatization in Polish Higher Education Cost Sharing, Equity, and
David Hawkins The Ultimate Secrets Of Total Self Confidence
mapi com The Ayurvedic View of Marijuana
Interruption of the blood supply of femoral head an experimental study on the pathogenesis of Legg C
więcej podobnych podstron