
© Society of Actuaries
The Financial Crisis and Lessons for Insurers
September 2009
Sponsored by:
CAS, CIA, SOA Joint Risk Management Section
SOA Committee on Finance Research
Authored by:
Dr. Robert W. Klein
Dr. Gang Ma
Dr. Eric R. Ulm
Dr. Shaun Wang
Xiangjing Wei
Dr. George Zanjani
Contact Author:
Dr. Shaun Wang
Department of Risk Management and Insurance
Georgia State University
P.O. Box 4036
Atlanta, Georgia 30302-4036
Tel: 404-413-7486
E-mail:
shaunwang@gsu.edu
© 2009, Society of Actuaries, All Rights Reserved.
The opinions expressed and conclusions reached by the authors are their own and do not represent any official position
or opinion of the sponsoring organizations or their members. The sponsoring organizations make no representation or
warranty to the accuracy of the information. Georgia State University and ING Investment Management disclaim
responsibility for any private publication or statement by any of its employees. The opinions and views expressed
herein are those of the authors and do not necessarily reflect those of the companies.

© Society of Actuaries
1
Acknowledgements
The authors thank the Project Oversight Group (POG) for guidance throughout this project
and Steven Siegel, Research Actuary of the Society of Actuaries, in particular for his
leadership, coordination, and responsiveness. The authors are grateful for funding
sponsored by Society of Actuaries Committee on Finance Research and the Casualty
Actuarial Society, Canadian Institute of Actuaries, and Society of Actuaries’ Joint Risk
Management Section.
The members of the POG for The Subprime Mortgage Crisis and Lessons for Insurers are:
♦
Steven Siegel
♦
Dave Cummings
♦
Louise Francis
♦
Ron Harasym
♦
Phil Heckman
♦
Stephen Marco
♦
John Nigh (Chair of POG)
♦
Krzysztof Ostaszewski
♦
Bob Schneider
♦
Fred Tavan
♦
Robert Wolf
The authors also thank the following individuals of ING Investment Management for
various support and discussions: Tanweer Akram, Jacqueline Ashworth, Marc Altschull,
Glenn Elsey, Hieu Giang, David Goodson, Suresh Krishnamoorthy, Brad Taylor, and
Yingli Zhu. In addition, the authors thank Xuanmin Chen (BlackRock), Brett Rose
(Citigroup), and Mehmet Ozhabes (JPMorgan Chase) for providing industry data or
research papers.

© Society of Actuaries
2
Table of Contents
EXECUTIVE SUMMARY .........................................................................................................................................4
I. INTRODUCTION..................................................................................................................................................10
A.
L
INE OF
S
IGNIFICANT
E
VENTS
.............................................................................................................................10
B.
O
VERVIEW OF THE
P
APER
....................................................................................................................................11
II. ROOTS AND CAUSES OF THE FINANCIAL CRISIS ..................................................................................17
A.
B
RIEF
P
RIMER ON
RMBS
S
ECURITIZATION
M
ARKETS
,
P
ARTICIPANTS
,
AND
P
ROCESSES
....................................18
B.
A
SSUMPTIONS
R
EGARDING THE
H
OUSING
M
ARKET
............................................................................................21
C.
S
ECONDARY
C
AUSES
...........................................................................................................................................23
1. Regulatory Systems: Flaws and Reform .........................................................................................................23
2. The Originate-to-Distribute Model in Mortgage Finance ..............................................................................25
3. Over-reliance on Rating Agencies ..................................................................................................................26
4. Excessive Faith in the U.S. Federal Reserve System ......................................................................................27
5. Subsidization of Home Ownership and Housing Investment ..........................................................................28
III. EFFECTS OF THE FINANCIAL CRISIS ON THE U.S. INSURANCE INDUSTRY ................................29
A.
O
VERVIEW OF
L
IFE
I
NSURANCE
I
NDUSTRY
A
SSET
A
LLOCATION AND
A
SSET
Q
UALITY
......................................30
B.
T
RENDS IN
A
SSET
Q
UALITY
.................................................................................................................................33
C.
I
NVESTMENT AT THE
G
ROUP
L
EVEL
....................................................................................................................35
D.
I
NDUSTRY
I
MPACT
...............................................................................................................................................37
E.
C
ONCLUSIONS
......................................................................................................................................................41
IV. MBS ANALYTICS, THEIR USES AND LIMITATIONS ..............................................................................42
A.
I
NTRODUCTION
–
F
IXED
I
NCOME
A
NALYTICS
.....................................................................................................42
B.
D
ESCRIPTION OF
E
FFECTIVE
D
URATION
..............................................................................................................42
C.
P
ITFALLS OF
E
FFECTIVE
D
URATION AND THE
U
SEFULNESS OF
O
THER
A
NALYTICS
.............................................43
1. Parallel Shift of Yield Curve ...........................................................................................................................43
2. Interest Rate Sensitivity of Duration – Convexity ...........................................................................................43
3. Option Adjusted Spread (OAS) and Spread Duration ....................................................................................43
4. Current Coupon Spread and Coupon Spread Duration..................................................................................44
5. Interest Rate Volatility and Vega Duration ....................................................................................................44
6. Practical Pitfalls .............................................................................................................................................44
D.
M
ORTGAGE
P
REPAYMENT
M
ODEL
......................................................................................................................45
E.
M
ORTGAGE
D
EFAULT
M
ODEL
.............................................................................................................................46
V. TIME SERIES PROJECTIONS OF MORTGAGE LOSSES..........................................................................47
A.
R
ESIDENTIAL
M
ORTGAGE
L
OSSES
P
ROJECTION
..................................................................................................49
B.
C
OMMERCIAL
M
ORTGAGE
L
OSSES
P
ROJECTION
..................................................................................................53
VI. PERSPECTIVE ON ENTERPRISE RISK MANAGEMENT........................................................................55
A.
I
NTRODUCTION
....................................................................................................................................................55
B.
A
C
LOSER
L
OOK
..................................................................................................................................................56
VII. REGULATORY IMPLICATIONS..................................................................................................................62
A.
I
NTRODUCTION
....................................................................................................................................................62

© Society of Actuaries
3
B.
T
HE
P
ARADIGM FOR
F
INANCIAL
R
EGULATION IN THE
U.S. .................................................................................62
1. Current Approach and Philosophy .................................................................................................................62
2. Current Framework ........................................................................................................................................63
3. Alternative Frameworks and Issues ................................................................................................................65
C.
A
CCOUNTING
S
TANDARDS AND
V
ALUATION
I
SSUES
...........................................................................................65
D.
R
EGULATION OF
I
NVESTMENTS
...........................................................................................................................67
E.
C
APITAL
A
DEQUACY
S
TANDARDS
.......................................................................................................................68
F.
F
INANCIAL
M
ONITORING AND
A
NALYSIS
............................................................................................................71
1. Overall System ................................................................................................................................................71
2. Early Warning Systems ...................................................................................................................................71
3. Other Elements ...............................................................................................................................................72
4. Evaluation.......................................................................................................................................................73
G.
I
NTERVENTION
....................................................................................................................................................74
F.
S
YSTEMIC
R
ISK
....................................................................................................................................................75
VIII. LESSONS, CONTINUING CHALLENGES, AND INDUSTRY OUTLOOK ...........................................76
A.
L
ESSONS
..............................................................................................................................................................76
1. Credit Ratings .................................................................................................................................................76
2. Capital Adequacy and Investment Risks .........................................................................................................77
3. Stress-Testing..................................................................................................................................................77
4. Diversification versus Specialization..............................................................................................................78
5. Agency Problem ..............................................................................................................................................79
B.
C
ONTINUING
C
HALLENGES
..................................................................................................................................79
1. Looming Investment Losses and Capital Erosion ...........................................................................................79
2. De-Leveraging ................................................................................................................................................80
3. Fair Value vs. Book Value Accounting ...........................................................................................................80
4. Principle-Based vs. Rules-Based Regulations ................................................................................................81
C.
L
IFE
I
NSURANCE
I
NDUSTRY
O
UTLOOK
................................................................................................................82
REFERENCES ..........................................................................................................................................................83
APPENDICES............................................................................................................................................................86
A
PPENDIX
A.
2007-2008
F
INANCIAL
C
RISIS
T
IMELINE
............................................................................................86
A
PPENDIX
B.
F
EDERAL
F
UNDS
T
ARGET
R
ATE
R
EDUCTIONS
S
INCE THE
B
EGINNING OF
C
RISIS
...............................90
A
PPENDIX
C.
G
OVERNMENT
R
ELIEF
P
ROGRAM
W
ORLDWIDE
..................................................................................91
A
PPENDIX
D.
B
REAKDOWN OF
W
ORLDWIDE
I
NSURER
A
SSET
W
RITE
-D
OWNS
S
INCE
2007 .....................................92
A
PPENDIX
E.
B
REAKDOWN OF
W
ORLDWIDE
I
NSURER
C
APITAL
-R
AISING
S
INCE
2007.............................................93

© Society of Actuaries
4
Executive Summary
The recent financial crisis has forced a general re-examination of our financial and regulatory
systems. While recognizing that the recent and ongoing nature of the crisis and the policy and
regulatory responses to it makes it difficult to draw definitive conclusions, this paper undertakes
an initial effort at studying the crisis from the perspective of the insurance industry. Specifically,
we address the following questions as outlined in the original Society of Actuaries (SOA) request
for proposals: 1) What were the root causes of the subprime mortgage crisis?; 2) What factors led
to insurers' exposure in these markets?; 3) What risk metrics can be used to measure the extent of
insurers’ exposure?; 4) How extensive is the ongoing problem and expected duration for
insurers?; 5) What procedures, processes or related information may have been problematic and
contributed to the exposure?; 6) What types of enterprise risk management strategies may have
been incorporated to help avoid this situation?; 7) What types of enterprise risk management
strategies could be implemented to mitigate future similar events, such as below investment
grade instrument risk?; and 8) What are the overall lessons for insurers from the subprime
mortgage crisis?.
Our key findings are summarized below (following in general the outline above).
•
Roots and causes of the subprime mortgage crisis:
We argue that the primary cause of the crisis lay in the widely held belief that housing prices
could not decline significantly on a national basis. This optimistic belief was shared by
policymakers, economists, and market participants in general, permeated the models used by
rating agencies to assign inflated ratings to securities built from subprime mortgages, and
was reinforced, for a time, in market prices through a self-fulfilling prophecy. Additionally,
we document five secondary causes: 1) a complex and ultimately ineffective regulatory
regime in the U.S.; 2) various incentive problems embedded in the originate-to-distribute
model for securitization; 3) an over-reliance on credit ratings by market participants and
regulators; 4) excessive faith in the Federal Reserve System; and 5) the subsidization of risk-
taking in home ownership embedded in various government policies. The catalyst of over-
optimism in the housing market combined with these secondary ingredients to produce
catastrophic results.
•
Insurers' exposure in real estate and subprime or non-agency residential mortgage backed
securities (RMBS):
The life insurance industry has always had significant exposure to mortgages so, in some
respects, it is not surprising that the industry was exposed to a real estate crisis. However, we
found little evidence that the industry as a whole chased the real estate bubble in the sense of
increasing its exposure to mortgages, although with noticeable exceptions: 1) some groups

© Society of Actuaries
5
tended to have invested more aggressively than others; 2) some large holding companies took
on disproportionately large mortgage exposures through structured credit instruments; 3)
some monoline bond insurers guaranteed mortgage-related structured credit; and 4) mortgage
insurers pushed beyond their traditional conforming business to assume risk in the non-
conforming realm. We also found some evidence that insurers that invested aggressively in
mortgage-related assets tended to be risk-takers in other areas (e.g., through GMXB exposure
and securities lending programs) as well. However, more importantly, the industry – despite
little direct exposure to subprime mortgages – has suffered significant losses due to collateral
damage in corporate bond and CMBS markets, as well as GMXB losses due to equity market
declines.
Although mortgage exposure was not unusual from a long-term perspective, we do find some
evidence of deterioration in general asset quality over the past 15 years. In particular,
government bonds and agency-guaranteed obligations have lost ground to corporate bonds
and private-label or non-agency MBS. This trend may have been accommodated to some
degree by risk-based capital requirements, which effectively treated highly-rated private
obligations as near-substitutes for public obligations. Specifically, we find that groups
investing in private-label structured credit were rewarded with higher fixed income portfolio
yields at no additional cost in terms of higher capital charges based on average NAIC risk
classification ratings.
•
Fixed income analytics and limitations when applied to RMBS:
Fixed income analytics suffer from design flaws and practical limitations when applied to
RMBS. One practical limitation noted in the recent environment was that non-agency RMBS
when overwhelmed by credit concerns exhibit little interest rate sensitivity, while fixed
income analytics systems, without special adjustment, would continue to produce positive
durations for these securities. Another example of a practical limitation lies in the challenge
of reflecting structural change in prepayment models. For example, in an attempt to conserve
capital, the GSEs are now delaying purchase of 120-day delinquent mortgages from
securitization trusts – this obviously changes the cash flow patterns of agency RMBS.
•
Continuing challenges to insurers:
We identify three continuing challenges to insurers. One, at the macro-economic level, the
speed of the U.S. housing market recovery is widely viewed as the linchpin of this economic
recovery. At the end of 2008, Moody’s forecast the OFHEO House Price Index to drop
another 15 percent over the next 1-2 years (base scenario). This forecast of continued
housing market deterioration is corroborated by our independent analysis of the housing
market. Additionally, our forecast of foreclosure rates and loss ratios shows continued stress
through 2009 for prime mortgages and through the third quarter of 2010 for subprime

© Society of Actuaries
6
mortgages. Two, the insurance industry could face worsening valuations in CMBS and other
credit assets if the economy continues weakening. Credit losses from these assets, combined
with inadequate hedging in variable annuities, could further erode an insurer’s capital base.
Three, the industry has engaged in extensive de-leveraging since 2008. The tricky question
now for insurers is whether to continue or slow down and when to stop. An inopportune
decision could affect a company’s survival or future competitiveness.
•
(In)effectiveness of regulation in controlling the financial risks of insurers:
In some respects, insurance regulation appears to have served consumers and the industry
better than its counterparts elsewhere within the financial system. For example, strict
regulation of derivatives, as well as rules regarding compartmentalization of the industry (i.e.
monoline restrictions), may have prevented the worst of the housing carnage from affecting
policyholders outside of the mortgage guaranty and financial guaranty lines. Flaws were
exposed in other areas of regulation, however, and we identify six areas requiring attention.
First, while the debate on rules-based vs. principle-based regulation will continue, this crisis
could help shift the debate to crafting a proper mix of the two that will encourage desirable
outcomes. An ideal regulatory system should enable and encourage insurers to engage in the
best risk management practices, suggesting that some form of ERM could be mandated in a
principle-based framework. At the same time, it may be necessary to implement rules to
protect the public from the dangers of severe collective miscalculations that lead to causing
or being exposed to systemic events.
Second, while the debate on accounting reform is unsettled, our view is that there may be no
one single accounting rule that serves the various users of insurer financial statements.
Different assessments of an insurer’s value are appropriate depending on how that
information is used. One area that is likely to draw close scrutiny and become more
restrictive is the treatment of off-balance sheet activities. As we learned from this crisis, such
accounting maneuvering permitted under GAAP had facilitated large accumulation of toxic
assets (e.g. through Structured Investment Vehicles) in companies like Citigroup and Merrill
Lynch prior to the crisis, contributing to the woes of these companies and elevating the
systemic risk they posed.
Third, the derivatives constraint imposed by the NAIC Defined Limit Model Act for income
generation purposes may have benefited some insurers by preventing them from engaging in
investments strategies that would have increased their exposure to the implosion of the
housing market. Looking forward, regulators may revisit their supervision of insurers’
investment practices in line with the lessons learned from the most recent crisis and
contemplate even stricter limits tied to the type of collateral underlying asset-backed
securities.

© Society of Actuaries
7
Fourth, the NAIC risk-based capital (RBC) formula suffers from several flaws, including its
static approach, reliance on accounting values in general (though dynamic analysis has been
added to the Life C-3 component), a failure to quantify operational risks, no adjustment for
an insurer’s size, and reliance on third-party credit ratings. Structurally, rating-based capital
requirements tend to rise (decline) in a down (up) economy as the credit environment and
ratings deteriorate (improve), making companies ill-equipped from a capital perspective to
deal with the adverse portion of the credit cycle. This characteristic of capital requirements
also has an undesirable pro-cyclical effect from the economic policy perspective. Rising
capital requirements in a down economy lead to dissipating risk appetite among companies,
tightening of credit availability, and reduced lending and other economic activities, all in a
time when such activities should be encouraged and are desirable from an economic policy
perspective. The reverse holds in an up economy. Possible improvements include refinement
of capital charges for different asset classes and dynamic analysis that is tailored for a
particular insurer’s characteristics or standard model that could be somewhat customized for
a specific insurer.
Fifth, the early-warning systems used by state regulators to monitor insurers lag behind
actual events with calculated ratios that only crudely indicate insurers’ exposures to losses
from mortgage-backed securities or subprime mortgages. If insurers’ reporting requirements
are enhanced to provide better information on the credit quality of their assets, the additional
data could be used to improve early warning systems. Early warning systems can also
complement or augment capital requirements.
Sixth, regulatory intervention could be constrained by the legal burdens regulators may have
to satisfy in order to take certain actions.
Regulators’ willingness to exert such power may
also be influenced by whether the regulatory framework is rules-based or principle-based. A
system which would provide regulators greater discretion and also employs greater use of
qualitative assessments of insurers’ ERM programs could help to correct this problem.
The regulation of systemic risk also needs to be addressed. This is a topic that has already
received considerable attention and is included in the Administration’s new plan for financial
regulation. As systemic risk has roots in both outsized financial institutions and wide
interconnectedness of a financial system woven in derivatives, an effective regulatory
framework in this arena, in our view, should address size and counterparty risk, as well as
promote market transparency. While opinions may differ on how systemic risk should be
regulated, it is a matter of critical importance and a well-designed and implemented approach
should aid the insurance industry in managing this risk.

© Society of Actuaries
8
•
Enterprise Risk Management (ERM) perspectives:
One thing made clear by this financial crisis is that risk management is not a luxury but a
necessity. For financial firms including insurers, the complexity of today’s financial products
and financial engineering underscores the need for a holistic approach to risk (i.e., ERM). We
identify nine key points for attention. One, the success of ERM hinges on a strong risk
management culture which starts at the top of a company. Two, risk management is most
effective when used to prevent crises rather than manage them. Three, the interconnected
nature of financial systems means that insurers should pay attention to not only what is going
on inside their “own houses” but also be aware of what is going on in their “neighbors’
yards.” Four, insurers should establish a robust liquidity management system. Five, it is
important to develop a counterparty risk management system and establish counterparty
limits. Six, insurers must pay special attention to high growth/profit areas in their companies,
as these are often the areas from which the greatest risks emanate. Seven, insurers should
develop and refine tools that allow them to systematically aggregate exposures, including
those in far-flung corners of their companies. Eight, models can create a false sense of
comfort. Managers must be alert to the assumptions that go into models and the limitations of
model results due to these assumptions. It is critical to challenge the assumptions and subject
them to stress tests. For example, the recent crisis highlights the value of independent credit
risk assessment. Nine, stress testing needs to be more dynamic and robust by incorporating a
rich variety of economic scenarios, as well as explicitly considering a company’s own rating
downgrades, counterparty rating downgrades, the failure of liquidity suppliers, and increased
correlations in asset returns, between products, and across different business lines or business
units during times of distress.
•
Overall lessons for insurers:
While some of the points above are indeed lessons (e.g., the nine ERM perspectives) that we
distilled from our study of the crisis, two additional ones – diversification and agency
problems – warrant special consideration.
Diversification has long been touted and widely practiced in areas from investment
management to business management as one of the most effective ways to reduce risks and
stabilize financial results. The crisis offers mixed evidence on this view. On the one hand,
most insurance companies have fared relatively well, thanks in part to their investment
portfolios that are more diversified and of higher credit quality than in earlier eras such as the
1980’s. On the other hand, organizations that may have relied on the premise of
diversification to push beyond the limits of their expertise (such as those engaged in selling
credit risk protection to banks through the CDS market) were ravaged: in some cases, the
destructive potential arising from overexpansion in an unfamiliar market far outweighed the

© Society of Actuaries
9
perceived diversification benefit. From a regulatory perspective, it is also worth considering
the systemic implications of having large, diversified, “too big to fail” institutions.
Agency problems refer to the different and sometimes conflicting interests of various
stakeholders that a company has to attend to. For insurers, one additional layer of complexity
is the interest of policyholders. A stock insurance company has to ultimately face the
question of how to balance the conflict between stockholders’ demand for high profitability
and growth, which is of short-term nature, and policyholders’ needs for service, affordable
products with meaningful coverage, and strong financial strength, which are of long-term
orientation. The influence of stockholders in the industry has grown in the past two decades
leading up to the crisis due to a wave of demutualization beginning in mid 1990’s. While
many companies, both stock and mutual, may have suffered in the crisis, the performance of
certain stock insurance companies could lead to a re-examination of relative benefits of the
stock and mutual forms.

© Society of Actuaries
10
I. Introduction
Michael McFaul
1
once wrote: “In retrospect, all revolutions seem inevitable. Beforehand, all
revolutions seem impossible.”
This observation is easily applied to the current financial crisis. In
hindsight, it seems obvious that the U.S. housing market was over-inflated and that the economic
consequences of the inevitable bursting of that bubble would be severe. Yet the financial
industry, its regulators, and other policymakers were not prepared for the onset of the subprime
crisis in the summer of 2007. Aggressive governmental policy measures and rescue efforts failed
to arrest the panic, which soon ballooned into a global financial crisis. Although the crisis was
foreshadowed by numerous previous crises, with the most recent merely six years in the passing
few anticipated the depth and breadth of the current malaise.
2
What went wrong? What lessons may be drawn from this crisis? Why were lessons from the past
crises not applied to prevent the current one? What can the insurance industry do to prepare for
future crises? What are the near-term challenges facing the insurance industry (as the crisis is
still unfolding) and the long-term outlook? Though no easy task, addressing these questions is an
essential exercise for the industry as it moves forward.
A. Line of Significant Events
While the roots of the subprime bubble may extend far back in time, it is convenient to mark
2007 as the year the financial crisis began to unfold. The early part of the year was marked by
the failure of several major subprime lenders, which was followed soon thereafter by a rapid
evaporation of liquidity in the market for mortgage-backed and asset-backed securities with
subprime exposures. The worsening liquidity problems led to the collapse of the two Bear
Stearns hedge funds in the early summer of 2007 and reached a crescendo during August of 2007
when various bank debt markets (notably, markets for asset-backed commercial paper) seized up
on the growing realization that U.S. subprime loans had infected bank portfolios worldwide.
3
Over the following months, policymakers responded by deploying a number of conventional and
unconventional tools in the hope of arresting the crisis. The Federal Reserve started cutting the
Federal Funds Rate target in September of 2007, beginning a process that would ultimately result
in an unprecedented target level of 0 to 0.25 percent. Congress unveiled a $152 billion economic
stimulus package in early 2008. And the Federal Reserve initiated a series of measures aimed at
enhancing liquidity in the frozen credit markets, with the consequence of dramatically expanding
both the range of acceptable collateral and the types of eligible financial institutions.
4
1
He is a Professor of Political Science at Stanford University.
2
We refer to the bursting of the dot.com bubble as measured by NASDAQ Composite Index, which lost more than
50% value in 2001 from its March peak.
3
Bear Stearns High-Grade Structured Credit Strategies Master Fund Ltd. and Bear Stearns High-Grade Structured
Credit Strategies Enhanced Leverage Master Fund Ltd.
4
Examples include the Primary Dealer Credit Facility and the Term Securities Lending Facility, which were
introduced in March of 2008.

© Society of Actuaries
11
These measures were not sufficient to avert further distress. The initial wave of the credit crisis
spread to other credit markets, gained further momentum from sharp drops in housing prices and
a pullback in consumer spending, and ultimately engulfed the global economy. Moreover,
troubles continued as institutional lenders withdrew from bank debt markets, with the ultimate
climax being the failure of Lehman Brothers and the near collapse of AIG in September of
2008.
5
Following these cataclysmic events, government intervention in financial markets became
more aggressive, with broad guarantees of newly issued bank debt and of existing investments in
money market fund shares, direct intervention in the commercial paper market, and the
establishment of the Troubled Asset Relief Program (TARP), through which there has been
direct public investment in various financial institutions.
6
Throughout this crisis, the insurance industry has been significantly stressed with respect to both
assets and liabilities. Several large insurers have sought aid from within their holding companies
and/or the federal government. There have been a number of downgrades of insurers by the
rating agencies and the rating outlook for the industry remains negative.
B. Overview of the Paper
Before proceeding to summary of findings, our research approach and sources of information are
worth mentioning. In addition to our collective knowledge and expertise, the authors relied on
two general sources of information to form the basis of our research – data and the existing
literature. Our primary source of data is the NAIC compendium of the statutory filings of U.S.
life insurance companies. This was supplemented by a variety of other sources as needed,
including but not limited to: Bloomberg, LoanPerformance, Inside Mortgage Finance, and
reports from rating agencies and investment banks. With respect to the literature, the authors
reviewed an extensive set of work generally including materials on insurance and financial
regulations, structured credit and mortgage securitization, and risk management – with a focus
on those works related to the current crisis. Much of this material and some other relevant works
are listed in the reference section of this paper.
We start by examining roots and causes of the current crisis in Chapter II (Roots and Causes of
the Financial Crisis). We identify as the primary cause the widely held belief that housing prices
could not decline significantly on a national basis, a choice that might be interpreted as reflecting
our view that the most important underlying factor in bubbles concerns human tendencies toward
greed and fear, and difficulties in recognizing the transformative effects of structural change,
rather than the institutional context of the particular event. The belief was shared by
policymakers, economists, and market participants in general. In particular, it was relied upon by
rating agencies in their models to assign overly optimistic ratings to many of the securitized
instruments, which, for a time, were reinforced in market prices through the mechanics of a self-
fulfilling prophecy.
5
Given the broad sweep of the financial distress, the “Subprime Crisis,” the “Credit Crisis,” and the “Financial
Crisis” have become synonymous in popular usage. In this paper, we use these labels interchangeably to describe the
same phenomenon.
6
Appendix A provides the timeline of significant events to date since the beginning of the crisis. Appendix B lists
Federal Fund Target Fund reductions since the beginning of the crisis.

© Society of Actuaries
12
While the essential catalyst for the crisis may have been over-optimism about housing prices, the
housing boom proceeded apace on the back of what proved to be flawed and fragile institutional
and regulatory infrastructures for financing residential investments. We document as secondary
causes these structural weaknesses in housing finance and other areas of lending as well as
weaknesses in financial regulation. Specifically, we discuss issues beginning with the current
complex regulatory regime in the U.S., including possible “forum shopping” by regulated
entities, Federal Reserve deference of its oversight of financial institutions to functional
regulators, turf battles between regulators, and partial oversight of a financial institution by any
single regulator. Next, we review the incentive problems embedded in the originate-to-distribute
model for securitization. Third, we examine the pitfalls inherent in the reliance on third party
credit ratings by both market participants and regulators – despite a variety of weaknesses which,
with the known lagging effect and the newly publicized deficiency in data and conflict of interest
in the compensation structure for rating services, are nevertheless sanctioned and entrusted by
regulators, company managers, and trustees of investment funds as de-facto key risk
management metrics. Fourth, we discuss the excessive faith in the Federal Reserve System,
where we refer to a failure of market participants and regulators to recognize the limits on the
Fed’s powers and abilities to stabilize the financial system in a time of crisis. Finally, we briefly
discuss the subsidization of housing market investment embedded in various short-term and
long-term federal policies that ultimately served to enable overinvestment in the housing sector.
Next, we examine in Chapter III (Effects on the U.S. Insurance Industry) the insurance
industry’s asset allocation and asset quality. Of particular interest are insights into questions such
as: Did the industry chase the real estate bubble? What distinguished insurers that invested in
structured products (including non-agency RMBS) from those that did not? Has the quality of
insurers’ assets decreased over the years in pursuit of yield? Was subprime RMBS directly to
blame for the insurance industry’s woes in this crisis? By analyzing the insurance industry’s
statutory filings and data from other sources, we’ve found: 1) little evidence of chasing the real
estate bubble at the industry level; 2) mixed evidence of yield-chasing at the group level – those
insurers with indicators of risk-taking in other areas (such as GMXB exposure or securities
lending programs) tended to have greater investment in structured credit, although some of that
can be explained by the larger size of the firm; 3) some confirming evidence that regulatory and
rating agency risk-based capital models may have contained incentives for investing in structured
credit and were vulnerable to being arbitraged – specifically, those groups investing in the same
enjoyed higher portfolio yields despite having similar overall portfolio quality as measured by
the NAIC six-class rating system, suggesting that those groups wishing to chase yield could do
so by choosing riskier securities within NAIC rating classes without suffering an RBC penalty;
4) relatively small direct exposure to subprime RMBS at the industry level which, combined
with other evidence, indicates that the industry’s larger problem concerns the collateral damage
suffered in other asset classes.
In Chapter IV (MBS Analytics, Their Uses and Limitations), we discuss fixed income analytics,
with a specific focus on the limitations of effective duration and how those limitations can be
overcome (to some degree) through supplementing with other analytics. We also review the

© Society of Actuaries
13
mortgage prepayment model and the mortgage default model and their building blocks, two
necessary ingredients of RMBS analytics calculation.
Fixed income analytics, such as effective duration, are popular and useful tools with wide-
ranging applications in hedging, relative value or risk return analysis, efficient frontier
construction, performance attribution, and asset liability management. But effective duration
suffers from design flaws and practical limitations when applied to RMBS. One practical
limitation is that in the recent environment, non-agency RMBS, overwhelmed by credit
concerns, exhibit little interest rate sensitivity although fixed income analytics systems, without
adjustment, continue to calculate and report positive durations for them. Another example of a
limitation is that the recent policy change by the GSEs to delay purchase of 120-day delinquent
mortgages from securitization trusts. Such structural change affects the cash flow pattern of
agency RMBS and will distort analytic metrics unless the change is reflected in the prepayment
model. An understanding of these pitfalls and limitations is important to practitioners and could
help avoid misinterpretation or misuse of models and their outputs.
One lingering question in the minds of policymakers, regulators, rating agencies, and senior
managers is the path and speed of the U.S. housing market recovery looking forward, which is
widely viewed as the linchpin of this economic recovery. In Chapter V (Forecasting the Impact
on the Insurance Industry), we review some of the forecasts and offer our own. For example, at
the end of 2008, Moody’s forecast the OFHEO House Price Index for five scenarios, with the
index expected in the base scenario to drop another 15 percent over next 1-2 years, which
translates into an additional 6.9 million homes transitioning from positive equity to negative. We
corroborate this forecast of continued housing market deterioration with a simple, high-level
Vector Error Correction Model using four factors: the foreclosure rate; the house price index; the
unemployment rate; and the TED spread. Additionally, we forecast the housing foreclosure rate
and the loss ratio. We forecast that the foreclosure rates for both prime and subprime mortgages
will reverse their recent downward trends and rise through most of 2009. Starting in 2010,
foreclosure paths for prime and subprime mortgages are expected to diverge with foreclosure
rates for prime mortgages gradually trending downward, while subprime foreclosure rates will
not plateau until the third quarter of 2010. With respect to the loss ratio, we forecast it to be in
the range of 2.2-3.3 percent and 18.2-27.4 percent for prime and subprime mortgages in 2009-
2010 respectively, assuming 40 percent to 60 percent severity (or loss given default). Our
forecast of the loss ratio is less pessimistic than Fitch’s, but not far off.
One thing made clear by this financial crisis is that risk management is not a luxury but a
necessity. For financial firms, including insurers, the growing complexity of financial products
and financial engineering creates the need for a holistic approach to risk management (i.e.,
ERM). In Chapter VI (Perspective on Enterprise Risk Management), we offer some thoughts
based on our observations, literature review, and experience. Specifically, we identify nine key
areas for special attention.
1. The success of ERM hinges on a strong risk management culture which starts at the top
of a company.

© Society of Actuaries
14
2. Risk management is most effective at prevention. Failing at prevention results in damage
control, which is often expensive and ineffective.
3. The presence of systemic risks means that insurers should pay attention to not only what
is going on inside their “own houses” but also be aware of what is going on in their
“neighbors’ yards.” Regulators should also pay attention to what is happening in other
countries.
4. Insurers should establish a robust liquidity management system to ensure that they have
ample liquidity under stress scenarios.
5. It is important to develop a counterparty risk management system and establish
counterparty limits.
6. Insurers must pay special attention to high growth/profit areas in their companies, as
these are often the areas from which the greatest risks emanate.
7. Insurers should develop and refine tools that allow them to systematically aggregate
exposures, including those in far-flung corners of their companies.
8. Models can create a false sense of comfort. Managers must be alert to the assumptions
that go into models and the limitations of model results due to these assumptions. It is
critical to challenge the assumptions and subject them to stress tests.
9. Stress testing needs to be more dynamic and robust by incorporating various economic
scenarios, a company’s own rating downgrades, counterparty rating downgrades, and the
failure of liquidity suppliers, as well as an increase in the correlations in asset returns,
between products, and across different business lines or business units during times of
distress.
The financial crisis raises issues with respect to the regulation of insurance companies. Many
aspects of regulation are intertwined with insurers’ financial management and asset allocations.
The current crisis poses questions about how well regulation has worked in helping insurance
companies in positioning themselves in advance of the crisis, as well as dealing with the
aftermath. In particular, a critical question is how regulation should be modified (if at all) going
forward. This is of particular relevance now as the Obama administration has recently proposed a
framework for financial regulatory reforms, and the Congress is considering its own. In Chapter
VII (Regulatory Implications), we review the important elements of insurer financial regulation
and discuss regulatory implications of the financial crisis.
In the U.S., regulators rely primarily on a rules-based approach, contrasted with the principle-
based approach employed in the UK and embraced in the EU’s Solvency II Directive. The rule-
based approach may have had some benefits. Rules such as monoline restrictions and derivatives
regulation may have helped domestic insurers steer clear of the worst of the crisis. But an ideal
regulatory system should enable and encourage insurers to engage in the best risk management

© Society of Actuaries
15
practices. Some form of ERM could be mandated as a part of a principle-based or rules-based
framework that could be implemented by state and/or federal regulators.
Second, U.S. insurance statutory accounting, governed by Statutory Accounting Principles
(SAP), follows book value accounting while International Accounting Standards (IAS) and
Generally Accepted Accounting Principles (GAAP) are moving toward fair value accounting.
There is no one single accounting rule that serves the differing purposes of investors/creditors
that are primarily concerned about an insurer’s liquidation value, and regulators and others who
are primarily concerned about an insurer’s solvency. Different assessments of an insurer’s value
are appropriate depending on how that information is used. Attempting to bring SAP and GAAP
into exact alignment may not be the best thing to do.
Third, the Investments of Insurers Model Act (Defined Limits Version) and Investments of
Insurers Model Act (Defined Standards Version) are two primary NAIC model laws that govern
insurers’ investments. The defined limit model act stipulates the limit permitted for each type of
asset including mortgage loans/real estate and derivatives intended for income generation. The
derivative constraint may have prevented some insurers from investing more heavily in assets
exposed to the implosion of the housing market. Looking forward, regulators may revisit their
supervision of insurers’ investment practices in line with the lessons learned from the most
recent crisis and contemplate even stricter limits tied to the type of collateral underlying asset-
backed securities.
Fourth, the NAIC RBC standards are used in setting minimum regulatory capital requirements
for U.S. insurers. Studies have raised questions about the accuracy and effectiveness of RBC
standards. The NAIC RBC formula suffers from several flaws, including its static approach,
reliance on accounting values (though dynamic analysis has been added to the Life C-3
component), no quantification of operational risks, and no adjustment for an insurer’s size.
Structurally, rating-based capital requirements tend to rise (decline) in a down (up) economy as
the credit environment and ratings deteriorate (improve), making companies ill-equipped from a
capital perspective to deal with the adverse portion of the credit cycle. This characteristic of
capital requirements also has an undesirable pro-cyclical effect from an economic policy
perspective. Rising capital requirements in a down economy leads to dissipating risk appetite
among companies, tightening of credit availability, and reduced lending and other economic
activities, all in a time when such activities should be encouraged and are desirable from an
economic policy perspective. The reverse holds in an up economy. Possible improvements
include refinement of capital charges for different asset classes and dynamic analysis that is
tailored for a particular insurer’s characteristics or a standard model customized for a specific
insurer.
Fifth, state regulators rely heavily on early-warning systems such as the Insurance Regulatory
Information System (IRIS) and the Financial Analysis Solvency Tools (FAST) systems to
monitor insurers. These systems tend to lag behind actual events with calculated ratios that only
crudely indicate insurers’ exposures to losses from mortgage-backed securities or subprime
mortgages. If insurers’ reporting requirements are enhanced to provide better information on the
credit quality of their assets, the additional data could be used to improve early warning systems.

© Society of Actuaries
16
Sixth, regulatory intervention means bringing an insurer into compliance with existing
regulations or going beyond regulations to achieve some desired outcome. Regulatory actions
with respect to troubled companies can be categorized into: 1) preventing a financially troubled
insurer from becoming insolvent; or 2) delinquency proceedings against an insurer for the
purpose of conserving, rehabilitating, reorganizing, or liquidating the company. For example, we
witnessed the extraordinary action by New York during this crisis to allow AIG’s insurance
subsidiaries to upstream surplus to the parent holding company to alleviate its liquidity crunch.
In practice, regulators’ power in compelling an insurer into certain actions could be limited by
the legal burden of proof they would be required to meet. Regulators’ willingness to exert such
power may also circle back to whether the regulatory framework is rules-based or principles-
based. A system which would provide regulators greater discretion and also employs more use of
qualitative assessments of insurers’ ERM programs could help to correct this problem.
The regulation of systemic risk also needs to be addressed. This is a topic that has already
received considerable attention and has been included in the Administration’s new plan for
financial regulation. As systemic risk has roots in both outsized financial institutions and wide
interconnectedness of a financial system woven in derivatives, an effective regulatory framework
in this arena, in our view, should address size and counterparty risk, as well as promote market
transparency. While opinions may differ on how systemic risk should be regulated, it is of
critical importance and a well-designed and implemented approach should aid the insurance
industry in managing this risk.
A good place to conclude this report is Chapter VIII (Lessons, Continuing Challenges, and
Industry Outlook). Lessons are numerous and discussed throughout the paper, but we focus on
four not emphasized elsewhere. One, given the known flaws of credit ratings, users of ratings
could be better served to develop an independent view of credit risk. Two, rating and factor-
based RBC formulas may provide inadequate and unreliable measures of risk. Three,
diversification is, in principle, beneficial but the benefit could be limited in a crisis. In addition,
companies expanding into new business lines beyond their expertise (e.g., selling credit risk
protection to banks), on the premise of increasing diversification, may be doing more harm than
good. Four, with respect to principal-agent problems, we visit the century-old issue of stock
versus mutual ownership of insurance companies that was highlighted in this crisis.
We see four continuing challenges for the insurance industry. One, the industry is possibly
facing more losses from CMBS if the economy continues to weaken. Investment losses
combined with inadequate hedging in variable annuities could further erode an insurer’s capital
base. Two, the industry has engaged in extensive de-leveraging since 2008. The tricky questions
now are whether insurers should continue the trend or slow down and when to stop. An
inopportune decision could affect a company’s survival or future competitiveness. Three, the
debate over book value vs. fair value accounting will continue. The recent accounting rule
changes enacted under political pressure could be a temporary measure to get through the crisis.
After the dust settles, there will likely be a reexamination of what worked and what did not
among the accounting profession, and more meaningful changes are possible. It is possible that
no single accounting rule will serve all purposes. Four, the debate on rules-based vs. principle-

© Society of Actuaries
17
based regulation will continue. This crisis could help shift the debate from arguing for the merits
of each regulation to crafting a proper mix of the two that will encourage desirable outcomes. In
other words, a principle-based system can include specific rules or regulatory restrictions and a
rules-based system can be based on a set of principles and use them in certain situations rather
than specific rules.
Finally, we offer an industry outlook. After the recent losses, the industry is likely to undergo
product redesign and re-pricing to reflect the distaste for product complexity, poorer investment
returns, and higher capital requirements. As the crisis wanes, there will likely be growing
industry consolidation and strategic repositioning. Surviving players may tend to have greater
size or target some niche and have a stronger capital base.
II. Roots and Causes of the Financial Crisis
In this chapter, we examine the roots and causes of the subprime mortgage crisis that, triggered
by skyrocketing subprime mortgage defaults in the U.S. starting in 2007, has led to a cascading
set of problems in the broader financial markets and turned the subprime mortgage crisis into a
global financial crisis, plaguing the global economy and virtually every industry including
insurance. As we will discuss, the flawed valuation of subprime mortgage loans and associated
securities is often fingered as the principal catalyst for the crisis. While our principal focus here
will be subprime mortgages, we also discuss other aspects of the financial crisis which have
important implications for insurers’ risk management and regulation.
When assessing the roots of the financial crisis, one is confronted with the question of where and
how deep to dig. On the one hand, the proximate causes of the crisis are now being attributed to
various weaknesses and ineffectiveness in the institutional and regulatory infrastructures of the
U.S. housing market and the global financial system. These systematic failings can be
appreciated only with a detailed understanding of those infrastructures and how they developed
over the many decades, going back at least to the transformational changes of the 1930’s with
ongoing skirmishes and battles between the free-market camp and the government-regulation
camp in the following decades leading up to the crisis. The last two decades prior to the crisis
were a golden era for free-market advocates, culminating in the enactment of Gramm-Leach-
Bliley Act in 1999, which repealed part of the Glass-Steagall Act of 1933 and contributed in part
to the mammoth growth of AIG and Citigroup. On the other hand, one could argue that the true
root causes of financial crisis lie in more fundamental elements of human nature. In this case the
institutional context is less important and the focus of investigation becomes one of mapping the
features of the current crisis to those that are common to its predecessors and those that are
unique to the current one. From there, an understanding from a behavioral perspective can be
gained as to why the past lessons had not been learned and what might have been driving the
current crisis in a unique way.

© Society of Actuaries
18
Both perspectives hold some truths. To maintain focus and keep this chapter to a manageable
size, we take a middle ground. We start by documenting the key elemental cause of the bubble in
the U.S. housing market, which ultimately rested on the foundation of a fundamentally flawed
(optimistic) assumption about the future path of residential real estate prices. In brief, the widely
held belief that housing prices could not decline significantly on a national basis allowed the
housing boom to proceed apace on the back of what proved to be flawed and fragile institutional
and regulatory infrastructures for financing residential investments. The structural weaknesses in
housing finance and other areas of lending as well as weaknesses in financial regulation were
exposed when the housing market faltered and we document these as secondary causes of the
crisis that ensued.
A. Brief Primer on RMBS Securitization Markets, Participants, and Processes
As residential mortgage-backed securities (RMBS) play a central role in this financial crisis, it is
important to first have a basic understanding of RMBS securitization markets, processes, and
participants. Securitization refers to the process of creating a security based on the stream of
future cash flows derived from an asset or a pool of assets. One purpose of securitization is to
free the capital that is used to support the assets to fund other activities. By purchasing the
security, an investor benefits from a relatively higher yield offered by the security issuer as an
enticement. Although an investor is protected to some extent by the pool of assets that are used
as collateral, the fact that the future cash flows may not fully materialize, due to loss or non-
performance of the underlying collateral, remains a key risk to the investor.
Mortgage securitization, as an extension of the general definition above, refers to the process of
creating financial claims based on the stream of future cash flows derived from a pool of
mortgages. In the mortgage parlance, this pool of mortgages is also called collateral, and the two
terms are used interchangeably. The mortgage securitization process starts with mortgage
origination, the point where the money is loaned from the lender, or mortgage originator, to the
borrower. After origination, the mortgage originator typically sells the loan to an MBS issuer.
This allows the originator to cycle money back to lending. After a certain amount of purchased
mortgages have been accumulated, the issuer issues MBS securities backed by the mortgages in
the pool.
There are two broad types of RMBS issuers: agency or non-agency. Agency is a generic term
that encompasses Ginnie Mae, Fannie Mae, and Freddie Mac, which are considered Government
Sponsored Entities (GSEs). Agency MBS usually come with the full principal guarantee
provided by GSEs and as such bear an AAA rating. GSEs are not in the business of mortgage
origination. Instead, they buy mortgages from originators to create a pool of collateral. The
mortgages they buy must meet certain criteria such as loan size, loan type, and a multitude of
borrower characteristics. A mortgage meeting the GSE underwriting criteria is called
conforming.
Mortgage securitization in the U.S. was pioneered by Ginnie Mae in 1970 when it issued the first
pass-through, the simplest form of MBS. This first issuance represented a launch point in
© Society of Actuaries
19
residential mortgage securitization that grew in the ensuing years and entered into a peak period
of issuance from 2001 through 2007 before crashing in 2008. Figure II.1 shows agency issuance
through first quarter of 2009 with a breakdown by agency.
Figure II.1: Trend of Agency Issuance and Breakdown by GSE (Source: Citigroup)
$0
$500
$1,000
$1,500
$2,000
$2,500
1
99
0
1
99
1
1
99
2
1
99
3
1
99
4
1
99
5
1
99
6
1
99
7
1
99
8
1
99
9
2
00
0
2
00
1
2
00
2
2
00
3
2
00
4
2
00
5
2
00
6
2
00
7
2
00
8
2
00
9
Year of Issuance
$
B
illi
o
n
FNMA
FHLM
GNMA
The explosive growth in mortgage securitization from 2001 to 2007 had multiple causes,
including: 1) an insatiable demand by U.S. consumers to finance not only home purchases but
also an array of consumptions and investments such as home improvements, auto purchases, or
real estate investments; 2) a growing number of little-regulated mortgage brokers armed with
loosening underwriting standards and even occasional fraud; 3) a growing supply of capital from
foreign investors and sovereign wealth funds (SWFs) derived from trade surplus with the U.S.;
4) investors’ constant demand for higher yields; and 5) Wall Street’s invention of complex
financially-engineered products that purportedly catered to that demand.
Non-agency issuers, as the name suggests, are other firms/institutions that create mortgage
backed and asset backed securities. Examples include JPMorgan Chase/Washington Mutual,
Bank of America/Countrywide, Wells Fargo/Wachovia, and other major financial institutions.
These issues are also called private-label. These players addressed the consumer need for non-
conforming mortgages, including jumbo (larger mortgage size), subprime (lower credit score
mostly), and Alt-A (no documentation mostly) mortgages, that were not purchased by GSEs.
Non-agency issuers could also assume the role of mortgage origination. In addition to the
mortgages they originated, these issuers also bought mortgages originated by others. The capital
market somehow classifies the non-agency issues as HEL ABS (home equity loan ABS), even
though many of these issues are first-lien mortgages used for home purchases. Figure II.2 shows
© Society of Actuaries
20
the trend of non-agency issuance through 2008 with a breakdown by type of mortgages. For
2008, the total issuance was just over $1 billion, a number too small to be visible on the chart.
The total issuance was split between whole loan (88 percent) and Alt-A (12 percent) with no
issuance in subprime and option ARM reported. The crash of the MBS market, especially for
non-conforming home loans, explains the small amount of subprime MBS issuance in 2008.
Figure II.2: Subprime Issuance and Breakdown by Type (Source: LoanPerformance)
$0
$200
$400
$600
$800
$1,000
$1,200
2001
2002
2003
2004
2005
2006
2007
2008
Year of Issuance
$
B
il
lio
n
Alt-A
Option ARM
Subprime
Whole Loan
After a sufficiently large pool of mortgages has been accumulated, it is structured into tranches.
In the agency sector, tranche creation is oriented toward meeting various cash flow needs of
investors since credit risk is of little concern. In the non-agency sector, however, tranche
construction, as illustrated below, is focused on meeting various credit risk appetites of investors.
A unique and critical part of the non-agency securitization process is assigning ratings to the
various tranches. This requires the participation of rating agencies, where Moody’s is a major
player.
Another instrument that played a pivotal role in the market crash is the CDO (collateralized debt
obligation). A CDO is structurally similar to the particular RMBS described above (when
multiple tranches were used. MBS are classified as collateralized mortgage obligations, or
CMOs), with the main difference being that a type of debt other than mortgages is contained in
the underlying asset pool. Some CDOs were built from HEL ABS tranches (typically lower-rated
tranches, such as mezzanine and subordinated), sometimes in addition to other securities such as
agency RMBS, CMBS, or other CDOs for diversification purposes. This new pool of securities
would then be tranched into various credit classes, which were rated by rating agencies and sold
to investors under the moniker of an “ABS CDO.”

© Society of Actuaries
21
Figure II.3: RMBS Tranche Structure
AA
A
BBB
BB
B
Unrated
First Loss Tranche
Collateral Pool
AAA
Senior Tranche
Mezzanine Tranche
Subordinated Tranche
Lastly, servicers are unglamorous participants in the mortgage securitization process. They
collect mortgage payments and distribute cash flows to security investors. Servicers also handle
defaults, which has helped them gain the spotlight with the recent debate over loan
modifications.
B. Assumptions Regarding the Housing Market
Examples abound of bubbles forming on the basis of overly optimistic belief in the underlying
asset class. The Dutch tulip mania of the 17
th
century, the South Sea Bubble of the 18
th
century,
the junk bond boom of the 1980’s, and the Internet stock craze of the 1990’s all serve as
examples of bubbles, which could commonly be characterized as inflation of price that, driven
by human greed, far exceeds a reasonable level supported by the economic fundamentals.
The U.S. housing boom was clearly an example of such a bubble, during which the assumption
of the sustainability of U.S. home prices was pervasive and widely held by homebuyers, lenders,
institutional investors, rating agencies, and regulators. This widely shared belief ultimately had
the effect of propelling housing prices to unprecedented levels in many metropolitan areas.
With prior bubble lessons in memory and the Internet bubble lesson still somewhat fresh, how
could this new bubble form and such a rosy assumption take root? It is not uncommon for
speculative booms to be founded on some element of truth. For example, few doubted the
transformative potential of the Internet in the 1990’s, even if they questioned the valuations of
Internet companies. Likewise, optimism about U.S. home prices had some measure of sound
grounding, or at least some measure of plausibility. To clarify, home prices were not viewed as

© Society of Actuaries
22
completely infallible. Indeed, there were numerous examples of regional real estate crises, (e.g.,
in the oil-producing states after the post-1980 collapse in oil prices and in New England during
the early 1990’s). But there was no record of a significant or protracted decline in nationwide
home prices in the U.S. since the Great Depression.
Some economists, notably Nouriel Roubini of New York University and Robert Shiller of Yale
University, sounded early alarms on the latest housing bubble. However, these warnings were
not heeded, as many dismissed these views as historical lessons that had limited relevance for the
“new economy.”
Through this crisis and the past, we see time and time again the power of human tendency in
believing in the market and using only recent experience as a guide to the future. The belief that
the market must be right and what everyone else is paying must be the right price plays an
important role in the forming of all the bubbles.
It was this particular truth – that there had not been a significant or protracted decline in
(nominal) real estate prices since the Great Depression – and the assumption that this would
persist, on which much ultimately rested. Many non-prime originations, especially those of the
sub-prime, high loan-to-value (LTV), and potential negative amortization (PNAM) varieties,
were especially sensitive to home price appreciation outcomes. If prices followed historical
precedent by not depreciating significantly, then default outcomes in the non-prime space would
be manageable. Even if borrowers defaulted, the value of the underlying collateral would be
sufficient for the lender to recover most of the loan. Accordingly, the rating agencies blessed the
securitization of non-prime mortgages, and the other players in the market used similar optimism
to justify their respective roles. The reliance on complex mathematical models to price and
estimate the default probabilities associated with mortgage-backed securities based on historical
experience also contributed to rating errors that, in turn, misled investors about the true risk of
these securities.
Fundamentally, the post-Depression record of home price behavior failed to predict the
precipitous decline in U.S. housing prices that materialized in 2007. With hindsight, the chain of
events that led to this failure seems clear. First, the maturation of a private-label securitization
market for non-prime and other non-conforming loans stimulated non-prime origination activity
in the 2000’s, with the immediate consequence that sub-prime and Alt-A mortgage lending
skyrocketed from relatively small niche areas to nearly $2 trillion of collective annual volume by
2006. What many failed to appreciate at the time, however, was that the nature of the loans in
both markets had fundamentally changed as a result of the transformative growth.
7
Moreover,
7
Alt-A loans, for example, had historically been a niche for “relationship lenders” who knew their clients very well
and made loans in an environment where there was little alternative to holding the loan to maturity. Hence, the
lender screened the borrower carefully. The loan was made despite the characteristics that had attracted the Alt-A
designation (e.g., inability to document income). With securitization, however, the “originate-to-distribute” model
became the norm, and Alt-A loans were churned out through mortgage brokers who brazenly wooed borrowers with
lines like “No Income? No Assets? No Problem!” If the borrower had a sufficiently strong credit history to justify an
Alt-A designation, then the loan could be sold, so there was no reason to screen the borrower beyond making sure
that the Alt-A designation applied. As a result, the typical Alt-A borrower of 2006 was nothing like the typical Alt-A

© Society of Actuaries
23
these markets were no longer specialty niches on the edges of the mainstream. Together with
other non-conforming mortgage loans, they had become the drivers of growth and appreciation
in the U.S. housing market. When these drivers were removed, the fall was, in hindsight,
inevitable.
C. Secondary Causes
In this subsection, we review the structural weaknesses in U.S. housing finance and regulation
that contributed to the crisis. We have chosen to label these as “secondary causes,” and this
choice reflects our belief that these weaknesses either played secondary roles or existed only in
the presence of the widely held belief that the U.S. housing market was invulnerable.
Specifically, we discuss the roles of regulatory systems, the originate-to-distribute model in
mortgage finance, the over-reliance on ratings, excessive faith in the U.S. Federal Reserve
System, and the subsidization of housing investment embedded in various federal policies.
1. Regulatory Systems: Flaws and Reform
The U.S. financial regulatory regime boasts a multi-overseer system, some of them created by
the Congress during the Great Depression to address the financial woes at the time. On the
banking side, there are four major regulators.
8
First, the Federal Reserve is the nation’s central
bank. Its mission includes conducting the nation’s monetary policy, supervising banking
institutions, maintaining the stability of the financial system, and providing financial services to
member banks. Second, the OCC (The Office of the Comptroller of the Currency) is
a bureau of
the Department of the Treasury. It charters, regulates, and supervises all national banks as well as
the federal branches and agencies of foreign banks. Third, the OTS (Office of Thrift Supervision)
is an office of the Department of the Treasury. It regulates and supervises savings associations as
well as domestic and international activities of the holding companies and affiliates that own
these thrift institutions. Fourth, the FDIC (Federal Deposit Insurance Corporation) insures
deposits in banks and thrift institutions for at least $250,000 with the goal of preserving and
promoting public confidence in the U.S. financial system.
9
As such, the FDIC is also involved
with examining and supervising banks. Since September of 2007, shortly after the crisis began,
the FDIC has seized control of 64 banks nationwide; nearly triple the number of seizures (25) in
the two years prior to the crisis. Each state also has its own banking regulators, but they usually
play a secondary role to the federal regulators.
On security oversight, the SEC (Securities and Exchange Commission) is the leading regulator
charged mainly with protecting investors and maintaining fair, orderly, and efficient markets.
10
In particular, it is the functional regulator of securities firms, including investment banks.
borrower of earlier times, even though the Alt-A securitization market was predicated on the assumption that
previous experience with Alt-A borrowers was a reliable guide to the future.
8
1)
http://www.federalreserve.gov/
; 2)
http://www.occ.treas.gov/
; 3)
http://www.ots.treas.gov/
; 4)
http://www.fdic.gov/
9
The limit on FDIC protection was recently increased from $100,000 to $250,000.
10
www.sec.gov

© Society of Actuaries
24
On the insurance side, the U.S. relies on a state regulatory system in which each of the 50 states,
the District of Columbia and the five U.S. territories are responsible for regulating insurance
companies and markets. The states regulate the financial condition, prices, products and market
practices of insurers. The National Association of Insurance Commissioners (NAIC) assists the
states by developing model laws and regulation, coordinating state activities and providing a
number of services the states use to perform their responsibilities. It is important to note that
while the NAIC plays an important and influential role it does not possess any governmental
authority, but rather acts through its members. Further, the adoption of the NAIC model laws and
regulations is the prerogative of each state. Also, the federal government retains the authority to
intervene in insurance matters but has chosen to do so only selectively to date.
11
This financial crisis has exposed a number of weaknesses in this complex web of regulatory
authority, some of which were already known. First, the situation of multiple potential regulators
allowed institutions to “forum shop” for the most favorable regulatory situation. As an example,
AIG FPC was overseen by OTS, chosen by AIG as its non-insurance overseer after AIG bought
a small savings and loan in 1999. Some have alleged that OTS had little knowledge of the CDO
protections sold by AIG FPC until the crisis came into light.
Second, even in situations where the Federal Reserve was the “top regulator” through its
authority to regulate the financial holding company of a conglomerate formed under the auspices
of the Gramm-Leach-Bliley Act, in practice there may have been substantial deference to the
functional regulators such as the SEC or state insurance regulators. As a practical matter, the
issue of regulatory “turf” was a delicate one that may have impeded effective regulation of large,
complex financial institutions. Another example of a regulatory turf war was the tussle over
credit derivatives regulation. Faiola (2008) depicted vividly the battle lines in 1998 between
Brooksley Born, then head of Commodity Futures Trading Commission and a proponent of
derivatives regulation, and a group of self-regulation proponents led by then Federal Reserve
Chairman Alan Greenspan, Treasury Secretary Robert E. Rubin and SEC Chairman Arthur
Levitt, and the Congress.
12
Third, no single authority was in a position to oversee all relevant aspects of financial markets.
To take the example of the housing crisis, many sectors that contributed to the crisis were
regulated, but no single regulator was in a position to exert effective control over the machinery
of housing finance. The OFHEO was the regulator of the GSEs; the various banking regulators
were the regulators of depository institutions who originated loans (although mortgage finance
companies were not subject to banking regulations); the SEC was the regulator of investment
banking firms who bought and securitized loans; and state and foreign insurance regulators were
responsible for oversight of the financial guarantors who insured securitization deals.
Thus, it is true that the U.S. regulatory system was “Balkanized” in the sense that no single
financial regulator was in a position to put a stop to the overgrowth of subprime lending.
However, it is hard to know how much of an impediment this would have been to a motivated
Treasury Secretary or Federal Reserve Chairman. In any event, Federal Reserve Chairman Alan
11
See Chapter VII and Klein (2005) for a more detailed discussion of the state insurance regulatory system.
12
Faiola, Anthony, Ellen Nakashima and Jill Drew, Oct 15, 2008, What Went Wrong, Washington Post.

© Society of Actuaries
25
Greenspan (perhaps the most powerful financial regulator in the U.S. during his tenure, which
ended in 2006) held a benign view of subprime lending as evidenced in the following quotation
from a speech on April 4, 2005.
Innovation has brought about a multitude of new products, such as subprime loans
and niche credit programs for immigrants. Such developments are representative
of the market responses that have driven the financial services industry
throughout the history of our country … With these advances in technology,
lenders have taken advantage of credit-scoring models and other techniques for
efficiently extending credit to a broader spectrum of consumers. … Where once
more-marginal applicants would simply have been denied credit, lenders are now
able to quite efficiently judge the risk posed by individual applicants and to price
that risk appropriately. These improvements have led to rapid growth in subprime
mortgage lending; indeed, today subprime mortgages account for roughly 10
percent of the number of all mortgages outstanding, up from just 1 or 2 percent in
the early 1990s.
Would Greenspan have been thwarted by the regulatory system had he sounded the alarm about
subprime lending? It is worth noting that some European countries with more centralized
financial regulators (e.g., the United Kingdom) were not able to dodge the subprime crisis
despite a possibly superior regulatory model. Creating a more centralized regulatory framework
does not necessarily assure that it will be used effectively to prevent or mitigate the kinds of
problems underlying the current financial crisis.
This truth should be kept in mind as we consider the costs and benefits of the financial system
reforms currently being contemplated by policy makers. Possible reforms include federal
insurance regulation (which may involve the creation of a federal insurance regulator) being
considered in the Congress, as well as the creation of a centralized banking regulator and a
derivative clearinghouse for settling CDS. These new developments could address some of the
shortcomings in the existing system, but, as noted above, the concentration of regulatory power
in the hands of fewer people may have drawbacks as well as benefits. In particular, should the
newly empowered regulators prove to be incompetent, there would be fewer checks on their
authority.
2. The Originate-to-Distribute Model in Mortgage Finance
The “originate-to-distribute” term is used to describe the process of channeling mortgages from
origination to securitization. This helps cycle the funds more quickly back to origination. There
is no doubt that the originate-to-distribute business model provided liquidity to mortgage
financing and enabled many people to achieve homeownership more quickly.
But the originate-to-distribute process was riddled with flaws and may have contributed to the
crisis. The originate-to-distribute business model contains many incentive problems which were

© Society of Actuaries
26
not adequately addressed.
13
Ultimately, many of the participants in the model (such as appraisers,
bankers, mortgage brokers, and investment bankers) aimed for short-term results (e.g., volume)
with little consideration for longer-term outcomes (e.g., loan quality). Many had little financial
stake in the process. Hence, it is no surprise that they pursued volume and speed at the cost of
quality. Market self-regulation in this process did not result in the maintenance of origination
standards. Cases of lax underwriting and even fraud, such as intentional appraisal inflation or
loan application alteration, were uncovered. Moreover, as noted above, there was no single
government regulator in a position to exert effective oversight over this process.
On the other hand, while it is true that the “originate-to-distribute” model had significant
weaknesses and vulnerabilities in a number of respects – including the originator’s incentives to
maintain underwriting standards – these weaknesses may have been tolerated largely because of
the fundamental optimism about housing prices. Those engaged in warehousing, securitizing, or,
ultimately, holding the loans as investments would likely have been more sensitive to the worth
of the guarantee obligations and credit enhancements offered by banks and mortgage finance
companies had a severe housing downturn been viewed as something other than a remote
scenario.
3. Over-reliance on Rating Agencies
Ratings play a key role in mortgage securitization and risk management. Many institutional
buyers of structured securities, lacking knowledge of deal details, relied on the ratings as a stamp
of approval. With respect to risk management, regulatory risk-based capital models, as well as
internal company value-at-risk or economic capital models, relied on ratings as well. In
particular, the regulators enshrined Nationally Recognized Statistical Rating Organizations
(NRSROs) as valid assessors of credit risk for input into regulatory models.
This heavy reliance on credit ratings in risk management has continued unabated even in face of
the known flaw of the ratings’ slow response to sometimes fast changing credit profiles of the
rated entities and security issuances. A strong piece of evidence prior to the subprime crisis
fueling the critics was the collapse of Enron and WorldCom in the early 2000s. Lowenstein
(2008) observed:
“After Enron blew up, Congress ordered the S.E.C. to look at the rating industry and
possibly reform it. The S.E.C. ducked. Congress looked again in 2006 and enacted a law
making it easier for competing agencies to gain official recognition, but didn’t change the
industry’s business model.”
This financial crisis has since revealed two additional significant weaknesses in the credit rating
process that had not been publicized before this crisis: 1) ratings were sometimes assigned based
on flawed assumptions when historical data were insufficient or less relevant; and 2) conflicts of
13
For a thorough treatment of this topic, see Ashcraft and Schuermann (2008).

© Society of Actuaries
27
interest were increasing, as documented in Lowenstein (2008) and Barrack (2008). Below is an
account of some of details revealed in these two articles.
The flawed assumptions that had formed the foundation of the ratings were not publicly
disclosed or otherwise made known to the users of the ratings until after the flaws came under
the spotlight through investigations triggered by some of the embarrassing ratings. We know
now, for example, that the AAA-rating initially assigned to some CDO tranches before the crisis
(three-quarters of the CDO tranches were rated AAA by Moody’s in one instance) were found to
be unsubstantiated and unsustainable and had to be rescinded soon after the crisis began.
Subsequently, a rating of several notches lower, in some cases at the junk level, had to be
reassigned to these CDO tranches. The investigations into the rating process have also unearthed
evidence of rating agencies’ conflict of interest due to deficiencies in the pay structure for rating
services and the fast-track nature of the rating process. It is alleged that in the peak structuring
time of 2006, Moody’s analysts had only one day to analyze the credit data from banks. The
pursuit of speed led to shelving some of the rating issues at Moody’s.
Arguably, the rating process had become a facilitator or even accomplice, rather than a
gatekeeper as investors would expect, of the security structuring process. Recent discussions on
addressing these weaknesses of the ratings have centered on: 1) allowing more entrants into
rating services to create market-driven competition; and 2) changing the compensation structure
for rating services. Although it is too early to predict how exactly changes will take shape given
the politics involved, it seems that this crisis may have finally provided the momentum for some
long overdue reform of the rating process.
Indeed, these conflicts of interest must be addressed. But again, a key reason for the rating
agencies’ mistakes were the false assumptions regarding housing price appreciation and low
default correlation among geographic regions. These views were widely held, so it is not obvious
that the rating agencies’ business model can blamed as the main cause of the failure of financial
institutions to properly gauge the risk of MBS. And, it also not clear that firms and regulators
would not have come to similar conclusions had they been doing their own in-house assessments
of credit risk, especially if they held the same views on the fundamental strength of the U.S.
housing market.
4. Excessive Faith in the U.S. Federal Reserve System
On the monetary side, the most notable feature was the close connection in timing between
the movements in economic activity and the explicit policy measures taken by the Federal
Reserve System. …The close synchronism produced much confidence within and without
the System that the new monetary machinery offered a delicate yet effective means of
smoothing economic fluctuations, and that its operators knew how to use it toward that
end.

© Society of Actuaries
28
This passage is taken from Friedman and Schwartz (1963), a classic text which describes the
1920’s boom laying the groundwork for the Great Contraction of 1929-1933.
14
It is not much of a leap to adapt this passage to the two decades leading up to the Panic of 2007.
The notion of the “Greenspan Put” – i.e., that any major financial market disruption would be
mitigated by aggressive Federal Reserve action – was widely held by financial market
participants. The examples of apparently successful interventions following the 1987 stock
market crash, the 1998 financial crisis, and the 2001 terrorist attacks served to buttress
Greenspan’s status as an economic deity, as well as confidence that the operators of the Federal
Reserve System knew how to deploy monetary policy to eliminate severe fluctuations.
It seems likely that this misplaced confidence led market participants to take on excessive
leverage and maintain overly optimistic assumptions regarding the possibility of severe financial
market disruption. Note that this is not an indictment of the regulators themselves. It is an
observation that there were limits on their powers and abilities to stabilize the financial system
that do not seem to have been appreciated at the time.
5. Subsidization of Home Ownership and Housing Investment
Over the long-term, government policy has served to stimulate the housing market through the
subsidization of home loans and other means. A number of policies have served to stimulate
home ownership---including the implicit government guarantees granted to Fannie Mae and
Freddie Mac and the tax-deductibility of mortgage interest. Obviously, these and other policies
have provided households with powerful financial incentives to borrow to invest in the housing
market.
Over the past decade, the seemingly endless ascent of home prices and low borrowing costs
served to reinforce the attractiveness of home purchase. In particular, borrowing costs remained
at very low levels during the 2000’s, partly as a result of Federal Reserve interest rate policy in
the wake of the 2001-2002 recession, where the Federal Funds Rate target was held at a low
level for a sustained period. In a recent paper,
15
John Taylor argues that that the Fed’s decision
to deviate from the Taylor Rule (a well-known indicator of the appropriate level for short term
interest rates) for such a long period represented a “monetary excess” that fueled the housing
boom.
14
Friedman and Schwartz (1963), p. 296.
15
“The Financial Crisis and the Policy Responses: An Empirical Analysis of What Went Wrong,” working paper,
November 2008.

© Society of Actuaries
29
III. Effects of the Financial Crisis on the U.S. Insurance Industry
The modern U.S. life insurance industry has always been vulnerable to a real estate crisis.
Mortgages have comprised a significant portion of the industry’s portfolio for many years, so it
would hardly seem surprising if the industry were to suffer significant losses in the current
downturn. In fact, given the prominence of mortgage-related assets in the industry’s portfolio,
one might well wonder why the industry has not suffered more.
The industry’s investment in assets related to residential mortgages has declined steadily since
the mid-1960s and most residential exposure lies in the form of agency-backed securities (which
do not subject the holder to credit risk). The industry has more significant exposure to
commercial mortgages and corporate debt, so the subsequent deterioration in these asset classes
may have a greater effect on their balance sheets than did the initial wave of losses on nonprime
residential MBS. That said, it is worth noting that, despite the real estate boom, the industry’s
exposure to mortgages is actually fairly low relative to historic norms. At the aggregate level, we
find little evidence that the industry “chased” the real estate bubble.
Of course, there are exceptions. Some groups invested heavily in private-label MBS and ABS
and we explore what distinguished those with significant exposure from those without. We find
some mixed evidence connecting other risk-taking or yield-chasing activities with investment in
securitized products. Specifically, those groups with GMXB exposure and with securities
lending programs tended to have greater investment in structured credit, although some of that
can be explained by the general tendency of larger firms to be involved in all of those areas.
We also find some confirming evidence of the incentives to invest in structured credit that were
embedded in the regulatory and rating agency approaches to RBC. RBC models were tied to
credit ratings – in particular, the NAIC’s model-based capital charges using the six rating classes
assigned by the Securities Valuation Office (SVO). Assignments to these rating classes were
effectively based on ratings assigned by Nationally Recognized Statistical Rating Organizations
(NRSROs) after a policy change in 2004 changed the requirement that the SVO rate all
securities. In any case, the rating system employed by the NAIC, with only six rating categories,
is substantially less refined than the rating systems used by NRSROs, as well as the marketplace,
so this opened the possibility of risk-based capital arbitrage opportunities. Specifically, a
company interested in chasing yield would be able to do so by selecting the highest-yielding
securities within a given NAIC rating class without affecting its regulatory capital ratios.
Structured credit securities fit such a strategy well, as they tended to have higher yields than
similarly rated corporate bonds.
16
And, not surprisingly, life insurers investing in private-label
structured credit tended to enjoy better investment yields on their bond portfolios than could be
explained by NAIC ratings alone.
16
See Ashcraft and Schuermann (2008) for an extreme example of an asset manager who pursued a similar strategy
in the course of managing a pension fund’s fixed income portfolio.
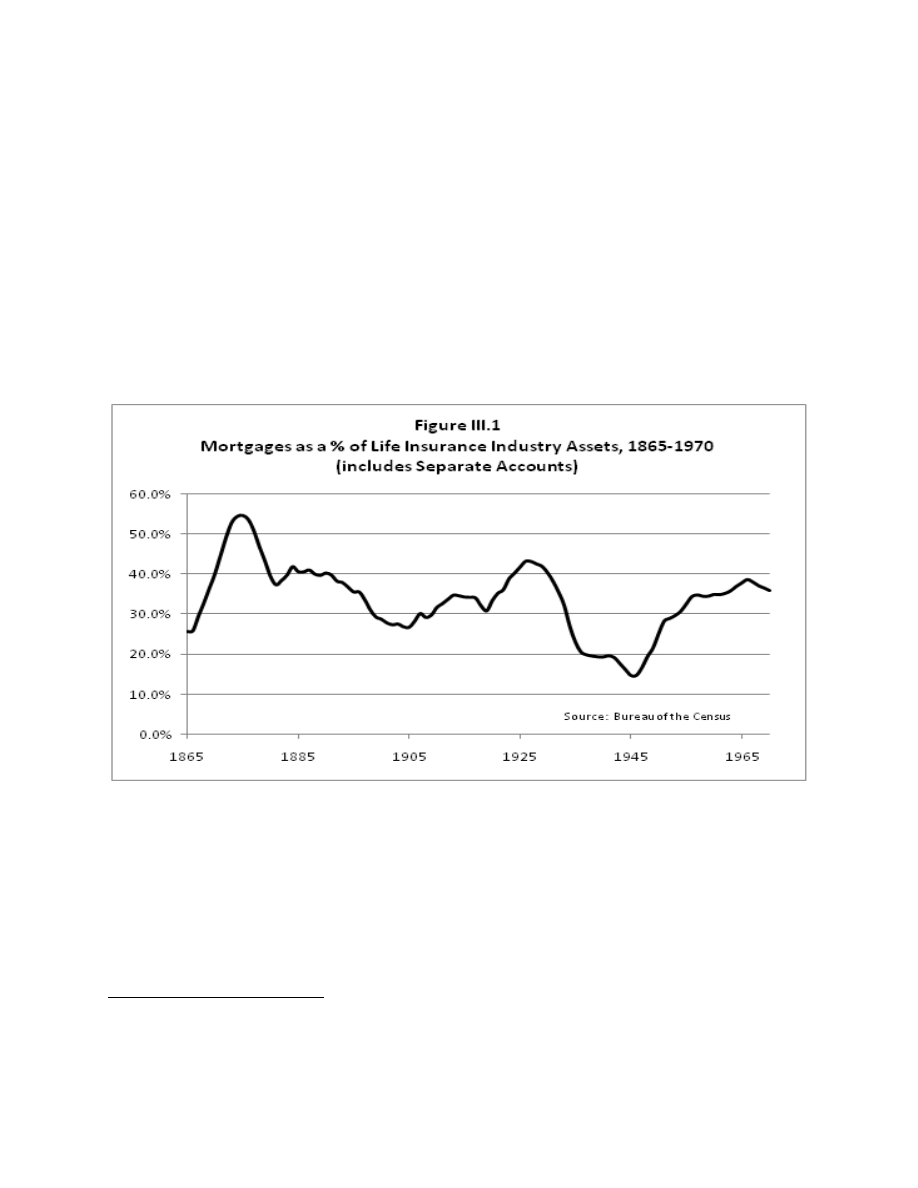
© Society of Actuaries
30
The consequences of the crisis for the industry are difficult to discern at this point. As noted
above, the industry had relatively small direct exposure to subprime residential risks, but a
broader fallout in other asset classes is having adverse effects on insurers.
A. Overview of Life Insurance Industry Asset Allocation and Asset Quality
The U.S. life insurance industry has historically had significant exposure to mortgages. Figure
III.1 shows the industry’s allocation to mortgages from a time near the industry’s birth (1865) to
the dawn of agency securitization in 1970.
17
Prior to 1970, it was not unusual for the industry to
have 30 percent or more of its assets allocated to mortgages. The most significant exception to
this characterization is the period marking the aftermath of the Great Depression. Mortgages did
not recover their previous level in the industry’s portfolio until the 1950’s.
It becomes more difficult to track and interpret the industry allocation to mortgages in the 1970’s
and 1980’s because of the rise of securitization, as well as the rise of separate account assets.
That said, it appears that the industry’s allocation declined over these decades. Figure III.2 shows
the allocation to mortgages and agency-backed MBS from 1945 to 1982, with the latter year
marking the eve of private-label securitization (the first CMO was issued in 1983). This figure
shows the gradual transition from holding individual mortgages to holding mortgages in
securitized form, as well as suggesting a decline in the overall allocation to mortgage-related
17
The birth of the industry is often marked as the 1840’s, when the major mutual companies were formed in the
Northeast, although life insurance clearly existed before that time. For example, the Presbyterian Ministers Fund
was formed in the 18
th
century.
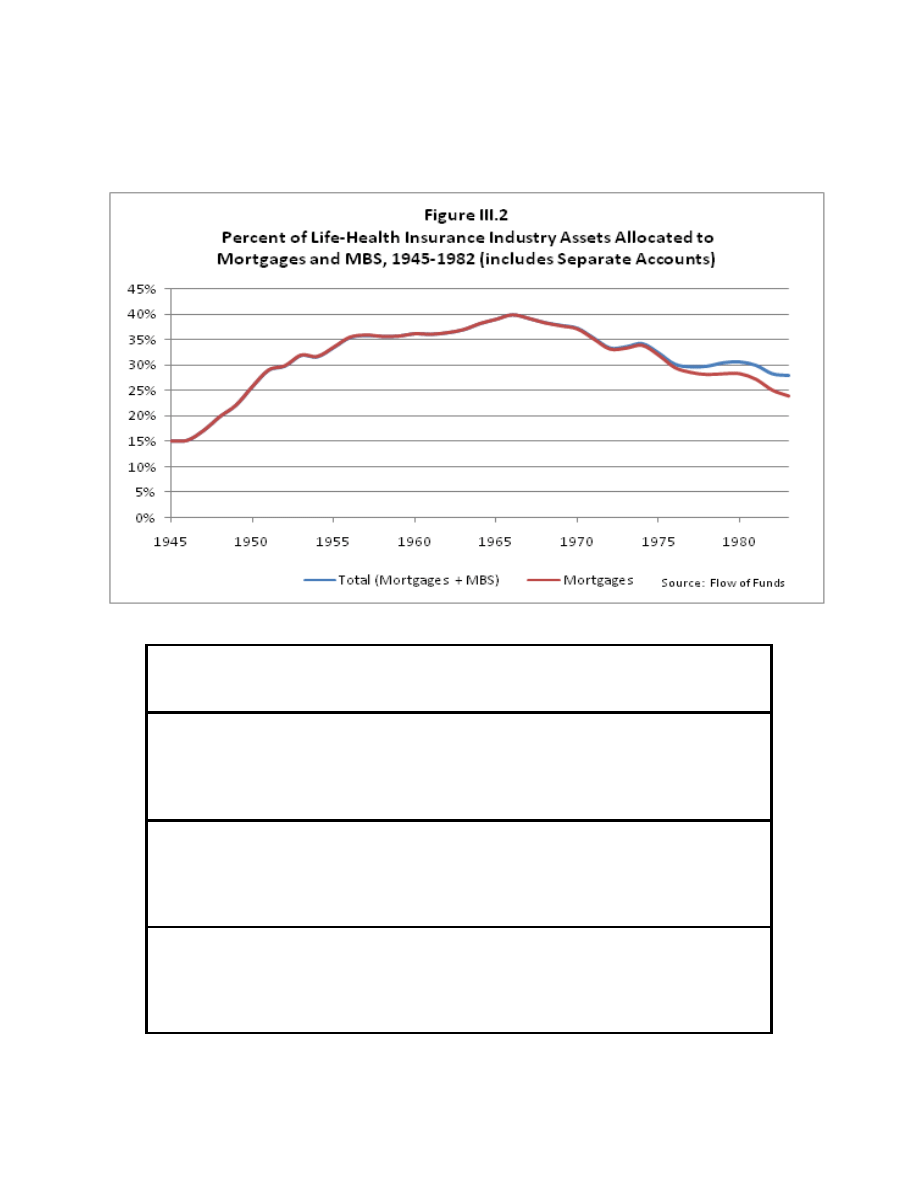
© Society of Actuaries
31
assets. As we enter the 1990’s, statutory reporting starts to capture more detailed information on
structured credit, as shown in Table III.1.
U.S. Life Industry Allocation to Mortgages and Structured Credit
Year
Mortgages
MBS & ABS
MBS & Mtg
Mtg, MBS, & ABS
1993
14.5%
20.3%
N/A
34.7%
1994
13.2%
20.1%
N/A
33.4%
1995
12.3%
20.3%
N/A
32.6%
1996
12.0%
21.3%
N/A
33.3%
1997
11.3%
21.5%
N/A
32.7%
1998
11.2%
20.5%
N/A
31.7%
1999
11.5%
20.2%
N/A
31.7%
2000
11.4%
19.6%
N/A
31.0%
2001
10.4%
19.3%
25.1%
29.7%
2002
9.7%
19.6%
25.2%
29.3%
2003
9.3%
19.2%
24.2%
28.4%
2004
9.1%
19.4%
23.4%
28.5%
2005
9.1%
20.7%
24.9%
29.9%
2006
9.4%
20.8%
25.2%
30.2%
2007
9.8%
20.9%
26.3%
30.7%
Table III.1
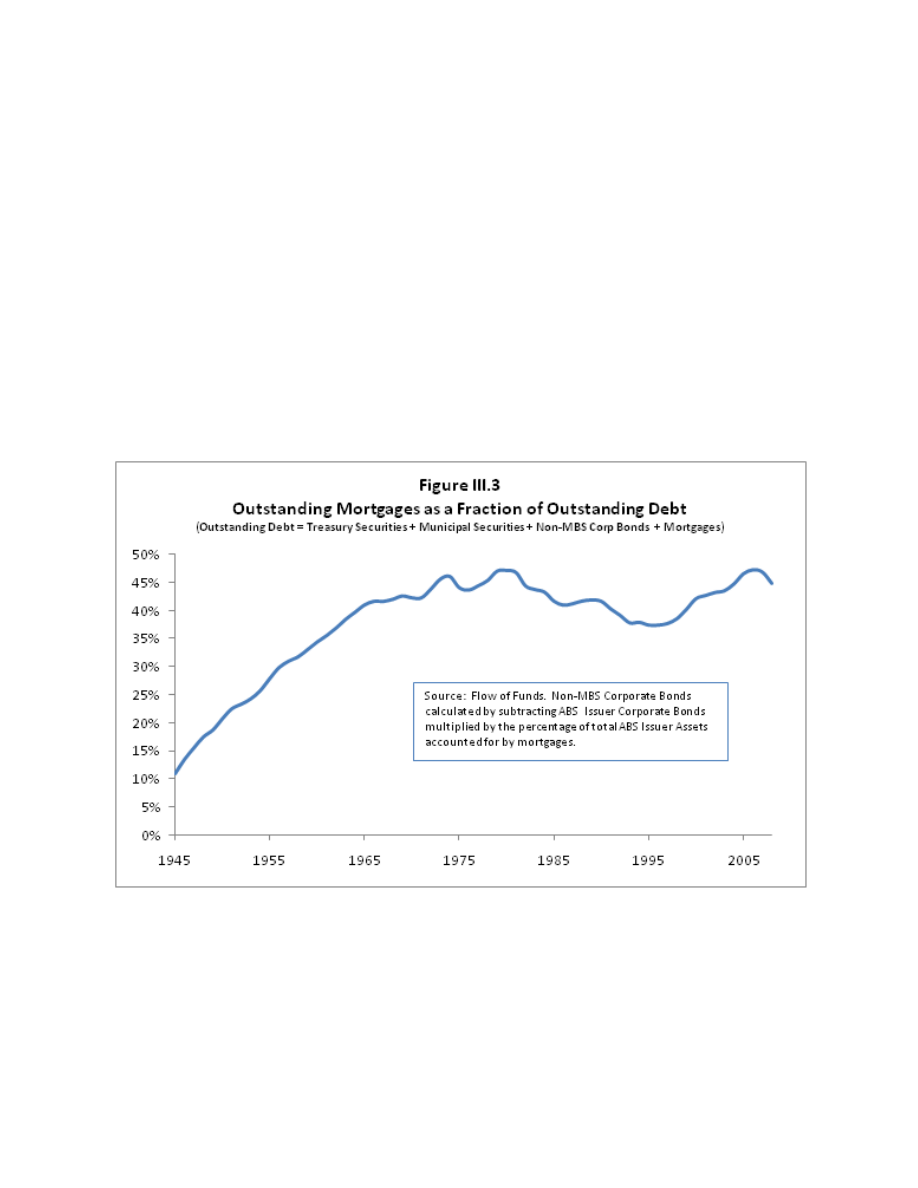
© Society of Actuaries
32
Piecing this information together is not straightforward, but it appears that the industry exposure
to mortgages on the eve of the Panic of 2007 was not high by historical standards. Indeed, the
allocation was in the neighborhood of 25-30 percent (note that we cannot determine the contents
of ABS, which could conceivably contain tranches of MBS), which is relatively low. Moreover,
about 9 percent of assets in 2007 were allocated either to agency-backed MBS or private-label
securitizations of agency-backed MBS, suggesting that the portion of the industry portfolio
exposed to mortgage default risk was in the neighborhood of 16 to 21 percent. The industry’s
exposure thus seems tame in relation to historical norms.
One’s first guess might have been that the industry’s exposure would have increased, or at least
stayed constant, during the age of securitization. Figure III.3 shows that, as a fraction of
outstanding debt, mortgages increased during the 1970’s and, in 2006 on the eve of the Panic of
2007, stood at its high point of the postwar period. As we saw earlier, the life industry’s
investment allocation toward mortgages initially rose after World War II, matching the increase
in the relative supply of mortgages.
However, this trend seems to have been arrested in the 1960’s, when the industry’s allocation
peaked despite the ongoing rise in the supply of mortgages and the rise of securitization in the
1970’s, which offered the promise of more liquidity in mortgage investment. It is an open
question as to why this happened. It is possible that a greater premium was placed on liquid
investments after the experience with contract surrenders during the 1970’s as interest rates rose.
The industry may also have reacted to the expansion of financial product offerings in the 1990’s,

© Society of Actuaries
33
with securitized loans (other than mortgages) replacing mortgage exposure with other types of
loan exposure. More research is needed to dissect the causes.
In summary, the form in which the industry holds mortgages has shifted to the securitized form
over the past 40 years, with MBS now accounting for more than half of the industry’s exposure.
However, the overall exposure to mortgage-related assets has not increased. If anything, it seems
to have fallen. Over the past 15 years, the main change in the industry’s overall allocation across
broad asset classes appears to be explained by the transition from holding individual mortgages
to holding mortgages in securitized form. Table III.2 shows the increasing allocation to fixed
income securities (which include structured credit).
U.S Life Insurance Industry General Account Invested Assets Composition
Year
Fixed Income
Stock
Mortgages
Real Estate
Cash
Other
1993
67%
5%
15%
3%
3%
7%
1994
68%
5%
14%
3%
3%
8%
1995
69%
5%
13%
2%
3%
8%
1996
71%
4%
12%
2%
3%
8%
1997
71%
5%
11%
2%
3%
8%
1998
71%
5%
11%
1%
3%
8%
1999
70%
5%
12%
1%
3%
8%
2000
70%
5%
12%
1%
3%
9%
2001
71%
5%
11%
1%
3%
9%
2002
72%
4%
10%
1%
4%
8%
2003
74%
5%
10%
1%
3%
8%
2004
74%
5%
10%
1%
3%
8%
2005
75%
4%
10%
1%
2%
8%
2006
73%
5%
10%
1%
3%
9%
2007
72%
5%
10%
1%
3%
10%
Table III.2
B. Trends in Asset Quality
Secular trends in the quality of the mortgage assets are more difficult to discern. In at least one
sense, the industry’s mortgage portfolio is safer than it was 40 years ago. We know that agency-
backed MBS (and securities built from agency-backed MBS) make up as much as 1/3 of the
industry portfolio. However, given the scale of the financial crisis, losses on unguaranteed
mortgages and mortgage-backed securities may be substantial.
Over more recent years, the trends in general asset quality are not encouraging. As shown in
Table III.2 above, the industry portfolio is still largely comprised of debt instruments, with the
majority now being fixed income securities, so the main task when assessing the quality of the
industry’s investments lies in assessing the fixed income portfolio.

© Society of Actuaries
34
At first glance, credit quality within the fixed income portfolio was fairly high in 2007 and
seemed in line with historical norms for a loose point of the credit cycle. In particular, the
average NAIC class rating of the industry portfolio in 2007 was comparable to the levels seen ten
years earlier in the mid-1990s during a similarly tranquil period with respect to credit risk.
On closer inspection, however, there has been a striking decrease in the allocation to the safest
assets – obligations of the U.S. federal government and of the GSEs – over the past 15 years (see
Tables III.3 and III.4).
Thus, while the credit quality as measured by the NAIC rating system has been maintained over
the period since the inception of the risk-based capital regulations, there appears to have been
significant deterioration in credit quality at the safe end of the spectrum. Risk-free government
obligations have been swapped for highly rated but vulnerable privately-issued obligations. This
deterioration may betray further erosion of credit quality within the NAIC rating classes, as we
explore further below.
U.S. Life Industry Fixed Income Portfolio Distribution by Rating Class
Year
1
2
3
4
5
6
Average
1990
66.9%
21.6%
4.6%
4.7%
1.8%
0.5%
1.55
1991
71.1%
21.2%
3.4%
2.6%
1.0%
0.7%
1.43
1992
71.8%
21.7%
3.0%
2.2%
0.8%
0.6%
1.41
1993
71.6%
23.1%
3.0%
1.6%
0.5%
0.3%
1.38
1994
71.9%
22.7%
3.2%
1.6%
0.3%
0.2%
1.36
1995
72.2%
22.7%
3.2%
1.7%
0.2%
0.1%
1.36
1996
71.9%
22.8%
3.2%
1.8%
0.2%
0.1%
1.36
1997
69.2%
24.7%
3.7%
2.2%
0.2%
0.1%
1.40
1998
66.2%
26.9%
4.3%
2.2%
0.4%
0.1%
1.44
1999
64.6%
28.1%
4.2%
2.7%
0.4%
0.1%
1.47
2000
64.3%
28.3%
4.0%
2.7%
0.6%
0.2%
1.48
2001
61.6%
30.8%
4.4%
2.1%
0.7%
0.3%
1.50
2002
63.0%
28.6%
4.9%
2.1%
1.0%
0.4%
1.51
2003
63.0%
29.6%
4.1%
2.3%
0.7%
0.3%
1.49
2004
65.5%
28.5%
3.5%
1.9%
0.5%
0.2%
1.44
2005
68.1%
26.1%
3.5%
1.8%
0.4%
0.2%
1.41
2006
69.4%
25.0%
3.3%
1.9%
0.4%
0.1%
1.39
2007
69.2%
25.1%
3.4%
1.7%
0.6%
0.1%
1.40
Table III.3
NAIC Rating Class

© Society of Actuaries
35
Life Industry Allocation to Risk Free Credits
Year
GSE
U.S. Gov't
1)
Total
1993
13%
15%
28%
1994
13%
14%
28%
1995
13%
13%
26%
1996
13%
11%
24%
1997
12%
9%
21%
1998
12%
7%
19%
1999
11%
6%
17%
2000
10%
6%
16%
2001
11%
5%
16%
2002
12%
7%
19%
2003
11%
6%
18%
2004
11%
7%
18%
2005
11%
7%
18%
2006
11%
7%
18%
2007
10%
6%
16%
1) Include GNMA MBS
Table III.4
C. Investment at the Group Level
While we have argued above that the industry’s exposure to mortgage risk was not inordinately
large by historical metrics, significant losses loom on structured securities and individual
mortgages, with some companies more exposed than others. Fitch projects industry losses of
$6.5 billion on residential MBS in total, and the impacts by group range from 0 percent to over 1
percent of invested assets.
Why were private-label MBS and ABS attractive? The obvious answer would appear to be that
private-label structured credit offers higher yields than similarly rated corporate debt. As a result,
companies opting to invest in structured credit could get higher yields without suffering in terms
of risk-based capital ratios or rating agency scrutiny. To affirm this, we use 2007 NAIC statutory
data to explore the relationship between a company’s investment policy and its realized yield on
bonds (including structured credit). All analysis is performed at the group level.
The yield benefits of structured credit are borne out in Table III.5, which reports simple
regressions of the gross investment yield from company bond portfolios on: 1) the composition
of the portfolio in terms of bond ratings and 2) the percentage allocation to structured credit. For
purposes of establishing robustness, we present three specifications corresponding to three
different (and progressively more refined) quality decompositions of the bond portfolio. In
specification (1), we include only the percentage of each company's bond portfolio allocated to
NAIC Classes 1 and 2, along with the percentage allocation to structured credit, as explanatory
variables. To those variables, we add the percentage allocation to Class 3 as an explanatory
variable in Specification (2), and the percentage allocation to Class 4 as an additional
explanatory variable in Specification (3). The conclusion is clear: Companies with higher
allocations toward structured credit enjoyed higher yields, even after controlling for the quality
distribution in the bond portfolio.

© Society of Actuaries
36
TABLE III.5 - Yield Benefits of the Structured Credit Securities
Dependent Variable-Gross investment yield
Regression Coefficients
Sample
Explanatory Variables
Spec 1
Spec 2
Spec 3
Averages
% of bond portfolio in NAIC Class 1
-0.003
0.03
0.038
86.30%
Standard deviation
0.008
0.012
0.012
% of bond portfolio in NAIC Class 2
0.023
0.053
0.056
10.70%
Standard deviation
0.01
0.013
0.013
% of bond portfolio in NAIC Class 3
N/A
0.07
0.058
1.70%
Standard deviation
N/A
0.019
0.019
% of bond portfolio in NAIC Class 4
N/A
N/A
0.185
0.60%
Standard deviation
N/A
N/A
-0.059
% of bond portfolio in private-label MBS/ABS
0.011
0.011
0.011
6.50%
Standard deviation
0.006
0.006
0.006
Constant
0.053
0.021
0.013
Standard deviation
0.007
0.012
0.012
Observations (Insurance Groups)
480
480
480
R-squared
6.70%
9.20%
11.10%
Use 2007 NAIC statutory data. Bold type indicates statistical significance at 90% or higher.
The average across all groups for the portion of the bond portfolio allocated to the private-label
structured credit was about 6.5 percent, but ranged over 80 percent for some groups. What
distinguished those groups that invested heavily in structured credit from those that did less so?
To answer this question, we explore the relationship between the bond portfolio allocation to
private-label structured credit and other types of risky activities at the group level using again the
2007 NAIC statutory data. In particular, we identify four indicator variables of “other risky
activities” – or, more precisely, those reflective of risk-taking or yield-chasing activities: 1) a
dummy variable indicating whether the group was engaged in securities lending (i.e. loaning
securities to others)
18
; 2) a dummy indicating those groups with more than 50 percent of reserves
in business lines where the company is likely to capture the full benefits of extra investment
yield;
19
3) a dummy variable indicating whether the group is ultimately controlled by
stockholders; 4) a dummy variable indicating whether the group has any reserves relating to
GMXB guarantees.
Table III.6 below shows the extent of groups’ investing in private label structured credit that can
be explained statistically by these four risk-taking activities. We again refine our investigation
18
See (Loomis, 2008) for an account of AIG’s deep involvement in securities lending using mainly RMBS. With the
program size reaching $90 billion in the third quarter of 2007, the increased RMBS exposure had worsened the
illiquidity of AIG’s asset portfolio and hastened its demise when the credit market froze.
19
Examples of such business include non-par life insurance, annuities in the payout phase and reserves not
specifically allocated to policyholder accounts (e.g. GMXB reserves).

© Society of Actuaries
37
progressively in three specifications. In Specification (1), we use the four categorical variables
described above, while in Specifications (2) and (3) we add controls for group size (as measured
by assets). In general, the results suggest that a securities-lending program, as well as
involvement with GMXB’s, tends to be associated with heavier investment in private label
structured credit. However, at least some of this phenomenon can be explained by the group size
as larger groups tend to be involved in all of these areas. Similar results are obtained when using
Fitch’s estimates of MBS losses (as a percentage of invested assets) as a dependent variable.
TABLE III.6 - Characteristics of Companies Investing in Non-Agency RMBS
Dependent Variable-Portfolio allocation to non-agency RMBS
Regression Coefficients
Sample
Explanatory Variables
Spec 1 Spec 2 Spec 3 Averages
Securities Lending Program Dummy
0.064
0.031
0.043
0.133
Standard deviation
0.014
0.015
0.015
Spread Business Dummy
0.004
0.004
0.003
55.30%
Standard deviation
0.009
0.008
0.009
Organizational Form Dummy
-0.01
-0.002
-0.003
11.60%
Standard deviation
0.014
0.013
0.013
GMXB Reserve Dummy
0.051
0.006
0.029
14.10%
Standard deviation
0.014
0.015
0.015
Log of General Account Assets
N/A
0.011
N/A
18.5
Standard deviation
N/A
0.002
N/A
Group in Bottom Quartile (w.r.t. Gen Acct Assets)
N/A
N/A
-0.046
25.00%
Standard deviation
N/A
N/A
0.01
Group in Top Quartile (w.r.t. Gen Acct Assets)
N/A
N/A
0.027
25.00%
Standard deviation
N/A
N/A
0.013
Constant
0.047
-0.152
0.058
Standard deviation
0.007
0.034
0.008
Observations (Insurance Groups)
510
510
510
R-squared
11.50% 17.50% 16.60%
Use 2007 NAIC statutory data. Bold type indicates statistical significance at 90% or higher.
D. Industry Impact
While direct subprime exposure was not significant for most life insurers, the ensuing financial
storm wrought devastation across many assets, including those widely held by the industry.
As can be seen from Table III.7, the emphasis placed by risk managers and regulators on credit
ratings was flawed but not entirely misplaced. One the one hand, safer assets certainly
outperformed risky ones as evidenced, for example, by the differential performance of
investment grade bonds as opposed to junk bonds. On the other hand, credit ratings failed to

© Society of Actuaries
38
measure the risk in structured credit securities, as well the problems that ultimately materialized
with respect to their liquidity.
Table III.7
Life and P&C Insurers 2007 Allocation and 2008 Total Return
2007 Allocation 2008 Total Return
Life
P&C
Index
Index used
Inv. Grade Corp Bond
41.0%
13.9%
-11.9%
Barclays US Investment Grade Corporate Index
High Yield Corp Bond
4.6%
1.7%
-45.3%
Barclays US High Yield Corporate Index
ABS
4.3%
1.7%
-10.2%
US Aggregate ABS Index
CMBS
6.7%
2.3%
-38.1%
CMBS Index
Mortgage Loans
12.6%
0.3%
-36.9%
CMBS: Whole Loan Index
Equities
1.3%
17.8%
-48.6%
S&P500 Index
Source: Barclays Capital: "Impact of the financial crisis on the insurance industry"
The carnage across asset classes has led to significant write-downs already (as shown in Figures
III.4 - III.6), and more loom on the horizon as defaults on mortgages, structured credit securities,
and corporate bonds materialize. The defaults will have the most significant impact with respect
to assets that have not already been marked to market, and this will presumably lead to more
balance sheet stress.
Stock prices of many major publicly traded insurance groups have been decimated. Investment
losses, as well as losses related to GMXB benefits, have contributed to the selloff in the life
insurance sector. Losses on credit default swaps have led to impairments of the monoline
insurers, as well as AIG and some international reinsurance companies.
It is difficult at this point to assess how bad the damages will ultimately be. However, it is worth
noting that the insurance industry generally has fared relatively well in comparison with the
banking sector. This experience echoes that of the Great Depression, when the life insurance
industry – despite problems with commercial and farm mortgages that caused insolvencies –
emerged unscathed in comparison with the banking industry.

© Society of Actuaries
39
Figure III.5 A Snapshot of U.S. Insurers Asset Holdings. Source: Barclay Capital
0%
5%
10%
15%
20%
25%
30%
35%
40%
45%
IG Bond
HY Bond
ABS
CMBS
Mortgage
Loans
Equities
Life & Health Insurers versus P&C Insurers
Year End 2007 Asset Allocation
Life & Health
P&C

© Society of Actuaries
40
Figure III.6 An Estimate of U.S. Insurers (Realized and Unrealized) Losses.
Source: Barclay Capital
0
20,000
40,000
60,000
80,000
100,000
120,000
Total
Equities
CMBS
ABS
HY
IG
Estimated Realized and Unrealized Losses
for L&H Insurers ($mm)
Barclays Capital Index as of Nov 2008
Realized & Unrealized Losses
as % of Total Adjusted
Capitals: 95%
Figure III.7 An Estimate of U.S. Insurers (Realized and Unrealized) Losses for P&C
Insurers. Source: Barclay Capital
0
10,000
20,000
30,000
40,000
50,000
60,000
70,000
Total
Equities
CMBS
ABS
HY
IG
Estimated Realized and Unrealized Losses
for P&C Insurers ($mm)
Barclays Capital Indices as of Nov 2008
Realized & Unrealized Losses
as % of Total Adjusted
Capitals: 44%

© Society of Actuaries
41
E. Conclusions
Evolving thinking on asset risk, including the development of risk-based capital models using
credit ratings as inputs, may have influenced the industry to put a premium on assets with high
credit ratings over the past two decades. This has produced at least two important trends. First, it
has reinforced the trend since 1970 of transitioning from holding individual mortgages to holding
mortgages in securitized form. Second, the blessing granted to highly rated private debt under the
RBC models may have encouraged insurers to substitute the same for U.S. government
obligations.
It is difficult at this point to ascertain the impact of the first trend on industry losses during the
financial crisis. The industry has always had significant mortgage exposure and has thus been
vulnerable to a real estate crisis, as evidenced, for example, by its mortgage problems during the
Great Depression. The transition to holding MBS rather than individual mortgages may have
changed the form of holdings rather than the ultimate risks, making the question of mortgage
quality the key one. On this point, it is worth noting that subprime losses have been limited to
date, but larger losses may loom in the industry’s CMBS portfolio.
The impact of the second trend is easier to assess. The substitution away from agency-backed
MBS and government obligations toward highly-rated private debt (either of the structured or
non-structured varieties) clearly and unambiguously did not work out well for the industry
during 2008.
There are at least two dimensions to this outcome that merit analysis and careful thought as we
move forward. First, credit ratings were shown to be a flawed metric of credit risk in some
circumstances, especially for structured credit securities. Second, even if it is possible to improve
credit risk metrics, the acceptable or optimal level of asset risk in the industry portfolio remains
an open question. In this episode, even highly-rated corporate bonds were not good substitutes
for Treasury debt. As shown in Table III.7, investment grade corporate bonds experienced a loss
of nearly 12 percent during 2008, while Treasuries turned in a strong performance.
The current regulatory approach to asset risk measurement was designed, in part, to restrain
insurer investment in the riskiest securities. By some measures, it succeeded. The industry
continues to have limited appetite for equity securities and high yield bonds. However, it
accommodated other forms of risk-taking by devaluing the extra security in government debt and
relying on third-party credit assessment of structured credit securities that ultimately proved to
be unreliable.

© Society of Actuaries
42
IV. MBS Analytics, Their Uses and Limitations
A. Introduction – Fixed Income Analytics
Duration and its offshoots (key rate or partial duration, spread duration, convexity, Vega
duration) are among the most commonly used fixed income analytics for measuring price
sensitivity to the underlying price drivers. Their uses, extending from traditional bonds with
fixed cash flows to derivative and structured instruments with path-dependent or uncertain cash
flows, cover wide-ranging applications such as hedging, relative value or risk return analysis,
efficient frontier construction, performance attribution, and asset liability management.
However, for instruments with path-dependent or uncertain cash flows such as MBS (mortgage
backed securities), the utility of these individual risk analytics is constrained by the uncertain
nature of cash flows but is enhanced when analytics are used jointly. At the very least, an
understanding of these constraints could help to avoid the misinterpretation or misuse of analysis
methods.
In this chapter, we explain these subtleties. Our main focus is not to revisit in depth the basics of
these analytics but to highlight the assumptions and limitations of effective duration and some of
the complementary analytics, in order to emphasize the need to use them jointly in order to
obtain a more accurate estimate of price change and to caution against over-interpreting effective
duration for subprime RMBS in the current environment. Some work in this chapter is based on
(Hayre, 2004) and (Hayre, 2008).
In the remainder of this chapter we cover the following four topics: 1) Description of Effective
Duration; 2) Pitfalls of Effective Duration and Complements of Other Analytics; 3) Mortgage
Prepayment Models; and 4) Mortgage Default Models.
B. Description of Effective Duration
Duration, tracing its roots to Macaulay duration, has evolved from addressing simple bonds with
fixed cash flow to dealing with more complicated instruments with uncertain cash flows.
Effective duration is used for handling securities with uncertain cash flows, including MBS. One
key feature in calculating effective duration cash flows of a security are re-projected after interest
rate shocks. For non-callable bonds, cash flows (coupons and principal payments) are not
expected to change with changes in interest rates. But for callable bonds and MBS, cash flows
are sensitive to changes in interest rates. For MBS, a rise (decline) in interest rates tends to slow
down (speed up) refinancing and curtailment from underlying collateral, hence decreasing
(increasing) the expected cash flows from the pool.
Effective duration is designed to reflect this peculiarity. It is calculated as the price change from
up/down shocks of interest rate. For example, for an asset with an effective duration of 5, the
price will decrease (rise) by 5 percent for every 100 basis points parallel up (down) shift of the
yield curve. Effective duration depends on the choice of the base yield curve. The swap curve
(also known as LIBOR curve) and the Treasury curve are two common yield curves, leading to

© Society of Actuaries
43
different effective durations for the same security depending on the choice of the base yield
curve (usually higher duration for the Treasury curve, all else being equal). In practice, OAS
(option adjusted spread), first calculated from the current price and the current yield curve, is
kept constant with respect to interest rate shocks and the unchanged OAS is then used in
conjunction with the shocked interest rates to discount the re-projected cash flows to reprice the
security.
Although effective duration is an improvement from Macaulay duration and modified duration in
terms of reflecting the interest sensitivity of cash flows and capturing most of the price
movement from interest rate changes, it suffers from some practical pitfalls and also several
theoretical pitfalls that are common to all measures of duration. We describe below what they are
and discuss how to address them.
C. Pitfalls of Effective Duration and the Usefulness of Other Analytics
1. Parallel Shift of Yield Curve
Effective duration assumes a parallel shift of the yield curve, which is often not the way how the
yield curve moves in the real world. This pitfall may be overcome to some extent by key rate
duration (KRD), where price sensitivity is measured for each of the six or more key rates (more
key rates result in better precision but increase complexity) and the price change is estimated
through the cross-product of the KRDs and the expected change in key rates.
2. Interest Rate Sensitivity of Duration – Convexity
Effective duration is a useful local approximation when used to describe or estimate price
changes in response to small interest rate changes, but the approximation is less effective for
larger changes. Estimating price changes using effective duration or KRD essentially assumes
that duration itself is constant with respect to changes in interest rates. But duration is in fact
sensitive to interest rates, a phenomenon known as convexity. Convexity is more pronounced for
MBS and callable bonds. As the interest rate decreases (increases), refinancing of the underlying
loans in an MBS pool speeds up (slows down) and cash flows from the security contracts
(extend), thereby shortening (lengthening) the duration. Without a convexity adjustment,
estimates of price changes would be strictly proportional to duration. As duration is
overestimated (underestimated) in a decreasing (increasing) interest rate environment, the price
increase (decrease) is overestimated (underestimated) in proportion. A convexity adjustment
serves to bring down (up) this overestimate (underestimate). When adjusting price changes using
convexity, it is important to know the proper scaling factor as there is no universal standard on
how convexity is scaled.
3. Option Adjusted Spread (OAS) and Spread Duration
Effective duration ignores price sensitivity due to OAS. In the process of calculating effective
duration, OAS is initially calculated based on the original price and the base yield curve. For
MBS, OAS is the spread that averages the present value of cash flows out to the original price

© Society of Actuaries
44
across all pricing stochastic scenarios, which is a calculation-intensive process. OAS is
interpreted as the risk premium that the market requires for holding the MBS security. However,
after shocks are applied to the base yield curve, OAS is not recalculated due to calculation
intensity but instead is held constant.
Similar to price reactions to interest rates, MBS price moves in the opposite direction to OAS –
the price decreases (increases) as OAS widens (narrows), assuming all else constant. This price
sensitivity to OAS change is measured by spread duration.
4. Current Coupon Spread and Coupon Spread Duration
Effective duration ignores price sensitivity due to the current coupon spread. The current coupon
spread is the spread between the current coupon on a similar MBS pool and the base yield curve.
The MBS price moves in the same direction as the current coupon spread – the price decreases
(increases) as the current coupon narrows (widens) assuming all else constant. This is because as
the current coupon narrows (widens), refinancing tends to speed up (slow down), hurting
(helping) the MBS price. As a result, the coupon spread duration exhibits an opposite sign
(negative) to effective duration (positive).
5. Interest Rate Volatility and Vega Duration
Effective duration ignores price sensitivity to interest rate volatility. One way to see this is to
recall that equity options as valued by the Black-Scholes formula are sensitive to volatility, and
the option value increases with volatility, all else being equal. As with equity options, the price
of MBS, which has an embedded prepayment option, is sensitive to interest rate volatility and
this sensitivity is measured by Vega duration. In the case of MBS, the MBS holder sells a call
option to mortgagees in the pool. An increase (decrease) in volatility would increase (decrease)
the option value and decrease (increase) the MBS price. So Vega duration exhibits the same sign
as effective duration (positive).
6. Practical Pitfalls
Besides the above five pitfalls, most of which are due to the theoretical design of effective
duration, effective duration also faces some practical constraints.
a. System Constraints
Effective duration varies by the analytics system in which it is calculated. Embedded in any
mortgage analytics system is a mortgage prepayment model for projecting mortgage cash flows.
Differences among prepayment models lead to differences in effective duration. Users of
effective duration should be aware of the mechanics of the underlying prepayment model and the
details of its calibration.

© Society of Actuaries
45
b. Unreflective of Reality
Effective duration may fail to reflect the current reality. Even with a well-built prepayment
model based on rich historical data, duration may portray the price sensitivity of the security
inaccurately during a period without historical precedent (the current financial crisis being a
good example). For example, duration for non-agency subprime and Alt-A mortgage securities
might have been near zero in recent months, as market concern for these securities concentrated
on default risk. As a result, the prices of these securities showed little sensitivity to interest rate
movement. A mortgage analytics system failing to consider this factor would continue
calculating duration as usual. The user of effective duration should spot check effective durations
for some of the subprime and Alt-A securities, compare their interrelationship, and override with
zero when necessary.
D. Mortgage Prepayment Model
The prepayment rate measures mortgage principal prepaid or paid ahead of the payment schedule
as a percent of the outstanding principal balance. Two common prepayment measures are the
PSA (Public Security Administration) convention and the CPR (Constant Prepayment Rate).
PSA-based convention (100 percent PSA) assumes 0 percent prepayment at time 0 with a 0.2
percent monthly increment for the next 30 months, peaking at and remaining at 6 percent after
month 30. Other forms of PSA prepayment adjust the speed for this base convention using a
multiplier (multiplier >1 for faster speed or <1 for slower speed). The CPR is the annualized
SMM (single monthly mortality, the percent of beginning of the month principal prepaid during
the month) assuming the SMM stays constant for 12 months.
There exist a variety of prepayment models, including commercial models such as Andrew
Davidson and AFT models and proprietary models, offered with most fixed income analytics
systems. These systems often allow user inputs or dials on prepayment speeds on their
proprietary prepayment model or linking in a commercial model.
Building and maintaining prepayment models is not a trivial task. A prepayment model’s
complexity, combined with fast-changing underlying economic factors and even government
interventions, make the task of building, updating, and maintaining the model a resource-
intensive commitment beyond the reach of small fixed income investment firms. This is one of
the reasons why most end users choose to pay a fee, directly or indirectly, for using an existing
model rather than building one of their own.
Mortgage prepayment models can be developed around the following four building blocks:
refinancing, house turnover, default, and curtailment (partial prepayment). We briefly describe
the first three.
•
Mortgage refinancing is largely driven by the prevailing mortgage rate and refinancing
incentives as well as homeowner ability to refinance. Homeowner ability to refinance is
influenced by macroeconomic variables such as employment and home price appreciation
(HPA); mortgage characteristics such as seasoning, burnout (slowdown of prepayment after
refinancing of the most capable mortgagors), SATO (rate spread at origination with higher

© Society of Actuaries
46
SATO indicating lower ability to refinance), LTV (loan to value ratio) and loan size; as well
as the borrower’s FICO score. Refinancing activity is also impacted by the media (publicity
and advertisement of low rates).
•
House turnover is mostly driven by job change and home upgrades, which are both affected
by general economic conditions and employment situations. For home upgrades, HPA and
underlying mortgage characteristics such as interest rate lock-in, loan seasoning (aging), and
LTV are relevant. House turnover is also subject to seasonality (higher turnover in the
summer than in the winter) due to coordination with the start of the school year.
•
A defaulted mortgage could trigger a prepayment, depending on the trust agreement. For
agency issues, delinquent mortgages historically were purchased from the trust when the
mortgages were 120 days overdue, resulting in a full prepayment. But GSEs (government
sponsored entities) have altered this policy recently to conserve capital due to rising
delinquency. We discuss this further in the following subsection.
Building each of these prepayment blocks is a data-intensive exercise. The model, and hence the
data, need to vary by credit type (prime, Alt-A, or subprime), issuers (GNMA, FNMA, or
FREDDIE MAC pools), and the mortgage maturity (15 or 30 year collateral) to capture the
diverse characteristics of the collaterals. Occasional government incentives or changes of rules
can further complicate the development and maintenance effort.
E. Mortgage Default Model
The default or credit risk of mortgages was traditionally not a focal point for most MBS investors
because of the payment guarantees provided by the GSEs. It has gained more attention with the
growth of the non-agency mortgage securitization market and the recent turmoil in this market.
To MBS investors, the extent of the impact due to default differs for agency vs. non-agency
issues. For agency MBS, only the timing of the cash flow is affected by default, whereas for non-
agency MBS both the timing and the amount of cash flow are affected.
A mortgage default can be considered as a payoff or prepayment that involves a loss to the
lender. Before such a loss event occurs, the mortgage has to be processed through some well-
known stages starting with delinquency (a borrower being late on scheduled mortgage payment),
followed by foreclosure (the legal process through which the lender sells the house to recoup the
loan). Other outcomes that may occur in connection with foreclosure are a short sale (the
servicer agrees to take whatever the house can be sold for, even less than the loan amount) and
real estate owned (title transferred to the servicer). Thus, it is evident that the prepayment model
is also dependent on the default model: That is, the default model is considered a building block
of a prepayment model.
For a mortgage to become delinquent, it typically means that homeowner is unable to: (i) make
the monthly payment; and (ii) refinance or sell the home at a sufficient price to pay off the
mortgage balance. Triggers for (i) include payment shock, loss of job, illness or death of a family
member, indebtedness, or divorce, among others. Payment shock is prevalent for adjustable-rate

© Society of Actuaries
47
mortgages (ARMs) where the monthly payment rises sharply after the first 2 or 3 years of paying
a low fixed rate, or interest-only (IO) mortgages where the monthly payment rises sharply after
the initial “interest only” payment period. Both ARM and IO are popular forms for subprime
mortgages.
Event (ii) depends on the mortgage and mortgagor characteristics such as HPA, LTV, FICO,
documentation, and property type. The HPA is one of the most relevant factors in the current
environment. As the HPA turns negative, homeowner equity (house market price less loan
amount) quickly evaporates, making refinancing unlikely for an under-the-water house (house
worth less than the mortgage). For a borrower with a lower FICO score, no documentation, or a
non-owner occupied property, the chance for refinancing is further diminished.
V. Time Series Projections of Mortgage Losses
The housing sector was the macro-economic driver of the financial crisis and continues to be a
main driver for economic conditions. The future evolution of financial losses depends on the
speed and trajectory of the economic recovery, which in turn hinges on the recovery of the
housing sector.
At the end of 2008, Moody’s offered five scenarios for the future path of the OFHEO House
Price Index over the next 1-2 years. These five scenarios are shown in Figure V.1. In the baseline
scenario, Moody’s forecasts another 15 percent drop in house prices. This would force an
additional 6.9 million homeowners currently having positive equity to shift into negative equity
territory a development that may further challenge economic stability.
Fixing the housing market is thus a top economic priority. Dr. Martin Feldstein offered his
insights in a March 2008 Wall Street Journal opinion piece – “limiting the number of such
defaults, and preventing the overshooting of price declines, requires a public policy to reduce the
number of homeowners who will slide into negative equity. Since house prices still have further
to fall, this can only be done by a reduction in the value of mortgages.”
Detailed distributions of homeowner equity are provided in Figure V.2. Mark Fleming, Chief
Economist for First American CoreLogic, states that “the accelerating share of negative equity,
combined with deteriorating economic conditions, means that mortgage risk will continue to
increase until home prices and the economy begin to stabilize. The worrisome issue is not just
the severity of negative equity in the ‘sand’ states, but the geographic broadening of negative
equity that is expected to occur throughout the year.”
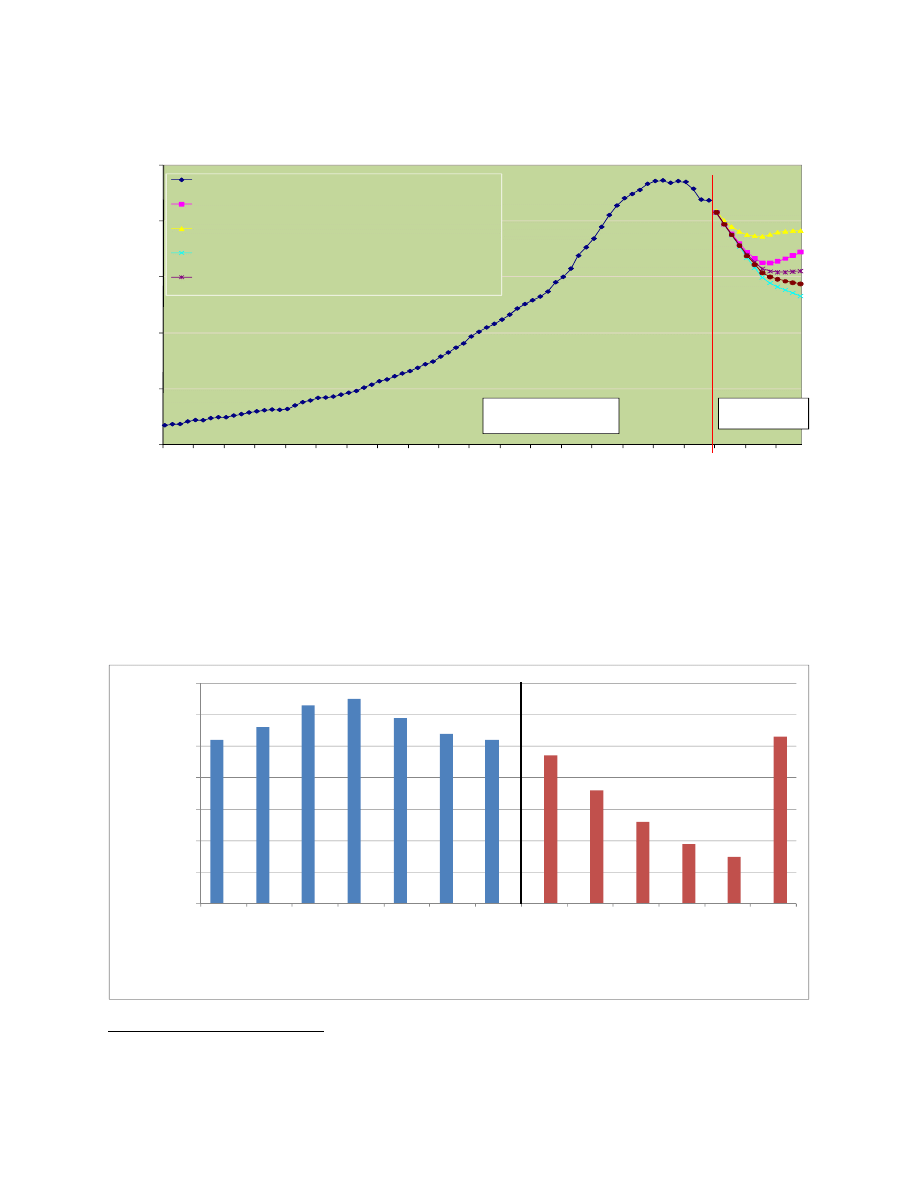
© Society of Actuaries
48
Figure V.1. Historical and Predicted OFHEO House Price Index
Source: Moody’s Economy.com
150
200
250
300
350
400
M
ar-9
1
M
ar-9
2
M
ar-9
3
M
ar-9
4
M
ar-9
5
M
ar-9
6
M
ar-9
7
M
ar-9
8
M
ar-9
9
M
ar-0
0
M
ar-0
1
M
ar-0
2
M
ar-0
3
M
ar-0
4
M
ar-0
5
M
ar-0
6
M
ar-0
7
M
ar-0
8
M
ar-0
9
M
ar-1
0
Ma
r-
11
Historical
Baseline Forecast
Housing Stabilizes, Earlier Recovery Scenario
Complete Collapse, Depression Scenario
Deeper Recession, Weaker Recovery Scenario
Historical data
Forecast
Figure V.2: Summary of December 2008 National Distribution of Homeowner Equity
20
Source: First American CoreLogic
0%
1%
2%
3%
4%
5%
6%
7%
30
%
t0
35
%
25%
to
30%
20%
to
25%
15%
to
20%
10%
to
15%
5%
to
10
%
0%
to
5%
‐0%
to
‐5%
‐5%
to
‐10
%
‐10%
to
‐15
%
‐15%
to
‐20
%
‐20%
to
‐25
%
Ove
r ‐
25
%
Pe
rc
en
t of
Hom
eow
ne
rs
Equity Distribution
Positive Equity
Negative Equity
20
In this figure, we only include part of home equity. Those with more than 35% positive equity are excluded.

© Society of Actuaries
49
Using residential mortgage data through the end of 2008, our time series data analysis shows that
home prices may continue to drop by about 15 percent in 2009-2010. The housing market needs
more time before prices can be expected to stabilize and begin to rise. Losses from subprime
mortgage loans may fall in the range of 18 percent to 28 percent.
As for commercial mortgages, based on the historical data through the second quarter of 2009,
on an expected value basis, the predicted cumulative charge-off rate
21
between the third quarter
of 2009 and the second quarter of 2011 is about 6.1 percent. This signals more losses than in the
recession of the early 1990s.
Before detailing our calculations, it is necessary to state that our analyses for both residential and
commercial mortgage markets are based on simple time series projections. Future trends of
mortgage markets and their losses depend on many other factors, such as actions taken by the
government and financial institutions, which are not reflected in our time series projections.
Moreover, the key data series start in the 1990’s, so our time series are not long enough to pick
up observations from periods of severe real estate market stress: The recent past may offer only
limited guidance on what to expect going forward under the current distressed circumstances.
That said, the simple approach yields projections that are reasonably consistent with other
forecasts, so we include them to provide some sense of the difficulties that lie ahead in 2009 and
2010.
A. Residential Mortgage Losses Projection
1. Residential Mortgage Foreclosure Rate Projection
We approximate mortgage foreclosure starts rates over the next two years, using macro-level
variables, with a Vector Error Correction Model (VECM):
∑
−
=
−
−
+
ΦΔ
+
Ω
+
=
Δ
1
1
1
p
i
t
i
t
t
t
y
y
y
ε
α
where
1
−
−
=
Δ
t
t
t
y
y
y
, and
t
y
is the vector including four selected economic variables: 1) the
foreclosure start rate, 2) the house price index, 3) the unemployment rate, and 4) the TED spread.
21
The charge-off rates are computed by taking net charge-offs for a quarter and dividing by the average level of
loans outstanding over the quarter. The percentage is multiplied by 4 to obtain an annualized rate. When we say
“cumulative charge-off rates”, we first divide the annualized charge-off rates by 4 and sum them up over a certain
period, by simply assuming the average level of loans outstanding keep constant during that period.
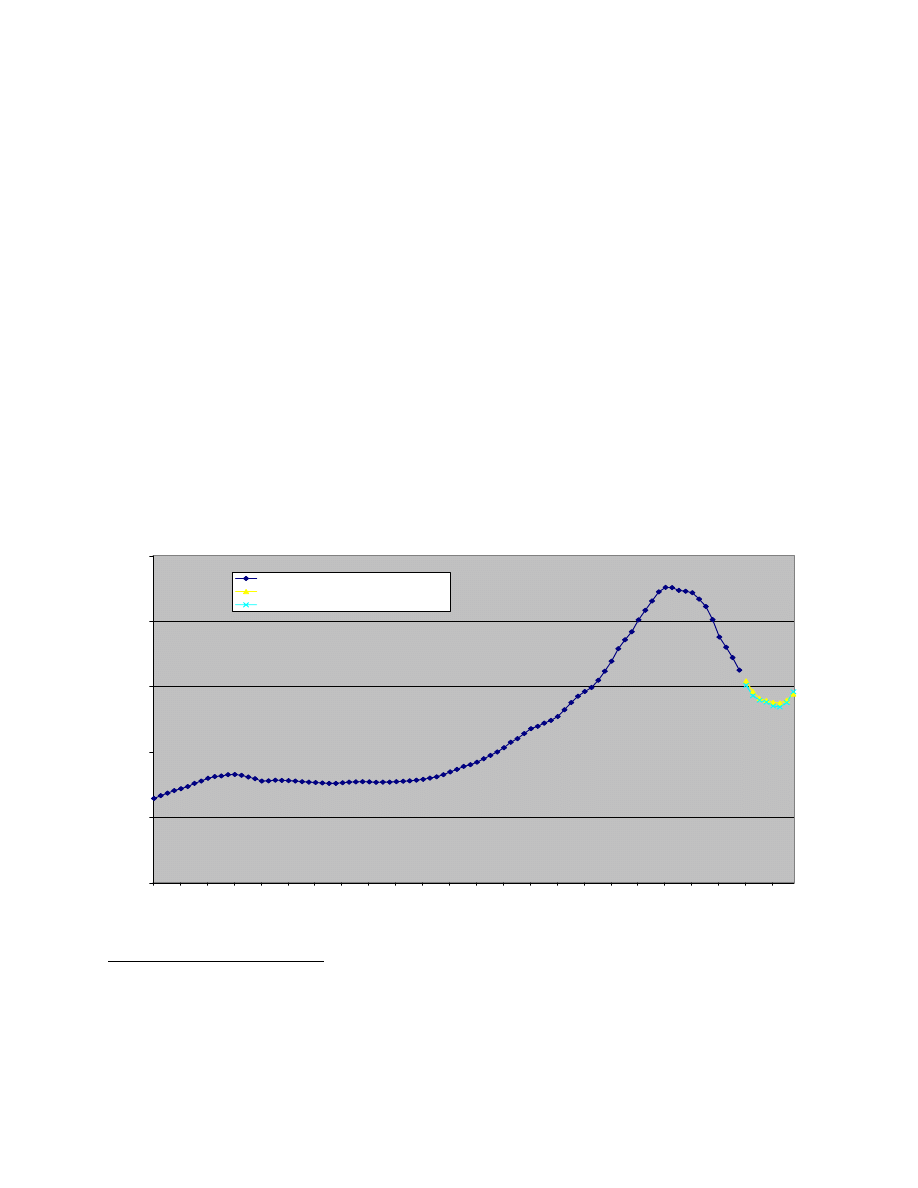
© Society of Actuaries
50
We examine four-period lags (p = 4) and use Bayesian Vector Error Correction Model
22
as built
in SAS to perform estimations and forecasts.
The seasonally adjusted prime and subprime mortgage foreclosure start rates, obtained from the
Mortgage Bankers Association, measure the percentage of outstanding loans which enter the
foreclosure process each quarter. For the house price index, we used the Case-Shiller seasonally-
adjusted house price. The TED spread refers to the difference between the three-month Treasury
bill rate and the three-month LIBOR, indicating perceived credit risk in the economy. All the
data are quarterly from the first quarter of 1998
23
through the end of 2008, and the estimation is
based on the entire data set. We conduct the Granger Causality test and find that, basically at any
reasonable level of statistical significance, the three variables Granger-cause the remaining
fourth variable.
24
Figure V.3 displays econometric model projections for the Case-Shiller house price index over
the next two years. This suggests that the Case-Shiller index will continue to decrease until mid
2010, bottoming out at the price level as seen in year 2002. From the level at the end of 2008, the
Case-Shiller index is estimated to drop 15 percent.
Figure V.3 Historical and Predicted Case-Shiller House Price Index
Historical and Predicted Case-Shiller's House Price Index
0
50
100
150
200
250
Ma
r-
8
7
Ma
r-
8
8
Ma
r-
8
9
Ma
r-
9
0
Ma
r-
9
1
Ma
r-
9
2
Ma
r-
9
3
Ma
r-
9
4
Ma
r-
9
5
Ma
r-
9
6
Ma
r-
9
7
Ma
r-
9
8
Ma
r-
9
9
Ma
r-
0
0
Ma
r-
0
1
Ma
r-
0
2
Ma
r-
0
3
Ma
r-
0
4
Ma
r-
0
5
Ma
r-
0
6
Ma
r-
0
7
Ma
r-
0
8
Ma
r-
0
9
Ma
r-
1
0
Time
Historical
Predicted via Prime Mortgage Loans
Predicted via Subprime Mortgage Loans
22
Details can be found at http://support.sas.com/rnd/app/da/new/801ce/ets/chap4/index.htm.
23
The first quarter of 1998 is the beginning point of available foreclosure starts rates data on prime or subprime
mortgage.
24
The detailed explanation could be found in the paper “Investigating causal relations by econometric models and
cross-spectral methods” by Clive Granger (1969, Econometrica 37, 424-438).
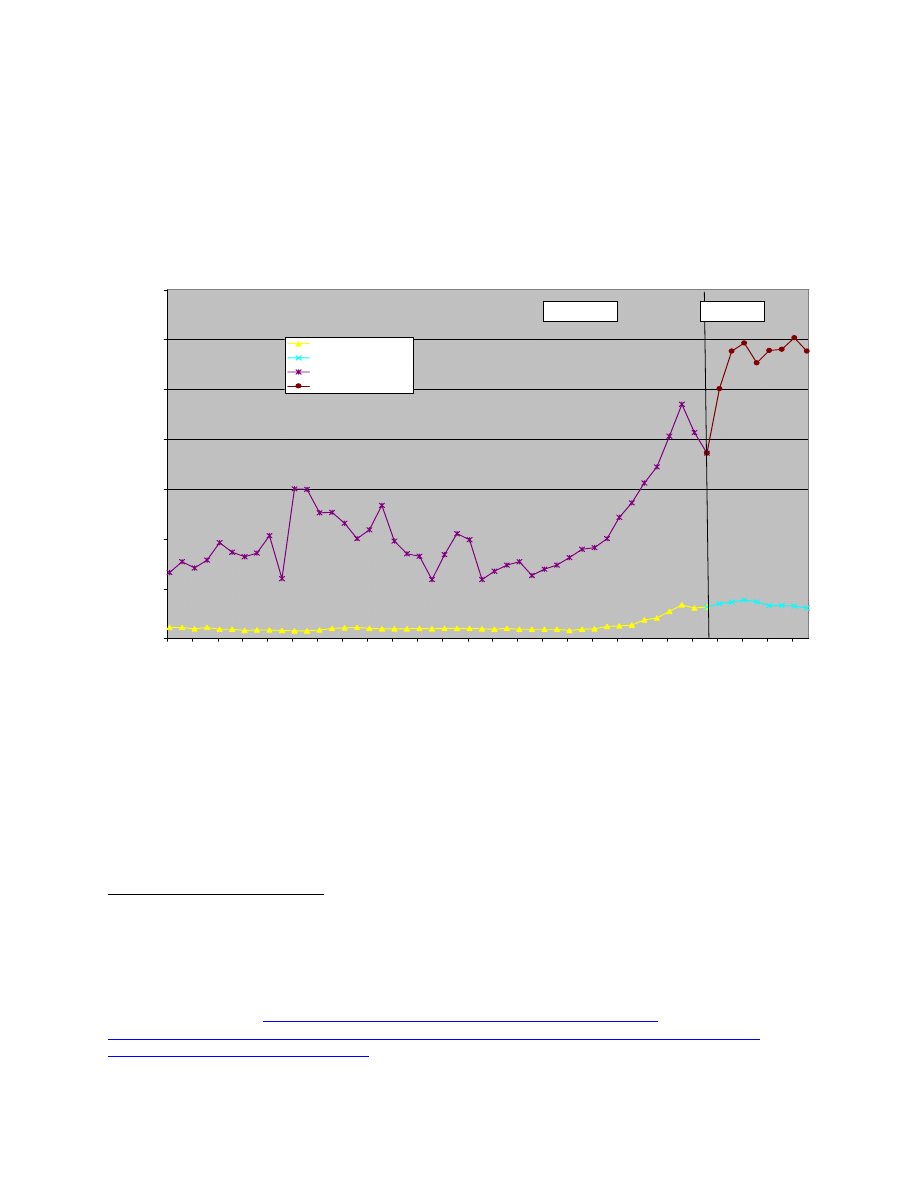
© Society of Actuaries
51
Figure V.4 shows predicted prime and subprime foreclosure start rates for the next two years. All
the results show that the foreclosure starts rates of prime or subprime mortgages will continue to
rise in 2009-2010.
25
Figure V.4
Historical and Predicted Foreclosure Rates for Prime and Subprime Loans: Starts
Historical and Predicted Foreclosure Rates: Starts
0.00
1.00
2.00
3.00
4.00
5.00
6.00
7.00
M
a
r-9
8
S
ep-
98
M
a
r-9
9
S
ep-
99
M
a
r-0
0
S
ep-
00
M
a
r-0
1
S
ep-
01
M
a
r-0
2
S
ep-
02
M
a
r-0
3
S
ep-
03
M
a
r-0
4
S
ep-
04
M
a
r-0
5
S
ep-
05
M
a
r-0
6
S
ep-
06
M
a
r-0
7
S
ep-
07
M
a
r-0
8
S
ep-
08
M
a
r-0
9
S
ep-
09
M
a
r-1
0
S
ep-
10
Time
Pe
rc
e
n
ta
ge
Historical, Prime
Predicted, Prime
Historical, Subprime
Predicted, Subprime
Historical
Predicted
Obviously, any further house price deterioration means that the typical foreclosed house is more
deeply “underwater,” and so the loss given default (severity) will be higher. Figure V.5 displays
the mortgage loan loss severity in the fourth quarter of 2008, based on the year/quarter of
origination. The national average severity is in the range of 40 percent to 60 percent. Some
25 According to two recent reports, the non-seasonally adjusted foreclosure starts rate on prime mortgage was
0.94% in the first quarter of 2009, and was 1.01% in the second quarter of 2009. The non-seasonally adjusted
foreclosure starts rate on subprime mortgage was 4.65% in the first quarter of 2009, and was 4.13% in the
second quarter of 2009. A new trend in the second quarter of 2009 was that there was a drop in foreclosure
starts rate on subprime loans. However, the foreclosure starts rates on prime loans had a big increase.
The sources for these recent foreclosure rates are Mortgage Bankers Association National Delinquency Survey, the
first quarter of 2009,
http://blog.oregonlive.com/news_impact/2009/05/NDS_Q109.pdf
, and
http://www.realestaterama.com/2009/08/20/delinquencies-continue-to-climb-foreclosures-flat-in-latest-mba-
national-delinquency-survey-ID05877.html
.
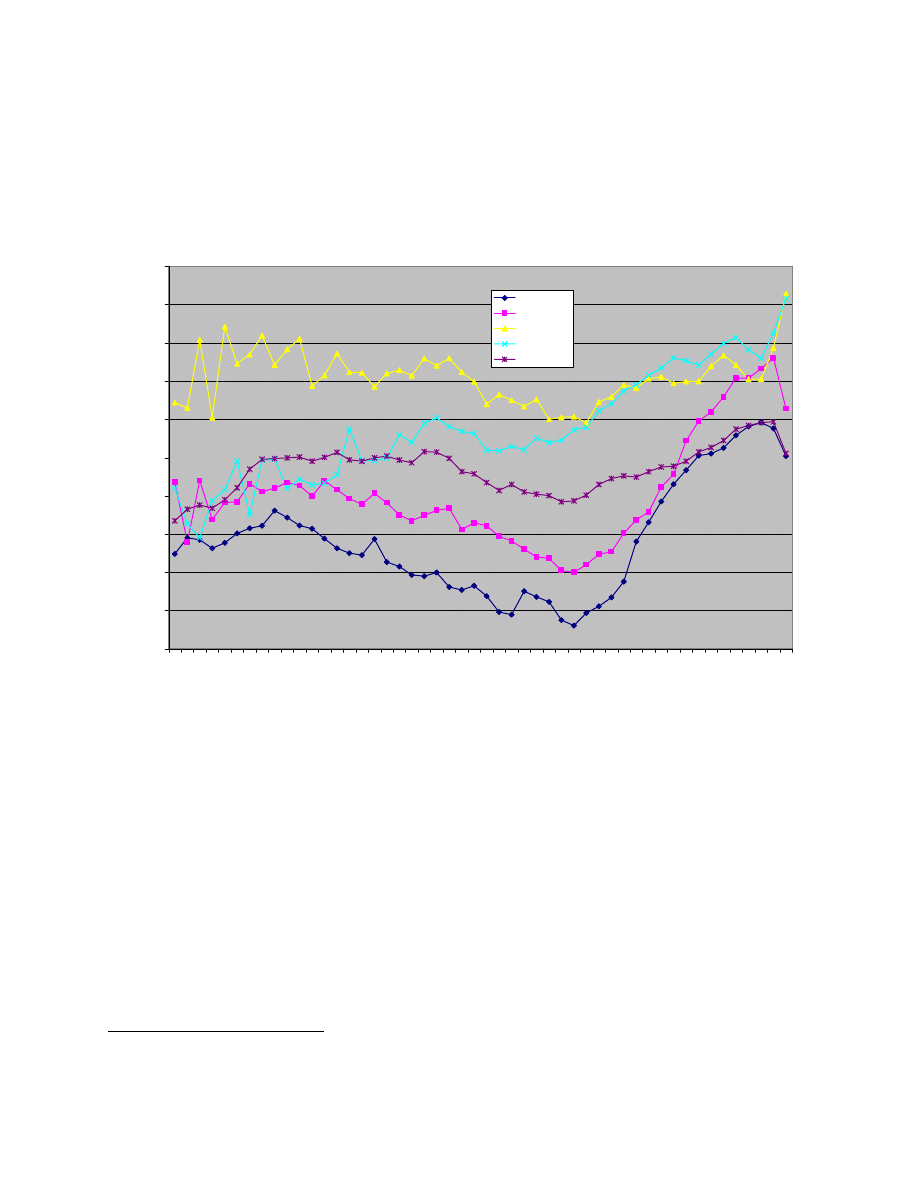
© Society of Actuaries
52
states, such as Michigan and Indiana, have loss severity above 90 percent. Here we consider four
scenarios for loss given default: 100 percent; 60 percent; 50 percent; and 40 percent.
Figure V.5
Loss Severity by Origination (Source: LoanPerformance)
Severity by Origination
0.00%
10.00%
20.00%
30.00%
40.00%
50.00%
60.00%
70.00%
80.00%
90.00%
100.00%
Q
119
95
Q3
19
95
Q1
199
6
Q3
19
96
Q1
19
97
Q3
199
7
Q
119
98
Q3
19
98
Q
119
99
Q3
19
99
Q
12
00
0
Q3
200
0
Q
120
01
Q3
20
01
Q
120
02
Q3
20
02
Q
12
00
3
Q
320
03
Q1
20
04
Q3
20
04
Q1
200
5
Q3
20
05
Q
12
00
6
Q
320
06
Q1
20
07
Origination Time
California
Florida
Indiana
Michigan
NATIONAL
The projected loss ratios
26
are shown in Table V.1. With a 100 percent loss given default, which
is the worst case, the cumulative loss ratios for prime and subprime mortgages in 2009-2010 are
5.50 percent and 45.61 percent respectively. More likely scenarios feature the loss given default
in the range of 40 percent to 60 percent: The corresponding loss ratios in 2009-2010 are in the
range of 2.20 percent to 3.30 percent for prime mortgages, and in the range of 18.24 percent to
27.37 percent for subprime mortgages.
26
Here the loss ratio equals to the foreclosure rate multiplied by loss given default.

© Society of Actuaries
53
Table V.1 - Projected Cumulative Loss Ratio for 2009-2010
Severity Scenario
100%
60%
50%
40%
Prime Mortgage
5.50%
3.30%
2.75%
2.20%
Subprime Mortgage
45.61%
27.37%
22.80%
18.24%
In comparison, Fitch RMBS Loss Metrics released the expected RMBS loss ratios (Table V.2).
Their forecasts are projections of lifetime losses, based on individual pools of RMBS.
Table V.2 - Average RMBS Loss Ratios By Fitch
Vintage Pre2005
2005
2006
2007
Prime 0.51%
1.2%
2.7%
3.5%
Alt-A 1.55%
4.70%
8.75%
10.69%
Subprime 19.08%
30.2%
38.8%
34.3%
Source: www.fitchratings.com. Release dates: 1) Subprime 2005-2007 vintages, Dec 2008;
2) Subprime pre 2005 vintages, Feb 2009; 3) Alt-A, Dec 2008; 4) Prime, Apr 2009.
Generally, the expected losses for RMBS in the vintages of 2005-2007 are higher than for those
of earlier vintages.
B. Commercial Mortgage Losses Projection
We explore the charge-offs
27
data to get a rough sense of future commercial mortgage losses. We
use the charge-off rate on commercial real estate loans by all commercial banks
28
as the industry
benchmark
29
, and employ an AR model with unemployment rates
30
as the exogenous variable
t
q
j
j
t
j
p
i
i
t
i
t
U
c
c
υ
γ
β
α
+
+
+
=
∑
∑
=
−
=
−
1
1
where
t
c refers to the charge-off rate and
t
U is the unemployment rate. We examine 4-period
lags ( p = q = 4).
27
Charge-off is an accounting item, containing an uncollectible loan for which the principal and accrued interests
are removed from Assets. Net charge-offs can be used to approximate loan losses.
28
The data comes from http://www.federalreserve.gov/econresdata/releases/statisticsdata.htm.
29
Chen and Southard (2008) state that the commercial mortgage loss rates for life insurers and for the commercial
banks are comparable.
30
The income to pay back the commercial mortgages comes mainly from rent, which is highly correlated with
unemployment rates.

© Society of Actuaries
54
The charge-off rates are obtained from Federal Reserve website and used to approximate loss
rates of commercial real estate loans. The data are quarterly from the first quarter of 1991
through the second quarter of 2009.
31
In the recession of the early 1990s, the 2-year cumulative charge-off rate
32
peaked at around 4
percent. Since the fourth quarter of 2008, annualized charge-off rates began increasing and were
above 2 percent per annum. On an expected value basis, the predicted cumulative charge-off
rate between the third quarter of 2009 and the second quarter of 2011 will be about 6.1 percent
33
,
signaling increased losses from commercial mortgages. As noted earlier, future commercial
mortgage losses shall depend upon the speed of recovery of the economy, which depends on
many factors and cannot be easily projected using simple time series.
Figure V.6 Projected commercial mortgage losses will increase in 3Q2009-2Q2011
Historical and 2-year Predicted Commercial Mortgage Charge-off Rates
3.00
4.00
5.00
6.00
7.00
8.00
9.00
10.00
11.00
12.00
M
ar-
91
M
ar-
92
M
ar
-9
3
M
ar-
94
M
ar-
95
M
ar
-9
6
M
ar-
97
Mar
-9
8
M
ar
-9
9
M
ar-
00
Mar
-0
1
M
ar
-0
2
M
ar-
03
Mar
-0
4
M
ar
-0
5
M
ar-
06
M
ar
-0
7
M
ar
-0
8
M
ar-
09
M
ar
-1
0
M
ar
-1
1
Unem
pl
oym
e
nt Rat
e
s
(%
)
-0.5
0
0.5
1
1.5
2
2.5
3
3.5
4
A
n
nual
iz
ed Cha
rge-of
f Rate
(%
)
Unemployment Rates
Charge-off Rate
Historical
Predicted
In comparison, Wachovia’s report “Life Sector: FYE 2008” forecast cumulative commercial
mortgage losses between 7% and 9% for the 2005, 2006 and 2007 vintages.
31
The analyses are based on the entire data set.
32
Please see footnote 20.
33
Assume the total outstanding loan balance keep constant as of the second quarter of 2009.

© Society of Actuaries
55
VI. Perspective on Enterprise Risk Management
A. Introduction
Enterprise Risk Management (ERM) has been gaining momentum for the last decade or so in the
financial industry, and can be expected to receive even more attention after the financial crisis.
The insurance industry, led by actuaries, has been an early leader in this area. The core idea of
ERM is to analyze and manage risks across the enterprise integrally instead of separately (i.e. the
“silo approach”). For those organizations that have created an ERM structure or are considering
doing so, some questions beg answers. How successful or value-added is ERM to a financial
organization? Or more basically, how developed is ERM in the financial industry in general?
What challenges do financial institutions face in developing an ERM program?
Assessments of this nature are not numerous. One study looked at the U.S. insurance industry
and found that ERM accounts for 17 percent of firm value (Hoyt, 2008). On the other hand, a
study conducted by the Economist Intelligence Unit and sponsored by SAS found several
challenges associated with the development of an ERM program. Specifically, the study found
that ERM programs for the financial industry were still in the early stage of implementation.
Their development has been impeded by the lack of relevant, timely and consistent data and
could be challenged in an entrenched organization culture (Economist Intelligence Unit, 2008).
Despite limited answers to these important questions, recent experience with the financial crisis
has underscored the importance of establishing an independent and robust ERM program. Even
if companies are still unsure of this need, it seems likely that regulators, rating agencies,
investors, and customers will demand it. In this chapter, we offer some thoughts based on our
observations, literature review, as well as experiences in some of the ERM areas.
There are nine key areas we believe that insurers should pay special attention to:
•
The success of ERM hinges on a strong risk management culture which starts at the top of a
company.
•
Risk management is most effective at prevention. Failing that could mean resorting to
damage control when risk occurs, which is often expensive and ineffective, if not too late.
•
Know not only what is going on inside “your own house” but also be aware of what is going
on in your “neighbor’s yard.” Regulators should pay attention to what happens in other
countries.
•
Establish a robust liquidity management system. Ensure that you have ample liquidity under
stress scenarios.
•
Develop a counterparty risk management system and establish counterparty limits.

© Society of Actuaries
56
•
Pay special attention to high growth/profit areas as these are often the areas from which the
greatest risks emanate.
•
Develop and refine tools that allow you to systematically aggregate exposures, including
those in far-flung corners of your companies.
•
Models can create a false sense of comfort. Managers must be alert to the assumptions that
go into models and the limitations of model results due to these assumptions. It is critical to
challenge the assumptions and subject them to stress tests.
•
Stress testing needs to be more dynamic and robust.
B. A Closer Look
In this section, we take a closer look at each of the seven focus areas.
• The success of ERM hinges on a strong risk management culture which starts at the top of a
company.
After the collapse or near collapse of Bear Stearns, Lehman Brothers, Merrill Lynch, and
AIG, a number of writings have shed light on the inner workings of these failed companies.
Emerging from these writings is a common theme of a dominant corporate leader that had, in
hindsight, pushed the organization to pursue profit and growth with little regard to warning
signs in risk.
• Risk management is most effective at prevention. Failing that could mean resorting to
damage control when risk occurs, which is often expensive and ineffective, if not too late.
Fire prevention is a good example in the real world. As a preventive step, you would want to
have flammable materials, such as dry leaves, cleared from your yard. Removal may be
costly, but the effort or money is well spent: If nothing is done, lightning may set fire to the
leaves and spread to the house, causing irreversible damage.
In the corporate world, risk management decisions often are not this easy. However, what is
important is to have a mindset and culture that encourage robust discussions. Some
organizations in good times may view risk as an afterthought and are unwilling to spend the
time and energy to delve into difficult risk issues that could delay a product launch or a
financial transaction. However, the price they ultimately pay when things turn in the wrong
direction can be overwhelming. Moody’s involvement in rating CDOs provides a good
example. Moody’s internal documentation, unearthed in the aftermath of the CDO meltdown,
indicated Moody’s analysts were aware of the rating issues with some of the CDOs.
However, these issues were put on the shelf in order to get the deal done on time (Barrack,
2008). The potential for reputation risk to the organization of getting this wrong did not seem

© Society of Actuaries
57
to occur to those involved. Had they paused for a moment and thought about the potential
consequences, the outcome could have been different.
• Know not only what is going on inside your “own house” but also be aware of what is going
on in your “neighbor’s yard.” Regulators should pay attention to what happens in other
countries.
One thing this crisis has taught us is that the financial world is highly interconnected as a
result of globalization and the proliferation of derivatives. A spark in the far corner of the
financial world could ignite a “fire” that quickly spreads to your firm. The collapse of the
two Bear Stearns hedge funds in summer of 2007 can be considered such sparks.
Unfortunately, not many people at that time recognized that a fire was forming and
spreading.
What this crisis has taught is that a robust risk management program should not only monitor
what is going on within an organization, but also be constantly on the lookout for “sparks”
that have either occurred (or have a chance to occur). Once these dangers have been
identified, the risk manager should assess the danger posed to her own firm and identify the
cautionary or preventive actions needed. Liquidity management provides a specific example
of this. As we have recently learned, liquidity can quickly disappear when the tide turns and
traditional liquidity providers turn off the spigots. Monitoring the supply of liquidity entails
understanding what is going on in the market and with a firm’s credit suppliers.
• Establish a robust liquidity management system. Ensure you have ample liquidity under
stress scenarios.
Liquidity could mean life or death to a company. It is a simple and well-known fact with
ample examples in history in both insurance and non-insurance industries. For a recent
example, we can look to the auto industry. Although the dust remains unsettled in Detroit,
Ford is emerging better positioned than its two Detroit rivals, GM and Chrysler. Ford has
turned down for now the possibility of requesting government help, while GM and Chrysler
have gone to Uncle Sam several times, hats in hand. One key reason for Ford’s relatively
better position is its fortunate and timely capital-raising effort in 2007-2008 through a
combination of asset sales, debt issuance, and drawing on credit lines before the market
nearly shut down in late 2008 through 2009.
In the insurance industry, a classic case of poor liquidity management is the default and
failure of General American in 1999. At the time, General American was a $30 billion highly
rated insurance company. However, the company, in collaboration with its reinsurance
partner, ARM Financial Group, sold a $3.5 billion funding agreement (FA) with a 7-day put
option to the 37 contract holders, of which $2 billion were to three contract holders. ARM
Financial Group’s weak earnings announcement for the second quarter of 1999 set off a
chain of events: 1) General American recaptured the FA from ARM Financial Group; 2) the
recapturing of the FA triggered the downgrade of General American by Moody’s; 3) the
downgrade set in motion contract holders’ exercising of the 7-day puts; 4) General American

© Society of Actuaries
58
failed to meet the 7-day puts due to lack of liquidity even though it had a large investment
grade asset portfolio; 5) General American was seized by the Missouri Department of
Insurance and was subsequently acquired by MetLife.
34
General American’s failure reflects a
sequence of misjudgments and poor management, of which lack of liquidity management can
arguably rank at the top. Had the company secured liquidity either through capital raising or
a credit line commitment prior to recapturing the FA, the outcome could have been different.
The Basel Committee on Banking Supervision issued a draft proposal “Principles for Sound
Liquidity Risk Management and Supervision” with 17 principles covering fundamental
principles (Principle 1), governance (Principles 2-4), measurement and management
(Principles 5-12), public disclosure (Principle 13), and the role of the supervisor (Principles
14-17). Although the target audiences are banks, we think several principles are relevant and
important for insurers as well. Below we list Principles 5-12 for Measurement and
Management.
35
For other principles and follow-up discussion and rationale for each of the
principle, see Basel Committee on Banking Supervision, 2008.
Measurement and Management of Liquidity Risk (Excerpt from “Principles for Sound
Liquidity Risk Management and Supervision”)
Principle 5: A bank should have a sound process for identifying, measuring, monitoring and
controlling liquidity risk. This process should include a robust framework for
comprehensively projecting cash flows arising from assets, liabilities and off-balance sheet
items over an appropriate set of time horizons.
Principle 6: A bank should actively manage liquidity risk exposures and funding needs within
and across legal entities, business lines and currencies, taking into account legal, regulatory
and operational limitations to the transferability of liquidity.
Principle 7: A bank should establish a funding strategy that provides effective diversification
in the sources and tenor of funding. It should maintain an ongoing presence in its chosen
funding markets and strong relationships with funds providers to promote effective
diversification of funding sources. A bank should regularly gauge its capacity to raise funds
quickly from each source. It should identify the main factors that affect its ability to raise
funds and monitor those factors closely to ensure that estimates of fund raising capacity
remain valid.
Principle 8: A bank should actively manage its intraday liquidity positions and risks to meet
payment and settlement obligations on a timely basis under both normal and stressed
conditions and thus contribute to the smooth functioning of payment and settlement systems.
34
See SOA San Diego Spring Meeting, Session 64PD, June 22-23, 2000.
35
For other principles and follow-up discussion and rationale for each of the principle, see Basel Committee on
Banking Supervision, 2008.

© Society of Actuaries
59
Principle 9: A bank should actively manage its collateral positions, differentiating between
encumbered and unencumbered assets. A bank should monitor the legal entity and physical
location where collateral is held and how it may be mobilized in a timely manner.
Principle 10: A bank should conduct stress tests on a regular basis for a variety of
institution-specific and market-wide stress scenarios (individually and in combination) to
identify sources of potential liquidity strain and to ensure that current exposures remain in
accordance with a bank’s established liquidity risk tolerance. A bank should use stress test
outcomes to adjust its liquidity risk management strategies, policies, and positions and to
develop effective contingency plans.
Principle 11: A bank should have a formal contingency funding plan (CFP) that clearly sets
out the strategies for addressing liquidity shortfalls in emergency situations. A CFP should
outline policies to manage a range of stress environments, establish clear lines of
responsibility, include clear invocation and escalation procedures and be regularly tested
and updated to ensure that it is operationally robust.
Principle 12: A bank should maintain a cushion of unencumbered, high quality liquid assets
to be held as insurance against a range of liquidity stress scenarios, including those that
involve the loss or impairment of unsecured and typically available secured funding sources.
There should be no legal, regulatory or operational impediment to using these assets to
obtain funding.
Had General American followed these principles it might have avoided the problems that it
encountered.
• Develop counterparty risk management systems and establish counterparty limits.
Counterparty risk refers to the risk of a counterparty, usually involved through a derivative
trade, not being able to fulfill its contractual obligation, causing losses to the firm.
Counterparty risk is most pressing for OTC (Over-the-counter) derivatives, since for
exchange-traded derivatives counterparty risk is reduced through the use of a clearinghouse
and the exchange-imposed mark-to-market and margin requirements. The OTC derivatives
market is huge and has enjoyed rapid growth. According to the BIS (Bank for International
Settlements), there were $592 trillion notional amount outstanding as of December 2008,
down 14 percent from its peak in June 2008 (Bank for International Settlements, 2008).
For the insurance industry, although the actual OTC figures are unknown, insurers’ exposure
in OTC derivatives could be substantial as insurers use OTC derivatives extensively for
hedging interest rate risk in both assets and liabilities, credit risk in assets, and equity
exposure in variable annuities. Insurers may also engage in arbitrage or relative value trades
using OTC derivatives. Any effort to count the actual insurers’ exposure could be
complicated by the fact that OTC derivatives for non-hedge purposes could sometimes be
done through a non-insurance (e.g. AIG FPC) or offshore entity.

© Society of Actuaries
60
Managing counterparty risk should be an integral part of ERM programs for insurers. The
bankruptcy of Lehman Brothers on September 15, 2008, which caused large losses to some
of Lehman’s counterparties and sent many to the bankruptcy court with other creditors,
serves as a warning lesson. A sound counterparty management process is a multi-stage
process, entailing: 1) selecting, reviewing and approving counterparties; 2) negotiating ISDA
(International Swaps and Derivatives Association) agreements including CSA (Credit
Support Annex) for collateral; 3) setting counterparty limits; 4) measuring exposures and
capacity usage, including stress tests; 5) managing collateral; and 6) monitoring and
reviewing.
Measures (1)-(3) are done via collaboration among risk, legal, and compliance departments.
It is a time consuming process that could take months, yet is necessary for stemming future
issues. An ISDA agreement is a standard contract used by almost all counterparties; CSA is a
part of the standard ISDA contract that spells out collateral treatment and procedures.
Counterparty limits could be based on PPE (potential future exposure), the maximum
exposure to the counterparty expected on a future date (at a specified confidence level).
Measure (4) involves calculating and netting current exposures for all derivatives with each
counterparty and is a key step to ensure the exposure stays within the limit. To get the
measurement right requires a good position and valuation system. Measure (5) ensures that
the collateral each party owes the other is posted and accounted for, and that disagreement on
MTM (which affects the amount of collateral required) is resolved. Collateral management is
also a critical and integral part of liquidity management. Measure (6) entails monitoring,
reviewing, and planning additional capacity if necessary.
36
• Pay special attention to high growth/profit areas.
It is human and organizational nature to give special status or treatment, explicitly or
implicitly, to high growth/profit areas. Although it is well intentioned to keep key
contributors happy, the danger is that such a culture, if not managed carefully, could foster a
growing sense of entitlement and superiority that is unhealthy for open dialogue and
collective decision making. Possible damaging effects include the possibility that a high
growth/profit area enjoys exceptions from the standard corporate risk management procedure
and ignores information requests from corporate ERM managers, or gets by with a limited
response in hope of more autonomy. After some time, the corporate ERM manger no longer
knows what exactly goes on inside that corner of the organization, until something bad
happens. AIG and its Financial Products division offer such an example.
• Develop and refine tools that allow you to systematically aggregate exposures, including
those in far-flung corners of your companies.
During boom times, companies create a variety of special purpose entities and vehicles to
facilitate transactions. These entities are sometimes created for tax advantages or accounting
maneuvering and could become widespread as transactions intensify. For risk management
36
For more details on counterparty risk management, see Canabarro, 2004 and The Report of the CRMPG III, 2008.

© Society of Actuaries
61
purposes, it is critical to bring these exposures onto a risk or economic balance sheet. In
absence of that, the corporate ERM may not have a good grasp of the sprawling exposures
and could be totally unprepared by the surprising exposures that surface from nowhere,
wreaking economic and reputation havoc on the organization. A good example is the initial
off balance sheet treatment of SIVs (structured investment vehicles) at Citigroup and several
other Wall Street firms. The subsequent movement of these investments onto their balance
sheets resulted in large realized losses.
• Models can create a false sense of comfort. Managers must be alert to the assumptions that
go into models and the limitations of model results due to these assumptions. It is critical to
challenge the assumptions and subject them to stress tests.
VaR (value at risk) provides a good example. If you query two different VaR modelers, they
would very likely give you two different VaR numbers. The reason is simple – VaR depends
on various methodologies and assumptions, differences in which lead to different answers.
For example, three top level choices when developing VaR are methodology (parametric vs.
historical), model (normal vs. non-normal) given the parametric approach, and calibration of
the chosen model. These methodologies and assumptions are not always listed and explained
in the VaR report. Thus, the user of the report must ask questions about the methodology and
assumptions, and understand the limitations associated with these models as well as how the
results would change under stress or other scenarios.
• Stress testing needs to be more dynamic and robust.
To be more thought-provoking, stress testing should incorporate a rich variety of economic
scenarios, as well as explicitly consider a company’s own rating downgrades, counterparty
rating downgrades, the failure of liquidity suppliers, and increased correlations in asset
returns, between products, and across different business lines or business units during times of
distress.

© Society of Actuaries
62
VII. Regulatory Implications
A. Introduction
The financial crisis and its effects on insurance companies raise issues with respect to their
regulation. Like many other financial institutions, insurance companies are subject to fairly
intensive regulatory oversight. Many aspects of regulation are intertwined with insurers’
financial management and asset allocations. Recent events inevitably pose questions about how
well regulation has worked in helping insurance companies mitigate the negative effects of the
problems with mortgage-backed assets and other investments. Further, these events pose
questions about how regulation should be modified (if at all) looking forward. This chapter
reviews the important elements of insurer financial regulation and the regulatory implications of
the financial crisis.
B. The Paradigm for Financial Regulation in the U.S.
1. Current Approach and Philosophy
There appear to be governing philosophies towards the regulation of financial institutions – a
rules-based approach and a principle-based approach. A rules-based approach is characterized by
an extensive set of specific regulations that govern what an insurer can and cannot do, e.g., a
regulation that stipulates the maximum percentage of a certain type of asset allowed in an
insurer’s portfolio. In contrast, a principle-based approach imposes more general principles that
insurers are expected to follow in many aspects of their operations and risk management. The
distinction between these two approaches is more definitive in concept than in practice. A rules-
based system can use principles to govern certain areas and a principle-based system can impose
rules to constrain certain insurer decisions. Hence, the operative question in examining an
existing system or considering changes to that system is the extent to which it relies on rules or
principles to regulate insurance companies.
In the U.S., historically the states have relied more heavily on a prescriptive or rules-based
approach to regulating insurers’ financial condition and market practices (in contrast to systems
in countries like the UK), which is oriented by an accounting perspective. This is reflected in
numerous laws, regulations, rules, and other measures that govern virtually every aspect of
insurers’ activities and financial structure. Regulators have tended to place greater emphasis on
insurers’ compliance with these prescriptions rather than the competence and prudence of their
management and their overall financial risk. Insurers’ reported accounting values and financial
statements are the principal measures by which their regulatory compliance is determined. This
approach permeates all aspects of solvency oversight, including capital requirements.
The states have been slow to adopt a principle-based approach (despite statements to the
contrary) and it is uncertain how quickly this will change. To their credit, U.S. regulators have
sought to increase their emphasis on risk assessment within their monitoring systems and
associated tools. For example, the NAIC created the Risk Assessment Working Group to guide
the development of financial monitoring activities. It appears that examiners and analysts are
encouraged to think about risk when they perform their tasks, but it is not clear what this means
in a U.S. context.

© Society of Actuaries
63
The NAIC also has established the Principles Based Reserving Working Group to assess changes
in policies and practices. The group has initially focused on principle-based reserve requirements
for life insurance companies, but the group’s mandate is to ultimately expand its study to other
aspects of regulating life-health and property-casualty insurance companies (NAIC, 2008). Still,
it is uncertain as to how far and how fast regulators would be willing to embrace a principle-
based approach to insurer financial regulation. Without using dynamic financial analysis and
employing other practices associated with a principle-based approach guided by a prudential
philosophy, there are limits to what regulators are likely to do in terms of true risk assessment.
37
The NAIC has begun a broader initiative to re-evaluate the financial regulation of insurance
companies that encompasses a broad range of topics. Ideally, a principle-based system should
also require insurers to employ appropriate enterprise risk management (ERM) processes and
practices such as that contemplated in the EU’s Solvency II initiative.
The U.S. regulatory philosophy and approach have implications for the management of risks
associated with problems in financial markets. On the one hand, regulations tend to lag events
rather than being developed to address the next crisis. On the other hand, some have suggested
that relatively tight regulation of insurers’ investments has contributed to their stronger resiliency
when compared with other financial institutions. This may be true but it may also provide little
assurance that regulatory requirements will be either efficient or effective in the future. Ideally, a
regulatory system should enable and encourage insurers to engage in the best risk management
practices. It is not clear the current U.S. system does so. Hence, it is important to consider its
guiding philosophy and approach in examining its current and future structure and performance.
2. Current Framework
In the U.S., primary regulatory authority for insurance has been delegated to the states with the
federal government retaining the authority to intervene in areas where it chooses to do so. State
insurance regulation dates back to the mid-1850s and was most recently reaffirmed with the
passage of the McCarran-Ferguson Act (MFA) in 1945. The MFA continues to provide the
presiding statutory framework for insurance regulation but this has not prevented federal
intervention in certain areas (Klein, 2009). These interventions have generally been confined to
non-financial areas. Further, additional federal interventions have been proposed in Congress
that might be broadly related to financial regulation, but with some exceptions, would not appear
to affect to solvency matters directly.
38
The two exceptions are proposals that would establish an
Optional Federal Charter (OFC) for insurance companies and strengthen federal regulatory
authority to address systemic risks posed by “influential” financial institutions, including
insurance companies.
39
It should be noted that various federal regulators currently have the authority to regulate certain
financial holding companies that own insurance companies and depository institutions. The
American International Group (AIG) is an example of a holding company subject to federal
37
Two exceptions to this statement are stress testing for life insurers and the determination of one of the components
of their RBC requirements which employs a dynamic approach.
38
The areas addressed by these proposals are reinsurance, non-admitted insurers, and risk retention groups.
39
See “Senators Debate Fed’s Role in Overseeing Systemic Risk,” Wall Street Journal, March 19, 2009.

© Society of Actuaries
64
oversight by the Office of Thrift Supervision (OTS), due to its ownership of a thrift. Hence,
implicitly if not directly, the OTS was responsible for oversight of AIG’s investment subsidiary
that sold a large amount of credit default swaps (CDS) which triggered collateral calls when the
mortgage-backed securities backed by these swaps were downgraded by rating agencies. The
states are still principally responsible for the supervision of insurance groups. Historically, the
states have placed more emphasis on the oversight of individual insurance companies (whether
they are members of groups or not) but this could change in the future (Klein and Wang, 2007).
The NAIC has targeted holding company supervision for special attention in its financial
regulatory initiative.
Insurance regulatory functions can be divided into two fundamental areas: 1) financial or
solvency regulation; and 2) market regulation.
40
This chapter focuses on financial regulation.
Protecting policyholders and society in general against excessive insurer insolvency risk should
be the primary goal of insurance regulation. Regulators protect policyholders’ interests by
requiring insurers to meet certain financial standards and to act prudently in managing their
affairs. To accomplish this task, insurance regulators are given authority over insurers’ ability to
incorporate and/or conduct business in the various states. State statutes set forth the requirements
for incorporation and licensure to sell insurance. These statutes require insurers to meet certain
minimum capital and surplus standards and financial reporting requirements and authorize
regulators to examine insurers and take other actions to protect policyholders’ interests. Solvency
regulation oversees a number of aspects of insurers’ operations, including: 1) capitalization; 2)
pricing and products; 3) investments; 4) reinsurance; 5) reserves; 6) asset-liability matching; 7)
transactions with affiliates; and 8) management. It also encompasses regulatory intervention with
insurers in financial distress, the management of insurer receiverships (bankruptcies), and
insolvency guaranty mechanisms that cover a portion of the claims of insolvent insurers.
The primary responsibility for the financial regulation of an insurance company is delegated to
the state in which it is domiciled. Other states in which an insurer is licensed provide a second
level of oversight but, typically, non-domiciliary states do not take action against an insurer
unless they perceive the domiciliary state is failing to fulfill its responsibility. The states use the
NAIC to support and coordinate their solvency oversight and compel domiciliary regulators to
move more quickly in dealing with distressed insurers if this proves necessary. This helps to
remedy (but may not fully correct) the negative externalities associated with solvency regulation.
An insurer’s domiciliary state tends to reap the lion’s share of the direct economic benefits of its
operations (e.g., employment and payrolls) but the costs of its insolvency are distributed among
all the states in which it operates
41
. Economic and political considerations could cause a
domiciliary regulator to exercise too much forbearance in dealing with a distressed insurer
(Grace, Klein and Phillips, 2002).
40
See Klein (1995) and Klein (2005) for a more detailed overview of insurance regulatory functions.
41
Each state has a property-casualty guaranty association and life-health guaranty association. A state’s guaranty
association covers the claims obligations of an insolvent insurer in that state, regardless of where it is domiciled.

© Society of Actuaries
65
3. Alternative Frameworks and Issues
Issues associated with the current system of U.S. insurance regulation involve both its governing
philosophy and approach and the delegation of authority. As noted above, insurance regulation in
the U.S. has tended to apply a rules-based and prescriptive approach with some limited
exceptions. This contrasts with the principle-based approach and prudential system contemplated
in the European Union’s (EU) Solvency II Directive. The system being developed by the EU
would rely heavily on the use of company internal models and/or a standard model to determine
insurers’ capital adequacy and assess the quality of their risk management. Such a system would
also incorporate ERM in the sense that insurers would be expected to employ ERM best
practices in their financial management. The differences between the U.S. approach and the EU
approach have significant implications for how insurers would be expected to manage various
financial risks, including their exposure to asset losses arising from problems in financial
markets (Eling, Klein and Schmit, 2009).
Another area of discussion has been the proposal to establish an optional federal charter (OFC)
for insurance companies. Under legislation recently introduced in the Congress, insurance
companies could opt to be regulated by the federal government and would be exempt from state
regulations, with some limited exceptions. Federal regulators would be responsible for financial
oversight of “national insurers” (opting for federal regulation) although they would be required
to participate in state guaranty associations if they meet federal standards. It is reasonable to
expect that federal regulation would employ concepts and methods similar to those adopted
under the Basel II accords. This implies that national insurers would be required or allowed to
use internal models to determine their capital adequacy. The specific details of federal
regulations are not known at this time but they could require insurers to employ ERM practices.
Given recent events, it is likely that federal regulators would pay special attention to insurers’
investments in asset-backed securities. However, an OFC is strongly opposed by the states and
certain industry groups and this could delay its enactment. It is also possible that an OFC for life
insurers could be adopted before it is extended to other industry segments (Grace and Klein,
2009).
42
In this report, we do not take a position on whether state or federal regulation is preferable. Some
might believe that a federal regulator would be better positioned to implement needed reforms.
However, the states would not be precluded from adopting and enforcing such reforms. Hence,
our focus is on how the financial regulation of insurers is designed rather than the locus of
regulatory authority.
C. Accounting Standards and Valuation Issues
Accounting standards and how insurers are and will be required to value various assets are
important issues in considering the framework for financial regulation. Many elements of
42
It should be noted that the legislation has been reintroduced that would establish an Insurance Information Office
(IIO) within the Treasury. Although this office would have limited scope, it could help to increase the transparency
surrounding insurance companies as well as enhance insurance expertise within the federal government. Some also
might see an IIO as a precursor to true a federal insurance regulator while others may believe that an IIO could
forestall such action.

© Society of Actuaries
66
financial regulation hinge on the accounting values that insurers report. The concepts and rules
regarding the determination of “fair value” and “mark to market” have significant implications
for asset valuation. The implementation of these concepts also has been subject to considerable
debate in the U.S. and internationally.
Insurance companies are required to maintain records and file annual and quarterly financial
statements with regulators in accordance with statutory accounting principles (SAP) that differ
somewhat from Generally Accepted Accounting Principles (GAAP). Statutory accounting seeks
to determine an insurer’s ability to satisfy its obligations at all times, whereas GAAP measures
the earnings of a company on a going-concern basis from period to period. Under SAP, most
assets are valued conservatively and certain non-liquid assets, e.g., furniture and fixtures, are not
admitted in the calculation of an insurer’s surplus. Statutory rules also govern such areas as how
insurers should establish reserves for invested assets (life insurers only) and claims and the
conditions under which they can claim credit for reinsurance ceded.
Statutory accounting has been criticized over the years for reliance on amortized book or
historical cost values rather than market values for bonds. Proponents of market valuation argue
that it would provide regulators, policyholders and others with a more accurate picture of the true
risk and net worth of an insurer. It also is argued that market value accounting would improve
insurer investment decisions which are distorted by historical cost accounting.
43
Regulators have
tended to oppose a move to market value accounting because of concerns about the potential
difficulty in estimating the market values of some securities as well as liabilities. In 1993, the
Financial Accounting Standards Board (FASB) adopted market value reporting requirements for
bonds for purposes of GAAP financial statements. While this has increased pressure on
insurance regulators to reconsider the SAP approach, they are reluctant to implement any
changes until there is greater consensus on allowing insurers to discount liabilities to present
value.
Currently, insurers are required to provide summary and detailed schedules on their asset
holdings. The summary schedules provide a quality and maturity distribution of all bonds owned
at book/adjusted carrying values by major types of issues and NAIC (Securities Valuation
Office) designations. These schedules include a maturity distribution of bonds by major type and
subtype of issues, including single-class and multi-class residential and commercial mortgage-
backed/asset-backed securities. However, there is no breakout of securities according to their
underlying collateral, e.g., subprime and Alt-A mortgages. Detailed schedules list each security
identified by CUSIP number. Theoretically, it is possible determine the underlying collateral of
given security but this would require examination of the underlying documentation – something
that is not practical in a comprehensive analysis. We have been able access this kind of
information from other sources for some securities with the expenditure of considerable time and
effort. This is a transparency issue that should be addressed in the enhancement of financial
reporting requirements.
43
A historical cost system induces insurers to sell (hold) assets when market values are greater (less) than book
values to improve their reported financial position (Cummins, et. al, 1995).

© Society of Actuaries
67
A thorough discussion of asset valuation is beyond the scope of this report but we can make
some brief comments. The principal arguments for and against the use of book or amortized
values for bonds were noted above. Opponents of “mark to market” make the point that insurers
should not be forced to devalue assets due to current market conditions/pricing that they intend
to hold for an extended period of time to fund long-term liabilities. Underlying this argument is
the notion that insurers will be able to use the cash flows from these assets to pay future benefits
and if these assets are sold, they may fetch a much higher price in the future than they would in
the current market.
There may be no resolution of this fundamental issue that will meet every need. In other words,
accounting rules that serve the purposes of investors/creditors may not be suitable for regulators
and others that are primarily concerned about the ability of an insurer to meet its future financial
obligations. Hence, one could argue that different assessments of an insurer’s value are
appropriate depending on how that information is used. In a sense, such varying assessments
already exist given the differences between SAP and GAAP. Attempting to bring SAP and
GAAP into exact alignment may not be the best thing to do.
D. Regulation of Investments
The regulation of insurers’ investments will be the subject of some discussion as state regulators
and other consider the implications of the financial crisis. The NAIC has several model
laws/regulations that pertain specifically to investments. One is the Investments of Insurers
Model Act (Defined Limits Version). A second is the Investments of Insurers Model Act
(Defined Standards Version). The latter is intended to take more of a prudential and principle-
based approach to regulating insurers investments while the former is more rules-based or
prescriptive in terms of setting specific limits and other rules that govern insurers’ investments.
Both of the model laws contain provisions concerning insurance company practices in managing
its investment portfolio. For example, they require that an insurer’s board of directors adopt a
written plan for acquiring and holding investments and related activities. The model acts further
stipulate procedures that the board of directors should follow in managing its portfolio.
The defined limits model act contains several provisions relevant to the issues discussed in this
report. Specifically, it prohibits a life insurer from holding more than 20 percent of its admitted
assets in medium and lower grade investments with a 10 percent limit for lower grade
investments, a 3 percent limit for SVO Class 5-6 investments and a 1 percent limit for Class 6
investments. There are other provisions that set rules and limits with respect to mortgage loans
and real estate. Investments in derivatives for “income generation” are limited to 10 percent of a
life insurer’s admitted assets (the limit for property-liability insurers is 7.5 percent).
The defined standards model act contains fewer specified limits and more provisions concerning
how an insurer is expected to manage its investments and the associated risks. Like the defined
limits act, it stipulates the role and responsibilities of the board of directors in managing an
insurer’s investments “prudently.” It goes on to list “prudence evaluation criteria” that regulators
may consider in assessing the adequacy of an insurer’s investment management. Interestingly,
these criteria include “systemic risk.” It also provides for a “minimum financial security

© Society of Actuaries
68
benchmark” (MFSB) that authorizes regulators to require an insurer to hold more capital than
that required under RBC and fixed minimum capital standards. It also sets a “minimum asset
requirement” which is the sum of MFSB and an insurer’s liabilities. Additionally, it contains
limits for specified asset classes that in some cases are the same as in the defined limits act and
in other cases appear to be more liberal. The model act does not appear to impose a specific limit
on derivative investments other than those implicitly contained in other provisions.
As noted above, those insurers that have been subject to a limit on their holdings of derivative
instruments for income generation purposes (either by New York or other states) may have
ultimately benefited from this constraint if it prevented them from investing more heavily in
assets exposed to the implosion of the housing market. Looking forward, regulators may
contemplate even stricter limits tied to the type of collateral underlying asset-backed securities.
Some may view this as being a more reliable approach than promulgating general principles and
standards that further guide an insurer’s investments in these securities. Of course, these
approaches are not mutually exclusive and both could be included in revised investment
regulations. Regardless, regulators need to revisit their supervision of insurers’ investment
practices in line with the lessons learned from the most recent crisis.
E. Capital Adequacy Standards
The states impose two types of capital requirements on insurers. Each state has its own fixed-
minimum requirement.
44
Insurers are also subject to uniform RBC requirements based on a
complex formula developed by the NAIC. There are different formulas for property-casualty,
life, and health insurers. An insurer is required to have capital that meets or exceeds the higher of
the two standards. In the RBC formula, selected factors are multiplied times various accounting
values (for example, assets, liabilities, or premiums) to produce RBC charges or amounts for
each item. The charges are summed into several “baskets” and then subjected to a covariance
adjustment to reflect the assumed independence of certain risks. The basic components of the life
RBC formula are listed below.
C0: Investments in affiliates
C1: Asset Risk – Other (credit risk/fluctuation in fair value)
C2: Insurance Risk (underestimation of liabilities/underpricing)
C3: Interest Rate Risk, Health Credit Risk, and Market Risk
C4: Business Risk
There are additional subcategories within these basic categories.
The formula for calculating a life insurer’s authorized control level RBC is
2
2
2
2
2
0.5[ 0
4
( 1
3 )
( 1
3 )
2
3
4
]
RBC
C
C a
C o C a
C s
C cs
C
C b
C b
=
+
+
+
+
+
+
+
+
44
The states’ fixed minimum capital and surplus requirements range from $500,000 to $6 million, depending on the
state and the lines that an insurer writes. The median fixed capital requirement is in the area of $2 million (Klein
2005).

© Society of Actuaries
69
The covariance adjustment assumes that the certain risks are uncorrelated. This is an arbitrary
assumption that may or may not be consistent with reality. Multiplying the summed RBC
amounts by 0.5 might raise the curiosity of some readers. This adjustment was simply intended
to increase insurers’ reported RBC ratios. As discussed later, an RBC ratio of less than 200
percent requires “company action.” Hence, the operative RBC amount is twice the formula
result, which negates the effect of the 0.5 adjustment in terms of regulatory compliance.
The NAIC RBC formulas are far more complex than what might be implied by the simple
representation above. For life insurers, particular attention is paid to developing charges for
various types of assets to address credit risk, interest rate risk, and market risk.
In 2005, the NAIC did adopt a modeling approach to assessing the market risk, interest rate, and
expense-recovery risk of variable annuities that are reflected in the C3 component. Insurers can
use prepackaged scenarios developed by the American Academy of Actuaries or their own
internal models.
An insurer’s calculated risk-based capital (RBC) amount is compared to its actual total adjusted
capital (TAC) to determine its RBC position.
45
Under the RBC model law, certain company and
regulatory actions are required if a company’s TAC falls below a certain level of RBC.
46
Four
RBC levels for company and regulatory action have been established, with more severe action
required for companies coming in at the lower levels (see Table VII.1). An insurer falling
between the highest level (company action level) and the second-highest level (regulatory action
level) is required to explain its financial condition, and how it proposes to correct its capital
deficiency to regulators. When an insurer slips below the second level, regulators are required to
examine the insurer and institute corrective action, if necessary. Between the third level
(authorized control level) and fourth level (mandatory control level), regulators are authorized to
rehabilitate or liquidate the company. If an insurer’s capital falls below the lowest threshold,
regulators are required to seize control of the insurer. Life insurers are also subject to a trend test
if their TAC falls below 250% of their ACL RBC.
Table VII.1 - RBC Action Levels
Action Level
Percent of ACL Requirements
Company Action
200
Company must file plan.
Regulatory Action
150
Commissioners must examine insurer.
Authorized Control
100
Commissioner authorized to seize insurer.
Mandatory Control
70
Commissioner required to seize insurer.
The fact that an insurer’s failure to meet specified RBC levels results in certain mandatory or
authorized actions has important implications. For example, this limits a regulator’s discretion to
some degree. Arguably, this has contributed to regulators’ caution in setting the RBC bar fairly
low to avoid being compelled to take actions against an insurer that would not be warranted
45
An insurer’s TAC is equal to its reported surplus with some minor modifications; for example, additional reserves
required by regulators are added to an insurer’s surplus in calculating its TAC.
46
The NAIC developed a model law to be adopted by the states that implements the RBC standards. All states have
adopted the model law so the same rules have been established in each state.

© Society of Actuaries
70
based on a more thorough and specific analysis of its financial condition and risk.
47
While there
has been some tweaking of the RBC formulas over the years, some of their components and
factors have not been modified since their original construction.
The complexity of the U.S. RBC formula gives a false sense of accuracy. Most important, the
U.S. RBC formula takes a static approach based on historical, reported accounting values. Unlike
systems that use some form of dynamic financial analysis (DFA) or “multi-period” analysis, the
formulas do not look forward to consider how an insurer might fare under a range of future
scenarios. Regulators rejected proposals to incorporate DFA when the formulas were being
developed, although dynamic analysis has been subsequently added to the Life C-3 component.
Also, accounting values can either be erroneous or manipulated to obtain more favorable
regulatory assessments.
This brings us to the question of the accuracy of RBC in setting minimum capital standards for
insurers. Numerous studies have tested various indicators or predictors of insurer insolvencies.
These studies have generally found that RBC ratios make a marginal contribution to insolvency
prediction, at best. Although an insurer’s RBC ratio is not intended to be an insolvency predictor,
this research raises questions about the accuracy and effectiveness of RBC standards.
The current RBC formulas could be improved by changing some of their parameters and adding
additional information and components. Further, while not all risks can be quantified, the
formula omits some that can be, for example, operational risks, using methodological tools now
available. It is also important to note that the RBC formulas contain no explicit adjustment for an
insurer’s size – the empirical research indicates that adding such a variable to the RBC formulas
would improve their accuracy. Another improvement (noting our discussion in Chapter III)
would involve refining its component for setting capital charges for the credit risk associated
with different asset classes.
Yet, while some elements of the formulas could be improved, a more fruitful strategy would be
to move toward some form of dynamic analysis that is tailored for a particular insurer’s
characteristics. This could be done through use of company internal modeling and/or the use of a
standard model. At the same time, risk models have their limitations and must be used properly.
Our critique of risk modeling in Chapter VI is also pertinent to models used for regulatory
purposes. Of course, there are limits to what any kind of quantitative methods can reveal, which
underlines the importance of qualitative assessments in the overall solvency monitoring process.
Such factors could include management competence, corporate governance, and internal risk
management (Conference of Insurance Supervisory Services of the Member States of the
European Union 2002). This leads to the incorporation of ERM in assessing an insurer’s capital
and risk management.
47
In statistical language, this might be labeled as a “Type 1 Error.” Conversely, a situation where the RBC formula
would not require a financially weak insurer to increase its capital to an adequate level would constitute a “Type 2
Error.” Klein and Wang (2007) demonstrate that only a small fraction of insurers fall below the company-action
level RBC requirement and that rating agency capital-adequacy tests are considerably more stringent than U.S.
regulatory standards.

© Society of Actuaries
71
F. Financial Monitoring and Analysis
1. Overall System
Fundamentally, the objective of solvency monitoring is to ensure that insurance companies meet
regulatory standards and to alert regulators if actions need to be taken against a company to
protect its policyholders. Solvency monitoring encompasses a broad range of regulatory
activities, including financial reporting, early-warning systems, financial analysis, and
examinations. In the U.S., insurers file annual and quarterly financial statements, which serve as
the principal sources of information for the solvency monitoring process, but a number of other
special reports are filed and used in regulatory monitoring.
48
Accounting rules take on added
importance because accounting values become the principle measures that determine whether an
insurer is complying with regulatory standards. Regulators also have broad authority to compel
insurers to provide other information deemed necessary to assess their financial condition.
49
The reports filed by insurers are subject to a “bench” or “desk” audit by an in-house financial
analyst or examiner who assesses the information’s accuracy and reasonableness and determines
whether an insurer requires further investigation. Typically, an insurer’s domiciliary regulator
performs the most extensive review of its financial information, but an insurer must file financial
reports with every state in which it is licensed, and non-domiciliary regulators also may review
these reports. Additionally, the NAIC scrutinizes insurers’ financial statements and disseminates
its analysis to state insurance departments.
50
This reflects the multilayered nature of financial
regulation and monitoring of U.S. insurers – the domiciliary regulator constitutes the first layer,
and non-domiciliary regulators and the NAIC constitute successive layers. Some might question
whether this multilayered regulation and monitoring is redundant, but in the U.S. system it is
viewed as essential to assure that domiciliary regulators are taking appropriate actions against
insurers in financial distress.
2. Early Warning Systems
State regulators rely heavily on early-warning systems and other financial analysis tools in their
monitoring activities. The fact that RBC standards are relatively low make financial monitoring
particularly important because an insurer could be in financial distress and still exceed its RBC
requirement. For the most part, these systems and tools are based on static, quantitative financial
ratios. There is some use of qualitative information, but this appears to be limited and also may
vary among the different states. The linchpins of regulatory monitoring are the Insurance
Regulatory Information System (IRIS) and the Financial Analysis Solvency Tools (FAST)
system. IRIS is comprised of twelve to thirteen financial ratios (depending on the type of
insurer), and its results are made available to the public. Normal ranges are set for each ratio.
Ratio results that fall outside these ranges and other criteria can trigger further regulatory
investigation.
48
These reports include insurers’ RBC calculations, actuarial opinions of reserve adequacy, CPA-audited financial
statements, and management opinions. Most but not all of these reports are available for public access.
49
State laws generally authorize regulators to review all books and records of a company at any time.
50
The NAIC’s analysis activities are focused on larger insurers that write business in a significant number of states.

© Society of Actuaries
72
In the early 1990s, regulators concluded that IRIS was inadequate, which led to the development
of the FAST system. In the NAIC’s explanation of its systems, FAST comprises the full array of
its solvency monitoring tools (including IRIS), but its heart is a computerized analytical routine
called the “scoring system.” The scoring system consists of a series of approximately twenty
financial ratios based on annual and quarterly statement data, but, unlike the IRIS ratios, it
assigns different point values for different ranges of ratio results. A cumulative score is derived
for each company, which is used to prioritize it for further analysis. These scores are provided to
all regulators but are not available to the public.
51
3. Other Elements
Importantly, NAIC analysts use the FAST scores and other information to identify companies
that deserve special attention.
52
This can lead to a process in which the NAIC’s Financial
Analysis Working Group will query a domiciliary regulator about a company’s status and steps
being taken to address any problems it may have. If the NAIC group determines that a
domiciliary regulator is taking all appropriate actions, then the group will either close the file or
continue to monitor the company. If the working group determines otherwise, it can compel the
domiciliary regulator to take the actions the group deems necessary. The working group’s power
does not stem from any direct regulatory authority. Rather, its power stems from the authority of
non-domiciliary regulators to suspend or terminate an insurer’s license to write business in their
jurisdictions. This could effectively force the domiciliary regulator’s hand, as license
suspensions and terminations would quickly lead to a company’s demise and propel it into
receivership.
Regulators use additional tools and information in their financial monitoring activities. They can
use the NAIC’s “Insurer Profiles System” and may also develop their own customized financial
ratios. Both periodic (every three to five years) and targeted company financial examinations are
conducted; targeted exams are performed to address specific questions or concerns that arise
from bench audits and analysis.
53
Additional sources of information may be tapped, including
Securities and Exchange Commission (SEC) filings, claims-paying ability ratings, complaint
ratios, market conduct reports, correspondence from competitors and agents, news articles, and
other sources of anecdotal information. While a wide array of information sources are available,
it appears that U.S. regulators rely primarily on quantitative data and tools, as well as financial
examinations. This is consistent with a prescriptive, rules-based approach as most rules are stated
in quantitative terms. Importantly, U.S. regulators tend not to engage in consultations with an
insurance company’s management to assess its competence and future plans. Further, with some
51
A list of FAST scoring system ratios is published in Klein (2005). However, the parameters used in developing an
insurer’s score remain confidential. The FAST scoring system is subject to more frequent modifications than the
IRIS ratios.
52
NAIC analysis is confined to “nationally significant” companies, which are defined as companies writing business
in seventeen or more states and have gross premiums (direct plus assumed) written in excess of $50 million for life-
health companies and $30 million for property-casualty insurers.
53
Examiners have been encouraged to go beyond simply verifying the accuracy of an insurer’s financial reports, and
perform additional analysis to assess an insurer’s financial risk.

© Society of Actuaries
73
exceptions, regulators do not perform any kind of dynamic financial analysis nor require
companies to do so.
54
4. Evaluation
Only three studies have tested the “predictive accuracy” of both the IRIS and FAST systems.
55
Prediction refers to the ability of these systems to identify insurers that ultimately fail (are seized
by regulators) and those that do not.
56
These studies also have included insurers’ RBC ratio (i.e.,
the ratio of Total Adjusted Capital to the Authorized Control Level RBC amount) as an
additional explanatory variable, although insolvency prediction is not its purpose. These studies
have generally found that the IRIS/FAST systems are reasonably effective in the sense that they
contribute significantly to models designed to predict insurer failures. At the same time, these
studies have found that these systems could be improved by recalibrating the FAST scoring
model and adding more variables and components to these systems, including financial strength
ratings and some form of cash flow testing (Cummins, Grace, and Phillips, 1999; Pottier and
Sommer, 2002). It should be noted that these studies judge the NAIC early warning systems by
past performance. Hence, they cannot assess their effectiveness based on new problems or risks
that are not reflected in the sample data periods used.
The cash-flow simulation used by Cummins, Grace and Phillips (1999) comes closest to the
DFA approach we discuss; its significant explanatory power in insolvency prediction tests lends
support to its consideration in determining capital adequacy and financial monitoring. It is
difficult to estimate the effect of using more qualitative methods and information, as these things
do not lend themselves as easily to empirical testing. The predictive value of claims-paying
ability ratings comes closest to indicating the potential contribution of qualitative analysis, which
is a part of the rating process.
This brings us to the issue of how existing monitoring systems detect the kinds of problems or
risks that insurers are now encountering. As discussed above, the IRIS and FAST systems use
relatively broad indicators that tend to lag behind actual events. Arguably, a number of these
measures address areas generally relevant to the financial crisis but none specifically focus on
the most relevant items. For example, both systems contain measures of capital adequacy,
leverage, financial performance, and investments. The ratio of non-investment grade bonds to
54
One exception to this is mandatory stress testing by life insurers to demonstrate the adequacy of their policy
reserves. The Life RBC formula also utilizes dynamic analysis in one of its components as noted above.
55
See Grace, Harrington and Klein (1998a), Grace, Harrington and Klein (1998b), and Cummins, Grace and Phillips
(1999). Grace, Harrington, and Klein (1998a) found that FAST scores are more accurate than RBC ratios in
identifying property-casualty insurers that become insolvent. The FAST system had a success rate of between 40
and 91 percent in predicting property-casualty insolvencies, depending on the data sample used and the specified
Type 1 error rate (ranging from 5–30 percent). In a second study, Grace, Harrington, and Klein (1998b) found that
the FAST system was somewhat less accurate for life-health insurers, but its performance might be improved by
adjusting the FAST scoring system based on empirical analysis.
56
In calibrating models to predict insolvencies, modelers have to balance the ratio of Type 1 errors to Type 2 errors.
Models can be calibrated to predict more insolvencies (that is, reduce Type 1 errors), but this raises the number of
Type 2 errors. Ultimately, a maximum acceptable level of Type 1 errors has to be established for any model that
might be used for regulatory purposes. More accurate models should offer better Type 1/Type 2 error tradeoffs to
choose from.

© Society of Actuaries
74
assets and investment yield are used to identify concentrations of high-risk assets. However, as
discussed earlier, these measures only crudely indicate insurers’ exposures to losses from
mortgage-backed securities or subprime mortgages. If insurers’ reporting requirements are
enhanced to provide better information on the credit quality of their assets, the additional data
could be used to improve early warning systems.
Regulators may modify or add measures in an effort to fill this gap. Essentially, any figures
reported by insurers are fair game in terms of developing new financial structure/risk measures.
Because it is a public system, changes to IRIS tend to occur less frequently. In contrast, because
FAST is not public, regulators are able to modify it more easily and frequently. We will not
know what changes are made to FAST unless the NAIC publicizes them. Looking more broadly,
other systems used for life insurers offer additional opportunities for risk assessment. For
example, stress testing of life insurers policy reserves could be expanded to other areas and risk
exposures.
Hence, tools are currently available to regulators to improve their monitoring of insurers assets
problems and risks. However, these tools have their limits. The next step would be to expand the
use of dynamic modeling whether it is performed by insurers, regulators, or both. ERM could
also be introduced as part of the regulatory system. Either initiative could be controversial so we
may not see any significant moves in the near term.
While this report and public attention is focused on the financial crisis and its effects on insurers,
improving financial monitoring should not be limited to remedying historical deficiencies.
Attention also must be paid to new problems that may emerge in the future. For example, recent
federal actions to ease the credit crisis and stimulate the economy could lead to some
combination of higher interest rates and inflation, depending on how the Fed manages these two
problems. Consequently, both regulatory and company risk assessment should consider these and
other adverse scenarios that may occur in the future.
G. Intervention
Intervention might be viewed as the final step in the regulatory process. Intervention could be
broadly defined as any specific action by regulators to force an insurer to alter its behavior,
transactions or structure. This could mean bringing an insurer into compliance with existing
regulations or going beyond regulations to achieve some desired outcome.
There are two categories of regulatory actions with respect to troubled companies: 1) actions to
prevent a financially troubled insurer from becoming insolvent; and 2) delinquency proceedings
against an insurer for the purpose of conserving, rehabilitating, reorganizing, or liquidating the
company. Some of these actions may be conducted informally; others require formal measures.
Similarly, some actions against companies may be confidential, and others may be publicly
announced. Regulators can negotiate sales or mergers of troubled insurers in order to avoid
market disruptions. This is often more feasible for life-health insurers because of the embedded
value of their long-term contracts.

© Society of Actuaries
75
If preventive regulatory actions are too late or are otherwise unsuccessful and an insurer becomes
severely impaired or insolvent, then formal delinquency proceedings will be instituted. These
measures can encompass conservation, seizure of assets, rehabilitation, liquidation, and
dissolution. For many insurers, these actions are progressive. A regulator may first seek to
conserve and rehabilitate a company to maintain availability of coverage and to avoid adverse
effects on policyholders and claimants, as well as lower insolvency costs. The regulator,
however, ultimately may be forced to liquidate and dissolve the company if rehabilitation does
not prove to be feasible. This is often the case with property-casualty insurers that have already
dug themselves into a deep hole by the time regulators seize control.
One question that is difficult to answer is how much leverage regulators can exercise in
compelling an insurer to lower its financial risk if it greatly exceeds its RBC requirement and
complies with all regulations from a quantitative perspective. In theory, regulators can act
against any company deemed to be in “hazardous financial condition.” However, regulators
would bear the burden of proof if an insurer resisted corrective action that ultimately would have
to be resolved in court. In practice, when regulators initiate formal actions, an insurer’s problems
are sufficiently obvious that the courts typically approve such actions. What we cannot observe
is regulators’ power to impose their will in informal actions that are not subject to public
disclosure.
This brings us back to the orientation of regulators and their authority. A greater reliance on rules
rather than principles may cause regulators to refrain from actions that go beyond enforcing
compliance with specific regulations. In a principle-based system guided by a prudential
philosophy, regulators may exercise greater discretion and take actions whenever they believe a
company is not properly managing its financial risk. U.S. regulators may believe that they can
exercise this kind of discretion if they choose to do so. The questions lie both with their authority
and inclinations.
How is this relevant to the regulatory implications of the financial crisis? To the extent that
existing or new regulations fail to prevent an insurer from incurring excessive financial risk in its
investment decisions, then regulatory discretion could become a key factor. If regulators are
authorized and inclined to constrain what they consider to be imprudent or risky behavior, this
could strengthen regulatory enforcement of company risk management practices. However, some
insurers may oppose such regulatory discretion, especially if it is not governed by guiding
principles and standards. This issue warrants consideration in contemplating changes to the U.S.
regulatory system and how rules and principles will be used.
F. Systemic Risk
The regulation of systemic risk also needs to be addressed. Systemic risk arises when an
institution or a small number of institutions take positions that could ultimately bring down
financial markets and the overall economy. In the context of this report, systemic risk could be
created by insurers (or their holding companies) and insurers could be the victims of systemic
risk. This is a topic that has already received considerable attention and is included in the
Administration’s new plan for financial regulation. As systemic risk has roots in both outsized
financial institutions and wide interconnectedness of a financial system woven in derivatives, an

© Society of Actuaries
76
effective regulatory framework in this arena, in our view, should address size and counterparty
risk, as well as promote market transparency. While opinions may differ on how systemic risk
should be regulated, it is of critical importance and a well-designed and implemented approach
should aid the insurance industry in managing this risk.
VIII. Lessons, Continuing Challenges, and Industry Outlook
In this chapter we examine the lessons learned from the financial crisis, continuing challenges
facing the insurance industry, and the outlook for the life insurance industry. Here we focus on
high priority items that are most unique and relevant to the insurance industry.
A. Lessons
1. Credit Ratings
Credit ratings from NRSROs (Nationally Recognized Statistical Rating Organizations), including
Standard & Poor’s, Moody’s, and Fitch, are among the most prescribed metrics relied upon by
regulators, rating agencies, insurers, banks, analysts, and investors in managing, measuring, and
controlling risks. The credit ratings’ widespread uses and acceptance, due in part to their simple
and intuitive appeal, have made them a cornerstone of credit risk management. For insurers
specifically, credit ratings are used for such critical areas as calculating risk based capital,
managing counterparty risk, determining asset allocation and other investment decisions, and
managing liquidity.
Insurance regulators, like banking regulators, ultimately enshrined NRSRO credit ratings as a
key piece of their RBC model. Over the past decade, the role of the Securities Valuation Office
(SVO) in independent credit risk assessment diminished, with the key policy change coming in
2004. After 2004, securities rated by NRSROs no longer needed to be filed with the SVO, and
their NAIC rating class was assigned based on a predetermined mapping from NRSRO credit
rating systems to the six-class NAIC rating system. This reliance on rating agencies was
unfortunate, as credit ratings were shown to be an unreliable guide to credit risk, due to flaws in
the rating agency business model and other shortcomings.
A lesson for insurers and regulators is the importance of developing an unbiased view of the
credit risk in investments. Insurers have been doing that precisely in commercial lending and
private placements over the years out of necessity, since most of these investments were not
rated by the rating agencies. Although independently rating a large chunk of public securities
would require a good deal of resources, the benefit, in our view, could extend from credit risk
management to relative value investment analysis and could outweigh the costs when done
properly. At the very least, users of credit ratings should perform some independent evaluation to
identify potentially flawed ratings. Further, there may be institutional mechanisms that could be
developed to provide independent assessments of the credit ratings of issuers and securities that
could be used by insurers. To the extent that rating agency opinions continue to be utilized, we

© Society of Actuaries
77
must pay close attention to the looming reforms of the industry to make sure that their incentives
are ultimately compatible with the use of their ratings by insurers and regulators.
2. Capital Adequacy and Investment Risks
The regulatory capital models (Basel II, NAIC RBC) and rating agency models (AM Best
BCAR, S&P Capital Model) were shown to have strengths and weaknesses. The regulatory RBC
formulas were intended in part to provide a more sophisticated treatment of credit risk than
existed at the time of their invention and also to discourage heavy concentration of risky assets in
insurers’ investment portfolios. In some respects they succeeded in achieving these objectives.
We should remember that the riskiest classes of debt represent a much smaller proportion of the
industry portfolio today than was the case in the 1980’s (prior to the development of these
models).
57
Also, our investigation has found no evidence of insurers’ piling on subprime
securities.
A simple factor-based approach, however, may be inadequate to measure the true risks that
insurers are bearing and may create the wrong incentives for insurers to bear increased “hidden”
risk through regulatory capital arbitrage. Noteworthy examples of this are the decline in the
industry allocation to Treasury obligations and to agency-backed MBS over the past 15 years
since the initiation of the RBC system. While the RBC system may not necessarily have caused
these shifts, it certainly accommodated them by making highly-rated private obligations a close
substitute for risk-free public obligations in when calculating risk-based capital.
The adequacy of RBC charges is undermined when they are based on flawed credit ratings. This
was evident in our data analysis of insurance company investment yield differentials, suggesting
that market-based indicators when available (such as portfolio yields) may offer better guidance
on portfolio risk. At the least, recalibrations of asset risk capital charges should be considered.
3. Stress-Testing
To be clear, banks and insurers have been conducting stress tests prior to the subprime mortgage
crisis. However, most insurers failed to consider scenarios such as a major contraction in the
housing market, company rating downgrades, counterparty rating downgrades, or the failure of
liquidity suppliers. To the extent that senior management fails to consider such scenarios, it is
imperative for regulators to ask the right questions. Some international insurance regulators (e.g.,
in Canada and Australia) were more proactive in providing guidance on dynamic solvency tests
(see, Sandberg, 2008).
Stress testing needs to take a holistic view of the organization, including asset risks as well as
liability risks. In particular, product lines such as variable annuities may involve significant
exposure to equity market declines, especially where GMXB benefits are involved.
57
Revised regulations concerning insurers’ investments and asset valuation reserves also may have contributed to
the decrease in the proportion of high-risk assets in insurers’ portfolios.

© Society of Actuaries
78
4. Diversification versus Specialization
Ever since Markowitz’s pioneering work on the concept of the efficient frontier and the role of
diversification in reducing risk as defined as the volatility or standard deviation of the return on
an investment, diversification has been increasingly believed and preached as an effective tool
for reducing investment risk and widely used as such among institutional as well as individual
investors. By extension, the concept of diversification has been gone far beyond investment,
spreading to and being practiced in many areas of business management. Closer to this crisis,
diversification had been one of the rationales allowing insurers and banks to grow larger through
acquisitions and expanding to new lines of business. For practitioners, the current crisis has
vindicated this logic in some respects, but brought it into question in others.
On the one hand, certain aspects of insurance regulation that placed limitations on insurance
activities may have protected insurance companies from the worst aspects of the financial storm.
For example, monoline restrictions ensured that bond insurance and mortgage insurance did not
directly affect subsidiaries engaged in other forms of underwriting. Also, strict regulations on the
use of derivative contracts led AIG to house its CDS activity in a non-insurance subsidiary,
which had the effect of shielding policyholders from credit derivative losses. Going further,
insurance organizations which “stuck to the knitting” of traditional insurance underwriting fared
better than those who sought greater levels of engagement and risk exchange with the capital
markets. In particular, certain organizations (AIG being one) insured credit risk on a large scale.
While such a move might seemingly offer diversification benefits on the blackboard, from a
practical standpoint the trading of credit risk with highly sophisticated banking counterparties
seems a game that insurers were ill-advised to play.
On the other hand, diversification served the industry well on the investment side. We have not
seen a wholesale breakdown in the insurance industry since the beginning of this crisis, thanks in
part to insurers’ adherence to diversified asset allocation. This provides a stark contrast to the
1980s, when several insurers collapsed due to a high concentration of investments in commercial
properties and non-investment grade bonds. In contrast, a number of national, regional, and local
banks have been seized, rescued, or sold by FDIC as a result of excessive concentrations in
residential mortgages or commercial loans in their investment portfolios relative to their capital.
Notwithstanding the indisputable logic of diversification benefits, the fact that almost no insurer
or bank is immune from this crisis regardless of how diversified its investment or business
portfolio provides a strong warning on the limits of diversification in reducing risk within a risky
asset portfolio. Diversification works best when the inner-components that comprise the whole
are relatively uncorrelated or deterioration of one component tends to be counterbalanced by
others. When these correlations or the tendency of the inter-components moving in the same
direction increase, the diversification benefit dissipates. In the current crisis, strong correlations
emerged among asset classes, business lines, geographical regions and countries. In the end, few
investments other than the “safe havens” of government bonds, cash, and gold performed well.
This result was not completely unprecedented, as a similar outcome was observed during the
Great Depression. The correlation increase among asset classes during a liquidity crisis should be
a new dimension to be incorporated in insurers’ risk models and considered in stress testing as
well.

© Society of Actuaries
79
5. Agency Problem
Agency problem, a century-old problem, refers to different and sometimes conflicting interests
of various stakeholders that the management of a company has to attend to. For insurers, one
additional layer of complexity is the interest of policyholders, which has a public service
element. A stock insurance company has to ultimately face the question of how to balance the
conflict between stockholders’ demand for high profitability and growth, which often are of
short-term nature, and policyholders’ need for good service, low-cost insurance products, and
financial strength of the company, which are of long-term orientation. To further complicate and
convolute the matter, a stock company’s financial strength is intimately related to profitability
and growth. Being a public do-gooder, an insurance company, if portrayed as a pursuit of
profitability at the expense of policyholders’ benefit, could face a public image problem and
even backlash. For example, the health insurance industry has been blamed for its profit
motivation in the current debate on health care reform.
Anecdotal evidence seems to indicate that stockholders were gaining the upper hand in the past
two decades leading up to the crisis, symbolized by the wave of demutualization beginning in
mid 1990’s. One possible explanation is the alignment of management interests with
stockholders’. The volatile and dismal financial performance in this crisis of stock insurance
companies including those demutualized since 1990’s could lead to a reexamination of
demutualization and comparison to those companies that had decided to remain mutual, as well
as an examination of what role, if any, played by the growth strategies pursued by the stock
companies in the following decade, often under pressure from stockholders and hedge funds, in
their financial woes today. It would not be surprising if some of the companies reverse the course
as a result of this reexamination. (Nationwide Financial Group is such an example.)
B. Continuing Challenges
1. Looming Investment Losses and Capital Erosion
Up to this point through this crisis, the insurance industry as a whole has fared relatively better
than the banking industry, thanks to a combination of factors: more diversified investments, less
subprime exposure, less leverage, liabilities that are less susceptible to withdrawal, and book
value accounting. Under book value accounting, insurers do not have to recognize investment
losses unless the impairment is deemed irreversible.
The insurance industry however is not yet out of the woods as there are signs of continued
weakness in the corporate credit sectors, which usually comprises the largest allocation of
insurers’ investment portfolio, and increasing deterioration in the commercial property sector,
where insurers tend to have sizeable holdings through commercial mortgages and CMBS. If the
economy continues on the downward path without slowing down or reversing, some insurers
may have to start realizing some of the losses in those sectors. Such a realization will further
drag down their earnings and deplete their capital.
The insurance industry’s exposure goes beyond direct holdings of these asset classes. Many life
insurers have offered embedded equity options such as guaranteed minimum benefits through
variable annuities. Other insurers provide direct insurance on municipal bonds, mortgage

© Society of Actuaries
80
portfolios, and D&O exposures. Further, some insurance organizations are involved in heavy
trading of credit default swaps. Through this crisis, it is likely that no liability sector has posed a
greater challenge than variable annuities. The onslaught from this sector hit insurers’ financials
from both earnings and capital perspectives. On the earnings side, a down equity market reduces
fee income based on the account value under management and triggers Deferred Acquisition
Cost (DAC) unlocking as well. On the capital side, rising equity volatility coupled with under-
hedged liabilities increases the required reserve for the sector. Although the industry has been
proactive in hedging the guarantees, these guarantees are notoriously difficult and expensive to
hedge. For example, the S&P 500 index, the most liquid market index to buy or on which to
construct hedges, has in some cases a weak relationship to the styled funds offered to the
variable annuity contract holders. Hedges referencing S&P 500 index instruments could involve
a significant basis risk problem. Also, the hedging costs rise with volatility, which may not have
been anticipated by the industry when the product was developed, priced, and sold during the
bull market and when the pressure was on meeting the production targets. Under-hedged
exposure will likely be reflected, ultimately, in higher reserves or payouts.
Together, managing the looming investment losses and capital erosions presents a continued
challenge and remains a focus for the industry in the near term.
2. De-Leveraging
Since the early stage of this crisis, the financial industry including insurers has embarked on a
frantic de-leveraging train to reverse the over-leveraged exposures accumulated over the prior
years, which has been credited for stemming further losses for the industry. Going forward, the
question facing insurers is whether to continue the existing pace of de-leveraging, when to slow
down or stop in light of the mixed economic signals. Each direction poses its own risk in face of
the economic uncertainty. Over-de-leveraging could undermine a company’s competitive edge
and put the company at a disadvantage when the economic cycle turns around. On the other
hand, not doing enough could cause larger damage if the downward trend continues.
There is no clear answer to this question. Each company has to assess its unique position and
strategy and perform in-depth analyses. Additionally, insurers could be well served by keeping
highly vigilant of economic events and monitoring signs of uncertainty and having an action plan
in place in response to each new potential development.
3. Fair Value vs. Book Value Accounting
There have been long-running debates on fair value vs. book value accounting dating back years
before this crisis. Proponents of fair value argue that it promotes transparency, is more effective
for risk management and more capable of discerning the stronger organizations from the weaker
ones. Proponents of book value argue that the fair value approach causes unnecessary earnings
and balance sheet volatilities and is less compatible to the long liabilities held by financial
organizations such as insurers. The enactment of fair value accounting under U.S. GAAP before
this crisis has been blamed by some for triggering and exacerbating the financial crisis.
The debates have become more heated and political since the beginning of the financial crisis
and have continued to this day with a number of financial luminaries and prominent

© Society of Actuaries
81
organizations taking sides on the issue. The debates have led to the recent development of FASB
modifying U.S. GAAP rules (to take effect with the 2Q09 financial reporting) in part under
pressure from the U.S. Congress, and the subsequent EU request for IASB to loosen IAS in
parallel to the U.S. rule modifications.
Under fair value accounting, assets and liabilities are marked to market (MTM). MTM values of
assets and liabilities flow through the income statement and balance sheet. One irony of the fair
value rule that caught investor community’s notice and some uproar in the middle of the
financial storm is that a weakened organization like Lehman Brothers would report a boost in
earnings as a result of decrease in the fair value of its liabilities. This is because liabilities under
fair value accounting are valued by the sum of discounted future liability cash flows where the
discount rates are based on a market interest rate curve (e.g. LIBOR) plus a credit spread that is
commensurate with the company’s current credit standing and could be referenced from the CDS
market. The weaker the organization gets, the greater the credit spread and the higher the
discount rates are, the less the fair value of the organization’s liabilities becomes, all else being
equal (American Academy of Actuaries, 2002).
With book value accounting, which underlies Statutory Accounting Principles (SAP) that are
followed by U.S. insurers for statutory financial reporting, loss of an asset is recognized only if
the impairment is deemed irreversible. The liability is in general recognized through a historical
cost or amortized cost method. Book value accounting as compared to fair value accounting
produces less earnings and balance sheet volatility.
In our view, the debate on the two accounting rules is far from over. The recent accounting rule
changes enacted under political pressure could be a temporary measure to get by the crisis. After
the dust settles from this crisis, there will likely be a reexamination of what worked and what did
not among the accounting profession and more meaningful changes are possible. It is possible
that no single accounting rule will serve all purposes well.
4. Principle-Based vs. Rules-Based Regulations
The relative merits of principle-based vs. rules-based regulation have been debated in the
insurance industry. Rules-based regulation tends to focus on what happened in the past.
Principle-based regulation offers greater flexibility in anticipating future risks. The subprime
crisis has revealed some weaknesses of principle-based regulation. Several large insurance
companies (e.g. AIG) had developed sophisticated internal risk models, but nevertheless failed to
spot the coming housing market crash. In contrast, the rule-based regulation could maintain
focus on a set of basic rules, prevent model disillusion, and promote regulatory uniformity across
companies.
On the other hand, more specific rules can be somewhat arbitrary and suffer from disadvantages.
As noted above, they tend to be based on past experience and, hence, can prove to be inadequate
in addressing new problems. Also, regulated entities can find ways to circumvent some rules.
Further, arbitrary rules can distort firm’s decisions and result in less efficient and effective risk
management.

© Society of Actuaries
82
In our view, this crisis could help shift the debates from arguing for the merits of each regulation
to crafting a proper mix of the two that will encourage desirable outcomes. In other words, a
principle-based system can include specific rules or regulatory restrictions and a rules-based
system can be based on a set of principles and use them in certain situations rather than specific
rules. For example, as advocated by Vaughan (2009), principle-based regulation could have
some “soft explicit” rules (e.g. guidance on specific economic scenarios) which can be adapted
over time in anticipation of macro-economic changes.
C. Life Insurance Industry Outlook
The life insurance industry in the U.S. is fragmented with hundreds of companies. Life insurance
products are mostly commoditized with little distinction and with new successful products
quickly copied throughout the industry. Sales and services have shifted to some extent from
being agent based to being internet based. From a consumer’s perspective, the two main
distinctions that remain are price and reputation (including financial strength) and price is the
most tangible among the two. The insurance industry has responded to this consumer sentiment.
Driven by intense competition and in hope of increasing or maintaining market share,
commodity-type products were priced aggressively by the industry, justified in part by presumed
higher returns from company investment portfolios and benign capital requirements. Variable
annuities were without exception, where the charges for the guaranteed benefits were offered for
less than the capital market hedging costs.
This crisis has served a wakeup call to the life insurance industry. As fallout of this crisis, the
industry will likely reexamine its product design, product lineup, and competitive advantages,
and re-price its products reflecting the challenging investment reality and the higher capital
required now for this business. This likely will lead to industry-wide price increases. Insurers
who are more likely to survive are the ones with the scale and scope to offer more diversified
products with a larger asset base and stronger capital as well as insurers with more niche
distribution or customer services that appeal to and help retain certain consumers.
These developments could pressure smaller insurers with small market niches to merge or be
acquired by larger companies. The movement toward federal regulation of the insurance industry
that is being resurrected in the Congress further threatens to take away another layer of
protection for the smaller and regional players. On the other hand, insurance subsidiaries of
larger diversified parent holding companies, used to be viewed by the parent as an earnings
stabilizer with benign capital consumption, could be under scrutiny by the parent after the crisis
for their strategic fit within the larger enterprise. Sales or spin-off of the insurance subsidiaries
could emerge from those parent holding companies that conclude their insurance subsidiaries no
longer provide a strategic fit.
These looming developments sketch out a future industry that is more dominated by a few bigger
and better capitalized companies that are more capable of sustaining future shocks. If this picture
does play out, the financial crisis will have at least one silver lining.

© Society of Actuaries
83
References
American Academy of Actuaries, 2002, Fair Valuation of Insurance Liabilities: Principles and
Methods, Public Policy Monograph.
Ashcraft, A. B., and Til Schuermann, 2008. Understanding the Securitization of Subprime
Mortgage Credit, Federal Reserve Bank of New York Staff Report No. 318.
Bank for International Settlements, December, 2008, Semiannual OTC derivatives statistics.
Barrack, Jeffrey, 2008, SEC: Rating Agencies Suffer From Conflicts of Interest, The Legal
Intelligencer.
Basel Committee on Banking Supervision, 2008, Principles for Sound Liquidity Risk
Management and Supervision.
Blundell-Wignall, Adrian, 2008, The Subprime Crisis: Size, Deleveraging and Some Policy
Options, Financial Market Trends: 1-25.
Chen, Jun and Jon Southard, 2008, Commercial Real Estate Loss Expectation and
CMBS/CMBX prices, Real Estate Issues 33: 67-77.
Cummins, J. David. 1988, Risk Based Premiums for Insurance Guaranty Funds, Journal of
Finance 43: 823-839.
Cummins, J. David., Scott. E. Harrington, and Robert. W. Klein. 1995, Insolvency Experience,
Risk-Based Capital, and Prompt Corrective Action in Property-Liability Insurance, Journal of
Banking and Finance 19 (3): 511–527.
Cummins, J. David., Martin F. Grace, and Richard. D. Phillips, 1999, Regulatory Solvency
Prediction in Property-Liability Insurance: Risk-Based Capital, Audit Ratios, and Cash Flow
Simulation, Journal of Risk and Insurance 66 (3): 417–458.
Eling, Martin, Robert W. Klein, and Joan T. Schmit, 2009, A Comparison of Insurance
Regulation in the United States and the European Union,” in Lars Powell, ed., Insurance
Choices: Competition and the Future of Property and Casualty Insurance Markets (The
Independent Institute) forthcoming in 2009.
Epermanis, K., and S. Harrington. 2006, Market Discipline in Property/Casualty Insurance:
Evidence from Premium Growth Surrounding Changes in Financial Strength Ratings, Journal of
Money, Credit, and Banking 38 (6): 1515–1544.
Faiola, Anthony, Ellen Nakashima and Jill Drew, Oct 15, 2008, What Went Wrong, Washington
Post

© Society of Actuaries
84
Friedman, Milton and Anna Jacobson Schwartz, 1963. A Monetary History of the United States,
1857-1960 (Princeton: Princeton University Press).
Grace, Martin F., Scott E. Harrington, and Robert. W. Klein, 1998a, Risk-Based Capital and
Solvency Screening in Property-Liability Insurance, Journal of Risk and Insurance 65 (2): 213–
243.
Grace, Martin F., Scott E. Harrington, and Robert W. Klein, 1998b, Identifying Troubled Life
Insurers, Journal of Insurance Regulation 16 (3): 249–290.
Grace, Martin. F., Robert W. Klein, and Richard D. Phillips, 2002, Managing the Cost of
Property-Casualty Insurer Insolvencies in the U.S., Center for Risk Management and Insurance
Research, Georgia State University, Atlanta, Research Report 02-1.
Hayre, Lakhbir S., Robert Young, 2004, Guide to Mortgage-Backed Securities, Citigroup,
Hayre, Lakhbir S., Manish Saraf, Robert Young, Jiakai (David) Chen, 2008, Modeling of
Mortgage Defaults, Citigroup.
Hoyt, Robert E., Andre P. Liebenberg, January, 2008, The Value of Enterprise Risk
Management: Evidence from the U.S. Insurance Industry, Working Paper, University of Georgia.
Klein, Robert. W., 1995, Insurance Regulation in Transition, Journal of Risk and Insurance 62:
363–404.
Klein, Robert. W., 2005, A Regulator’s Introduction to the Insurance Industry, 2nd ed. Kansas
City, MO: National Association of Insurance Commissioners.
Klein, Robert. W. and Shaun Wang. 2007, Catastrophe Risk Financing in the United States and
the European Union: A Comparison of Alternative Regulatory Approaches. Paper presented at
the New Forms of Risk Sharing and Risk Engineering: A SCOR-JRI Conference on Insurance,
Reinsurance, and Capital Market Transformations, Paris.
Klein, Robert W., 2009, An Overview of the Insurance Industry and Its Regulation,” in Robert
W. Klein and Martin F. Grace, eds., The Future of Insurance Regulation (Brookings Institution
Press) forthcoming in 2009.
Knowledge @ Wharton, November 14, 2007, Lloyd Blankfein and Ken Moelis: On Wall Street
Risks, Rewards and Opportunities, Wharton School of Business, University of Pennsylvania.
Lee, S., D. Mayers, and C. W. Smith Jr. 1997. Guaranty Funds and Risk-Taking: Evidence from
the Insurance Industry. Journal of Financial Economics 44: 3–24.
Loomis, Carol J., December 29, 2008, “AIG's Rescue Has a Long Way to Go”, Fortune.

© Society of Actuaries
85
Lowenstein, Roger, April 27 2008, Triple-A Failure, New York Times
McDermott, Glen, Ratul Roy, 2004, The CDO of ABS Handbook, Structured Credit Products,
Citigroup.
Nocera, Joe, January 4, 2009, Risk Mismanagement, New York Times.
Pottier, S., and D. Sommer, 2002, The Effectiveness of Public and Private Sector Summary Risk
Measures in Predicting Insurer Insolvencies, Journal of Financial Services Research 21 (1):
101–116.
Reserve Bank of Australia (2008), “Financial Stability Review”,
www.rba.gov.au
The Report of the CRMPG III, August, 2008, Containing Systemic Risk: The Road to Reform.
Sandberg, Dave (2008) Financial Regulation and the Maginot Line Defense Strategy, Risk
Management Newsletter, December 2008.
SOA San Diego Spring Meeting, Session 64PD, June 22-23, 2000, Liquidity Management for
Life Insurers with Institutional Business, RECORD, Volume 26, No. 2.
Vaughan, Therese (2009) The Implications of Solvency II for U.S. Insurance Regulation, NAIC
Policy Paper, 2009-PB-03.
Wachovia (2008), “Life Sector: FYE 2008”.
Wheeler, Darrell, et al, 2007, A Simple Guide to Subprime Mortgages, CDO, and Securitization,
Citigroup.

© Society of Actuaries
86
Appendices
Appendix A. 2007-2008 Financial Crisis Timeline
Date
Event
06/22/2007
Bear Stearns Plans $3.2 Billion Hedge Fund Rescue
07/31/2007
Bear Stearns Liquidates Hedge Funds
08/17/2007
Federal Reserve cuts the Discount Rate by 50 bps to 5.75
08/22/2007
Countrywide Receives $2 Billion Investment from Bank of America
09/17/2007
Merrill cuts jobs at First Franklin, its subprime division
09/21/2007
HSBC to close US Subprime Mortgage Unit, cut 750 jobs
10/15/2007
Citi reports Q3 earnings of $2.4 billion, writes down $3.2 bn of assets
10/22/2007
Merrill reports Q3 loss of $2.85/share, including writedowns of $9.4 billion
10/30/2007
Stan O'Neal retires as CEO of Merrill, replaced by John Thain
11/04/2007
Chuck Prince resigns as CEO of Citi, will Writedown $8-$11 billion of assets
12/11/2007
Morgan Stanley has $9.4 billion of Writedowns on assets in Q4-07
12/19/2007
Morgan Stanley has $9.4 billion of Writedowns on assets in Q4-07
12/20/2007
Bear Stearns reports first ever loss after writedowns
01/08/2008
James Cayne, CEO of Bear Stearns retires, Alan Schwartz replaces him
01/10/2008
Merrill Lynch to take $15 billion Mortgage Writedown
01/11/2008
Bank of America announces purchase of Countrywide for $4 billion
01/15/2008
Citi anounces loss of $9.83 billion, cuts dividend, raises $14.5 billion
01/18/2008
Merrill announces $18 billion of writedowns, loss of $9.83 billion
01/22/2008
Fed announces an emergency rate cut of 75 bps to 3.5%
01/30/2008
Fed cuts Federal Funds rate 50 bps to 3%
01/31/2008
MBIA announces loss of $2.3 billion
02/05/2008
MBIA to Raise Additional $750 Million of Capital
02/13/2008
Congress passes $162 billion stimulus package
02/27/2008
Fannie Mae Reports $3.55 Billion Loss for Q4 -07
02/28/2008
Freddie Mac reports Record $2.45 billion loss for Q4-07
02/28/2008
AIG Reports Loss of -$1.25/share vs .73 estimate for Q4-07
03/14/2008
Bear gets emergency funds from JPMorgan and NY Fed
03/14/2008
Bear Stearns Cos credit rating cut to BBB from A by S&P
03/16/2008
Federal Reserve establishes the Primary Dealer Credit Facility
03/16/2008
Treasury forces Bear Stearns to sell itself to JPMorgan for $2/share
03/18/2008
Federal Reserve cuts Fed Funds rate 75 bps to 2.25%
03/24/2008
JPMorgan increases price for Bear Stearns to $10 after shareholder dissent
03/28/2008
OFHEO allows Freddie Mac & Fannie Mae to raise $20 Billion
03/31/2008
Hank Paulson announces plan for regulatory overhaul
04/01/2008
Lehman raises $4 billion in capital.
04/16/2008
JPMorgan raises $6 billion in biggest sale of preferred stock
04/17/2008
Merrill reports $1.96 billion loss for Q1, cut 3,000 additional jobs
04/18/2008
Citigroup posts $5.1 billion loss in Q1, $13.9bn of writedowns, cut 9,000 jobs
04/21/2008
Bank of America's Q1-08 net income fall 77% on writedowns down to $1.21 billion
04/29/2008
Countrywide reports a loss of $893.1 million and declared 15 cent dividend.
04/30/2008
Fed cuts Fed Funds Rate 25bps to 2.00%
05/06/2008
Fannie Mae reports Q1 loss of $2.19 billion, cuts dividend
05/14/2008
Freddie Mac posts $151 million Q1 loss, will raise $5.5 billion in capital
06/09/2008
Lehman lost $2.8 Billion in Q2, seeks $6 billion in capital

© Society of Actuaries
87
07/13/2008
Paulson Seeks Authority to Shore Up Fannie, Freddie
07/15/2008
SEC announces a temporary ban on Naked Short Selling against 21 financial companies
07/17/2008
MERRILL LYNCH REPORTS 9.7 BILLION DOLLARS IN WRITEDOWNS
07/18/2008
Citigroup Reports Q2 loss of $.49 per share, $12.5 billion of writedowns
09/15/2008
Lehman Brothers declares bankruptcy, the largest ever in the United States
09/15/2008
Bank of America to buy Merrill Lynch for $29 per share
09/16/2008
Fed Takes Control of AIG in $85 Billion Bailout, Ousts Managers
09/17/2008
Barclays to buy Lehman U.S. units for $1.75 Billion
09/19/2008
SEC Temporarily Bans Short-Selling Of 799 Financial Stocks
09/20/2008
Money-Market Funds Get $50 Billion Backstop From U.S.
09/20/2008
Treasury Seeks Authority To Buy $700 Billion In Mortgage Assets
09/22/2008
Morgan Stanley to sell 20% stake to Mitsubishi UFJ
09/22/2008
Goldman and Morgan apply to become Bank Holding Companies
09/24/2008
U.S. Fed agrees to $30 billion swap with four central banks in Norway, Sweden, Denmark and Australia
09/24/2008
Goldman raises $10 billion, $5 billlion in stock, $5 billion from Buffett's Berkshire
09/24/2008
Libor jumps as banks seek cash to shore up finances
09/25/2008
Washington Mutual Seized by FDIC, JPMorgan to Buy Its Deposits
09/28/2008
Bush, Congressional Leaders Agree on Bank Rescue Plan
09/29/2008
U.S. House Rejects $700 Billion Financial-Rescue Plan
09/29/2008
Fed injects additional $630 billion into financial system to stoke lending
10/01/2008
U.S. Senate Approves $700 Billion Financial-Rescue Legislation
10/03/2008
Wells Fargo to Buy Wachovia for $15.1 Billion in Stock, Upending Citigroup
10/03/2008
Financial-Rescue Package Wins Final Approval With House Vote of 263 to 171
10/03/2008
U.S. Stocks Slide in Worst Week for S&P 500 Since 2001 Terrorist Attacks
10/06/2008
Fed Doubles Cash Sales to $900 Billion, Plans More Steps to Unlock Markets
10/08/2008
Fed, ECB, Central Banks Cut Rates in Coordinated Move
10/08/2008
AIG to Get Up to $37.8 Billion in Additional Liquidity From New York Fed
10/09/2008
Libor Dollar Rate Jumps to Highest in Year; Credit Stays Frozen
10/09/2008
U.S. Stocks Tumble, Sending Dow Below 9,000 for the First Time Since 2003
10/10/2008
FASB Approves Fair-Value Guidance, Avoids Flexibility
10/13/2008
Morgan Stanley Sells 21% Stake to Mitsubishi for $9 Billion of Preferred
10/13/2008
Fed Lets Europe Central Banks Offer Unlimited Dollars, Removes Swap Limits
10/15/2008
U.S. Stocks Plunge Most Since Crash of `87 on Recession Concern
10/15/2008
S&P May Downgrade $280.1 Billion of Alt-A Mortgage Debt Amid Delinquencies
10/15/2008
Oil Falls to 13-Month Low on Recession Concern, Equities Drop
10/16/2008
Industrial Output in U.S. Falls Most Since 1974
10/16/2008
Fed Discount Window Loans to Commercial Banks Reach Record $101.9 Billio
10/17/2008
Consumer Confidence in U.S. Falls Most on Record
10/21/2008
Fed Will Provide $540 Billion to Help Money-Market Funds Meet Redemptions
10/22/2008
CDO Downgrades Show $1 Trillion Bets on Corporate Debt Are Becoming Toxic
10/24/2008
PNC to Buy National City for $5.2 Billion With Funds From Treasury Program
11/07/2008
Jobless Rate In U.S. Jumps To 6.5%, Highest Since 1994, As Payrolls Tumble
11/10/2008
AIG Gets Expanded Bailout, Posts $24.5 Billion Loss
11/12/2008
Paulson Scraps Plan to Buy Troubled Assets, Shifts Focus to Consumer Loans
11/12/2008
GE Wins FDIC Insurance for Up to $139 Billion in Debt

© Society of Actuaries
88
11/13/2008
U.S. Jobless Claims Reach Seven-Year High of 516,000
11/14/2008
Freddie Mac Posts Record Loss, Asks Treasury for $13.8 Billion
11/15/2008
G-20 to Back Stimulus, Call for More Market Oversight
11/17/2008
G-20 Calls for `Broader Policy Response' to Stave Off Deep Global Downturn
11/20/2008
U.S. Economy: Jobless Claims Approach Highest Level Since 1982
11/20/2008
Senators Reach Bipartisan Deal to Aid U.S. Automakers
11/20/2008
Crude Oil Tumbles to Lowest Since May 2005 as Consumption Drops
11/21/2008
U.S. Stocks Rally as Obama Picks Tim Geithner to Head Treasury
11/24/2008
Citigroup Gets $306 Billion Loan Guarantee, $20 Billion of Government Cash
11/24/2008
Fed Pledges Exceed $7.4 Trillion to Ease Frozen Company Credit
11/24/2008
Goldman to Sell Bonds in First FDIC-Backed Offering
11/25/2008
Fed to Buy $600 Billion of GSE Debt, Set Up ABS Loan Program
11/25/2008
Fed Commits $800 Billion More to Unfreeze Lending
11/25/2008
Home Prices for 20 U.S. Cities Decline Most on Record
11/26/2008
Sales of New Houses in U.S. Fall to Lowest Level in 17 Year
12/02/2008
Bernanke Says Fed May Purchase Treasuries, Citing Reduced Rate-Cut Options
12/02/2008
U.S. Recession Began Last December, Making Contraction Longest Since 1982
12/02/2008
Manufacturing in U.S. Shrinks at Fastest Pace Since 1982 as Orders Slump
12/02/2008
Fed Extends Three Emergency Loan Programs to April From January
12/05/2008
China, U.S. Agree to Counter Credit Crisis, Pledge $20 Billion for Trade
12/05/2008
Employers in U.S. Cut 533,000 Jobs; Jobless Rate Rises to 6.7%
12/08/2008
American Express to Sell $5.25 Billion of FDIC Bonds
12/10/2008
Treasury Bills Trade at Negative Rates as Haven Demand Surges
12/11/2008
Brazil Announces $3.6 Billion Tax Cuts to Spur Growth
12/12/2008
Ecuador Will Not Make Payment on Bonds, Fall Into Default
12/12/2008
Bernard Madoff Charged by U.S. Prosecutors With Securities Fraud
12/16/2008
U.S. Consumer Prices Fall 1.7% in November; Core Rate Unchanged
12/16/2008
Goldman Sachs Posts First Loss, Succumbing to Credit Crisis
12/16/2008
Fed Cuts Rate to Zero-0.25%, Will Use All Tools
12/17/2008
Credit Crisis Cost Tops $1 Trillion With Morgan Stanley’s Loss
12/18/2008
Paulson May Seek Next $350 Billion in Financial-Rescue Funds
12/19/2008
GM and Chrysler Will Get $13.4 Billion in U.S. Loans
12/23/2008
U.S. Economy Contracted 0.5% Last Quarter, the Most Since 2001 Recession
12/24/2008
U.S. Initial Jobless Claims Rose 30,000 to 586,000 Last Week
12/29/2008
Holiday Sales Slump to Force U.S. Store Closings, Bankruptcies
12/30/2008
GMAC Gets $5 Billion Investment From Treasury to Help Revive Auto-Lending
12/30/2008
Home Prices in 20 U.S. Cities Tumbled 18% From Year Ago
12/31/2008
Fed Names Pimco, Blackrock, Wellington, Goldman Sachs in MBS Purchase Plan
01/01/2009
Merrill 95-Year Run Ends as Bank of America Buys Firm
01/02/2009
U.S. Manufacturing Shrinks at Fastest Pace Since 1980 as Recession Spreads
01/07/2009
ADP Says U.S. Companies Cut 693,000 Jobs in December
01/09/2009
U.S. Consumer Borrowing Falls Record $7.9 Billion as Credit Freeze Deepens
01/09/2009
Employers in U.S. Cut 524,000 Jobs; 2008 Losses Most Since 1945
01/14/2009
U.S. Retail Sales Decline for a Record Sixth Month
01/15/2009
Bank of America Gets $138 Billion Lifeline for Merrill Losses

© Society of Actuaries
89
01/16/2009
Citigroup Reports $8.3 Billion Loss, Split Into Two Businesses
01/20/2009
Canada Cuts Rate to Record 1%, Signals More Easing
01/22/2009
Thain Pushed Out at Bank of America After Merrill Loss Widens
01/26/2009
Fannie to Tap U.S. Treasury for as Much as $16 Billion in Aid
01/28/2009
FDIC May Run ‘Bad Bank’ in Obama Plan to Remove Toxic Assets
01/28/2009
Fed Keeps Benchmark Rate as Low as Zero, Says It's Ready to Buy Treasuries
01/30/2009
U.S. Economy Shrank 3.8% in Fourth Quarter, Most Since 1982
02/04/2009
Obama Orders $500,000 Pay Cap for Executives at Companies Getting Most Aid
02/06/2009
U.S. Jobless Rate Rises to 16-Year High of 7.6%; Payrolls Fall by 598,000
02/10/2009
Geithner Offers Up to $2 Trillion in U.S. Programs to Unlock Credit Market
02/13/2009
U.S. Congress Gives Final Approval to $787 Billion Stimulus
02/17/2009
Obama Signs Stimulus, Says Law Will Restore Jobs, Assure Growth
02/18/2009
GM Seeks Up to $16.6 Billion in New U.S. Aid, Plans 47,000 More Job Cuts
02/18/2009
Obama Pledges $275 Billion to Stem Foreclosures, Help Borrowers
02/24/2009
U.S. Consumer Confidence Collapsed to Record Low in February
02/25/2009
U.S. Banks Will Get Six Months to Raise Capital After Balance-Sheet Tests
02/26/2009
Obama’s Budget Proposes Up to $750 Billion More for Bank Aid
02/26/2009
Obama Seeks $1 Trillion Tax Increase in Budget Plan
02/27/2009
Citigroup Gets Third Bailout as Government Plans to Raise Stake
02/27/2009
U.S. Economy Shrank 6.2% in Fourth Quarter, Most Since 1982
03/02/2009
AIG Gets New Round of Government Aid as Insurer Reports $61.7 Billion Loss
03/06/2009
U.S. Unemployment Rises to 8.1%, Highest in 25 Years, as 651,000 Jobs Lost
03/12/2009
Warren Buffett’s Berkshire Has AAA Credit Rating Cut by Fitch
03/18/2009
Fed to Buy $300 Billion of Treasuries, Keeps Interest-Rate Range Unchanged
03/23/2009
U.S. Treasury Announces $1 Trillion Plan to Buy Distressed Debt
04/02/2009
FASB Eases Fair-Value Rules Amid Lawmaker Pressure
04/02/2009
G-20 Agrees to Regulatory Crackdown, Pledges $1 Trillion for World Economy
04/06/2009
Bank of England, ECB, SNB Agree on Currency Swaps to Give Fed Liquidity
04/13/2009
Goldman Sachs Raises $5 Billion in Share Sale to Repay Treasury TARP Funds
04/22/2009
U.S. 10-Year Yield Touches Highest Since Fed Announced Buyback
04/24/2009
Fed Stress-Test Methods Stop Short of Signaling Capital Need
04/28/2009
U.S. Consumer Confidence Jumps, Home-Price Drop Slows in Evidence of Shift
04/29/2009
Fed Finds at Least Six of 19 Biggest U.S. Banks Need to Raise More Capital
04/30/2009
Chrysler Files for Bankruptcy to Seal Fiat Accord
05/01/2009
Consumer Confidence in U.S. Advances to Highest Level Since September 2008
05/07/2009
Fed Finds 10 U.S. Banks Need Total Capital of $74.6 Billion
05/07/2009
Citigroup to Raise $5.5 Billion By Expanding Equity Exchange
05/08/2009
Wells Fargo, Morgan Stanley Raise $15 Billion After Stress Test
05/15/2009
Prudential, Allstate, Four More Insurers to Get TARP Capital From Treasury
05/21/2009
GMAC Gets $7.5 Billion From Treasury to Fund Chrysler Loans, Boost Capital
05/21/2009
BankUnited Is Closed by Regulators in Largest U.S. Bank Failure This Year
05/26/2009
U.S. Consumer Confidence Jumps by Most in Six Years
05/27/2009
Chrysler Said to Near Bankruptcy Exit in Confidence Boost for GM Overhaul
05/27/2009
GM Bondholders Reject Offers to Swap Debt for Equity, Hastening Bankruptcy
Source: Bloomberg

© Society of Actuaries
90
Appendix B. Federal Funds Target Rate Reductions Since the Beginning of Crisis
Date
Prior Rate
New Rate
Reduction (bps)
09/18/2007
5.25
4.75
-50
10/31/2007
4.75
4.50
-25
12/11/2007
4.50
4.25
-25
01/22/2008
4.25
3.50
-75
01/30/2008
3.50
3.00
-50
03/18/2008
3.00
2.25
-75
04/30/2008
2.25
2.00
-25
10/08/2008
2.00
1.50
-50
10/29/2008
1.50
1.00
-50
12/16/2008
1.00
0.25
-75
Source: Bloomberg

© Society of Actuaries
91
Appendix C. Government Relief Program Worldwide
Country
Authorized
Program Size
(in BLNs)
Initial Date of
Eligibility
Final Date of
Eligibility
Term of
Guarantee
Canada - CLAF
No Limit
11/1/2008
4/30/2009
3 years
France
EUR 320
10/16/2008
12/31/2009
5 years
Germany
EUR 400
10/17/2008
12/31/2009
5 years
Italy
Not Disclosed
Not Disclosed
12/31/2009
5 years
Japan - BOJ
JPY 1000
Not Disclosed
4/30/2010
Not Disclosed
Japan - JBIC - OIL
Not Disclosed
1/27/2009
3/31/2010
Not Disclosed
Japan - JBIC - S/C
Not Disclosed
1/27/2009
3/31/2010
Not Disclosed
U.K. - Asset-backed
Securities Guarantee Scheme
GBP 50
4/22/2009
9/22/2009
* Up to 5 years
U.K. - Asset Protection
Scheme
Not Disclosed
2/26/2009
3/31/2009
Not Disclosed*
U.K. - Asset Purchase Facility GBP 150
2/13/2009
Not Disclosed
Not Disclosed
U.K. - CGS
GBP 250
10/13/2008*
12/31/2009
3 years
U.S. - CAP
No Limit
2/25/2009
5/25/2009
Up to 7 years
U.S. - CPFF
No Limit
10/27/2008
10/30/2009
90 days
U.S. - TLGP
No Limit
11/21/2008
10/31/2009
6/30/2012
U.S. - TALF
USD 1000*
1/1/2009
12/31/2009
3 years
U.S. - TARP
USD 700
10/14/2008
Not Disclosed
Not Disclosed
Australia
No Limit
11/28/2008
Not Disclosed
5 years
Austria
EUR 100
10/20/2008
12/31/2009
5 years
Belgium
Not Disclosed
Not Disclosed
10/31/2009
10/31/2011
Denmark - Danish Act on
Capitalization
DKK 100
2/3/2009
6/30/2009
Not Disclosed
Denmark - Financial Stability
Act
DKK 100
10/05/2008*
9/30/2009
09/30/2010*
Finland
EUR 50
Not Disclosed
12/31/2009
5 years
Greece
EUR 28
12/30/2008
12/31/2009
1 to 3 years
Hong Kong
HKD 10
12/15/2008
6/15/2009
6/30/2012
Hungary
HUF 600
Not Disclosed
Not Disclosed 90 days to 5 years
Indonesia
Not Disclosed
10/15/2008
Not Disclosed
90 to 180 days
Ireland
EUR 485
09/30/2008*
9/29/2010
9/20/2010
Netherlands
EUR 200
10/23/2008*
12/31/2009
3 years
New Zealand
No Limit
11/1/2008
Not Disclosed
5 years
Portugal
EUR 20
10/23/2008
12/31/2009
3 years*
Singapore
SGD 2.3
12/1/2008
Not Disclosed
1 year
Slovenia
EUR 1.2
Not Disclosed
12/31/2010
1 to 10 years
South Korea
USD 100
10/20/2008
12/31/2009
5 years
Spain
EUR 100
10/13/2008
12/31/2009
3 years*
Sweden
SEK 1500
10/29/2008
4/30/2009
5 years*
UAE
USD 4.36
2009 Q1
Not Disclosed
Not Disclosed
Source: Bloomberg

© Society of Actuaries
92
Appendix D. Breakdown of Worldwide Insurer Asset Write-Downs Since 2007
(Worldwide insurer asset write-down from Jan 2007 through Jun 2009 totals about $242 billion,
of which about $54 billion or 22% are mortgage related. – Bloomberg)
Insure rs Asse t Write down By Asse t Type ($ in Billion, Jan07-
Jun09)
SIV, $0.4, 0%
Monol i ne , $1.0, 0%
Le ve rage d
Loan /C LO , $1.0, 0%
Mortgage , $53.8,
23%
Un spe ci fi e d, $16.7,
7%
C DO , $20.7, 9%
C MBS, $30.0, 12%
ABS (Non-Mtg),
$34.5, 14%
C orp, $37.5, 15%
C DS , $47.3, 20%
Insure rs Mtg Write down By Mtg Type ($ in Billion, Jan07-Jun09)
MTG O th e r, $13.4,
25%
Su bpri me , $1.8, 3%
Al t-A, $1.2, 2%
Pri me Mtg, $0.5, 1%
Re si de nti al Mtg,
$36.9, 69%
Source: Bloomberg

© Society of Actuaries
93
Appendix E. Breakdown of Worldwide Insurer Capital-Raising Since 2007
(Worldwide insurer capital-raising
from Jan 2007 through Jun 2009
totals about $137 billion, of
which $73 billion or 54% are from governments. – Bloomberg)
Insure rs Capital Raise d By Capital Type ($ in Billion, Jan07-Jun09)
C api tal
note s/se curi ti e s,
$2.7, 2%
Pre fe rre d, $78.5,
58%
O the r, $3.0, 2%
Pe rpe tual Pre fe rre d
Stock, $3.1, 2%
Asse t Sal e , $7.5, 5%
C onve rti ble bond,
$6.7, 5%
C ommon
Stock/Rights, $17.5,
13%
Subordi nate d/Pe rpe t
ual Bond, $17.8, 13%
Insure rs Capital Raise d By Capital Provide r ($ in Billion, Jan07-
Jun09)
Publ i c O ffe ri n g,
$30.5, 22%
Pri vate Pl ace me nt,
$19.7, 14%
Strate gi c Buye r,
$13.2, 10%
Gove rnme nt, $73.4,
54%
Source: Bloomberg
Wyszukiwarka
Podobne podstrony:
Testing and Fielding of the Panther Tank and Lessons for Force XXI
OECD The Financial Crisis, Reform and Exit Strategies (2009)
OECD The Financial Crisis, Reform and Exit Strategies (2009)
Questions and Answers about the Financial Crisis
[Mises org]Mises,Ludwig von The Causes of The Economic Crisis And Other Essays Before And Aft
the impacct of war and financial crisis on georgian confidence in social and governmental institutio
Financial analysis of the cultivation of poplar and willow for bioenergy Belgia 2012
Applications and opportunities for ultrasound assisted extraction in the food industry — A review
Perfect Phrases for the TOEFL Speaking and Writing Sections
Cuba and the Missile Crisis
Student Roles and Responsibilities for the Masters of Counsel
DOMA Repeal and the Same sex Marriage Good for Business
new media and the permanent crisis of aura j d bolter et al
Applications and opportunities for ultrasound assisted extraction in the food industry — A review
Wicca Book of Spells and Witchcraft for Beginners The Guide of Shadows for Wiccans, Solitary Witche
Herbs and Spices for the Home Garden h 221
The Beatles Hey Jude song chords and lyrics for guitar music downloads pdf
więcej podobnych podstron