
Archives of Psychiatry and Psychotherapy, 2014; 1: 47–54
Andrzej Śliwerski: Institute of Psychology, University of Łódź. Cor-
respondence address: andrzej.sliwerski@uni.lodz.pl
Psychometric properties of the Polish version of the
Cognitive Triad Inventory (CTI) – preliminary study
Andrzej śliwerski
Summary
Aim of the study. The aim of this study was to translate and evaluate the Polish version of the Cognitive
Triad Inventory (CTI), an instrument developed to measure the cognitive triad conceptualized by Beck as
an important variable in depression.
subject or material and methods. A sample of N=86 adults included depressed, non-depressed
and prisoners completed a survey test battery comprised of CTI, CES-D, and STAI.
Results: This study provided evidence for the reliability and validity of the Polish CTI. Exploratory factor
analysis showed the one-factor model to best fit the data, as in the American version.
discussion. The division into self, world, and future is an unwieldy taxonomy with highly overlapping
categories. Because the three-factor model did not fit the data very well it is suggested that it would be
reasonable to label that one CTI factor “Self-Relevant Negative Attitude”.
Conclusions, This study examined the psychometric properties and factor structure of the CTI on both
clinical and nonclinical samples, and confirms that CTI may be used to measure the cognitive triad. Eval-
uation of suicidal ideation was also discussed.
psychometric properties / depression / cognitive triad / suicide
INTRODuCTION
Depression is the leading cause of disability
worldwide, and is a major contributor to the glo-
bal burden of disease. Globally, more than 350
million people of all ages suffer from depression
[1]. One of the most empirically supported eti-
ological models of depression is the cognitive
vulnerability-stress model, which has its origins
in the theory of depression developed by Aar-
on Beck [2].
Beck proposed that an individual develops
a self-concept, which reflects their representa-
tions of the self, world, and future based on on-
going patterns of everyday noxious experiences
with family members and peers during child-
hood. Such a self-concept is solidified either by
repeated negative experiences or experiences in-
terpreted in ways that are consistent with this
self-schema. While a negative cognitive style
may lie dormant, significant life stress can ac-
tivate an individual’s negative self-schema, in-
fluencing information processing, and causing
external stimuli to be screened, coded and eval-
uated within the framework of this schema [3].
According to this theory, the cognitive system
consists of different levels of cognition: the cog-
nitive triad, faulty information processing, and
schemas.
The self-schema exerts a significant influence
on information processing by selectively screen-
ing what information is extracted from both in-
ternal and external sources, and affecting both
the encoding and retrieval of information. Neg-
ative cognitive schemas, when activated, are the
basis for a negative view of the self, world, and
future. Such negative views are called the cogni-

48
Andrzej Śliwerski
Archives of Psychiatry and Psychotherapy, 2014; 1: 47–54
tive triad of depression. The cognitive triad man-
ifests itself in negative automatic thoughts and
causes an individual’s perception and thinking
to be distorted in a negative way. There is strong
empirical support for both the cognitive triad [4]
and a negative cognitive style as vulnerability
factors for depression [5].
Assuming that the cognitive triad is a key fac-
tor of depression, Beckham at al. [6]
developed
an instrument for measuring it. The Cognitive
Triad Inventory (CTI) consists of 36 items com-
prising three scales reflecting the three major
aspects of the triad: View of the Self, View of
the World and View of the Future. Constructing
their inventory, Beckham et al. [6] left only items
with an item-scale correlation higher than r<.25.
The American version of the CTI shows excellent
internal consistencies (Cronbach’s alpha from .81
to 0.95) and high correlations with the Beck De-
pression Inventory (BDI).
There are many diagnostic scales in Poland de-
signed to identify depressed patients [7]. Some
of them are self-rating scale like Beck Depression
Inventory [8], The Centrum of Epidemiologic
Studies – Depression Scale [9] or Brief Self-Rat-
ing Scale of Depression and Anxiety [10]. Anoth-
er are checklists scales like Hamilton Depression
Rating Scale [8] or Montgomery-Asberg Depres-
sion Rating Scale [8]. There are also depression
subscales in global functioning scales (e.g. Gen-
eral Health Questionnaire [11]). However, in Po-
land, there are lack of standardized assessment
instruments to measure the various aspects of
depressed functioning, especially the cognitive
triad. To close this gap, this study evaluated the
Polish version of the CTI on a clinical and non-
clinical sample.
1. METhOD
1.1 Translation
A bilingual translator translated the Cognitive
Triad Inventory into Polish. Subsequently, the
Polish version of the inventory was translated
back into English. The differences between the
translations were analyzed. In the final version
of the inventory, only item 2 was changed, from
negative to positive phrasing. This was done to
avoid double negation, which would make it
more difficult for the respondents to answer the
question. As this item is not part of any scale,
this did not change the arrangement of items in
any way as compared to the English version.
1.2. Participants
A sample of N=86 adults completed a battery
of self-report techniques. The subjects included
29 depressed patients from the Central Clinical
Hospital in Lodz, 29 prisoners from Prison No.
1 in Lodz, and 28 undergraduate students. The
mean age was 32.94 (SD=12.58) with a span of
19 to 65 years. Participants 25 years of age or
younger comprised 34.9% of the sample, 32.5%
of the sample was between 26 and 36 years of
age, and 32.6% was over 37 years of age. The
groups significantly differed in terms of age,
with the undergraduate students being much
younger (M=25.79; SD=9.073) than both the de-
pressed patients (M=35.28; SD=13.62) and pris-
oners (M=37.52; SD=11.72). Females comprised
58.1% (n=50) of the sample.
Undergraduate students were recruited by an
in-class presentation, while prisoners and pa-
tients by personal invitation. Participants com-
pleted a survey test battery comprised of CTI,
CES-D, and STAI. Four weeks after taking the
survey, fifty-eight participants were asked to
complete the same test battery again. Fifty-six
returned a second response. Questionnaires
were filled in individually, either at a universi-
ty or hospital/prison laboratory. Informed con-
sent was obtained and none of the participants
received credit for participation. Six participants
who did not fill in all inventories were exclud-
ed from the survey.
1.3. Measures
The Cognitive Triad Inventory (CTI) consists
of 36 items and comprises three scales: View of
the Self, View of the World, and View of the Fu-
ture [6]. Each scale consists of 10 items keyed in
both positive and negative directions (30 items
are scored and 6 serve as fillers). Individuals are
asked to rate how the item applies to them at the
time of testing on a 7-point Likert scale. Neg-
atively phrased items were reverse coded in a

Psychometric properties of the Polish version of the Cognitive Triad Inventory (CTI)
49
Archives of Psychiatry and Psychotherapy, 2014; 1: 47–54
way that high scores represented positive views
and low scores represented negative views.
The Center for Epidemiologic Studies – De-
pression Scale (CES-D) measures self-reported
symptoms associated with depression experi-
enced in the past week. The CES-D includes 20
items comprising six scales reflecting the major
dimensions of depression: depressed mood, feel-
ings of guilt and worthlessness, feelings of help-
lessness and hopelessness, psychomotor retar-
dation, loss of appetite, and sleep disturbance
[12]. Response categories indicate the frequen-
cy of occurrence of each item, and are scored on
a 4-point scale ranging from 0 (rarely or none
of the time) to 3 (most or all of the time). Total
scores range from 0 to 6, with higher scores rep-
resenting more depressive symptoms. The Polish
version of the CES-D showed excellent internal
consistency (α=0.90) [9].
The State/Trait Anxiety Inventory (STAI) is an
instrument for measuring anxiety in adults [13].
STAI includes 40 items comprising two scales:
State Anxiety (X1), as a temporary condition, and
Trait Anxiety (X2) as a more general and long-
standing quality. Each scale consist of 20 items
scored on a 4-point scale. Scores range from 20
to 8, with higher scores correlating with greater
anxiety. The Polish version of the STAI showed
excellent internal consistency, ranging from 0˝
.83 to 0.92 for the X1 scale, and from 0.86 to 0.92
for the X2 scale.
2. RESuLTS
2.1. Means and Standard Deviations
Means, standard deviations, and item-scale
correlations for each item of the CTI were shown
in Table 1 – next page. All items demonstrated an
item-scale correlation with their scale of r≥0.46
and lower correlations with the other two scales.
Two items from the View of the World scale
showed the highest correlations with a differ-
ent scale, that is, item 24 (r=0.53 for the View of
the Future compared to r=0.52 for its scale) and
item 34 (r=0.60 for the View of the Self compared
to r=0.53 for their own scale). In spite of such
scores, the following analyses were calculated
with both items as part of their original scales,
as in the English version of the CTI.
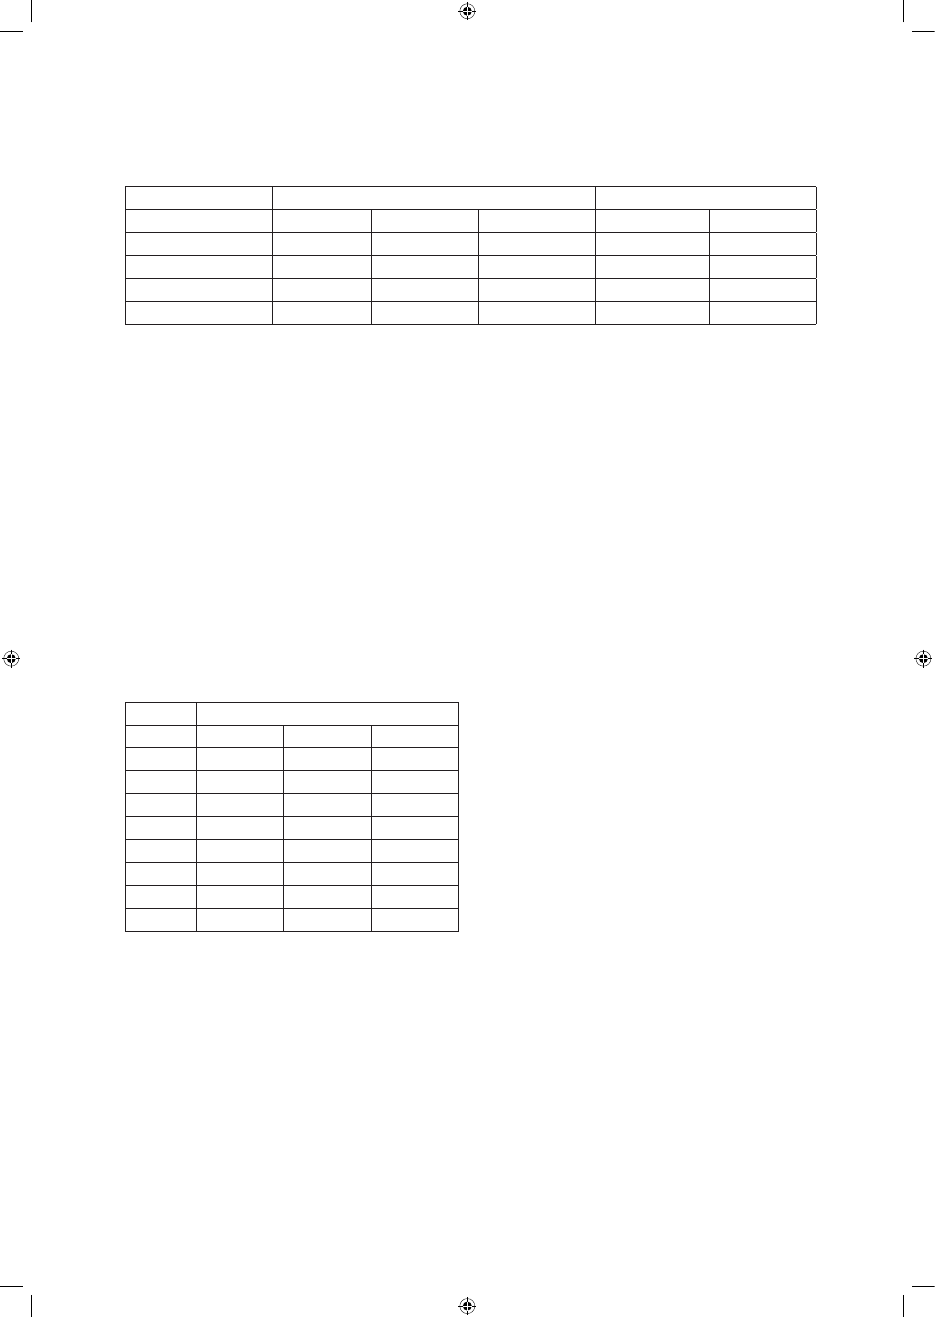
Correlation coefficients were calculated to as-
sess how strongly the subscales were associated
with each other. The correlations between the
subscales ranged from 0.728 to 0.843 (see Table
2 – next page). They were very high, but also very
similar to those observed in other studies (e.g.,
[14]). This might suggest that the triad refers to
views of the self as a whole and to two aspects
of that self – the self’s world and the self’s fu-
ture [4].
2.2. Factor analysis
High correlations between the subscales sug-
gested that a single underlying dimension might
be present. To determine whether the three-fac-
tor model would fit the present CTI data, ex-
ploratory factor analysis (EFA) was employed.
Seven factors scored eigenvalues of over 1, ac-
counting for 70.11% of the total variance ex-
plained. However, according to Cattell’s scree
test, only the first two factors lay above the de-
bris. The first factor had an eigenvalue of 12.83
(total variance explained 42.79%) and the sec-
ond factor had an eigenvalue of 2.18 (total vari-
ance explained 54.91%). The one-factor solution
resulted in two items with a factor correlation
lower than 0.4 [15]. Both items originally came
from the View of the World scale (items 18 and
30). The two-factor solutions, developed with
oblimin rotations, showed that one factor con-
sisted of View of the Self and View of the Fu-
ture items, and the second factor consisted of
View of the World items. However, factor load-
ings for the second factor were not satisfactory
(see Table 1). After considering the two-factor
solution (using oblimin rotations, residual cor-
relation and interpretability), the one-factor so-
lution emerged as the most suitable for psycho-
logical interpretation.
2.3. Reliability estimation
Internal consistency of the scales and the to-
tal CTI score was assessed by applying Cron-
bach’s alpha. The alpha coefficients of original
CTI ranged from 0.81 to .93 for the subscales and
amounted to 0.95 for the overall score. Reliabil-
ity analysis revealed that internal consistencies

50
Andrzej Śliwerski
Archives of Psychiatry and Psychotherapy, 2014; 1: 47–54
Table 1.
Descriptive statistics, intercorrelations and factor loadings
1
Correlations with the original scale (View of the Self, View of the World, or View of the Future); * item had a higher intercorre-
lation with another scale than with its own scale; sn – self negative item; sp – self positive item; wn - world negative item;
wp – world positive item; fn – future negative item; fp – future positive item.
Mean and Standard
Deviation
Item-Scale
Correlation
Factor Loadings
One-Factor Solution
Factor Loadings
Two-Factor Solution
Variables
M
SD
Subscale
Correlation
1
Total Scale
Correlation
1
1
2
CTI 3(wp)
4.81
1.62
0.680
0.490
0.461
0.527
CTI 5(sn)
5.41
1.73
0.834
0.798
0.810
0.786
CTI 6(fp)
5.53
1.78
0.767
0.702
0.726
0.786
CTI 8(wp)
5.65
1.13
0.586
0.505
0.511
0.234
CTI 9(fp)
5.35
1.45
0.796
0.702
0.726
0.781
CTI 10(sn)
4.80
1.77
0.460
0.435
0.401
0.332
CTI 11(fp)
5.42
1.61
0.867
0.805
0.829
0.867
CTI 12(wp)
4.67
1.75
0.597
0.600
0.587
0.499
CTI 13(sn)
5.66
1.36
0.757
0.719
0.724
0.659
CTI 15(fn)
5.50
1.67
0.730
0.654
0.656
0.646
CTI 16(fn)
3.62
1.92
0.650
0.594
0.581
0.563
CTI 17(sp)
5.05
1.54
0.683
0.674
0.688
0.694
CTI 18(wn)
4.98
1.86
0.563
0.395
0.331
0.749
CTI 19(fn)
5.05
1.84
0.742
0.711
0.699
0.638
CTI 20(wp)
5.94
1.22
0.537
0.519
0.527
0.202
CTI 21(sn)
5.41
1.91
0.790
0.755
0.760
0.738
CTI 23(wn)
4.63
1.80
0.717
0.634
0.598
0.709
CTI 24(wp)
5.30
1.92
0.523*
0.537
0.543
0.202
CTI 25(sp)
5.40
1.37
0.808
0.778
0.811
0.830
CTI 26(fn)
5.36
1.89
0.734
0.682
0.672
0.625
CTI 27(wn)
5.86
1.63
0.489
0.463
0.450
0.408
CTI 28(fp)
5.19
1.41
0.777
0.739
0.770
0.816
CTI 29(sn)
3.92
2.07
0.643
0.578
0.543
0.444
CTI 30(wn)
4.79
1.77
0.597
0.442
0.391
0.727
CTI 31(sp)
5.40
1.35
0.789
0.779
0.801
0.801
CTI 32(fn)
5.34
1.62
0.688
0.724
0.717
0.631
CTI 33(sp)
5.15
1.65
0.827
0.793
0.814
0.832
CTI 34(wp)
5.31
1.52
0.532*
0.596
0.618
0.299
CTI 35(sn)
4.02
1.75
0.706
0.642
0.635
0.594
CTI 36(fp)
5.50
1.41
0.806
0.768
0.795
0.836
are lower in the Polish version, especially for the
View of the World scale. Cronbach’s alpha for
this scale is 0.77, which is still above the criterion
of 0.70 recommended for measurement instru-
ments. The removal of any items from this scale
did not improve Cronbach’s alpha score (it did
not exceed 0.77). Internal consistency was high
in the scales View of the Self (α=0.895) and View
of the Future (α=0.912). Finally, the coefficient
for the total CTI score (α=0.948) indicated a high
level of internal consistency (see Table 2).
Psychometric properties of the Polish version of the Cognitive Triad Inventory (CTI)
51
Archives of Psychiatry and Psychotherapy, 2014; 1: 47–54
Table 2. Intercorrelation between subscales and reliability coefficients
Intercorrelation
Reliability
Variables
Overall Scale
View of the Self
View of the World Cronbach’s alpha
rtt
Full scale
0.948
0.831
View of the Self
0.950
0.895
0.827
View of the World
0.887
0.781
0.777
0.815
View of the Future
0.937
0.843
0.728
0.912
0.779
The four-week test-retest reliability of the CTI
was examined using interclass correlation coef-
ficients (ICC). According to the results, tempo-
ral stability at 4 weeks was very good, from 0.78
to 0.83, with 0.83 for the overall score. These re-
sults suggest that the cognitive style of thinking
is stable over time both in clinical and nonclin-
ical samples.
2.4. Concurrent Validity
A correlation matrix was constructed to eval-
uate the concurrent validity of the CTI (see Ta-
ble 3).
with the anxiety as a state scale was lower (r=-
0.61, p<0.000).
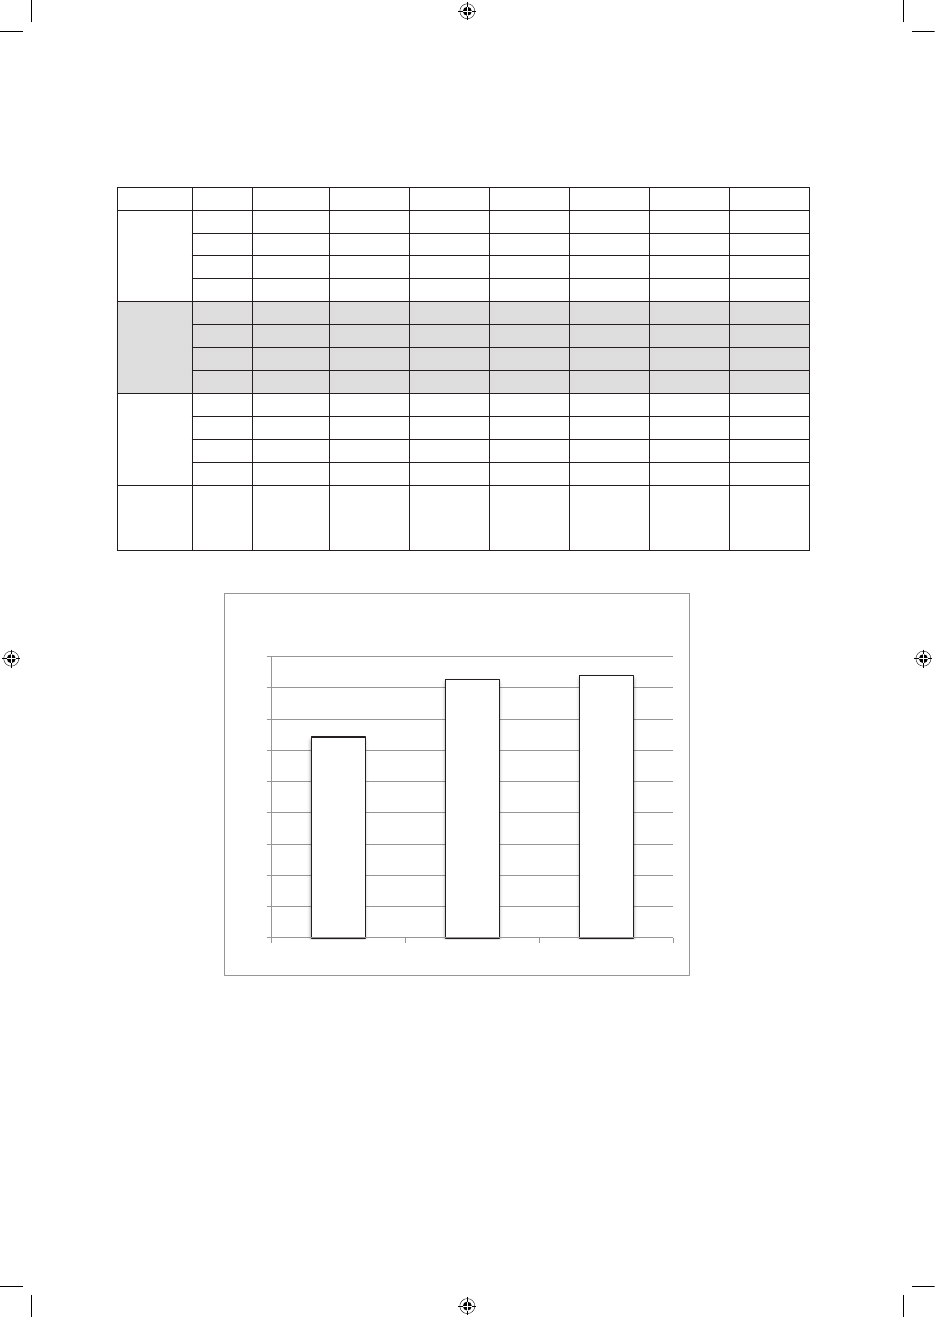
The outcomes of the study suggest that the de-
pressed individuals and prisoners should have
lower scores on the CTI scale. Indeed the results
of one-way analysis of variance and Tukey’s post
hoc analysis show that the depressed individu-
als scored significantly lower on all CTI scales
than the prisoners and students (see Table 4 and
Figure 1 – next page). Similarly, the prisoners had
lower scores on the CTI scales than the students,
but the differences were not statistically signifi-
cant. Unexpectedly, the prisoners scored higher
(but not significantly so) on the View of the Fu-
ture scale than the students. For all variables, the
effect size, calculated by eta squared, was low to
moderate. To determine the difference between
clinical and nonclinical samples, a t-test for in-
dependent samples was performed on the data.
Nonclinical sample had lower scores on CTI To-
tal score (t(55)=5.137; p<0.000; Cohen’s d=1.38),
the View of the Self scale (t(55)=4.706; p<0.000;
Cohen’s d=1.26), the View of the World scale
(t(55)=4.333; p<0.000; Cohen’s d=1.16) and on the
View of the Future scale (t(55)=5.005; p<0.000;
Cohen’s d=1.34). The effect size for these com-
parisons was very high.
There were also significant differences be-
tween subjects with suicidal ideations (M=117.92;
SD=23.318) and those without them (M=160.89;
SD=28.166) in the CTI total score (t(83)=5.181;
p<0.000; Cohen’s d=1.56). In terms of the sub-
scales, the biggest differences between subjects
with and without suicidal ideations were found
on the View of the Self scale (t(83)=5.226; p<0.000;
Cohen’s d=1.57) and on the View of the Future
scale (t(83)=4.741; p<0.000; Cohen’s d=1.42). Dif-
ferences in the View of the World scale were also
significant (t(83)=4.017; p<0.000; Cohen’s d=1.21).
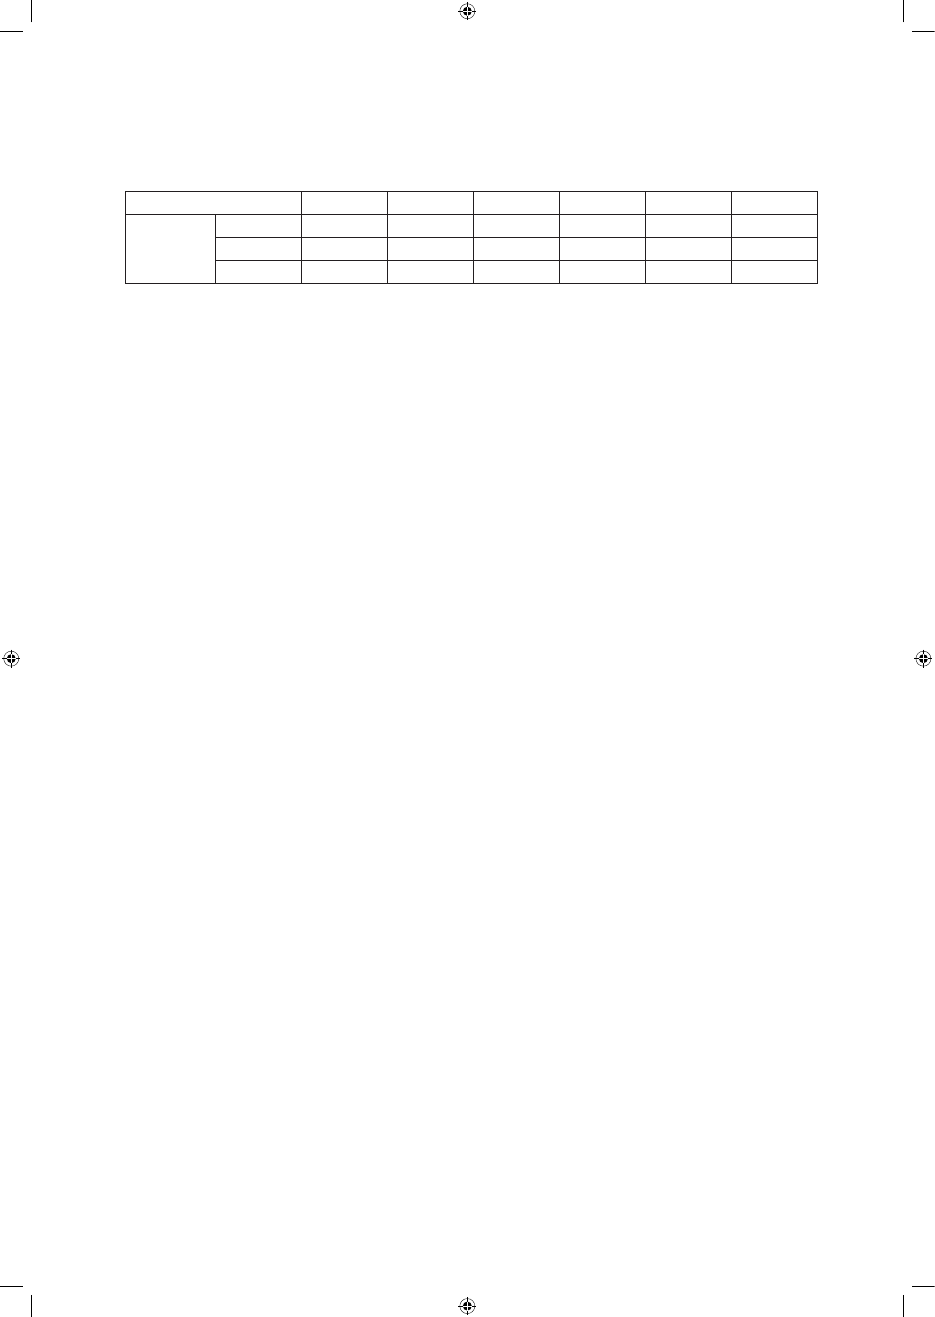
In exploratory logistic regression analysis, the
only significant factor was the CTI total score,
Table 3. Correlation of the CTI with the CES-D and the STAI
scales
All correlations are significant at p<0.000. VS – View of the
Self; VW – View of the World; VF – View of the Future;
TS – CTI total score; t1 – first measurement; t2 – second
measurement (four weeks after the first one).
Measures of Depression and Anxiety
CTI Scale
CES-D
STAI-1
STAI-2
VS t1
-0.689
-0.563
-0.769
VS t2
-0.747
-0.627
-0.809
VW t1
-0.706
-0.616
-0.769
VW t2
-0.763
-0.613
-0.728
VF t1
-0.645
-0.547
-0.711
VF t2
-0.616
-0.615
-0.629
TS t1
-0.73
-0.617
-0.805
TS t2
-0.772
-0.678
-0.795
The correlation between the CTI and the CES-D
was strong (r=-0.73, p<0.000). All three subscales
of the CTI had very similar correlations with the
depression scale, varying from -0.64 to -0.70.
Similarly, the correlations between the CTI and
the anxiety as a trait scale of the STAI was very
high (r=-0.80 p<0.000). As predicted, correlations
52
Andrzej Śliwerski
Archives of Psychiatry and Psychotherapy, 2014; 1: 47–54
Table 4. Concurrent Validity
VS – View of the Self; VW – View of the World; VF – View of the Future; TS – CTI total score
Figure 1. Mean CTI Total Score in three different groups
CES-D
STAI-1
STAI-2
VS
VW
VF
TS
Patients
M
32.21
51.52
57.19
41.10
46.14
41.38
128.62
SD
13.70
13.65
8.16
1.84
8.42
9.175
24.38
Min
1
20
40
17
30
22
71
Max
51
76
73
58
61
57
171
Prisoners
M
18.66
43.31
44.25
54.31
53.14
58.17
165.62
SD
12.41
11.90
1.09
6.89
7.58
7.56
19.09
Min
0
27
25
38
32
38
115
Max
49
67
66
64
68
70
200
Students
M
11.89
33.93
39.56
55.39
56.46
56.14
168.00
SD
11.91
8.67
1.31
12.06
9.55
12.85
32.99
Min
1
20
24
20
30
19
75
Max
48
55
67
70
67
70
205
ANOVA
F (p)
η2
18.963
(p<0.000)
0.314
17.362
(p<0.000)
0.282
24.559
(p<0.000)
0.383
16.963
(p<0.000)
0.299
1.892
(p<0.000)
0.208
23.926
(p<0.000)
0.366
20.715
(p<0.000)
0.333
128,61
165,61
168,00
0
20
40
60
80
100
120
140
160
180
Patients
Prisoners
Students
CTI Total Score
while the CES-D was not (as shown in Table 5 –
next page). The overall prediction accuracy was
87%, with 95.8% of the subjects correctly classi-
fied as not suicidal (sensitivity) and 38.5% of su-
icidal subjects correctly identified as such (spe-
cificity), which is still insufficient for the test to
be used for diagnostic purposes.
3. DISCuSSION
Item analysis showed the Polish CTI items to
have similar psychometric properties to those
on the American CTI. All items demonstrated
high item-scale correlation with their scales and
with the total score, and very high correlations
Psychometric properties of the Polish version of the Cognitive Triad Inventory (CTI)
53
Archives of Psychiatry and Psychotherapy, 2014; 1: 47–54
Table 5. Logistic Regression Models Discriminating Between Suicidal and Non-Suicidal Tendencies
B
SE
Wald
df
p Level
Exp(B)
Block 1
CTI (TS)
-0.33
0.015
4.555
1
0.033
0.968
CES-D
0.058
0.033
3.096
1
0.78
1.060
Constant
1.166
2.711
0.185
1
0.677
3.210
between subscales (from 0.728 to 0.843). Further-
more, explanatory factor analysis revealed that
the one-factor model is the most suitable for psy-
chological interpretation. These results are very
similar to those reported from other studies, all
of which failed to confirm the three-factor mod-
el [16]; [17]. Haaga et al. [4] stated that the divi-
sion into self, world, and future is an unwieldy
taxonomy with highly overlapping categories. In
the cognitive triad what is negatively perceived
is the future of the self rather than the future
as such. The depressed person “anticipates that
his current difficulties or suffering will contin-
ue indefinitely ... when he considers undertak-
ing a specific task in the immediate future, he ex-
pects to fail” [2]. The world construct also incor-
porates the view of the self rather than a judg-
ment about the world at large. Beck claimed that
a depressed person “sees the world as making
exorbitant demands on him and/or presenting
insuperable obstacles to reaching his life goals.”
[2] Haaga et al. concludes that “the triad refers
to views of the self as a whole and two aspects
of the self, not three completely distinct entities.”
[4] Accordingly, McIntosh and Fischer showed
that the three-factor model did not fit the data
very well. They suggested that it would be rea-
sonable to label that one CTI factor “Self-Rele-
vant Negative Attitude.” [17]
However, even though Anderson and Skid-
more [16] and Pössel [14] could not confirm the
three-factor model either, they showed the six-
factor model to fit the data better than the other
models. The above-mentioned authors conclud-
ed that their studies confirmed Beck’s three-fac-
tor model, with item phrasing (negative vs. pos-
itive) being a significant variable influencing the
factor structure. The Polish version of the CTI
did not fit the six-factor model.
The four-week retest reliability was very good,
which means that CTI scores are stable both in
the clinical and nonclinical samples. This study
also showed that the CTI is a valid instrument.
The correlations between the CTI and both de-
pression and anxiety inventories were very high.
There were also significant differences between
clinical, nonclinical, and prison samples. Final-
ly, this study revealed significant differences in
the CTI total score for persons with suicide ide-
ations. Furthermore, the CTI predicted suicidal
tendencies better than the CES-D score.
4. LIMITATIONS
The present study, just as any other, has a
number of limitations. The main limitation is
linked to the small study group. Even though the
results obtained are very similar to those report-
ed for other language versions, given the study
group one should draw conclusions cautiously.
It must also be remembered that all studies on
the CTI (except the one conducted by the authors
of the inventory [6]) have been done on non-clin-
ical groups, usually comprised of students. An-
other major limitation due to the small sample is
the fact that it was impossible to carry out con-
firmatory factor analysis. The exploratory analy-
sis used in the present study could not fully de-
termine the factor loadings of the inventory. In
the future, it would be extremely useful to verify
whether the inventory is consistent with Beck’s
theory. Such verification would be particularly
important in light of the fact that there still re-
mains controversy in international research as to
the number of CTI factors and their goodness of
fit to the cognitive triad model.
REFERENCES
1. http://www.who.int [homepage on the Internet]. Depression.
Fact sheet Nº369. [Access: 18.05.2013]. Available from:
http://www.who.int/mediacentre/factsheets/fs369/en/index.
html.
CTI (TS) – Total Score scale of CTI

54
Andrzej Śliwerski
Archives of Psychiatry and Psychotherapy, 2014; 1: 47–54
2. Beck AT, Rush JA, Shaw BF, Emery G. Cognitive therapy of
depression. New York: Guilford Press; 1979.
3. Ingram RE, Miranda J, Segal ZV. Cognitive Vulnerability to
Depression. In: Alloy LB, Riskind JH, editors. Cognitive Vul-
nerability to Emotional Disorders. London, New Jersey: Law-
rence Erlbaum Associates; 2006.
4. Haaga DA, Dyck MJ, Ernst D. Empirical status of cognitive
theory of depression. Psychol Bull. 1991; 110(2): 215–236.
5. Alloy LB, Riskind JH, editors. Cognitive Vulnerability to Emo-
tional Disorders. London, New Jersey: Lawrence Erlbaum
Associates; 2006.
6. Beckham EE, Leber WR, Watkins JT, Boyer JL, Cook JB.
Development of an instrument to measure Beck’s cognitive
triad: The Cognitive Triad Inventory. J Consult Clin Psych.
1986; 54(4): 566–567.
7. Siwek M, Grabski B. Psychiatryczne skale oceny w zaburze-
niach depresyjnych. In: Kiejna A, Rybakowski J, Dudek D,
editors. Psychiatryczne skale oceny w zaburzeniach afek-
tywnych. Kraków: Polskie Towarzystwo Psychiatryczne;
2012.
8. Pużyński S, Wciórka J. Narzędzia oceny stanu psychicznego.
In: Bilikiewicz A, Pużyński S, Rybakowski J, Wciórka J, edi-
tors. Psychiatria. Tom 1. Wrocław: Urban & Partner; 2003.
9. Kaniasty K. Klęska żywiołowa czy katastrofa społeczna?
Psychospołeczne konsekwencje polskiej powodzi 1997 roku.
Gdańsk: Gdańskie Wydawnictwo Psychologiczne; 2003.
10. Kokoszka A. Krótka Skala Samooceny Depresji i Lęku: opis
konstrukcji oraz właściwości psychometryczne dla osób
z cukrzycą. Przew Lek. 2008; 6, 74–81.
11. Makowska Z, Merecz D. GHQ – Ocena Zdrowia Psychiczne-
go według D. Goldberga. Warszawa: Pracownia Testów Psy-
Warszawa: Pracownia Testów Psy-
chologicznych PTP; 2010.
12. Radloff LS. The CES-D Scale: A Self-Report Depression
Scale for Research in the General Population. Appl Psych
Meas. 1977; 1(3), 371–384.
13. Spielberger CD, Gorsuch RL, Lushene RE. STAI - Inwentarz
Stanu i Cechy Lęku STAI. Warsaw: Pracownia Testów Psy-
Warsaw: Pracownia Testów Psy-
chologicznych PTP; 2011.
14. Pössel P. Cognitive Triad Inventory (CTI): Psychometric prop-
erties and factor structure of the German translation. J Be-
hav Ther Exp Psy. 2009; 40(2), 240–247.
15. Bedyńska S, Brzezicka A, editors. Statystyczny drogowskaz.
Praktyczny poradnik analizy danych w naukach społecznych
na przykładach z psychologii. Warsaw: Wydawnictwo SWPS
Academica; 2007.
16. Anderson KW, Skidmore JR. Empirical analysis of factors in
depressive cognition: The Cognitive Triad Inventory. J Clin
Psychol. 1995; 51(5), 603–609.
17. McIntosh CN, Fischer DG. Beck’s cognitive triad: One ver-
sus three factors. Can J Behav Sci. 2000; 32(3), 153–157.
Wyszukiwarka
Podobne podstrony:
Rykała, Andrzej; Baranowska, Magdalena Does the Islamic “problem” exist in Poland Polish Muslims in
Presentation 5 Psychological Aspects of Treatment of the S
Intraindividual stability in the organization and patterning of behavior Incorporating psychological
71 1021 1029 Effect of Electron Beam Treatment on the Structure and the Properties of Hard
Alta J LaDage Occult Psychology, A Comparison of Jungian Psychology and the Modern Qabalah
Walker The Production, Microstructure, and Properties of Wrought Iron (2002)
Fricke Visual assessments of the surface diusion properties of concert halls
Kulesza, Mariusz; Rykała, Andrzej Eastern, Western, cosmopolitan – the influence of the multiethnic
Jóźwiak, Małgorzata; Warczakowska, Agnieszka Effect of base–acid properties of the mixtures of wate
Do methadone and buprenorphine have the same impact on psychopathological symptoms of heroin addicts
Human Biology Mental Health Psychology Made Easy The 100 Simple Secrets Of Happy People
Properties Of The Classical Fourier Transform, Some Examp
Energy and Nutritional Properties of the White Mulberry
Intraindividual stability in the organization and patterning of behavior Incorporating psychological
Baranowska, Magdalena; Rykała, Andrzej Multicultural city in the United Europe – a case of Łódź (20
Psychological essentialism and the differential attribution of uniquely human emotions to ingroups a
Crystal structure and properties of the copper(II) complex of sodium monensin A
Donofrino Psycho acoustics and the Grammar of audio
więcej podobnych podstron