
Copyright 2003 AADE Technical Conference
This paper was prepared for presentation at the AADE 2003 National Technology Conference “Practical Solutions for Drilling Challenges”, held at the Radisson Astrodome Houston, Texas, April 1 - 3,
2003 in Houston, Texas. This conference was hosted by the Houston Chapter of the American Association of Drilling Engineers. The information presented in this paper does not reflect any position,
claim or endorsement made or implied by the American Association of Drilling Engineers, their officers or members. Questions concerning the content of this paper should be directed to the individuals
listed as author/s of this work.
Abstract
Drilling fluid viscosity has a significant impact on
circulating pressure losses and solids suspension
characteristics of the fluid. Viscosity levels required for
managing dynamic barite sag and optimizing hole
cleaning efficiency are frequently at odds with those
needed for reducing circulating pressure losses.
Ideally, viscosity levels should be maximized at ultra-low
shear rates for controlling dynamic barite sag, and
minimized at high shear rates to reduce drill string and
annular circulating pressure losses. Frequently, there is
a narrow operating window between fracture pressures
and circulating density, which can be compounded by a
high potential for dynamic barite sag. The drilling
operation is at risk in these situations from pressure-
related viscosity effects arising from dynamic sag and
equivalent circulating density (ECD), however, the
proposed solution to one problem generally has a
negative impact on the other.
This paper presents technology for managing
dynamic barite sag while minimizing the corresponding
effect on downhole pressure losses in invert-emulsion
drilling fluids. Data presented will demonstrate the ability
to control dynamic barite sag while minimizing the effect
on ECD, thus reducing the frequency of drilling fluid
related non-productive time.
Introduction
Barite sag in drilling fluids is defined as the variation of
mud density normally seen when circulating bottoms-up.
This phenomenon is usually observed when drilling
highly deviated wells with invert emulsion drilling fluids
and has been associated with lost circulation, stuck pipe,
stuck casing and in some instances complete loss of the
well bore. Hanson et al.
1
concluded that barite sag was
more likely to occur under dynamic conditions rather
than static conditions. Bern et al.
2
concluded that the
highest levels of barite sag occurred under low annular
velocity and at wellbore angles between 60° and 75°.
Dye et al.
3
performed a study that substantiated
Hanson’s and Bern’s results and went on to further
delineate the dynamic condition at which barite sag
would occur. From this work, technology was developed
for rig site monitoring of invert emulsion drilling fluids
towards barite sag management.
High profile wells are generally associated with
deepwater, extended reach drilling (ERD) and high
temperature high pressure (HT-HP) operations. These
wells are usually drilled with synthetic-based mud (SBM)
or oil-based mud (OBM) for a number of reasons
including high day rates, shale inhibition, hydrate
suppression, improved thermal stability, lubricity
characteristics and high rates-of-penetration (ROP).
While the advantages of invert emulsions are many
there are some disadvantages including environmental
issues, lost circulation and a relatively high cost per
barrel. Downhole losses associated with invert emulsion
drilling fluid generally arise from high ECD’s. Downhole
pressures and temperatures are related to increased
ECD in an invert fluid above which similar water based
mud (WBM) would generate.
Barite Sag Management
Dynamic barite sag cannot be effectively managed
without an awareness and appropriate control of all
variables effecting barite sag. A new and simplistic
technology is available to manage the drilling fluid
variables effecting dynamic barite sag. This tool was
derived from flow loop tests using analytical techniques
and correlates well with field observations of barite sag.
When developing this model, flow loop tests were
conducted concurrently with field operations, presenting
a unique opportunity to correlate laboratory and field
results. Dynamic sag and rotational viscosity were
measured at equivalent shear rates using a low shear
rate field viscometer capable of measuring shear rates
as low as 0.001 rpm (0.0017s
-1
). A relationship between
drilling fluid viscosity and dynamic sag was discovered
such that one could accurately predict flow loop results
from simple ultra-low shear rate viscometer
measurements. This predictive technology possesses
the technical relevance of flow loop tests but is simpler
and less time-consuming to perform. In most cases this
technology is used instead of flow loop tests, which
makes it uniquely suited for field use.
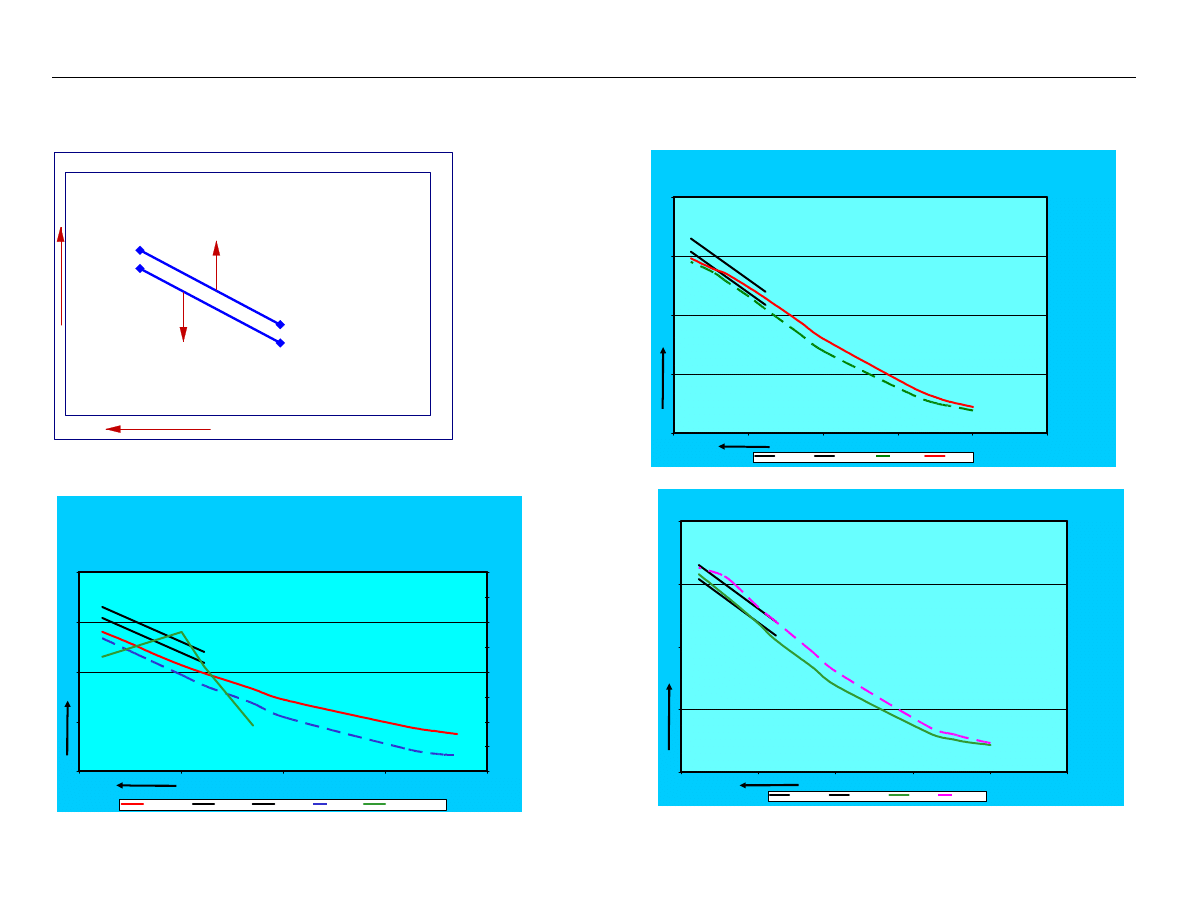
This technology predicts dynamic barite sag potential
through direct measurement of ultra-low shear rate
viscosity and comparison to the barite sag “Prevention
Window” (PW) shown in Figure 1. Viscosity levels below
the Lower Limit correlate with severe dynamic barite sag
AADE-03-NTCE-29
Coupling of Technologies for Concurrent ECD and Barite Sag Management
Greg Mullen, Jose Perez, Billy Dye and Bill Gusler, Baker Hughes INTEQ Drilling Fluids

2
G. MULLEN, J. PEREZ, B. DYE, B. GUSLER
AADE-03-NTCE-29
observed in the field and laboratory tests, and
correspond to a high potential for dynamic barite sag.
Conversely, viscosity levels above the Upper Limit
indicate a low potential for dynamic barite sag, but are
excessive in terms of requirements for barite sag
management. Finally, viscosity levels within the Limits
of the PW are preferred, and indicate a low potential for
dynamic barite sag. In terms of balancing barite sag and
ECD management, the viscosity profile of the drilling
fluid is optimized within the PW. For details and case
histories on development of the barite sag PW see
references from Dye et al.
3,4
ECD Management
ECD is influenced by flow rate, mud properties, rate-of-
penetration, cuttings density and size and geometrical
constraints. Pressure subs are usually used on critical
wells with tight operating windows to monitor and
manage ECD trends. Accurate hydraulics models are
useful for establishing an “expected” trend for
comparison against measured tool pressures. When
tool data deviates from expected trends, remedial action
such as controlling ROP, sweeps and short trips can be
taken to prevent loss circulation, stuck pipe and pack-
offs.
Mud properties, to some extent, can be maintained
within set specifications at the rig site. For instance
density, Plastic Viscosity (PV), Yield Point (YP), as well
as ten second and ten minute gel strengths are typically
monitored at ambient pressure at 120°F or 150°F and
adjusted according to the drilling fluids program or
operational conditions. Invert emulsion fluids generally
exhibit much greater fluctuations in rheological behavior
with temperature and pressure than do water-based
drilling fluids.
5
In addition, invert emulsion drilling fluids
compress under pressure and expand with temperature;
therefore the downhole density may be significantly
different than density measured at surface. For
consistent and accurate ECD modeling of invert
emulsion drilling fluids, rig site
rheological
measurements are not adequate. Thus the need for
characterizing the fluid rheological properties coupled
with base fluid density corrections that reflect downhole
pressure and temperature conditions.
Study Fluids and Test Methods
For this study five fluids were selected for
characterization on the barite sag PW followed by a
detailed hydraulics analysis. The test fluids consisted of
a baseline fluid and the baseline fluid treated with two
types of rheological modifiers to identify; 1) the chemistry
best suited to manage barite sag and 2) the impact of
treatment on downhole pressure losses. Table 1 lists
fluid compositions and properties. All fluids were
characterized over the standard six speed viscometer
shear rate range at 120° F for PV, YP and gel strengths
and the ultra-low shear rate range for dynamic barite sag
tendencies. In addition, each fluid was tested on a
Fann
Model 75 HT-HP viscometer at downhole
pressure and temperature. Finally each fluid was
characterized on a stress controlled rheometer,
Rheometrics SR-5000, using dynamic oscillatory
techniques to determine linear viscoelastic properties.
Baseline Fluid
The baseline fluid (Fluid #1) was intentionally designed
so that the viscosity profile would fall below the Lower
Limit of the PW. See Table 1 for fluid composition and
properties. Figure 2 illustrates the baseline fluid used in
this study compared to a fluid known to have sagging
potential. See reference from Dye et al.
3,4
for details on
the dynamic barite sag PW and the details on the fluid
used here for comparison purposes. The baseline fluid
in this study has a high potential for severe dynamic
barite sag.
Treated Fluids
Fluid #1 was treated with two types of rheological
modifiers: high performance organophilic clay (HPOC),
or fatty acid rheological modifier (FARM). Each product
was added in small quantities to achieve a viscosity
profile within the PW (optimized for barite sag
management) and subsequently adjusted to within or
slightly above the PW. Treatment levels were selected
in order to determine the impact of increased
concentrations on barite sag and circulating pressure
loss.
Figure 3 illustrates the results on viscosity profiles of
additions of FARM at two concentrations. An increased,
upward shift, in overall viscosity is evident with treatment
of the baseline fluid with FARM. In fact, the flow curve
for Fluid # 4 was below the Lower Limit. It was decided,
based on the amount of treatment, to use Fluid #4 for
ECD comparison even though it would likely exhibit
dynamic barite sag. The viscosity curve of Fluid #5 did
fall within the window; however, it did not remain within
the window limits over shear rate region.
Figure 4 illustrates the viscosity profiles of HPOC
treated fluid (Fluids #2 & #3). Both levels of treatment
shifted the viscosity curve upwards into and slightly
above the window. A minimal treatment level of HPOC
was required to shift the viscosity curve into the barite
sag PW limits.
HPOC and FARM Treatment Comparison
Both the HPOC and FARM rheology modifiers increased
the ultra-low shear rate viscosity of the treated fluids. In
addition to monitoring ultra-low shear rate viscosity, the
analytical tools mentioned earlier were used to better
understand which type of treatment would optimize
drilling fluid viscosity for management of both dynamic
barite sag and overall circulating system pressure
losses.

AADE 03-NTCE-29
COUPLING OF TECHNOLOGIES FOR CONCURRENT ECD AND BARITE SAG MANAGEMENT
3
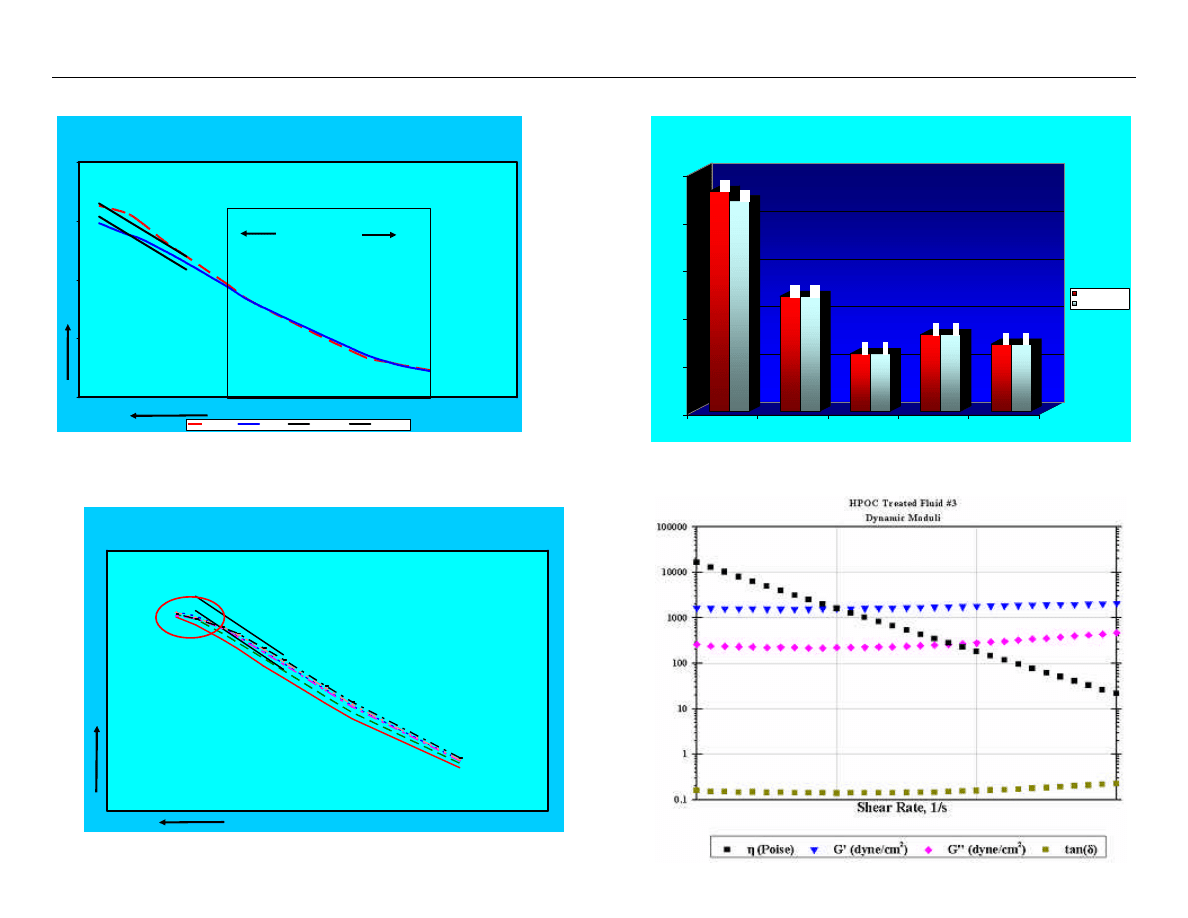
Figure 5 shows results on a typical six speed
viscometer shear rate range coupled with ultra-low shear
rate data on Fluids #3 and #5. Properties were
measured at 120°F at ambient pressure. The flow
properties of these fluids are similar within the shear rate
range of 3 rpm to 600 rpm. However, Fluid # 5 (FARM-
treated) begins to change slope below the 3rpm region
and tends towards Newtonian behavior, whereas Fluid
#3 (HPOC-treated) maintains a relatively constant slope
over the entire shear rate range. All fluids in this study
treated with the FARM additive exhibited a lower
Newtonian region (Figure 6).
Figure 7 shows the PV, YP, 6 and 3rpm readings and
Low Shear Rate Yield Point (LSYP or YZ) values for
Fluids #3 & 5. Not surprisingly, these values are similar
since they are derived form measurements taken from
the six speed viscometer readings in Figure 5.
Dynamic oscillatory measurements were used to
provide insight into the differences observed at ultra-low
shear rates and delineate the performance
characteristics of the HPOC and FARM-treated fluids.
While normal rotational viscometer tests apply a force or
a strain in a constant direction, oscillatory tests move the
measuring geometry through a short distance in one
direction, then reverses its motion until it passes though
its starting point. The movement of the geometry is
small enough that it will not disturb the overall structure
of a sample but will allow measurement of rheological
properties. This oscillatory motion is repeated
indefinitely, usually following a sinusoidal pattern of
movement, allowing for long-term measurement of a
sample under set stresses or strain rates without
destroying the structure of the sample.
Before discussion of oscillatory measurements a
short discussion on viscoelasticity is necessary. A
Newtonian fluid will manifest a pure fluid-like response
and a material such as steel will manifest a solid-like
response to an applied stress. Most materials have
some fluid-like (viscous) characteristics as well as solid-
like (elastic) characteristics. It is desirable for drilling
fluids to manifest both behaviors depending on the
operational conditions. For instance at very low shear
rates it is desirable for the solid-like characteristics to be
dominant for suspension of cuttings and weighting
material. At high shear rates the fluid-like or viscous
characteristic is desirable for transfer of hydraulic
horsepower down the drill string and bit.
One of the most common methods of quantifying the
viscoelastic properties of fluids is by measurement of
their elastic modulus (G’) and viscous modulus (G”).
6,7
Two oscillatory tests are performed in order to quantify
G’ and G”. The first test, the Strain Sweep, is a
destructive test used to determine the extent of linear
viscoelastic region. After determining the linear
viscoelastic region, a
non-destructive
Dynamic
Frequency Sweep is performed to quantify G’ and G”
moduli of the static gel. From the measured moduli, an
undisturbed viscosity (
η
*), or dynamic viscosity is
calculated. In addition, tan (
δ
), ratio of G”/G’, is
calculated and used as an indicator of solid-like
behavior. A ratio tending towards zero is indicative of
purely elastic (solid-like) behavior, whereas, a ratio
tending towards one (or higher) indicates viscous (liquid-
like) behavior. The dominance of G’ over G” is an
indicator that a networked, 3-dimensional structure
exists.
Dynamic oscillatory tests were performed to identify
the relative performance differences between HPOC and
FARM rheological modifiers. Results are presented for
Fluids #3 and #5 in Figures 8 thru 11. Figure 8 shows
results on Fluid #3 (HPOC treated). Here, the elastic
modulus (G’) is virtually flat over the frequency region
(frequency independent), which indicates that the elastic
response has little dependence on strain rate. The tan
(
δ
) value, approximately 0.2 to 0.3, was also fairly flat,
but slightly increasing at higher frequencies, indicating
that the viscous nature of the mud increases its impact
at higher strain rates. The dynamic viscosity exhibits a
high degree of shear-thinning over the test region and
has a constant slope.
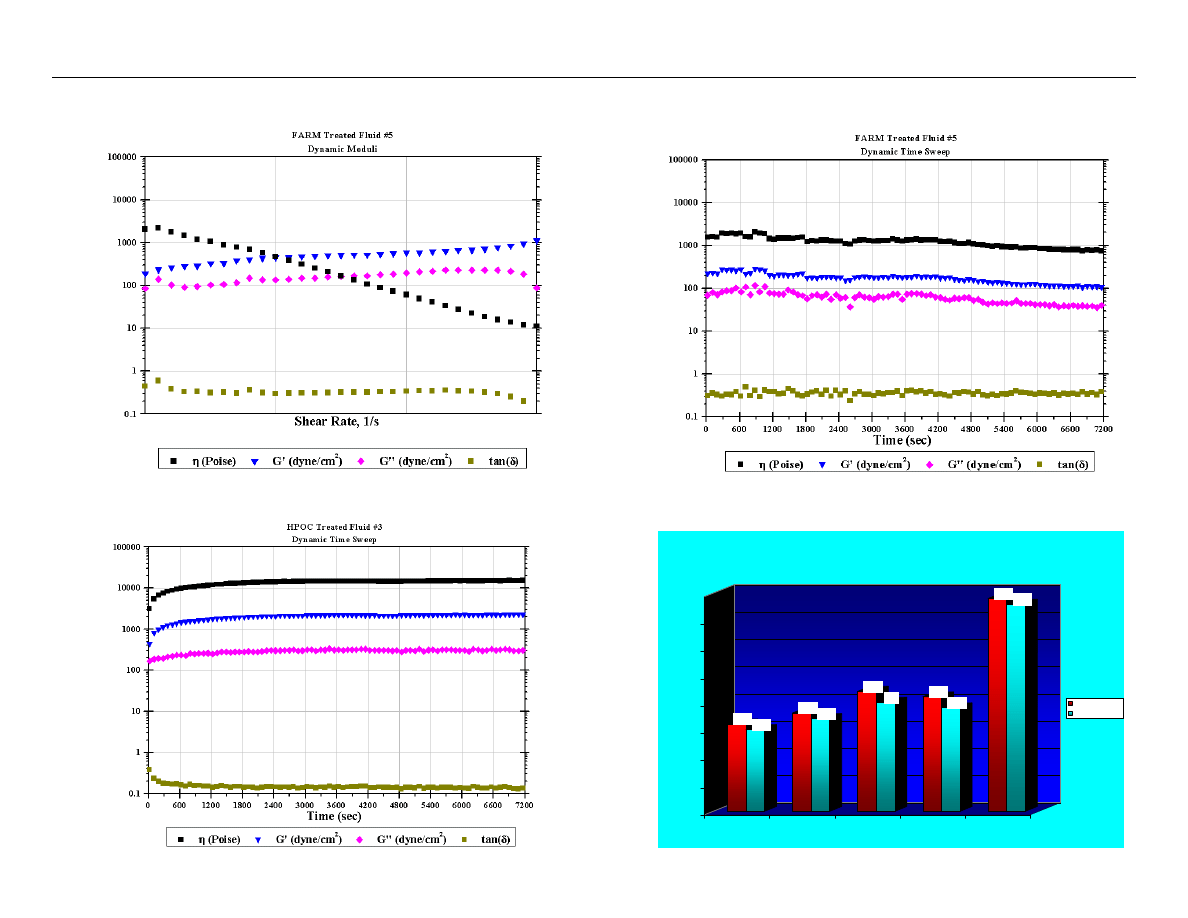
Figure 9 shows results on Fluid #5 (FARM-treated).
This fluid exhibits frequency dependency of G’ and has
little separation between the elastic and viscous moduli.
The tan (
δ
) value for Fluid #5 is fairly constant, 0.4 to
0.5, over the frequency range, and is higher than that of
Fluid #3. Finally, the dynamic viscosity exhibits a lower
degree of shear-thinning over the test region and the
slope approaches that of a Newtonian fluid at low
frequencies (lower Newtonian region). The lower
Newtonian region was also observed in the ultra-low
shear rate region in Figure 6 for all FARM-treated fluids.
Another observation from Figures 8 and 9 are the
differences in magnitude of G’. With Fluid #3, the elastic
modulus (G’) is an order of magnitude higher that that of
the Fluid #5, indicating a stronger network exists in Fluid
#3 (HPOC) compared to Fluid #5 (FARM).
Figures 10 and 11 illustrate the results from Dynamic
Time Sweeps. The Dynamic Time Sweep is a non-
destructive test, where the timed response of gel growth
can be observed. This test gives useful information
about the growth of gel structure in a near-static fluid.
The fluid structure is initially broken by shearing for two
minutes at 1022 s
-1
(equivalent to 600 rpm). Then, the
test begins with an oscillating strain in the linear
viscoelastic region while G’, G” and dynamic viscosity
are continually monitored. As the gel structure grows,
the structural dominance of the mud increases (G’
growth and tan (
δ
) decrease) while the gel has an
additive effect on the dynamic viscosity measured over
time.
In Figure 10, Fluid #3 exhibits an initial sharp
decrease in tan (
δ
), corresponding to increases in
η
*, G’,
and G”, indicative of gel growth (structured network) in

4
G. MULLEN, J. PEREZ, B. DYE, B. GUSLER
AADE-03-NTCE-29
the fluid. After ~10 minutes, the gel growth levels out
and remains constant after ~20 minutes. Afterwards, G’,
G”,
η
*, and tan (
δ
) are flat over time, also exhibiting a
large G’/G” separation. This indicates retention of
structure within the mud over time.
From Figure 11, Fluid #5 exhibits no initial gel growth
period. Instead, after ~10 minutes,
η
*, G’, and G” all
begin to decrease steadily over time while tan (
δ
) slowly
increases with time. This indicates that the structure in
the mud breaks down with time and the system moves
toward viscous (G”) behavior. In comparing Figures 10
and 11, the value of G’ in the HPOC-treated fluid is an
order of magnitude higher than that of the FARM-treated
fluid.
Hydraulics Analysis
The treated fluids were compared to the baseline fluid
for overall impact on downhole pressure losses. The
pressure loss analyses were made using an advanced
hydraulics model, Advantage Engineering Hydraulics.
Advantage is an HT-HP model which applies appropriate
corrections to rheology based on Fann 75 data and base
fluid density based on PVT data.
8
Additional analysis on the drilling fluid was required in
order to perform an accurate hydraulics analysis. It has
been well documented that synthetic and oil-based
drilling mud rheology, as well as density, change under
pressure and temperature conditions experienced at
downhole conditions. HT-HP, as well as conventional 6-
speed viscometer data were generated on each mud
and used for an extensive hydraulics analysis for each
mud. HT-HP rheology corrections were based on
temperatures and pressures that the fluids would
experience in deepwater wells.
Two deepwater wells were modeled: 1) a vertical
deepwater well in the Gulf of Mexico and 2) a deepwater
horizontal well located in West Africa. For each well
type, drilling parameters such as flowrate, ROP, cutting
density/size were kept constant.
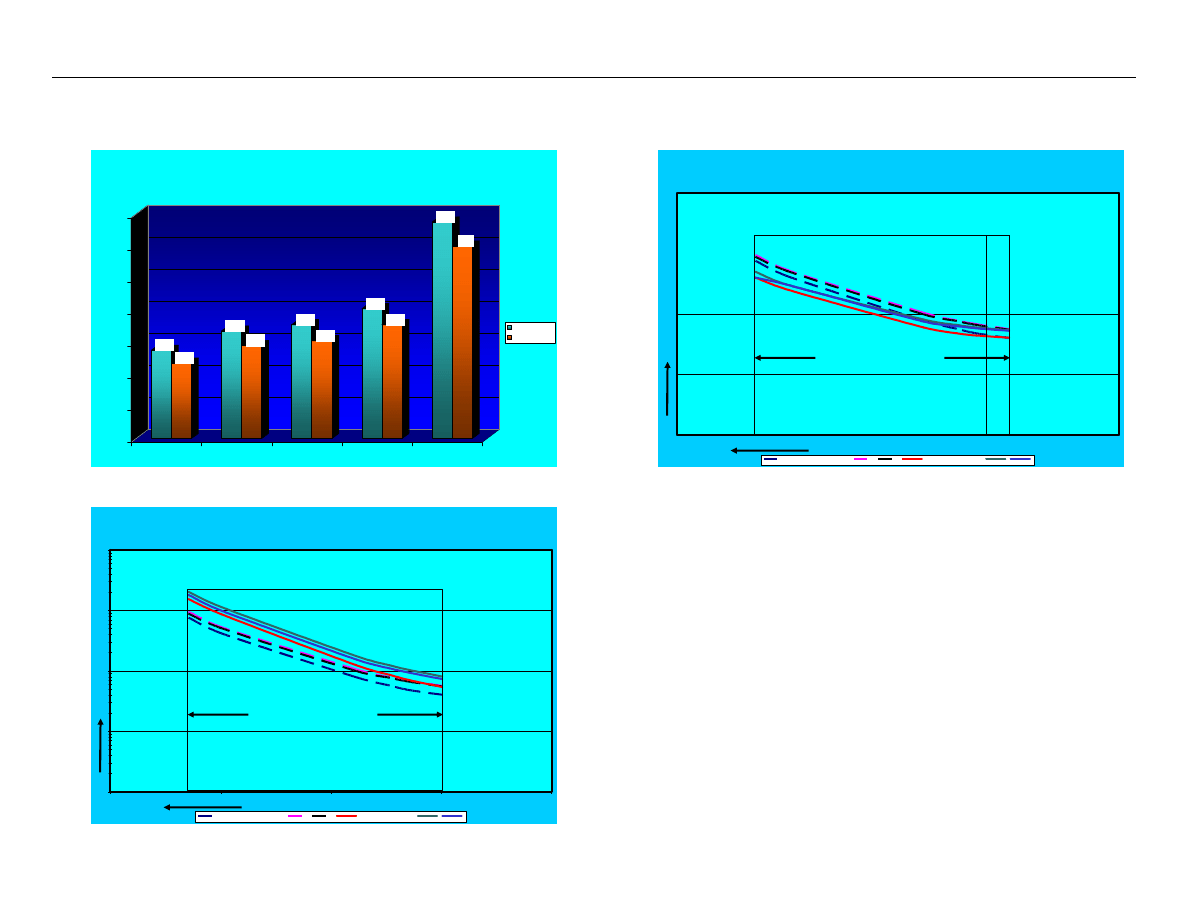
Figure 12 presents ECD results from the vertical
deepwater well. In this case a 12 ¼” open hole section
was modeled below 11 7/8” casing from approximately
15,600 to 18,000 feet TVD. The surface mud weight for
this well was 12.0 ppg, measured at 60°F and
atmospheric pressure. When circulating, the ECD (at
bit) from Fluid #1 (baseline fluid) was 12.56, which is
0.56 ppg above surface mud weight. The bottom hole
ESD at downhole conditions was 12.21 ppg, so a ~ 0.35
ppg increase in density resulted from annular pressure
losses. With Fluid #3 (HPOC), the ECD increased 0.06
ppg above Fluid #1, whereas ECD increased 0.23 ppg
with Fluid #5 (FARM).
Figure 13 illustrates results on a deepwater horizontal
well. In this scenario a horizontal 8 ½” section was
modeled below 9 5/8” casing from ~ 8,000 feet to 9,000
feet measured depth. In this well Fluid #1 had an ECD
of 12.75 ppg and an ESD of 12.09 ppg, indicating a net
increase in density due to annular pressure loss of 0.66
ppg. Fluid #3 had an ECD increase of 0.16 ppg
compared to Fluid #1, while the increase in ECD for
Fluid #5 was 0.80 ppg as compared to Fluid #1.
From the results above it is apparent that the choice
of rheological modifiers can have a dramatic effect on
pressure loss in the circulating system. Recalling the
data presented in Figures 5 and 7, the six speed
viscometer readings of the two fluids had similar
viscosity profiles and therefore, had similar PV, YP, 6
and 3rpm readings. In reviewing these data it is not
clear why there would be significant differences in the
hydraulics of the two fluid systems.
The two rheological modifiers (HPOC and FARM)
provide completely different mechanisms for viscosity
modification. Insight into the mechanisms was provided
from results in dynamic oscillatory tests presented in
Figures 8 – 11. Similarly, the differences are apparent
in HT-HP viscometer test data shown in Figures 14 and
15. In Figure 14, the solid lines are the viscosity profiles
of three HT-HP viscometer tests on Fluid #5 (FARM-
treated) while the dashed lines are from Fluid #3
(HPOC-treated). From Figure 14 it is apparent that the
rheological modifiers behave differently when measured
under temperature and pressure. Fluid #5 is more
viscous compared to Fluid #3 under simulated downhole
conditions. Figure 15 compares the HT-HP viscometer
test data from Fluids #1 and #3. Neither of these fluids
contains the FARM rheological modifier and it is shown
that the flow profiles of these fluids are very similar at
high shear rates.
Table 2 lists the entire circulating system pressure
loss breakdown for both chemistries on the example
wells. The impact of the FARM-treated fluid on
downhole rheology is evidenced by higher circulating
pressure losses compared to HPOC-treated fluid. In the
deepwater horizontal case, Fluid #5 (FARM) had an 80%
increase in annular pressure losses and in the vertical
case a 40% increase compared to Fluid #3 (HPOC).

AADE 03-NTCE-29
COUPLING OF TECHNOLOGIES FOR CONCURRENT ECD AND BARITE SAG MANAGEMENT
5
Conclusions
Conclusions are based on an investigation of two drilling
fluid treatment approaches to counter severe barite sag
while simultaneously managing circulating pressure
losses.
•
Ultra-low shear rate viscosity measurements
can delineate performance differences that
are not apparent from conventional 6-speed
viscometer data.
•
Viscoelastic measurements provide insight
into the mechanisms of rheology
modifications that are not apparent from
viscometer measurements.
•
Significant differences in drilling fluid
rheological behavior are observed when
comparing properties measured at surface
versus downhole conditions. These
differences can become more pronounced
when using rheological modifiers.
•
The impact on drilling hydraulics can vary
significantly depending on the type of
chemistry chosen for rheology modification.
•
HPOC chemistry is preferred over FARM
chemistry for concurrently managing ECD
and dynamic barite sag.
•
Corrective action for problems such as barite
sag and ECD management should not be
made in isolation from one another. The
solution to one problem may compound or
increase the risk of the other.
•
Technologies are available to optimize
drilling fluid properties for managing barite
sag and ECD.
Acknowledgments
The authors thank INTEQ Drilling Fluids for permission
to publish this paper. In addition, thanks to Jason Maxey
with INTEQ Drilling Fluids for his contributions towards
this paper.
Nomenclature
PW = Prevention Window
ECD = Equivalent Circulating Density
ROP = Rate of Penetration
ESD = Equivalent Static Density
ROP = Rate of Penetration
PV = Plastic Viscosity
YP = Yield Point
LSRYP or YZ = (2 x 3 rpm) - 6 rpm dial reading
G’ = Storage Modulus
G” = Loss Modulus
η * = Dynamic Viscosity
tan (
δ) = G”/G’
References
1.
Hanson, P.M., Trigg, T.K., Rachal, G. and Zamora,
M., Sept 23-26, 1990, “Investigation of Barite “Sag”
in Weighted Drilling Fluids in Highly Deviated Wells”,
SPE 20423, 65
th
Annual Technical Conference and
Exhibition, New Orleans, Louisiana
.
2. Bern, P.A., van Oort, E., Neusstadt, B., Ebeltoft, H.,
Zurdo, C., Zamora, M. and Slater, K., Sept 7-9,
1998, “Barite Sag: Measurement, Modelling and
Management”, SPE/IADC 47784, Asia Pacific
Drilling Conference, Jakarta, Indonesia.
3. Dye, W., Hemphill, T., Gusler, W., and Mullen, G.,
“Correlation of Ultra-Low Shear Rate Viscosity and
Dynamic Barite Sag”, SPE 70128, SPE Drilling &
Completion, March 2001.
4. Dye, W., Mullen, G and Gusler, W., “Drilling
Processes: The Other Half of the Barite Sag
Equation”, SPE 80495, presented at the SPE Asia
Pacific Oil and Gas Conference and Exhibition held
in Jakarta, Indonesia, 15–17 April 2003.
5. Hemphill, T., “Prediction of Rheological Behavior of
Ester-Based Drilling Fluid Under Downhole
Conditions”, presented at the 1996 SPE
International Petroleum Conference and Exhibition
of Mexico, held in Villa Hermosa, Tabasco March 5-
7, 1996
6. Dye, W., Robinson, G., and Mullen, G., “An
Engineering Approach to Characterizing Synthetic-
based Drilling Fluids for Deepwater and Extended
Reach Drilling Applications”, ETCE98-4558,
presented at the ASME ETCE 98’ Conference, 2-4
February, 1998,
7. Kelco Oil Field Group, 1994, “Rheology,” Technical
Bulletin, pp. 9
8. Mullen, G., Singamsetty, C., Dye, W., LeDet, D.,
Rawicki, A and Robichaux, T., “Planning and Field
Validation of Annular Pressure Predictions”,
presented at the American Association of Drilling
Engineers, AADE-01-NC-HO-08, 2001 National
Technical Conference, Houston, Texas, March 27-
29, 2001

6
G. MULLEN, J. PEREZ, B. DYE, B. GUSLER
AADE-03-NTCE-29
Table 1
Fluid
#
Additive
1
2
3
4
5
Base Fluid, bbl
0.616
0.615
0.616
0.615 0.615
HPOC, ppb
2.4
2.5
2.65
2.4
2.4
Emulsifier ppb
10
10
10
10
10
CaCl
2
Brine, bbl
0.175
0.175
0.175
0.175 0.175
Barite, ppb
214.4
214.1
214.1
214.1 214.1
Drill Solids, ppb
27
27
27
27
27
FARM, ppb
0.25
0.85
Heat Aged 16 hours @ 150°F
Mud weight, lb/gal
12.0
12.0
12.0
12.0
12.0
T 600 rpm @ 120°F
47
54
58
49
56
T 300 rpm
28
32
35
29
34
T 200 rpm
20
22
27
21
27
T 100 rpm
13
14
17
14
19
T 6 rpm
4
5
8
5
8
T 3 rpm
3
4
7
4
7
Plastic viscosity, cP
19
22
23
20
22
Yield point, lb/100 ft
2
9
10
12
9
12
YZ lb/100 ft
2
2
3
6
3
6
Table 2
Deepwater Horizontal Well
System Pressure Loss
Drill
Motor
Fluid
SPP
Surface
Bit
Annulus
String
MWD
1
2480
62
93
193
821
1311
2
2523
61
93
227
831
1311
3
2569
64
93
237
864
1311
4
2535
59
93
265
807
1311
5
2767
63
93
427
873
1311
Deepwater Vertical Well
System Pressure Loss
Drill
Motor
Fluid
SPP
Surface
Bit
Annulus
String
MWD
1
3017
238
188
327
1381
883
2
3109
231
188
344
1463
883
3
3174
247
188
383
1473
883
4
3020
217
188
368
1364
883
5
3284
227
188
536
1450
883
AADE 03-NTCE-29
COUPLING OF TECHNOLOGIES FOR CONCURRENT ECD AND BARITE SAG MANAGEMENT
7
Figure 1
Figure 2
Sagging Mud Viscosity Profile
Versus
Baseline Mud Viscosity Profile
Shear Rate, 1/s
Viscosity, cP
0
0.5
1
1.5
2
2.5
3
3.5
4
Sag, ppg
FlowLoopFluid
UpperLimit
LowerLimit
Fluid #1
FlowLoopFluidSag
0
Figure 3
FARM Treated Muds
Viscosity Profile
Shear Rate, 1/s
Viscosity, cP
Upper Limit
Lower Limit
Fluid #4
Fluid #5
0
Figure 4
HPOC Treated Muds
Viscosity Profile
Shear Rate, 1/s
Viscostiy, cP
Upper Limit
Lower Limit
Fluid #2
Fluid #3
0
Shear Rate, 1/s
Viscosity, cP
Low Potential for
Dynamic Sag
Low Potential for
Dynamic Sag
Upper Limit
Lower Limit
0
High Potential for
Dynamic Sag
8
G. MULLEN, J. PEREZ, B. DYE, B. GUSLER
AADE-03-NTCE-29
Figure 5
Viscosity Profile Comparison
HPOC vs FARM Treated Muds
Shear Rate, 1/s
Viscosity, cP
Fluid #3
Fluid #5
Upper Limit
Lower Limit
3rpm
Six Speed
Viscomter
Range
600rpm
0
Figure 6
Flow Curves For Various FARM Concentration
Shear Rate, 1/s
Viscosity, cP
0
Lower Newtonian Region
Figure 7
23
22
12
12
6
6
8
8
7
7
0
5
10
15
20
25
cP, lbf/100ft^2
PV
YP
YZ
6rpm
3rpm
Bingham PV/YP & LSRYP-YZ
Fluid #3 HPOC
Fluid #5 FARM
Figure 8
AADE 03-NTCE-29
COUPLING OF TECHNOLOGIES FOR CONCURRENT ECD AND BARITE SAG MANAGEMENT
9
Figure 9
Figure 10
Figure 11
Figure 12
12.56
12.55
12.58
12.57
12.62
12.6
12.61
12.59
12.79
12.78
12.4
12.45
12.5
12.55
12.6
12.65
12.7
12.75
12.8
ECD, ppg
Mud #1
Mud #2
Mud #3
Mud #4
Mud #5
Deepwater Vertical Well ECD's
12.0 ppg Surface Mud Weight
Rheology and Density Corrected for Pressure and Temperature Affects
Bit ECD
Csg Shoe ECD
10
G. MULLEN, J. PEREZ, B. DYE, B. GUSLER
AADE-03-NTCE-29
Figure 13
12.75
12.67
12.87
12.78
12.91
12.81
13.01
12.91
13.55
13.4
12.2
12.4
12.6
12.8
13
13.2
13.4
13.6
ECD, ppg
Mud #1
Mud #2
Mud #3
Mud #4
Mud #5
Deepwater ERD Well ECD's
12.0 ppg Surface Mud Weight
Rheology and Density Corrected for Pressure and Temperature Affects
Bit ECD
Csg Pt. ECD
Figure 14
Fann 75 Data
HT-HP Rheology
Shear Rate, 1/s
Viscosity, cP
Dashed Line-Fluid #3
Solid Line Fluid #5
Comparison of three sets of identical
pressure/temperature Fann 75 flow curves.
0
Six Speed HT-HP
Viscometer Range
Figure 15
Fann 75 Data
HT-HP Rheology
Shear Rate, 1/s
Viscosity, cP
Dashed Line-Fluid #3
Solid- Line Fluid #1
Comparison of three sets of identical
pressure/temperature Fann 75 flow curves.
0
Six Speed HT-HP
Viscometer Range
300rpm
600rpm
Wyszukiwarka
Podobne podstrony:
Coupling of Technologies for Concurrent ECD and Barite Sag Management
a highly active catalyst for the room temperature amination and suzuki coupling of aryl chlorides
37 509 524 Microstructure and Wear Resistance of HSS for Rolling Mill Rolls
New hybrid drying technologies for heat sensitive foodstuff (S K Chou and K J Chua)
37 509 524 Microstructure and Wear Resistance of HSS for Rolling Mill Rolls
Additives for the Manufacture and Processing of Polymers dodatki do polimerów tworzyw sztucznych
Wicca Book of Spells and Witchcraft for Beginners The Guide of Shadows for Wiccans, Solitary Witche
RADIOACTIVE CONTAMINATED WATER LEAKS UPDATE FROM THE EMBASSY OF SWITZERLAND IN JAPAN SCIENCE AND TEC
Eurocode 8 Part 1 1998 2004 Design of Structures for Earthquake Resistance General Rules Seism
Elgar Serenade from The Wand of Youth for cello and piano
Accounting Recording and Firm Reporting as Source of Information for Users to Take Economic Decision
Bondeson; Aristotle on Responsibility for Ones Character and the Possibility of Character Change
Eurocode 8 Part 5 1998 2004 Design of Structures for Earthquake Resistance Foundations, Retaini
Eurocode 8 Part 4 1998 2006 Design of tructures for Earthquake Resistance Silos, Tanks and Pipe
0813124468 University Press of Kentucky Peace Out of Reach Middle Eastern Travels and the Search for
SMeyer WO8901464A3 Controlled Process for the Production of Thermal Energy from Gases and Apparatus
Mullins Eustace, Phoney Wars for Phoney Peace and the Ministry of Fear(1)
więcej podobnych podstron