Development of Graphic
Skills
Research Perspectives and
Educational Implications
Edited by
John Wann
Psychology Department, Edinburgh University,
Edinburgh, UK
Alan M. Wing
MRC Applied Psychology Unit, Cambridge, UK
&
Nils Sovik
Institute of Education, Trondheim University,
Trondheim, Nor�ay
ACADEMIC PRESS
Harcourt Brace Jovanovich, Publishers
LONDON SAN DIEGO NEW YORK BOSTON

Chapter 6
Isochrony and accuracy of drawing
movements in children: Effects of age
and context
Annie Vinter & Pierre Mounoud
The graphic execution of a geometric figure, whether it is
simple or complex, involves coordinated participation of
perceptual-cognitive mechanisms, devoted to the analysis of the
figure to be produced, and perceptual-motor mechanisms,
devoted to the planning and adjustment of the movement's
parameters as a function of the characteristics of the intended
figure. Thus, this motor behaviour -
the drawing of a figure -
appears appropriate for studying the relationships between
perceptual, cognitive and motor aspects of behaviour.
A plethora of perspectives and methodologies can be used to
study graphomotor activity. Consider for instance the drawing of
a circle. One can be interested in different aspects such as the
planning of this activity (eg, asking the subject to draw a unique,
discrete circle of a given size) or, by contrast, the maintenance of
an already current drawing activity (eg, continuously and
repeatedly drawing a circle). This dimension, planning versus
maintenance of a current activity, is related to the dimension
contrasting the study of goal-aimed movement and the study of
movement for itself (ie, at least partially released from
constraints linked to the plan of action). Furthermore, whether
discrete or continuous, a graphic skill can be performed under
contexts that differ in the degree of constraint.
The present chapter reports an exploration of relations between
perceptual, cognitive and motor aspects of a graphic skill,
performed in a discrete mode and realized within different
contexts. Our interest is related to the effects of context on the
Development of GraphiC Skills
I��r-..' ()-1?-7�A.QA.()_"
Copyright �
1991
Academic Press Limited
All riahts of reoroduction in anv form reserved

114
A.
VINTER
&
P. MOUNOUD
subject's ability to produce sizes and size ratios of a given value
(spatial aspects), and on the subject's ability to regulate the
movement's velocity as a function of its amplitude (ie the trace
length in the case of drawing). The so-called
Isochrony Principle
(Viviani and Terzuolo, 1980, 1983) and its potential sensitivity to
context effects constitutes the central focus of this chapter.
Furthermore, a developmental perspective is proposed.
1.0 The isochrony prini!iple
A general compensatory mechanism has been demonstrated for
the timing of movements and seems to characterize motor acts
as different as drawing or handwriting (Viviani and Terzuolo,
1980, 1982, 1983; Viviani and McCollum, 1983), manual pointing
(Fitts, 1954), stroking (Michel, 1971) or kicking activity in infants
(Thelen and Fisher, 1983). This mechanism, called the
Isochrony Principle, has a long history in literature (Binet and
Courtier, 1893; Freeman, 1914), and states that the velocity of a
movement is proportionally tied to its linear extension (or
trajectory's length), so that the execution time is maintained
approximately constant. It has been suggested that this
principle links velocity to the amplitude of a movement plan. In
the case of curvilinear trajectories, however, perfect
compensation between velocity and amplitude is never observed,
which has been expressed by different laws, such as the One
Third-Power-Law (Viviani and Cenzato, 1985; Lacquaniti et aI,
1983, 1984; Sciaky et aI, 1987; Schneider, 1987; see also; Wann,
1989; Wann et
al,
1988).
Isochrony is observed early in human development, and in very
different motor tasks: cutting geometrical figures with scissors
(Corbetta, 1989), manual pointing (Hay, 1981), visuo-manual
tracking (Viviani and Zanone, 1988). Current developmental
data are rather consistent with regard to the hypothesis of an
invariant time structure of movement in motor skills (Wann,
1986; Wann and Jones, 1986; Pellizer and Hauert, 1989), and
invariance in duration across variations in amplitude of
movement (isochrony) may be expected
to
be present from a very
young age. But the nature of the development of this
characteristic is at present an open question.

6.
ISOCHRONY AND ACCURACY OF DRAWING
115
Most experiments in visuo-manual tracking (Zanone, 1987; Pew
and Rupp, 1971; Dunham et aI, 1985) or experiments based on
the coincidence-anticipation paradigm (Bard et aI, 1981;
Dunham and Reid, 1987) mention a general and gradual
improvement in performance with age. In handwriting tasks, a
monotonic
increase in mean writing speed is usually described
(Ayres, 1912; Sovik, 1975; Ziviani, 1984; Rigal, 1976). A similar
developmental trend is also shown in drawing tasks with
geometric figures (Broderick and Laszlo, 1984, 1987, 1988).
Some measures of motor skill, however, contrast with this
picture of motor development as conforming to monotonically
increasing performance. A comprehensive set of studies of
childrens' pointing by Hay (1978, 1979, 1981, 1984) suggested a
non-monotonic,
U-shaped developmental pattern for some
movement's parameters (accuracy for instance) with an initial
decline followed by later improvement in performance. Dividing
pointing movements of children into three classes, according to
kinematic criteria proposed by Brooks et al (1973), Hay (1979)
observed a non-monotonic progression, starting with a
predominance of fast
ballistic
movements at 5 years, followed by
the emergence of
discontinuous ramp
movements (low and
constant velocity, long durations), and
ste p
movements at 7
years, and leading to the appearance of
continuous,
medium
speed and single step movements at 9 years. Further support for
a significant developmental change at age 7 was derived from
analyses of the corrections made by the children in their
movements while wearing deviating prisms (Hay, 1981).
Similar discontinuities in motor control development can be
found in studies examining lifting movements for objects of
different weights (Hauert, 1980; Gachoud et aI, 1983), visuo
manual tracking performances (Mounoud et aI, 1983, 1985),
pointing movements at lateralized targets (Pellizer and Hauert,
1989) as well as in the acquisition of handwriting skill (Wann,
1986, 1987; Meulenbroek and van Galen, 1986, 1988). A general
conclusion based on these studies might be that the age at which
the decline in performance occurs, as attested by different
measures, differs as a function of the complexity of the motor
skill.

116
A. VINTER
&
P. MOUNOUD
2.0 Context and
age effects in drawing movements
The present chapter describes an analysis of potential context
effects on the child's drawing parameters when geometric
figures (circles) of different perimeters were to be produced.
Consistent developmental milestones have been established for
drawing geometric figures, and circles are the first figures
children can draw. Many children succeed in these activities by
3 years of age (Arnheim, 1956; Piaget and Inhelder, 1969; Blote et
aI, 1987). However, in our studies the drawing situations were
more complex. Different sizes of figures were required and
biomechanical conditions for drawing changed as a function of
the required circle perimeter (eg, a finger movement, wrist
movement, ann movement).
Two independent experiments were conducted, and three
different experimental contexts were selected: 1) drawing circles
of different perimeters in a random order of execution with
regard to the size (first experiment:
random
context); 2) drawing
circles of different perimeters, presented as a series of circles in
an increasing order of size (second experiment, part A:
seriation
context); 3) drawing circles of different perimeters and spatially
assembled in such a way that they represented a bear (second
experiment, part B:
bear
context).
We chose to study the age range from 5 to 9 years. This was
particularly relevant for the seriation context, because within
this range, the cognitive ability which underlies the mastering
of the seriation operation undergoes well-documented
development (Piaget and Inhelder, 1941). Different stages have
been described, and success at the closest seriation task of Piaget
and Inhelder (seriation of sticks of different lengths) with regard
to our own drawing task was achieved at around 8-9 years.
Within this perspective, we suggest that the random context is
predominantly
pe rce ptually
loaded, in that it is the least
constrained of our experimental tasks and perceptual processes
involved in this task can be carried out in a relatively free
context. By contrast, the seriation context is
logically
loaded in
that the task is logically structured on the basis of the seriation

6.
ISOCHRONY AND ACCURACY OF DRAWING
117
operation. Finally, the bear context could be considered as
mainly
spatially
(and cognitively) loaded. In copying the bear,
the main problem the child encounters is mastering the spatial
relationships the different sub-elements of the figure have with
each other. Both perceptual and cognitive determinants are
important. As an interdependency between cognitive and motor
development has been documented (Hauert, 1980; Gachoud et al
1983; Mounoud, 1986), the differential load of cognitive
determinants in our drawing tasks might be manifested by
different age effects on movement parameters.
Different working hypotheses may be suggested for context and
age effects on drawing movements. In general, we hypothesized
non-monotonic development of the relationship between velocity
and trace length, but postulated that isochrony might also be
affected by the different contexts of drawing. Isochrony we
expected should be higher in the random task than in the other
ones, as each figure was presented alone, without any
systematic size relations with regard to the previous and
successive figures. Relations between velocity and amplitude
might thus be expected to be facilitated because of the lack of
extraneous interference in the estimation of perimeter.
Furthermore, we expected accuracy to be worse in the bear task
than in the others, because of the effects of overlap between
components of different sizes. Finally, we expected the
invariance of the size increment over the series of circles (the
perimeter progression)
to
be respected only at around 8 to 9 years
in the seriation task, (ie, when children are able to cognitively
master the corresponding operation). By contrast, in the random
task, we expected this index would be either consistently good
over age, or would improve with age, depending on the
development of the ability
to
reproduce sizes in drawing.
2.1
Subjects
Two separate groups of right-handed children were studied for the two
experiments. Subjects were drawn from public schools in Geneva.
Summary statistics on sex and age range as a function of task are
presented in Table
1.
Drawings of
19
other children
(9
girls,
10
boys, age range:
5
to
8
years)
were eliminated because of too much distorted curvature in the circles
produced or particularly inaccurate size reproductions due to the subjects
118
A.
VINTER
& P.
MOUNOUD
TABLE 1:
Subject sample for each task in terms of sex and
age range (years) for each age bracket.
Age group
Task:
Seriation and Bear
Random
Nt
Sex
Age range
Nt
Sex
Age range
5
10ft 12m 4.7-5.3
7f,4m
4.6-5.3
6
11f, 13m 5.7-6.4
4f,5m
5.7-6.3
7
1 Of, 11m 6.7-7.3
6f,3m
6.7-7.2
8
12f,20m 7.6-8.3
3f,7m
7.7-8.4
9
lOf,10m 8.7-9.4
6f,6m
8.7-9.3
Total
119
51
choosing to locate the drawing in a space without enough room for the
components. We paid particular attention to the problem of inadequate
spacing because various studies have revealed that size reproduction in
children's drawings may be a function of the space they left free after they
had executed a first figure (Silk and Thomas, 1988; Thomas and Tsalini,
1988).
In addition
to
the children listed in Table
I,
a sample of 20 right-handed
adults (10 women, 10 men) was added for the seriation task only. The
average age was 28 years, ranging from 21 to 42 years. These adults were
unaware of the aims of the study and were drawn from the Faculty of
Psychology in Geneva.
2.2
Apparatus
A special kind of Edison pen was used in these experiments. This pen,
when moving, perforates a sheet of thermic paper at an adjustable
frequency. Frequency was selected according
to
the child's spontaneous
rhythm of tracing and ranged from 25 to 50 Hz. This apparatus might be
considered rather archaic, but it is very easy
to
use with children as young
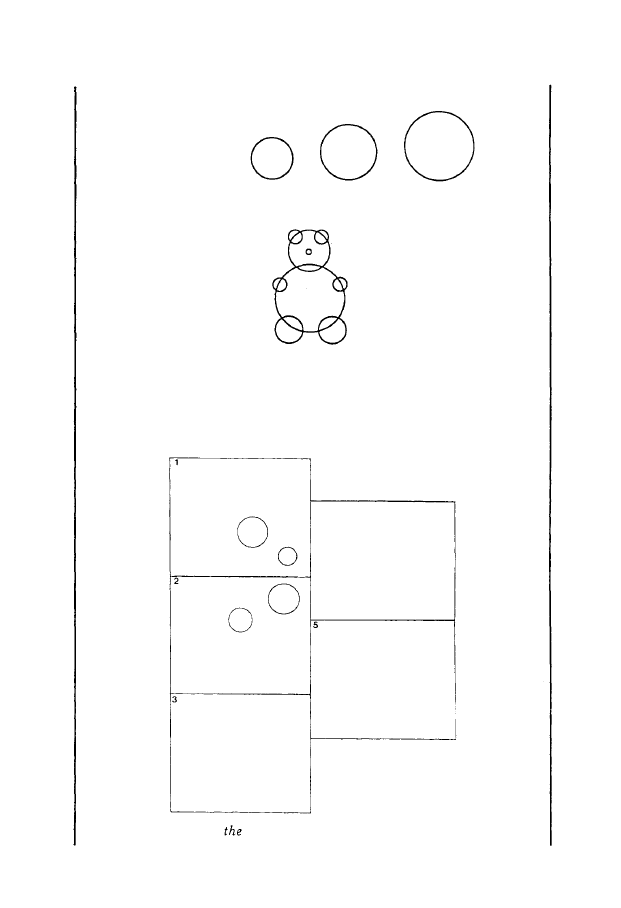
as 4 years old. The models given to the subjects are reproduced in Figures
1 (A: seriation task, B: bear task) and 2 (random task).
The circles were drawn in china-ink on an A3 format white sheet of
paper. Circles were presented in an increasing order of size and aligned
with regard to their bases in the seriation task. In the random task, 5
different models were used and randomly assigned to the subjects in
order to avoid eventual systematic effects of neighbouring in the child's
perception of the sizes. Respective perimeters of the circles were of 6, 12, 18,
'24 and 30 cm in the seriation and random tasks (perimeter progression of
6 cm), and of 3, 6, 12, 24 and 30 cm in the bear task (perimeter progression
varying, 3, 6 and 12 cm).
2.3
Procedure
Both experiments (seriation and bear tasks, random task) were based on
the same factorial experimental design with two between-subject factors
(age, sex), and two within-subject factors (trial, circle size).
6. ISOCHRONY
AND
ACCURACY OF
DRAWING
o
o
A, SERIATION TASK
B' BEAR TASK
FIGURE1:
Model of the seriation task and the bear task.
0
o
4
o
o
o
0
0
0
0
0
0
00
0
0
0
o
0
o
0
0
RANDOM TASK
FIGURE
2:
Models of
random task
(5
different designs).
119
120
A.
VINTER
& P.
MOUNOUD
Each subject was asked to draw the figures on a white sheet of paper of the
same format as the model. No starting rule (Kirk, 1985) was imposed
(where to initiate the execution of the figure, up or down for instance) and
the direction of the drawing movement (clockwise or anticlockwise) was
free. Both were noted by the experimenter. The circles, however had to
be
performed in one single movement, without stopping, under a
spontaneous and natural rhythm of drawing. If subjects stopped drawing
in the course of the execution of a figure, they were asked
to
draw it again.
Instructions given to t�e subjects focused attention on the expected
accuracy of the size of the circles' reproduction, as well as the regularity
of the curvature of the figure. Before starting the experiment, a practice
period of several trials was needed to ensure a good understanding of the
instructions by the child and
to
train the subject
to
produce regular shapes.
Instructions were repeated by the experimenter several times during the
experiment, in particular with respect
to
the requested accuracy of the
reproduction size.
In the seriaticn task, the children had the model (Figure 1) in front of
them continously, and were asked
to
reproduce the series of circles in an
increasing order of size. Three trials were required, each being
performed on a separate sheet. The procedure was identical for the adult
sample. Then, the bear model (Figure 1) was introduced to the children,
who had to copy it, starting with the circle of their choice. No progression
rule (Kirk, 1985) was given with regard to the order of execution of the
circles, and the experimenter had to note the sequence choosen by the
subject. Two trials were required for the bear task.
In the random task, the child was shown one of the models (see Figure 2)
and was asked
to
attentively observe the range of sizes of the figures he
would have to copy. Then, the experimenter indicated the first circle to
be
drawn, masking the other ones during the copying. Once the figure was
complete, the second circle was shown, again masking the non-target
ones on both the model and the subject's sheet. This procedure was
repeated until the five elements of the series were drawn. No active
comparison between the different sizes of either the figures drawn, or the
model figures was allowed during the task. Thus, each circle was copied
in isolation. Three trials were requested and ten different orders of
execution of the series of circles were used, randomly assigned to subjects
and trials. Then, a control-seriation identical to that reproduced in
Figure 1 was also required,
to
estimate any discrepancies between the two
samples of subjects selected for each experiment.
2.4
Measures
The
X
and
Y
coordinates of the points made by the discharges of the Edison
pen were digitized by means of a Calcomp 9000 digitizer table (spatial
resolution of 0.1 mm). Measures recorded were the trace length
(P),
time
taken
(T)
and average velocity
(PIT)
for each circle. (We should point out
that the Edison pen presents a major limit for the study of graphomotor
activity because of its low sample rate. A consequence of this limit is that
it is not possible to compute derivatives such as tangential velocity,
acceleration, etc. What is called velocity corresponds
to
an average speed

6.
ISOCHRONY AND ACCURACY OF DRAWING
12 1
of execution obtained by directly dividing
P
by
T.)
The measures obtained
for the circles of identical sizes in the bear task (see Figure 1B) were
averaged, when it was established that this procedure did not introduce
any bias in the data. Thus, 15 circles for each child were obtained in the
seriation and random task (plus 5 circles in the control-seriation task),
and
10
in the bear task.
Two analyses were carried out, one concerning isochrony (understood
here as a simple principle assessing constancy of execution time), the
other being related to the accuracy of reproduction of size.
2.5
Quantifying the accuracy of drawing
The spatial gain index (the ratio of the length of each produced trace
to
the
corresponding length of the trace in the model) was computed. Then,
relations between the sizes of the different circles produced within each
series were analysed by computing the mean trace length progression
(normalized with regard to the model trace length progression), and its
coefficient of variation. This progression index corresponds to the mean
of the ratios between observed serial trace increment (difference in trace
length between two consecutive circles when they are ordered according
to
size) and model serial increment (the value of which was always
6
in the
seriation and random tasks, but which varied in the bear task; 3,
6
or 12).
2.6
Determining the degree of isochrony
A simple expression for isochrony is
T
=
kpa
(1)
where the power index
a
should tend toward
0
for complete isochrony
(constancy of time). Considering that
V
=
P!I' in our study, Equation
(1)
can also be expressed as
V
=
k'P �
(2)
with perfect isochrony implying that the exponent should be
1.
A
logarithmic regression of the
v-p
relation allows a precise estimation of
the parameters by expressing equation (2) as
log
V
=
k'
+
�logP
(3)
The slope P of this logarithmic regression, as well as the coefficient of
correlation between the two variables, were individually estimated for
each child.
3.0 Results
2355
cases were collected for the seriation task, including the
adults' performances and the control-seriation data (38 outliers
were then eliminated). The bear task includes 1132 cases (30
missing values, 28 outliers ejected), and the random task
includes 801 cases (9 outliers eliminated). Outliers were

122
A.
VINTER
&
P.
MOUNOUD
eliminated on the basis of an inspection of the entire data
distribution, without any knowledge of the experimental task
and/or age group which they belonged to. Analyses of variance
(SPSSX) were carried out for the different dependent variables to
examine age and context effects. We report in Table 2 only the
significant effects, which are explained in the results section.
TABLE 2:
Results of analyses of variance
Analysis
Effect
Statistic
p-level
Isochrony;
Context
F(2,253) = 40.77
.001
slope index
Age
F(4,253) = 4.0B
.003
Linear trend
t
= -3.08
.002
Quadratic trend
t
= 2.55
.011
Accuracy;
Context by age
F(B,744) = 2.35
.017
g ain
Context
F(2,744) = 12.92
.001
Age
F(4,744) = B.26
.001
Linear trend
t
=
4.23
.001
Quadratic trend
t =3.90
.001
Accuracy;
Context by age
F(B, 744) = 3.13
.002
mean trace
Context
F(2,744)
=
60.0B
.001
progression
Age
F(4,744) = 10.63
.001
Quadratic trend
t = 6.25
.001
Accuracy;
Context
F(2,744) = 4.47
.012
coeff. of variation Age
F(4,744) = 22.03
.001
Quadratic trend
t
=4.12
.001
Before discussing the results, we should point out that no effect
for sex on the dependent variables was found. Nevertheless, if
the entire set of data was examined, girls appeared to draw
faster than boys, whatever the age and task. Data on sex
differences for speed are controversial in the literature. Usually,
no sex effect is reported for speed of handwriting or drawing
(Harris and Rarick, 1959; Smith and Reed, 1959; Meulenbroek
and van Galen, 1986; Sciaky et aI, 1988), although some studies
have revealed faster speeds for girls than for boys (Groff, 1961;
S5vik, 1975; Ziviani, 1984).
3.1
Analysis of size accuracy
The analysis comprised two parts: First, the accuracy of size
reproduction was examined; second, the trace length increment
6.
ISOCHRONY AND ACCURACY OF DRAWING
1.00
0�5
0.00
c
O.�
ro
�
m
O.M
�
ro
�
W
O�
o.m
O.�
O.M
L
1··········
C
Random
• Bear
•
o Seriation
5
6
7
Age (yrs)
8
9
Adults
123
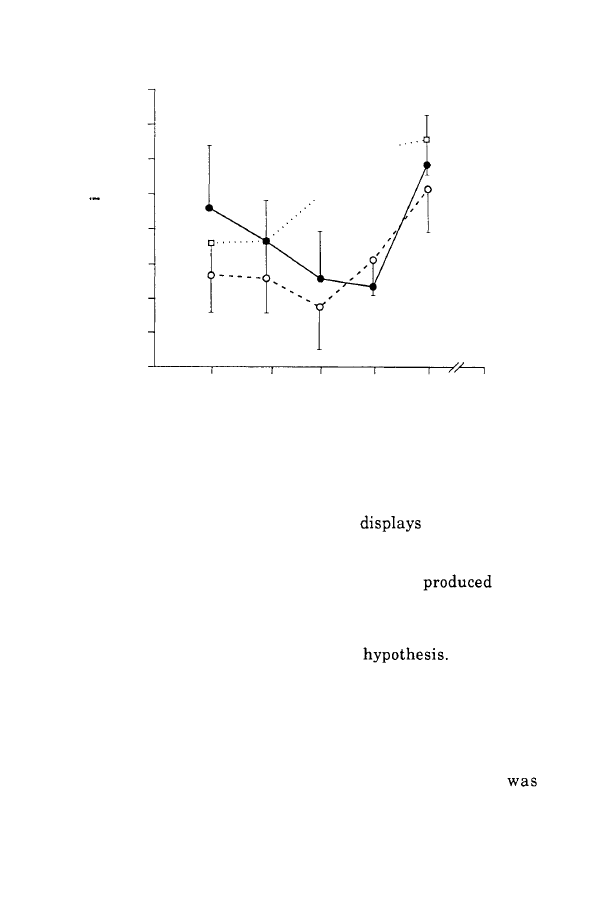
FIGURE 3:
Analysis of accuracy: spatial gain (mean and
95%
limit of
confidence) as a function of age.
over the series was analysed. Figure
3
the results for
the spatial gain as a function of age and task.
Because the gain index was less than
1,
the
sizes
always underestimated those of the models. As expected, the
adult value was the highest one, and close to
1 (.96).
Figures
were significantly more accurate in the random task than in the
other ones, which is in line with our
The worst
performances were recorded in the seriation task, whereas we
had expected them to be observed in the bear task. A significant
age-by-task interaction should be pointed out: differences
between tasks mainly characterized the
7-
and 8-year-old
children, while they were essentially negligible at
5, 6
and
9
years. A general improvement of accuracy with age was
observed, although the quadratic (U-shaped) trend
significant in the seriation and bear tasks; The geometrical gain

124
A. VINTER & P. MOUNOUD
decreased between 5 and 7 or 8 years, and increased again
between 7 or 8 and 9 years.
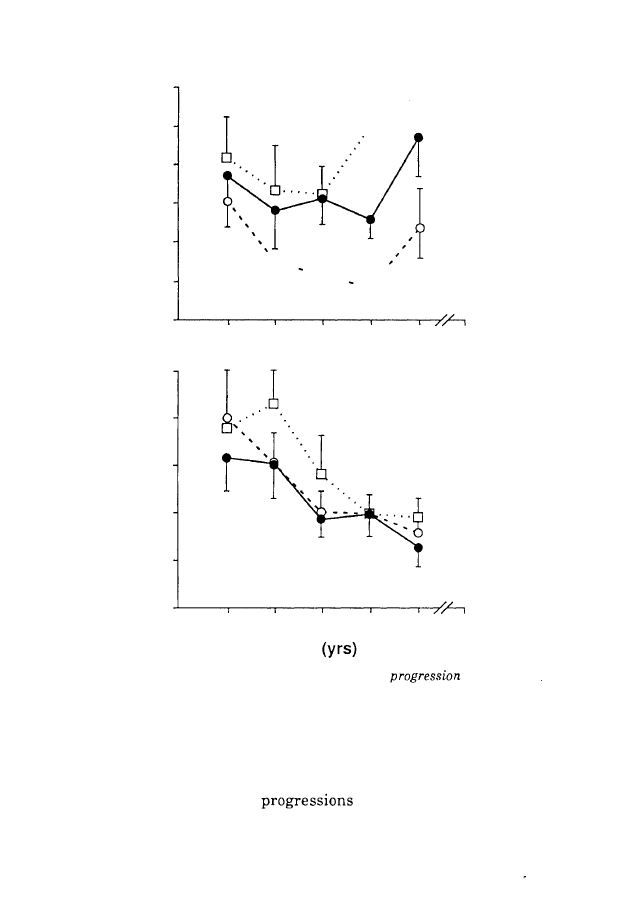
Mean normalized perimeter progression was computed. This
value is equal to 1 when the observed mean progression is
identical to that of the model. The coefficient of variation
provides information on the regularity of the progression indice
over the series. Figure 4 presents the results as a function of age
and context (upper: mean trace progression; lower: coefficient of
variation).
The perimeter progression varied significantly as a function of
context. The highest values occurred in the random task, and
the lowest in the seriation task. Although these differences were
systematic, they appeared more important with age, as
indicated by the significant age-by-context interaction. Again, a
clear U-shaped relation was observed (see upper part of Figure
4). Progressions decreased between 5 and 7 or 8 years, and
increased again between 7 and 9 years. Similar results were
mentioned by Thomas and Tsalini (1988) with size scaling effects
in the drawing of a man. In the random and bear tasks, the
results were, moreover, better at 9 years than at 5 years.
In agreement with our hypothesis, children succeeded in
accurately reproducing sizes in the random task by adequately
copying the performed perimeter from the model. Indices such
as the spatial gain and the mean perimeter progression were
indeed consistently the highest in the random task. But,
contrary to our expectation, the bear task seemed to be an
intermediate task, which usually led to accurate results close to
those obtained in the random task, while the biggest deviation
with respect to the model sizes (underestimation) was found in
seriation.
Of course, in the random and bear tasks, the good fit between the
progression index and the model shown in Figure 4 resulted
from the rather accurate size reproduction (see Figure 3). We
thus may suspect that the inaccurate performance of children in
the seriation task with regard, to the value of the mean
progression index was partly due to their tendency to keep
constant the perimeter increment over the series. If true, a
6.
ISOCHRONY AND ACCURACY OF DRAWING
1.0
.c:
0.9
-
C)
e::
0.8
Cl)
..J
Cl)
0
0.7
ro
�
l-
e::
ro
0.6
Cl)
::
0.5
0.4
1.2
e::
0
�
1.0
ro
.
;::
ro
>
0.8
-
0
-
e::
Cl)
0.6
'0
:;:
-
Cl)
0
0.4
U
0.2
�
.....
6
•
r"
'r'"
-(
o
Random
•
Bear
o
Seriation
•
5
6
7
8
9
Adults
Age
125
FIGURE
4:
Analysis of accuracy: mean trace length
(upper) and
its coefficient of variation (lower) as a function of t ask and age (mean and
the
95%
limit of confidence) .
dispersion index of the mean progression should reflect the
special status of the seriation task with respect to the other
conditions. The lower part of Figure
4
displays the coefficients of
variation of the perimeter
as a function of age and
context.

126
A.
VINTER
& P.
MOUNOUD
The context effect was significant; a greater variability of the
perimeter increment was observed in the random task than in
the seriation condition. This gives some support to the idea that,
in seriation, the lower values of the different parameters
qualifying performance with respect to accuracy resulted from
the child's goal to keep constant the trace length increment.
Nevertheless, if this hypothesis turns to be correct, then the
absence of differences between the seriation and bear tasks is
rather unclear. But an order effect may account for this absence
of differences (recall that the children drew the bears after they
had performed the seriation task three times).
The lower part of Figure 4 also reveals that, whatever the task,
the coefficients of variation decreased significantly as a function
of' age. The dispersion of the perimeter progression was
maximal at 5 years, indicating a great irregularity in the
perimeter increment over the series, although there was
accuracy in the mean. This is not the case at 9 years, at which
age the mean index appeared to be at least as accurate as at 5
years (Figure 4 upper), but was associated with regular and
stable serial perimeter increments (Figure 4 lower). These
results suggest that the seriation task induced a global planning
of the perimeter to be performed, possibly based on comparisons
between successive pairs of figures, whereas more local
planning was elicited by the random and, possibly, the bear
tasks. The specific problem encountered by children in the
seriation task was to coordinate the two requirements of a
regular increment with accurate size reproduction.
3.2
Analysis of isochrony
Because no significant differences in average speed or trace
length as a function of age were found between the control
seriation task (performed after the random task) and the main
seriation task, the two samples were combined except for
analyses in which the trial factor was considered a within
subjects factor.
As expected, a strong covariation between velocity and trace
length was observed whatever the experimental task.
6.
ISOCHRONY AND ACCURACY OF DRAWING
1.0
A. Seriation
0.8
0.6
0.4
0
---
0>
o
1.0
B. Bear
...........
"0
Q)
Q)
0..
(j)
Q)
0>
ro
"-
Q)
>
<I:
0.8
0.6
0.4
0.2
0
1.0
0.8
0.6
0.4
0.2
c. Random
o
o
5 Years
•
6 Years
c
7 Years
•
8 Years
<>
9 Years
•
Adult
0.2
0.4
0.6
0.8
1.0
1.2
1.4
1.6
Perimeter
127
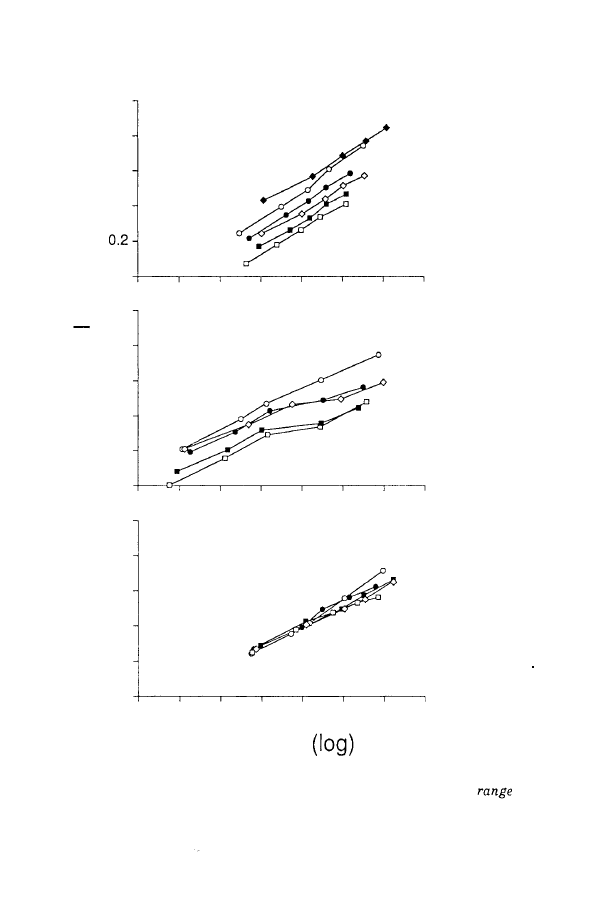
FIGURE
5:
Plots of observed velocities and observed perimeters (both axes in
log units) as a function of task and age. Note that the model size
is
different for the bear task.
128
A.
VINTER
& P.
MOUNOUD
Correlations computed on the entire set of data equalled
.66
for
the seriation task,
.67
for the bear condition, and
.68
for the
random task. The observed
velocities
(logarithmic values) as a function of age and task (seriation;
bear;
are plotted in Figure
5.
This clearly demonstrates
that the age effect was more important in the
and bear
tasks than in the random task. Results obtained for the different
ages were
differentiated in the
task, while
was common in the random task. More specifically,
Figure
5C
shows that, in the random task, there was perfect
overlap in relation to the smallest range of sizes (from
0.7
to
1.1
in log). Age differences emerged only with respect to the highest
range of sizes, which may suggest that it is more appropriate to
analyse age effects in the isochrony principle by using large
rather than small
sizes. The main effect in terms of age
was the decrease of average speed between
5
and
7
followed by a regular increase between
7
and 9 years. Average
velocity in adults was higher than in 9-year-old children, which
suggests a further increase of speed after age 9. This result, the
clear decline of speed at
7
is in agreement with Hay's
results.
TABLE 3:
Coefficient of
between
V
and
P
and percentage of
variance accounted for by regression
Age
r
values
r2x100
(years)
Seriation
Bear
Random Seriation
Bear
Random
5
.89
.87
.84
80
75
7 0
6
.87
.81
.81
76
66
66
7
.87
.7 9
.81
76
6 3
65
8
.82
. 76
.84
67
58
7 1
9
.87
.83
. 90
76
68
81
Adults
.92
-
-
85
-
-
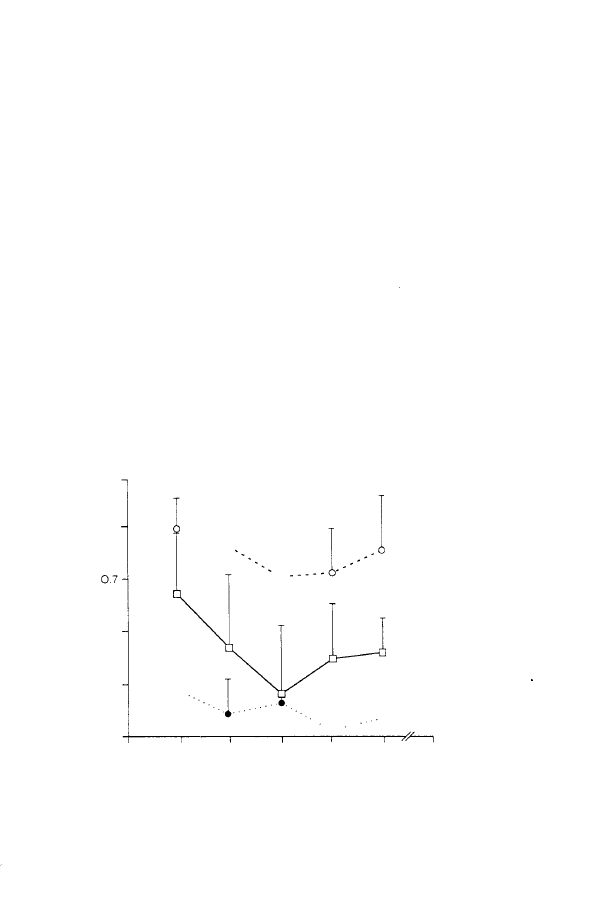
The parameters of the log-regression between velocity and
perimeter were computed individually for each subject.
6
displays the mean values of the slope, and Table
3
lists the
coefficients of correlation,
well the percentage of the variance
6.
ISOCHRONY AND ACCURACY OF DRAWING
129
explained by each regression
(r2x 100).
The latter may be
considered as a measure of the statistical reliability of the slope
estimates.
Whatever the age, the correlations were rather high (from
.77
to
.90),
which suggests some general global influence linking
velocity and perimeter. The
r2
values show that at least
58%
of
the variation of velocity was explained by the variation of
perimeter (or vice versa), and
85%
at maximum for our data.
There was no significant effect to be reported with the
correlations. Turning to the slope of the function relating
velocity and perimeter, it will be recalled that a slope value of
1
is
expected for a complete isochrony. Mean slope values ranged
from
.41
to
.80
in children and they strongly distinguished
between the different experimental tasks. They were
significantly higher in the seriation task than in the two other
tasks, and higher in the random task than in the bear task.
Dynamic compensation between speed and trace length was
thus strongly affected by the context within which the drawings
0.9
0.8
�
0.6
0.5
0.4
4
.... .1 I
1.
I
•
·1··
5
6
7
8
9
Adults
Age (yrs)
o Random
•
Bear
o
Seriation
FIGURE 6:
Analysis of isochrony: slope of the velocity-perimeter regression
(mean and the
95%
confidence interval) as a function of task and age.
130
A.
VINTER
& P.
MOUNOUD
were performed, and the results appear rather counter
intuitive: the velocity-trace length covariation was optimal, ie,
tended towards complete isochrony (slope
=
1),
when a strong
constraint was imposed on the regularity of the trace length
increment, as in the case of the seriation task. It might have
been more intuitive to expect a good covariation in the random
task, where the velocity-trace length
was free of
any supplementary constraint. Furthermore,
regulations were considerably disorganized in a classical
drawing task, such as that of a bear drawing. We will further
elaborate on this context effect within a more critical
perspective.
A significant age effect for the slope values was also evident
where the distribution
toward a U-shaped function (the
quadratic trend was significant). Slopes decreased between
5
and
7-8
years, and increased again between
7-8
and
9
years.
isochrony seemed to be higher at
5
years than at
9
years whatever the task, such that data from
adult sample
did not differ from those obtained at
5
years. These results
related to age support our hypothesis of a non-monotonic
evolution of isochrony, and are in line with other developmental
data related to skill acquisition.
Discussion
The greater isochrony of movements in the seriation rather than
the random task was quite unexpected. Different hypotheses
may account for this result. One is based on a methodological
and economic argument. The order in which the circles were
drawn in our tasks was, by necessity, different; the smallest one
for the seriation, any size for the random task, and
systematically one of the two biggest
or trunk) for the bear
task. We observed that drawing
larger circles
(seriation) was the most
condition for observing
isochrony, whereas drawing increasingly smaller figures (the
bear task) was the least favorable. When a series of circles is to
be drawn, it is possible that the first figure would be drawn with
maximally
movement, involving a lower velocity than
would be spontaneously selected for tracing a figure of that given
size. Underestimating the velocity for a
size (seriation)

6.
ISOCHRONY AND ACCURACY OF DRAWING
13 1
might be a favorable condition for isochrony, because velocities
will necessarily increase afterwards both because of the
increasing size and a weaker control of movement. By contrast,
underestimating the velocity for a big size (bear) might have the
reverse effect on isochrony. From this line of reasoning, the
random task would constitute the more appropriate context for
measuring isochrony, and the context effect we reported here
would mainly be due to an anchoring effect on the first executed
figure.
Asking the subject to draw a series in decreasing order of size
would be an important test of this hypothesis and was done in a
pilot study (Mounoud et aI, 1985). However, the results reported
there do not lend support to our present methodological
argument. Isochrony was also high in that drawing context,
and a developmental trend similar to the one we observed in the
present study was reported. Thus, a more substantial hypothesis
may be suggested. We may argue that the seriation context
constrains the subject to globally planning movement over the
entire series. The subject's goal is seen not as the execution of a
particular movement size, but as the execution of a particular
size increment which does not change through the series. A
corresponding velocity increment would be associated with the
selected amplitude increment, and would remain approximately
unchanged over the series. A good covariation between
perimeter and velocity would result from such global planning.
The seriation task would be a facilitating context for isochrony
but the random task would be neutral. The bear task might
appear to be a non-facilitatory task because of the predominance
of local size differences.
Our results show that if isochrony characterizes movement
from an early age, it undergoes non-monotonic development.
This was clear in both the random and the seriation task, where·
a decrease between 5 and 7 years and then an increase in
performance was observed. Isochrony surely constitutes a very
basic property of human motor organization; however, it cannot
be conceived of as an automatic compensatory mechanism. The
kind of development that it undergoes during childhood shows
that determinants of a higher order intervene in this process.
The explanations offered currently to account for this

132
A.
VINTER
& P. MOUNOUD
discontinuity in motor skill acquisition are all interesting, but,
in our opinion, none may be sufficient.
Hay (1981) suggested that the decline in perfonnance at around
age 7 was mainly due to the use of visual and kinaesthetic
feedback processes to calibrate movement. Consistent
behavioural evidence lends support to this hypothesis (see, for
instance, Corbetta, 1989, for a similar finding in a bimanual
coordination task), but it is also known that infants go through a
similar developmental progression for reaching movements.
They strongly rely on visual feedback processes between 4 and 5
months of age, and again between 7 and 10 months (Bushnell,
1985; von Hofsten, 1980; Mounoud, 1983; Lasky, 1977; McDonnell
and Abraham, 1981; Vinter, 1990). If the use of visual feedback to
calibrate movement inevitably involves a decline in
performance, and thus is non-monotonic in development, what
must be explained is why such phases are recurrent in
development. Therefore the question remains: why does
movement need to be visually calibrated several times during
development? And why do the non-monotonic periods always
occur after a phase of competence in which movement is
correctly pre-programmed?
Wann (1986) stated that a non-monotonic trend in handwriting
acquisition may be due to the fact that at a certain time in the
acquisition process, writing pressure (on the pen) may be
responsible for the dysfluency of stroke production. Writing
pressure would be higher at a certain time of development
because, in learning to write, the child has to perform smaller
and more continuous strokes, involving the more distal parts of
hand and finger muscles. This factor may be important, but it is
strictly linked to writing skill. However, a non-monotonic trend
seems to characterize many motor skill acquisition processes,
with
rather conclusive evidence for a critical period at around 7
years.
Meulenbroek and van Galen (1988) suggested that the decline in
performance observed in handwriting with respect to some
parameters (number of velocity inversions) may occur because
children at this age try to produce more accurate shapes of the
graphemes. We did not observe more accurate size reproduction

6.
ISOCHRONY AND ACCURACY OF DRAWING
133
at 7 years, but nevertheless reported greater regularity for the
spatial aspects of drawing movements at this age than earlier.
The implicit hypothesis of Meulenbroek and van Galen is that
decline at one level benefits progress at another level. A non
monotonic trend would emerge as long as higher control is put
on some aspects of movement without the capacity to integrate or
coordinate these specific aspects with the other. From this
perspective, a fundamental determinant of discontinuity might
be searched in the manner that behaviour (or movement) is
segmented. The segmentation problem is certainly one of the
important questions in developmental psychology (see Mounoud,
1986; Vinter, 1988), but it still remains unclear why behaviour
should undergo a segmentation process several times in
development.
Mounoud (1981) stated that different coding systems appear
during development at defined ages (the conceptual coding
system appearing at around age 2), implying a repetitive process
of knowledge construction. Motor skills would not escape this
recurrent re-building process. Therefore, during childhood,
conceptual factors transform characteristics of the perceptual
motor coordinations that already exist or that are established
during this time. Thus, behaviour is always under the control of
at least two organizations that depend on the coding system
upon which they are based. Although appealing, this model does
have an important shortcoming in regard to the discontinuity
problem, because it does not take into consideration the role that
the level of complexity of motor skills can play in the appearance
of these non-monotonic periods.
How can we account for our results with this latter perspective?
The performance of the 5-year-old children, which seems
optimal with regard to isochrony, may be controlled by the
previous perceptuo-motor behavioural organization, and not yet
be affected by the re-building process that characterizes
developing conceptual organization. When children become
sensitive to the logical structure of a seriation task, with respect
to the property of length, (which requires a primitive
understanding of transitivity and occurs at around 6 years
according to Piaget and Inhelder, 1941), a temporary
disorganization between temporal and spatial aspects of

134
A.
VINTER
& P.
MOUNOUD
movement may result. Seven-year-old children would be
completely focused on the necessity of producing a regular trace
length increment, adopting in consequence a stronger control of
movement, with a strategy of constant velocity. Visual feedback
is strictly needed at that time. Then, between 8 and 9 years,
movement can be released from this control, and children can
focus on accuracy and learn to coordinate absolute with relative
size reproduction. At that point, movement can again manifest
one of its natural and spontaneous characteristics (isochrony).
In conclusion, beyond the developmental aspect, our study
suggests that context plays an important role in the assessment
of drawing skill, although this role may interact with age.
Detailed task analysis appears indispensable for such an
assessment, and may constitute a fruitful direction of research
for the understanding of motor skill acquisition.

·
REFERENCE LIST
Arnheim, R.
(1956).
Art
A
of the
London: Faber
&
Faber.
Ayres, L
.
P
. (1912).
A
for
of
of school children.
New York: Russell Sage Foundation.
Bard,
C,
Fleury, M., Carriere,L. and Bellec, J.
(1981).
Components of the coincidence
anticipation behavior of chilren aged
6
to
11
years.
Motor
5,2, 547-
556.
Bard,
C
and Hay, L.
(1983).
Etude ontogenetique de la coordination visuo-manuelle.
Canadian Journal of
'J], 390-413.
Binet, A. and Courtier, J.
(1893).
Sur la vitesse des mouvements graphiques. Revue
664-671.
Blote, A.W., Zielstra. E.M. and Zoetewey, M.W.
(1987).
Writing posture and writing
movement of children in kindergarten.
Human
13., 323-
341.
Broderick, P. and Lazlo. J.1.
(1987).
The drawing of squares and diamonds: a perceptual
motor task analysis.
of
44-61.
Broderick, P. and Lazlo, J.I.
The effects of varying planning demands on drawing
components of squares and diamonds.
Child
45. 18-
27
Brooks, V.B., Cooke, J.D. and Thomas, J.S.
(1973).
The continuity of movements. In
R.B. Stein, K.G. Pearson, R.S. Smith
&
J.B. Redford (Eds.),
of
New York: Plenum Press, pp.
257-272.
Brown, J.V., Sepehr, M.M., Ettlinger, G. and Skreczek, W.
(1986).
The accuracy of
aimed movements to visual targets during development: the role of visual information.
Journal of
Child
41, 443-460.
Bushnell, E.W.
(1985).
The decline of visually guided reaching during infancy.
Behavior and
8, 139-155.
Corbetta, D.
(1989).
Le
developpement de la bimanualite chez l'enfant: symetrie et
asymetrie des mouvements.
Geneva.
Dunham, P. and Reid, D.
(1987).
Information
effect of stimulus speed
variation on coincidence-anticipation of
Journal of Human
13, 151-156.
Dunham, P., Allan, R. and Winter, B.
(1985).
Tracking ability of elementary school-age
children.
and Motor
@, 771-774.
Fitts, P.M.
(1954).
The information capacity of the human motor system in controlling
the amplitude of the movement. Journal of
47, 381-391.
Freeman, F.N.
(1914).
Experimental analysis pf the writing movement.
17, 1-46.
Gachoud, J-P., Mounoud, P., Hauert, C-A. and Viviani, P.
(1983).
Motor strategies in
lifting movements: a comparison of adult and children performances. Journal of Motor
Behavior,
15,202-216.
Groff, PJ.
(1961).
New speeds of handwriting.
564-565.
Harris, T.L. and Rarick, G.L.
(1959).
The relationship between handwriting pressure
and le�ibility in handwriting in children and adolescence.
of
28, 65-84.
Hauert,
CA.
(1980).
Proprietes des objets et proprietes des actions chez I'enfant de
2
a
5
ans. Archives de
185,95-168.
Hay, L.
(1978).
Accuracy of children on an open-loop pointing task.
Motor
47, 1079-1082.
Hay, L.
(1979).
Spatial-temporal
of movement in children: motor program
versus feedback in the development
reaching. Journal of Motor
11, 189-
200.
L.
(1981).
The effect of amplitude and accuracy requirements in movement time in
Journal of
n, 177-186.
Hay, L.
(1984).
Discontinuity in the development of motor control in chlidren. In W.
Prinz
&
A.F. Sanders (Eds.),
and motor
Berlin: Springer Verlag.
Hofsten, C. von. (1980). Predictive reaching for moving objects in human infants.
Journal of
JQ, 369- 382.
Kirk, U. (1985). Hemispheric contributions to the development of graphic skill. In C.
Best (Ed.),
function and
in the child. New York: Academic
Press, pp. 193-228.
Lacquaniti, F., Terzuolo, C. and Viviani, P. (1983). The law relating the kinematic and
figural aspects of drawing movements. Acta
54, 115-130.
Lacquaniti, F., Terzuolo, C. and Viviani, P. (1984). Global metric properties and
preparatory processes in drawing movements. In S. Kornblum & J. Requin (Eds.),
states and
Hillsdale, NJ: Erlbaum.
Lasky, R.E. (1977). The effect of visual feedback of the hand on the reaching and
retrieval behavior of young infants. Child
48, 112-117.
McDonnell, P.M.
and
A
b
r
a
h
a
m,
W.C. (1981). A
longitudinal study of prism adaptation
in infants from six to nine months of age. Qilld
�, 463-469.
-
Meulenbroek, R.G.J. and van Galen, G.P. (1986). Movement analysis of repetitive
writing behaviour of first, second and third grade primary school children. In H.S.R.
Kao, G.P. van Galen & R. Hoosain (Eds.),
research in
Amsterdam: North Holland.
Meulenbroek, R.G.J. and van Galen, G.P. (1988). The acquisition of skilled
handwriting: discontinuous trends in kinematic variables. In A.M. Colley & J.R. Beech
(EJ?s.),
and Action in
Amsterdam: North Holland.
Michel, F. (1971). Etude experimentale de la vitesse du geste graphique.
Neuro s cholo
,
2
,
1-13.
Mounoud, P. 1981). Cognitive development: construction of new structures or
construction of Internal
In I.E. Sigel, D.M. Brodzinsky & P.M. Golinkoff
(Eds.), New directions
and
Hillsdale, N.J: Lawrence
Erlbaum.
Mounoud, P. (1983). L'evolution des conduites de
cornme illustration d'un
mod,ele de
In S. de Schonen (Ed.),
dans la
annee. Pans.
75-106.
Mounoud, P.
Action and cognition. In M.G. Wade & H.T.A. Whiting (Eds.),
Motor
in children. Dordrecht: Nijhoff.
Mounoud, P.
Similarities between developmental sequences at different age
periods. In I. Levin
and structure. Norwood: Ablex, pp. 40-58.
Mounoud, P., Hauert, C-A, Mayer, E., Gachoud, J-P., Guyon, J., & Gottret, G. (1983).
Visuo-manual tracking strategies in the 3- to 5-year-old child. Archives de
51,23-33.
Mounoud, P., Viviani, P., Hauert, C-A, & Guyon, J. (1985). Development of visuo
manual tracking in the 5- to 9-year-old boys. Journal of
Child
115-132.
Mounoud, P., Corbetta, D., Hauert, C-A and Viviani, P. (1985).
Pellizzer, ,G. and Hauert, C-A. (1989). Manual pointing at visually lateralized targets in
children and adults. Paper presented at the INS Conference, Ansvers, Belgium.
Pew, R.W. and Rupp, G.L (1971). Two quantitative measures of skill development.
Journal of
E
eriment
I
Ps cholo
1-7.
Piaget, J., & Inhelder, B. (1941 .
Le
des
chez
l'enfant. Paris et Neuchatel: Delachaux & Niest
Piaget, J. and Inhelder, B. (1969). The
of the
London: Routledge &
Kegan Paul.
Rigal, R.A (1976). Efficience manuelle et vitesse d'ecriture.
de
25, 391-400.
Sciaky, R., Lacquaniti, F., Soechting, J.F. and Terzuolo, C. (1988). A note on the
kinematics of drawing movements in children.
Schneider, R. (1987).
Le
concept d'unite d'action motrice.
Ph.D.
Geneva.
Silk, A.M. and Thomas, G.V. (1988). The development of size scaling in children's figure
drawings. British
Q, 285-299.

Smith, AC. and Reed, G.F. (1959).
An
investigation of the relative speeds
of left and right handed writers. Journal
94, 67-76.
Sovik, N. (1975).
of
and
behaviour. The
NRCSH, Norway: Universitetsforlaget.
Thomas, G.V. and Tsalini, A. (1988). Effects of order of drawing head and trunk on
their relative sizes in children's human figure drawings. British Journal of
Q, 191-203.
Thelen, E. and Fisher, D.M. (1983). The organization of spontaneous leg movements in
newborn infants. Journal of
15,353-377.
Van Galen, G.P. (1980).
and drawing: a two stage model of complex motor
behavior. In G.E. Stelmach &
Requin (Eds.), Tutorials in Motor Behavior.
Amsterdam: North Holland, pp.567-578.
Vinter, A. (1988). Perception of facial movements in infancy: some reflections
in
relation to
perceptIOn. Visible
1, 78-111.
Vinter,
A
Manual imitations and reaching behaviors: an illustration of action
control in infancy. In C. Bard, M. Fleury & L. Hay (Eds.),
of
coordination
Viviani, P., & McCollum, G. (1983). The relation between linear extent and velocity in
drawing movements.
10,211-218.
Viviani, P., & Cenzato, M. (1985). Segmentation and coupling in complex movements.
Journal of
Human
and Performance, 11,828-845.
Viviani, P., & Terzuolo, C.
Space-time invariance in learned motor skills. In G.E.
Stelmach & J. Requin
Tutorials in motor behavior. Amsterdam: North-Holland.
Viviani, P. and Terzuolo, C. (1982). Trajectory determines movement dynamics.
Neuroscience,1,431-437.
Viviani, P. and Terzuolo, C. (1983). The organization of movement in handwriting and
typing. In B. Butterworth (Ed.),
Vol. II:
and
other
New York: Academic Press.
Viviani, P. and Zanone, P.G. (1988). Spontaneous covariations of movement parameters
in 5- to 7-year-old boys. Journal of
20, 5-16.
Wann, J.P. (1986). Handwritin� disturbances: Developmental trends. In H.T.A. Whiting,
& M.G. Wade (Eds.), Themes In motor
Dordrecht: Martinus Nijhoff.
Wann, J.P. (1987). Trends in the refinement and optimization of fine- motor trajectories:
observations from an analysis of the handwriting of primary school children. Journal of
12, 13-37.
Wann, J.P. (1989). The appraisal of the velocity-curvature relation in children's hand
movements: a research note. Journal
2, 145-150.
Wann, J.P. and Jones, J.G. (1986). Space-time invariance in handwriting: constrasts
between primary school children displaying advances or retarded handwriting
acquisition. Human Movement Science, 5" 275-296.
Wann, J., Nimmo-Smith,
I.
and Wing, A.M. (1988). Relati0n between velocity and
curvature in movement: equivalence and divergence between a power-Law and a
Minimum-Jerk-Model. Journal of
1, 622-637.
Zanone, P-G. (1987).
La
poursuite visuo-manuelle chez l'enfant et l'adulte. Unpublished
Ph.D. Thesis, Geneva.
Ziviani, J. (1984). Some elaborations on handwriting speed in 7- to 14-year-olds.
and Motor
5.,a, 535-539.
Document Outline
Wyszukiwarka
Podobne podstrony:
The contribution of symbolic skills to the development of an explicit theory of mind
Development of Carbon Nanotubes and Polymer Composites Therefrom
Development of BBM turbine
Development of financial markets in poland 1999
Development of a highthroughput yeast based assay for detection of metabolically activated genotoxin
01 [ABSTRACT] Development of poplar coppices in Central and Eastern Europe
Development of vertical bulb turbine
Development of organic agriculture in Poland, Technologie
Aristoteles # Guthrie (The Development of Aristotle's Theology 1) BB
Development of wind turbine control algorithms for industrial use
An experimental study on the development of a b type Stirling engine
DEVELOPMENT OF FACTORING MARKET IN TURKEY
Progressive development of sonographic features
Advanced Methods for Development of Wind turbine models for control designe
Development of Communist Theory
Development of Plot Plan
Development of Carbon Nanotubes and Polymer Composites Therefrom
Jung, Carl Gustav Volume 17 The Development of Personality
więcej podobnych podstron