
Growth,
Employment,
and Equity


Growth,
Employment,
and Equity
The Impact of the Economic
Reforms in Latin America
and the Caribbean
Barbara Stallings
Wilson Peres
UNITED NATIONS
Economic Commission for Latin America and
the Caribbean
BROOKINGS INSTITUTION PRESS
Washington, D.C.

about brookings
The Brookings Institution is a private nonprofit organization devoted to research, educa-
tion, and publication on important issues of domestic and foreign policy. Its principal pur-
pose is to bring knowledge to bear on current and emerging policy problems. The Institu-
tion maintains a position of neutrality on issues of public policy. Interpretations or conclu-
sions in Brookings publications should be understood to be solely those of the authors.
Copyright © 2000
united nations economic commission for
latin america and the caribbean
All rights reserved. No part of this publication may be reproduced or transmitted in any
means without written permission from the Brookings Institution Press.
Growth, Employment, and Equity: The Impact of the Economic Reforms in
Latin America and the Caribbean may be ordered from:
brookings institution
press,
1775 Massachusetts Avenue, N.W., Washington, DC 20036. Telephone: 800/
275-1447 or 202/797-6258. Fax: 202/797-6004. Internet: www.brookings.edu.
Library of Congress Cataloging-in-Publication data
Stallings, Barbara.
Growth, employment, and equity : the impact of the economic reforms in
Latin America and the Caribbean / Barbara Stallings and Wilson Peres.
p.
cm.
Includes bibliographical references and index.
ISBN 0-8157-8087-7 (acid-free)
1. Latin America—Economic policy. 2. Caribbean Area—Economic
policy. 3. Latin America—Economic conditions—1982– 4. Caribbean
Area—Economic conditions—1945– 5. Free enterprise—Latin America.
6. Free enterprise—Caribbean Area. I. Peres, Wilson. II. Title.
HC123 .S83 2000
00-008633
338.98—dc21
CIP
9 8 7 6 5 4 3 2 1
The paper used in this publication meets minimum requirements of the
American National Standard for Information Sciences—Permanence of Paper
for Printed Library Materials: ANSI Z39.48-1984.
Typeset in Adobe Garamond
Composition by Cynthia Stock, Silver Spring, Maryland
Printed by R. R. Donnelley and Sons, Harrisonburg, Virginia

Foreword
vii
Preface
xi
1
A New Approach to Analyzing Reforms: Macro-Micro Linkages
1
The Literature on the Reforms
2
A New Conceptual Framework
7
Six Propositions
11
Methodological Considerations
13
2
The International Context: Trade and Capital Flows
17
Latin American Trade Relations
19
Capital Flows to Latin America
25
Conclusions
33
3
Structural Reforms and Public Policies
35
First Generation Structural Reforms
36
Macroeconomic Policies and Outcomes
51
Links between Reforms and Macroeconomic Policy
62
Social Policy and Social Expenditure
64
Conclusions
70
4
Investment, Productivity, and Growth:
Recovery and Modest Advances
72
Long-term Trends in Investment and Productivity
75
Post-Reform Phases of Investment and Technological Change
80
Contents
v

vi
vi
The Impact of the Reforms on Investment
86
Reforms and Growth
88
Accounting for Differences in Growth
92
The Impact of the Reforms on Growth
99
Growth and the External Sector
102
Conclusions
107
5
Employment and Equity: Continuing Challenges
110
The Supply Side: Demography and Education
113
The Impact of the Reforms on Employment
116
Wages and the Wage Differential
126
Trends in Primary Income Distribution
129
The Impact of the Reforms on Household Income
Distribution
137
The Impact of Social Expenditure on Equity
142
Conclusions
149
6
Heterogeneity in Responses of Sectors and Firms
153
The Sectoral Dynamics of the Economy as a Whole
155
Specialization and Heterogeneity in Manufacturing
166
Specialization and Polarization in Agriculture
178
Natural Advantages and Access to Foreign Investment
in Mining
182
Technological Revolution and Privatization in Electricity
and Telecommunications
186
Increasing Heterogeneity in Sectoral Employment
191
Conclusions
199
7
A Policy Agenda for the Next Decade
202
The Reforms and Their Impact
202
Recommendations to Improve the Outlook for the Region
210
Concluding Comments
221
References
225
Additional Project Publications
233
Index
239
C O N T E N T S

Foreword
T
he impact of the economic reforms undertaken by
Latin American and Caribbean countries in the last
two decades is at the core of the economic policy debate in the region as we
enter the new decade. Trade opening, financial liberalization, and
privatizations have radically changed the rules of the game under which
business and labor operate. Changes in macroeconomic policy, which ac-
companied or preceded the reforms, sometimes reinforced their effects on
special targets of structural reforms—particularly export growth—but some-
times ran in the opposite direction. The combined result was new market
structures and changes in microeconomic behavior.
The evaluation of the effects of the reforms on economic growth, em-
ployment, and income distribution goes well beyond the interests of aca-
demic economists. Governments, political parties, and social actors are all
demanding more in-depth evaluations of the results in order to design or
propose policies that complement the reforms or correct their undesired
effects. The Economic Commission for Latin America and the Caribbean
(ECLAC) is actively participating in this process.
This book is the most important and comprehensive effort that ECLAC
has undertaken to study the impact of the reforms. Although in recent
years we have published several works that address this issue, their scope
was much more limited, focusing on specific macroeconomic variables,
such as growth or employment, or on specific productive sectors. The cur-
rent endeavor constitutes a major effort to integrate analytical approaches
vii

F O R E W O R D
viii
and knowledge developed across ECLAC divisions, subregional headquar-
ters, and country offices.
The evaluation of the impact of the reforms has been a difficult task.
Data are poor, particularly for smaller economies. Even for larger coun-
tries, disaggregated information is seldom available. A three-year research
project was necessary to produce new data and to analyze those data for
nine countries in Latin America and the Caribbean. All large and most
medium-size countries in the region were studied in the project, and small
countries from all subregions (Central America, the Caribbean, and South
America) were also included. We believe that the resulting analysis will
provide important inputs for the policy debate.
The authors show that the reforms had a surprisingly small effect on
growth and equity at the aggregate level. Although there are clear signs of
recovery with respect to the 1980s, the changes in economic policy have
not boosted performance in the ways that their proponents had predicted.
While most countries have been successful in lowering inflation rates, the
reforms may have made problems worse in other areas, especially employ-
ment. At the country level, substantial heterogeneity was found. One group
of countries with especially problematic initial conditions became aggres-
sive reformers, while others with a better record in the past were more
cautious about embarking on profound changes. The fact that, on average,
the former group has seen GDP expand more rapidly in the 1990s owes in
large part to a catch-up process, once gross macroeconomic imbalances
were corrected.
Unlike most other studies, this one did not stop at the aggregate or
country levels. Indeed, one of the most important parts of the book is the
sectoral and microeconomic analysis. These levels show evidence of more
significant impacts of the reforms. Trade liberalization and privatization
were instrumental in fostering market restructuring, which led to the entry
of new actors and to new investment, particularly of foreign origin. Stron-
ger competition from imports and from new actors in the domestic market
led to widespread modernization, particularly in sectors undergoing rapid
technological change, such as telecommunications. In other activities such
as agriculture or manufacturing, the reforms fostered specialization and
thus increased efficiency, but they also led to greater heterogeneity or even
polarization between modern and traditional producers. Large firms, espe-
cially subsidiaries of transnational corporations, were the leaders in both
investment and the incorporation of new technologies. Small domestic firms
presented a very heterogeneous performance, but continued to produce
viii

F O R E W O R D
mainly for the domestic markets. Consequently, they performed better when
macroeconomic conditions were favorable.
The international economy has played an important, but contradic-
tory, role in the reform process. Renewed access to international financial
markets enabled countries of the region to break out of the foreign ex-
change constraint they faced during the 1980s. At the same time, the new
flows have proved extremely volatile, causing substantial damage when they
reversed course in 1994–95 and 1998–99. Latin American and Caribbean
economies remain vulnerable to the trends in financial flows since exports
have not grown as fast as imports, producing a widening trade gap that
needs to be financed.
The book concludes that the reforms had favorable effects in several
areas, but they were not sufficient to foster dynamic, stable economic growth
in the region. Moreover, the region’s problems in the areas of unemploy-
ment and inequality will not be resolved unless the reforms are comple-
mented with policies to foster competitiveness, job creation, and a better
income distribution. The final chapter of the book presents a set of policy
proposals that are well integrated into current ECLAC efforts to develop a
comprehensive policy strategy on growth, equity, and citizenship.
ECLAC could not have developed such a large project without the
cooperation of an extensive network of researchers in each of the nine coun-
tries, who undertook field research, the production of new data, and coun-
try analyses. The creation of this network is another positive spillover of
the project that resulted in this book. The coordination of a large number
of consultants was handled through a two-tier organization of the project.
Under the general guidelines of the project director, Dr. Barbara Stallings,
four module coordinators and nine country coordinators supervised con-
sultant work and undertook a significant part of the analysis included in
this book. Four other books, including the detailed analysis and results
developed in the modules on investment, technological progress, employ-
ment, and income distribution, will be published in both Spanish and En-
glish during the coming months. In addition, volumes are being published
in the nine countries to present the analyses of each of the national reform
processes. The basic working papers that provided much of the raw mate-
rial for the project are available on the ECLAC website (www.eclac.cl).
External financing came from a number of international donors. First
of all, we would like to acknowledge the central role of the Ministry of
Development Cooperation of the Government of the Netherlands, which
provided the basic grant for the project. The International Development
ix

Research Centre of Canada (IDRC) also provided substantial funding, which
enabled us to expand the scope of the project in important ways. These two
sources were complemented by funds from the Ford Foundation and the
Swedish International Development Agency. We are extremely grateful to
all of these donors, without whose support the project could not have been
undertaken.
José Antonio Ocampo
Executive Secretary
U.N. Economic Commission for
Latin America and the Caribbean
xx
F O R E W O R D

Preface
xi
T
his book is the synthesis of a multi-year project to
investigate the impact of the economic reforms in
Latin America and the Caribbean. The project was a joint venture between
the United Nations Economic Commission for Latin America and the
Caribbean (ECLAC) and local researchers in the nine countries covered by
the study: Argentina, Bolivia, Brazil, Chile, Colombia, Costa Rica, Jamaica,
Mexico, and Peru.
The methodology of the project, which is presented in chapter 1, re-
sulted from the long-term interaction between two ECLAC divisions: the
Economic Development Division and the Division of Production, Pro-
ductivity, and Management. This collaboration produced an innovative
approach to the evaluation of the impact of the reforms, which focuses on
the interaction of macroeconomic, sectoral, and microeconomic variables.
Coordinating different research methodologies was not an easy task, but
the learning process it implied was useful for our approach in this book
and should lead to other research advances in the future.
The project produced a large amount of new data as well as new inter-
pretations of the reform process. While much of the macroeconomic and
social data came from existing ECLAC sources, we were also able to draw on
a historical database of output and investment statistics. The sectoral infor-
mation on investment was produced by the project, while information on
productivity and firm performance derived from other closely related
ECLAC research activities. Important sources for the analysis of employ-
ment and equity resulted from special processing of household surveys.

Obtaining new data was particularly difficult in the smallest countries.
In several cases, especially in Jamaica, we could not get the type of informa-
tion needed to undertake comparative sectoral analysis or time series long
enough to allow significant quantitative analysis. These shortcomings some-
times resulted in the use of ad hoc subsets of countries when dealing with
specific issues, which is apparent in the chapters that discuss investment,
productivity, and employment at the country and sectoral levels. In a simi-
lar way, we did not have data on all variables for the full period through
1998. Had we insisted on always including all nine countries for the whole
period, several crucial topics would have been omitted from the analysis.
In the trade-off between comprehensiveness and relevance, we opted for
the latter.
The project was organized along two axes: topics and countries. Five
topical modules set the substantive agenda; each was directed by an ECLAC
economist or consultant. The five included reforms and public policies,
directed by Barbara Stallings; investment by Ricardo Bielschowsky and
Graciela Moguillansky; technological change by Jorge Katz; employment
by Jürgen Weller; and equity by Samuel Morley. The results of the modules
provided basic inputs for various chapters of the book, as will be seen through
specific acknowledgments. Volumes consisting of the analysis and conclu-
sions of the investment, technology, employment, and equity modules will
also be published separately. A list of these and all other project publica-
tions is included in a special section at the end of the book.
Country coordinators were in charge of the project in each of the nine
countries. They identified consultants to carry out the studies, supervised
the research in collaboration with the module coordinators, and produced
edited volumes to analyze the particular characteristics of the reforms in
each country. The country coordinators were as follows: in Argentina, Daniel
Heymann, ECLAC-Buenos Aires; in Bolivia, Luis Carlos Jemio, Andean
Development Corporation; in Brazil, Renato Baumann, ECLAC-Brasilia;
in Chile, Ricardo Ffrench-Davis and Osvaldo Rosales, ECLAC-Santiago;
in Colombia, Juan José Echavarría, Fedesarrollo; in Costa Rica, Anabelle
Ulate, University of Costa Rica; in Jamaica, Damien King, University of
the West Indies; in Mexico, Fernando Clavijo, Estrategia y Análisis
Económico Consultores; and in Peru, Alberto Pasco-Font, Grupo de Análisis
para el Desarrollo (GRADE).
An external advisory committee provided very useful advice on the
project. It was constituted by six people who combine experience with
both policymaking and research. Members were Nancy Birdsall, former
P R E FA C E
xii

executive vice president of the Inter-American Development Bank, now
senior associate at the Carnegie Endowment for International Peace; René
Cortázar, former minister of labor in Chile, former researcher at the Eco-
nomic Research Corporation for Latin America (CIEPLAN), and currently
executive director of Chilean National Television; Norman Hicks, senior
economist in the Latin American and Caribbean Division of the World
Bank; Juan Antonio Morales, president of the Central Bank of Bolivia and
professor of economics at the Catholic University of Bolivia; Pitou van
Dijck, professor of economics at the University of Amsterdam; and Dorothea
Werneck, former minister of labor and industry in Brazil, former researcher
at the Institute of Applied Economics Research (IPEA), and currently man-
ager of the Brazilian Export Promotion Agency.
In addition to these colleagues, many other people were involved in
the project. Over 70 individual researchers produced working papers that
served as the basic inputs for the country and topic volumes as well as for
this book. Two of them in particular, André Hofman of ECLAC and
Stephany Griffith-Jones of the Institute for Development Studies at the
University of Sussex, made extensive contributions throughout the project
as well as writing key papers on economic growth and the international
economy, respectively. An important collateral book on the impact of the
reforms in agriculture was edited by Beatriz David and César Morales of
ECLAC’s Agricultural Development Unit. A second collateral project on
the reforms and the environment was directed by Marianne Schaper of
ECLAC’s Environment Division and Claudia Schatán of ECLAC-Mexico.
The environment project led to a number of working papers on this topic.
We are extremely grateful to all of the above individuals, both for their
contributions to the project in general and for their comments on earlier
versions of this book. We are indebted to a number of other people, as well.
Gert Rosenthal, former executive secretary of ECLAC, made the project
possible through various kinds of support. His successor, José Antonio
Ocampo, read the entire manuscript twice and provided comments and
advice that had an important impact on the book. In addition to those
already mentioned, others who commented on parts of draft manuscripts
or made special contributions to individual chapters include Oscar Altimir,
Eduardo Antelo, Reynaldo Bajraj, Hubert Escaith, Peter Evans, Enrique
Ganuza, Eric Hershberg, Rossana Mostajo, Joseph Ramos, Nola Reinhardt,
Jaime Ros, Jaime Saavedra, Rogerio Studart, Anthony Tillett, and Vivianne
Ventura Dias.
The project was financed by the Netherlands Ministry for Develop-
P R E FA C E
xiii

ment Cooperation, the International Development Research Centre of
Canada (IDRC), the Ford Foundation, and the Swedish International De-
velopment Agency (SIDA). Beyond the financial contributions of the vari-
ous institutions, we would also like to thank several individuals who were
especially helpful: Klaas van der Tempel and Menno Lenstra, former and
current first secretaries of the Royal Netherlands Embassy in Santiago; Réal
Lavergne, program officer for IDRC; Anthony Tillett, program officer for
the Ford Foundation; and Torsten Wetterblad of SIDA.
Able assistance was provided by various people at ECLAC: Lucas
Navarro and Claudio Pini as research assistants, Ximena Sánchez and María
Eugenia Johnson in secretarial services, Dietrich von Graevenitz and Sofía
Astete in project management, and Adriana Valdés in publications arrange-
ments. Jennifer Hoover improved the manuscript substantially through
her editorial skills. At the Brookings Institutution Press, we would like to
thank Robert Faherty, Janet Walker, Larry Converse, Susan Woollen, and
Becky Clark. The index was prepared by Mary Mortensen, and the proof-
reading was done by Erin Randall. Without the help of all of these people,
this book would not exist. Of course, we remain responsible for its content.
P R E FA C E
xiv

Growth,
Employment,
and Equity


1
1
A New Approach to
Analyzing Reforms:
Macro-Micro Linkages
I
n the last ten to fifteen years, the Latin American
and Caribbean region has undergone the most sig-
nificant transformation of economic policy since World War II. Through a
series of structural reforms, an increasing number of countries have moved
from the closed, state-dominated economies that characterized the import-
substitution industrialization model to economies that are more market
oriented and more open to the rest of the world. Complementary aspects
of the process have accorded a new priority to macroeconomic stability,
especially lower rates of inflation, and to increasing expenditure in the so-
cial area. Policymakers expected that these changes would speed up eco-
nomic growth and increase productivity gains, at the same time that they
would lead to the creation of more jobs and greater equity.
Have those expectations been fulfilled? It is impossible to make more
than a preliminary analysis at this point, since in many cases the reforms
are less than a decade old. Even tentative conclusions will be useful, how-
ever. Governments must decide whether the new policies are moving in the
right direction and, even if they are, whether they would benefit from some
mid-course corrections. This requires more data and analysis than were
available when we began this project. Moreover, any conclusions that can
be drawn will be relevant beyond the boundaries of the region itself. In

2
N E W A P P ROA C H TO A N A LY Z I N G R E F O R M S
many parts of the world, including central and eastern Europe, the former
Soviet Union, Africa, some parts of Asia, and even some industrialized
countries with respect to specific policy areas, governments are experiment-
ing with similar policy changes. Since Latin America has had a head start,
others are interested in learning from its successes and failures.
The Literature on the Reforms
We are not, of course, the first to study the reforms and their impact.
During the last decade, an extensive literature has developed on the topic.
1
Early works tend to express quite rigid views—albeit with little evidence to
back them up—that the reforms would either resolve most of the socioeco-
nomic problems in the region or that they would result in disaster. With
time and experience, opinions have converged to a certain extent, and a
more nuanced evaluation has emerged. Substantial differences of opinion
still remain, however, on whether additional reforms are needed, what role
the state should play, and what can be expected of the new economic model.
These differing evaluations lead to variations in policy recommendations.
Most analysts have studied the reforms in terms of their impact on
growth. While emphasizing that growth improved with respect to the 1980s,
the majority holds that the impact was disappointing.
2
Post-reform growth
was lower than the region’s past performance, lower than in some other
regions, and lower than necessary to deal with the region’s social problems.
Others, however, say that the growth rate was as good as could be expected
or that growth would have been even slower without the reforms.
3
Most of
this analysis concentrates on the aggregate level. An important exception is
the United Nations Economic Commission for Latin America and the
Caribbean (ECLAC), which points out that the lack of dynamism was
accompanied by fundamental changes in sectoral and microeconomic mo-
1. Much of the debate was generated by two documents that were very influential in defining the
new development model that Latin American and Caribbean governments began to implement. The
World Bank (1991) introduced the concept of market-friendly policies, while Williamson (1990)
coined the term Washington Consensus. Even earlier, in the mid-1980s, Bela Balassa and three promi-
nent Latin American economists (1986) advocated many of the same reforms. Our review of the
subsequent literature focuses on those works that are broadly comparative across countries and types
of reforms. This leads to a concentration on studies produced by international organizations, which
may bias our interpretation to some extent.
2. For examples, see the analyses in ECLAC (1996); IDB (1997); Burki and Perry (1997).
3. Easterly, Loayza, and Montiel (1997); Lora and Barrera (1997).

3
N E W A P P ROA C H TO A N A LY Z I N G R E F O R M S
mentum; in particular, exports from the region had a good performance,
although they were concentrated in a few sectors and generally incorpo-
rated low levels of technology.
4
With respect to employment, the consensus is that job creation was
generally insufficient, more because of relatively slow growth of the gross
domestic product (GDP) than because of problems of employment elas-
ticities.
5
The International Labour Organization (ILO) has taken the lead
in stressing the problems in job quality. Thus Victor E. Tokman empha-
sizes that there was a strong expansion of employment during the eco-
nomic recuperation of the first half of the 1990s, but these jobs were basically
low paid and their productivity was low.
6
In addition, employment became
increasingly precarious, both because jobs were concentrated in the infor-
mal sector, generally without social security, and because modern firms
outsourced the labor process, transferring the cost of adjustment and insta-
bility to small firms and the self-employed.
Somewhat greater disagreement exists with respect to the impact of the
reforms on equity. The Inter-American Development Bank (IDB) argues
that the main deterioration in distribution occurred in the so-called lost
decade of the 1980s and that the reforms helped to slow the tendencies of
deteriorating income distribution and increasing poverty.
7
In particular, it
identifies a positive effect of the trade opening on the real income of the
first three quintiles of the income distribution, and a negative effect on the
richest 20 percent. In contrast, Bulmer-Thomas, on the basis of empirical
evidence for the period up to the early 1990s, suggests that the results of
the so-called new economic model were basically regressive in terms of
income distribution.
8
This was due to a decrease in real wages together
with an increase in unemployment, real interest rates, the weight of the
informal sector, and the concentration of wealth. The only element of the
reform process that had a progressive role was fiscal reform, according to
this analysis, in that it made possible the reduction of inflation. Similarly,
Berry points to the negative role played by trade reform, which favored
capital-intensive technology and subjected small firms to intense competi-
tive pressures.
9
4. ECLAC (1996).
5. See, for example, ECLAC (1997); Lora and Olivera (1998).
6. Tokman (1994). See also the ILO’s annual Panorama Laboral de América Latina y el Caribe.
7. IDB (1997); see also Londoño and Székely (1997).
8. Bulmer-Thomas (1996).
9. Berry (1998).

4
N E W A P P ROA C H TO A N A LY Z I N G R E F O R M S
Measuring the impact of the reforms on growth was very difficult since
so many other things were happening simultaneously. In addition, the re-
forms themselves were a process, so it was hard to capture their impact at
any particular point in time. This problem was even more acute in study-
ing employment and equity than in analyzing growth, since data are more
unreliable and the definition of relevant indicators is much more complex.
Two main strategies have been used in the literature. ECLAC, Sebastian
Edwards, and Shahid Javed Burki and Guillermo E. Perry, among others,
describe the reform process and present indicators to capture their degree
of implementation (such as the changing level of tariffs or number of priva-
tized firms).
10
This approach then relies heavily on examples, qualitative
indicators, and case studies of firms or countries to evaluate the progress of
the reforms. A different approach was followed by the IDB, which devel-
oped an index of reforms to summarize the reform process in five areas
(trade, taxes, finance, privatization, and the labor market).
11
The IDB de-
signed these quantitative indicators to address the problem that there had
been no systematic attempt to measure what had been reformed; without
such a measure it was very difficult to evaluate the impact and to separate
the reforms from other trends.
Efforts to quantify the reforms often confuse policy and performance
variables. Given that it is frequently easier to devise measures of the results
of an action than to measure the action itself, many studies mix the two
types of indicators. Thus studies on trade reform might use indicators like
the ratio of exports plus imports to GDP, while attempts to measure fiscal
reform might rely on measures like taxes as a share of GDP. In this context,
despite its limitations, the IDB’s reform index is a contribution in that it
helps to concentrate attention on the reforms themselves.
An author’s approach to characterizing the reforms is linked to the
methodology used for analyzing their effects. Authors who explicitly or
implicitly reject the possibility of measuring the reforms tend to stress the
richness and complexity of the processes and to make evaluations that are
mainly historical. They make attempts to attribute results to individual
elements of the new policy package. A particular variant of this approach is
found in an analysis by the World Bank, which says: “[our] analysis . . . of
economic performance fulfills the dual purpose of assessing the state of
reform and evaluating general economic development, under the hypothesis
10. ECLAC (1996 and 1998a); Edwards (1995); Burki and Perry (1997).
11. See especially IDB (1996); Lora (1997).

5
N E W A P P ROA C H TO A N A LY Z I N G R E F O R M S
that in the recent experience of Latin American countries, economic devel-
opment is largely a reflection of macroeconomic and structural reforms.”
12
In contrast to the historical approach are the authors who try to quan-
tify the reforms; they then use their measures as independent variables in
regression equations to “explain” economic growth or other variables of
interest. Thus, for example, growth equations of the type popularized by
Robert Barro tend to incorporate an additional variable.
13
The IDB index
serves this purpose for many analysts, but other ad hoc proxies have also
been used. In principle, analysis of this type makes it possible to separate
the influence of the reforms from that of other simultaneous events, espe-
cially macroeconomic policies; in practice, the variables are so interrelated
that the results are questionable.
Indeed, many problems exist with this literature, which is extremely
diverse in coverage as well as methodology. The quantitative analyses of the
IDB, in particular, have been criticized, both for the oversimplifications
necessary to construct the reform indexes and for the attempt to draw con-
clusions about the effects that go well beyond what the data and the (some-
times debatable) econometric analysis will bear. Nonetheless, these criticisms
should not obscure the advance that these efforts at quantification and
methodological precision signify. Neither should they minimize the prob-
lems of alternative methodologies based almost exclusively on historical
analysis that uses ad hoc examples, circumstantial evidence, and expert
opinion.
In addition to methodological problems of various sorts, four substan-
tive limitations appear in the studies reviewed.
(1) Failure to disaggregate the variables. The tendency of the analysis to
focus exclusively on variables and processes at the aggregate level makes it
difficult to capture the differences between countries, sectors, and socio-
economic actors with respect to the adoption, implementation, and im-
pact of the reforms. If a possible result of the reform process is the growing
heterogeneity of the productive structure and its performance, failure to
disaggregate makes it impossible to recognize this, much less explain it.
This problem is important at two levels.
First, the lack of attention to processes and variables at the sectoral
level hinders comprehension of the processes of specialization within the
productive system, which may affect the growth capacity of the new struc-
12. Burki and Perry (1997, p.27), emphasis added.
13. Barro and Sala-i-Martin (1995).

6
N E W A P P ROA C H TO A N A LY Z I N G R E F O R M S
tures generated by the reforms. These factors may also weaken domestic
supplier chains, reducing the impact of investment and technological
modernization.
Second, the absence of analysis and evaluation at the microeconomic
level makes it impossible to trace a key objective of the reforms: to modify
the behavior of microeconomic actors, in particular, of firms. Moreover,
no one has explored changes in entrepreneurial behavior in the areas of
investment and the incorporation of technical progress across a wide range
of countries, which would be a crucial indicator of the success or failure of
the reform process.
(2) Failure to emphasize the mechanisms of articulation between national
economies and the international context. This problem is seen in the scarce
attention that is paid to phenomena associated with the external financial
opening and to the dynamics of foreign direct investment and the assimila-
tion of technological progress. It is paradoxical because the preoccupation
with an efficient integration
into an increasingly globalized world economy
is at the center of the new model of growth. Beyond a general recognition
of the importance of the trade opening, however, the noncommercial di-
mensions of that integration do not receive adequate attention. Nor is much
attention paid to the links between the reforms, macroeconomic policies,
and the international context.
(3) Failure to consider that the package of reforms and policies may be
internally inconsistent. Although the framework of a market-friendly devel-
opment model informed the design of the reforms and the policy instru-
ments they engendered, detailed analysis of the internal consistency of the
reform package and associated policy variables is lacking. This concerns
relations among the reforms themselves, between the reforms and the mac-
roeconomic and social policies that accompanied them, and between both
the reforms and policies and the international environment in which the
new economic model has to function. The assumption of coherence has
led to the persistence of some serious problems.
(4) Scant attention to the articulation of the dynamics of employment
and the distribution of income with the rest of the model. Employment and
equity, as well as their relation to investment, productivity, and growth,
are absent from the original formulations of the Washington Consensus
and the market-friendly development model. There was a subsequent at-
tempt to link the reforms to employment and equity, but the mecha-
nisms of transmission among the various components have yet to be
adequately conceptualized.

7
N E W A P P ROA C H TO A N A LY Z I N G R E F O R M S
A New Conceptual Framework
This book builds on the literature, but it also presents significant inno-
vations to deal with the four problems identified above. The main charac-
teristic that distinguishes it from other comparative studies of economic
reforms is the focus on the interaction between macroeconomic and
microeconomic processes. To make significant advances at this time, it is
crucial to focus less exclusively on the macroeconomic and regional levels
and more on countries and the microeconomic behavior of firms, grouped
by sector, size, and ownership characteristics. Different countries and groups
of firms are affected quite differently by government policies, including
structural reforms, and by the increasingly globalized world economy. Some
have been able to take advantage of the new opportunities created, while
others have seen their situations become ever more precarious. The sum of
these behaviors produces the aggregate trends that others have observed
and measured. Knowing what lies behind the aggregates is essential for
designing policy measures to improve future economic performance.
Another way to characterize our approach is that it insists on the need
to make economic actors central to the analysis and to try to understand
their reactions to government policies in order to explain, predict, and (if
necessary) modify their behavior. In particular, we focus on entrepreneurs’
decisions on whether to invest and to incorporate new technologies. Under
what domestic and international conditions will they make positive deci-
sions? What will be the time frame for implementing investment deci-
sions? Without a positive response on investment, and without increased
productivity through technical progress and better skills for workers, me-
dium- and long-term growth cannot take place, although economic recov-
ery can occur.
A disaggregated approach is also necessary for analyzing outcomes other
than growth, especially the generation of employment and any change in
the patterns of income distribution. Job-creation capacities vary widely for
large and small firms and for firms in labor-intensive or capital-intensive or
natural resource–intensive sectors. The skill differential that characterizes
jobs in different categories of firms is then a crucial factor in determining
patterns of income distribution.
Given the centrality of economic actors for our approach, we start by
considering the reforms as a set of signals in the form of government policy
decisions. When governments want to change the way their economies
(and societies) operate, they make policy decisions and transmit them to

8
N E W A P P ROA C H TO A N A LY Z I N G R E F O R M S
the relevant actors; these decisions constitute our signals. The governmen-
tal decisions are essential for creating a new environment in which the
private sector can operate more dynamically. The environment is also in-
fluenced, both positively and negatively, by international forces that are
generally beyond the control of most governments, including capital flows,
interest rates, expansion of output in importing countries, and trade re-
gimes. These will have to be taken into consideration as well.
In addition to the signals and the environment they help to create, we
need to be concerned about the reception of the policy signals at the
microeconomic level in decentralized economies. A first issue with respect
to reception obviously involves information. Do the actors know that poli-
cies have changed and what the government is trying to signal through its
policy decisions? In the real world of imperfect information, not all actors
have access to the same formal channels, and informal channels are even
more skewed to favor some groups over others. We must therefore assume
that information will be unequally distributed, and that less powerful ac-
tors will have less access.
Information alone, however, is not sufficient. A second question con-
cerns the credibility of the information and signals. Do the actors believe
what the government says at any given moment, and do they believe that
the new policies will remain in force for the foreseeable future? If they have
doubts, they will not be willing to take the risks involved in making the
new investments that are necessary to incorporate new technology and,
ultimately, to pave the way for a new growth path.
14
Lack of credibility with respect to economic reforms arises from three
possible sources. First, the various components of the policy package may
be inconsistent. If the reforms and policies are inconsistent among them-
selves, they create mixed signals, and the recipients are confused about what
they should do. In an extreme situation, inconsistency may lead to a crisis
that precipitates a change in policy stance. Second, key sectors of the popu-
lation may not support the policies. Lack of support or, more important,
active opposition may cause the relevant actors to surmise that the policies
will be abandoned sooner or later. Third, the reforms may exist within an
14. A substantial literature has developed around the concept of credibility. Until recently, it has
focused almost exclusively on domestic factors that might affect the government’s incentives to main-
tain or change its policy stance. See, for example, Calvo (1986); Rogoff (1987); Persson (1988);
Persson and Tabellini (1989); Rodrik (1989). Recently, however, Drazen (1997) has expanded the
scope of the discussion to include international factors, which is especially relevant for our purposes.

9
N E W A P P ROA C H TO A N A LY Z I N G R E F O R M S
unfavorable international environment. Even with consistent policies and
a reasonable degree of domestic support, an unfavorable international en-
vironment, such as a lack of external finance or a sharp deterioration in the
terms of trade, will pose credibility problems. This is especially the case
with a policy package that increases the openness of the economy and thus
the dependence on external factors.
These three sources of credibility problems are closely interrelated. A
negative international environment can lead to, or increase, inconsistency
among policies. Ironically, even a positive external context (such as abun-
dant international finance) can create policy inconsistency. Either policy
inconsistency or an unfavorable environment can undermine support for
policies. Insofar as key economic actors perceive the presence of one or
more of these problems, they are likely to draw the conclusion that the
policies will be changed and will make their own decisions accordingly.
Finally, beyond information and its credibility, the economic actors
must be able to take advantage of the new circumstances. For example,
they must have access to domestic or international financial resources that
enable them to invest; they must have knowledge of the technological ad-
vances in their area; they must have access to the appropriate equipment
that embodies the new technology; and they must have workers with the
necessary training to use the new equipment they have acquired. Again, the
resources at the disposal of different actors vary substantially across sizes
and sectors of firms.
To study the processes of signaling, response, and the resulting outcomes,
we have worked with the conceptual framework shown in figure 1-1.
15
Our analytical framework begins with the external context, which we model
as variables related to international finance and the demand for Latin Ameri-
can exports. The past performance of these and other international vari-
ables has helped to determine the initial domestic conditions (economic,
social, and political) in each country. In the present, the external context
has a strong impact on government policy, making certain policy choices
more likely than others. Beyond its impact in the policy arena, external
finance facilitates investment and technical change processes, while inter-
national demand and the vagaries of financial flows have an impact on the
dependent variables, especially growth rates.
15. For this framework, we owe a debt to the authors of the World Bank’s The East Asian Miracle
(1993), despite a number of differences in the two approaches. In the early days of our thinking about
this project, when The East Asian Miracle had recently been published, it gave us a number of ideas
about how to conceptualize a vast array of variables and processes.

10
N E W A P P ROA C H TO A N A LY Z I N G R E F O R M S
Initial conditions within each of the countries are mostly determined
by domestic developments, although they are also influenced by external
factors. We take these initial conditions as given, rather than trying to ex-
plain them, but they are crucial in determining both policy choice and
response. From the perspective of policy choice, we are particularly inter-
ested in several economic variables, including growth and inflation rates,
the structure of output and employment, and links with the world economy.
Social characteristics of the population and the ability of governments to
make and implement policy decisions are also important. At the firm level,
the accumulated learning and productive capacity are elements that gov-
ernments must take into account.
Based on the initial conditions in each country and on external influ-
ence, governments make decisions on reforms (such as import liberaliza-
tion, domestic financial liberalization, opening of the capital account,
privatization, and tax reform), macroeconomic policies (including fiscal,
monetary, and exchange rate measures), and social policies (especially with
respect to education and health). Although the nine countries for this study
had undertaken substantial reforms and changes in macroeconomic and
social policies, policy decisions on individual items were not necessarily
the same. On the contrary, one of the things we want to investigate is the
difference in the choice and implementation of reforms and policies and
how this affected the outcomes.
The study analyzes investment and technical change at both the aggre-
gate and sectoral levels to see what determines the response to the reforms.
Figure 1-1. Conceptual Framework
External
context
Reforms
Invest-
ment
Growth
Initial
domestic
conditions
Social
policies
Macro
policies
Technical
change
Equity
Employ-
ment

11
N E W A P P ROA C H TO A N A LY Z I N G R E F O R M S
At the aggregate level, the response is related to the interaction of the re-
forms with macroeconomic policy and the international context. The un-
certainty created by changes in the rules of the game and the volatility of
key macroeconomic variables merit particular attention. The behavior of
these variables, and the uncertainty they generate, may lead to a delayed
response in investment and technological change. At the sectoral level, we
study the transmission mechanisms between these same variables and the
process of investment and the incorporation of new technologies. These
operate through shifts in market structure, corporate strategy, and the en-
try of new actors into specific markets.
The three dependent variables of the model are growth, employment,
and equity. Growth in the post-reform period is compared with that of the
1950–80 base period, and its components (that is, capital accumulation,
labor accumulation, and productivity) are analyzed in a growth-account-
ing framework. The characteristics of the growth process (in particular, the
types of firms that are expanding output dynamically or lagging behind)
and the decisions on the type of technology to be incorporated will deter-
mine employment generation; the latter is disaggregated by productive sec-
tors and size of firm. Employment characteristics, especially the salary
differential between skilled and unskilled workers, are important in deter-
mining the distribution of income, although this may be offset by other
economic and social trends.
Six Propositions
We use this framework to explore a set of six propositions. They take as
a point of departure the previous judgment on the impact of the reforms:
growth has been modest; employment has grown slowly and with prob-
lems in job quality; and inequality has not improved and may even have
gotten worse. The propositions, then, are directed toward answering the
question of why the impact has not been more favorable.
First, the initial conditions in the various countries were quite diverse
and affected the extent to which reforms were adopted. Variables of par-
ticular importance include macroeconomic stability, economic distortions,
past growth rates, and the degree of governability. The greater such prob-
lems in the recent past, the more willing countries are to undertake large-
scale reforms in the hope of improving future economic performance. At
the same time, a history of past turbulence and failed reform or stabiliza-
tion attempts will increase the credibility problems of governments intent

12
N E W A P P ROA C H TO A N A LY Z I N G R E F O R M S
on changing policy course. Countries that have done well in the past have
much less reason to undertake risky reforms, and there is likely to be less
support for doing so.
Second, governments frequently introduced reforms that were incon-
sistent with their macroeconomic and social policies. The most obvious
case is when high rates of inflation and deficits continued, thus leading to
uncertainty for economic actors. Even if stability is attained, however, other
contradictions may exist. For example, exchange rate appreciation, stimu-
lated by newly liberalized capital flows, prevents firms from taking full
advantage of the new export opportunities presented by trade liberaliza-
tion. The way in which budget deficits are controlled may also generate
contradictions: cutting expenditures for social policies limits growth po-
tential as well as possibly increasing inequality, while reducing public in-
vestment limits the expansion of essential infrastructure.
Third, the reforms were slow to produce an impact at the micro-
economic level because of the great uncertainty they generated, especially if
they were combined with macroeconomic instability. This led to a hesita-
tion on the part of investors to engage in large-scale projects, as they pre-
ferred to defer irreversible decisions. One possibility is that the timing of
the response is arbitrary, depending on particular country conditions. It is
also possible that a pattern can be found across countries, geared to the
level of uncertainty and its impact on investors’ risk-return calculations.
Fourth, the uneven response of actors helped to explain both the less-
than-hoped-for performance to date in most countries in the region, as
well as the differential performance across countries. We may expect a het-
erogeneous reception of the signals—creating leading and lagging sectors—
and thus the average response for the economies of the region would be
modest. The percentage of actors receiving and responding positively to
the signals also varies across countries (and across sectors and firms by
size), so that country averages vary quite substantially. Within countries
and sectors, economic actors’ past experience results in a heterogeneous
reception of, and response to, the signals from the reforms. The effects
have implications for all three of our dependent variables: growth rates,
employment, and equity.
Fifth, the positive effects of reforms were frequently undermined by
unfavorable trends in the international economy. Capital flows, for example,
helped to sustain high growth, despite contributing to distortions such as
overvalued exchange rates. However, sharp declines or reversals of—and
great volatility in—private capital flows can overwhelm the positive ef-

13
N E W A P P ROA C H TO A N A LY Z I N G R E F O R M S
fects. On the trade side, external demand can also contribute to economic
growth, but volatility in export prices and sudden declines in demand can
undermine the positive impact. The reforms have exacerbated both the
positive and negative effects by increasing the openness of the economies
to international flows.
Sixth, the reforms were incomplete in that they lacked the proper in-
stitutional support typically found in the industrial world. A key example
relates to the development of factor markets—namely, capital, technology,
and labor. Although these markets are imperfect in all parts of the world,
they are especially deficient in developing countries, including Latin America
and the Caribbean. Capital markets lack long-term segments, labor mar-
kets lack training opportunities for unskilled or low-skilled workers, and
technological progress is frequently limited to the largest firms. Another
way in which the reforms were incomplete refers to the lack of a proper
regulatory framework to complement privatization and liberalization re-
forms. For example, banking crises have been frequent in Latin American
and Caribbean countries in recent years, since local governments have failed
to establish and enforce adequate rules on reserves and lending practices.
Methodological Considerations
The focus of our approach on macro-micro relations and the central-
ity of actors has clear implications for methodology. Specifically, we must
go beyond the econometric or formal modeling techniques that typify most
of today’s economic research. We do use quantitative methods whenever
this is possible. For example, we engage in econometric analysis to explain
investment and growth outcomes as well as employment and equity pat-
terns. Many parts of the following chapters, however, require qualitative,
historical analysis. In particular, the complex interrelation of variables leads
to the use of such methodology in the sectoral analysis of investment.
The post-reform period covers a relatively short time span, and pool-
ing data before and after involves some important statistical assumptions
that may or may not be valid. Like others, we have engaged in such analy-
sis, but the results must be read with a substantial amount of caution. Our
concentration on nine countries also limits the number of possible obser-
vations, although it enables us to go into more detail on the policy and
institutional framework. In some particular cases, especially the chapter on
equity, the analysis draws on a larger set of countries, thus making econo-
metric analysis more feasible.

14
N E W A P P ROA C H TO A N A LY Z I N G R E F O R M S
The issue of timing goes beyond problems with numbers of observa-
tions. Much of the literature on reforms centers on comparisons between
the 1980s and 1990s. This clearly creates a bias in the results, since the
1980s were characterized by very low growth and the deterioration of a
variety of social indicators. A comparative analysis of the 1980s and 1990s
thus attributes to the reforms results that are merely the consequence of
recovery. To avoid this particular problem, some authors have turned to
comparisons with the 1970s. This type of comparison is also problematic
since the 1970s were a period of unusual dynamism based on borrowed
resources, which eventually led to the crisis of the 1980s. In other words,
the economic situation was not sustainable. Obviously the best possible
comparison would be with a similar economic situation in which no re-
forms had been implemented. Since this kind of counterfactual analysis is
of dubious value, our solution is to draw whenever possible on a data set
that uses as a base the 1950–80 period, which provides a better measure of
previous economic performance.
16
As implied above, the focus on nine countries has both advantages and
disadvantages. It limits the range of methodologies that can be employed,
and in some cases precludes the use of powerful quantitative techniques,
but it gives a much better understanding of the interaction of variables that
are difficult, if not impossible, to measure precisely. Since these latter vari-
ables may well provide the key to understanding the mechanisms behind
the quantitative results found by other researchers, the sacrifice may be
considered worthwhile.
The nine countries were selected because they had the longest history
of implementing economic reforms in the region. Given that the aim of
the project was to study the impact of the reforms, this was the most obvi-
ous way to select the sample.
17
Four of the countries—Bolivia, Chile, Costa
Rica, and Mexico—have reforms that date to the mid-1980s or, in the case
of Chile, to the mid-1970s with a reinvigorated period beginning in the
mid-1980s. Four others—Argentina, Brazil, Colombia, and Peru—began
16. Such a methodology is being used in a joint project by the United Nations Development
Program (UNDP), ECLAC, and the IDB. See Vos and others (forthcoming).
17. The alternative would have been a sample that mixed reformers and non-reformers, using the
latter as a type of control group. Our main reason for not using this alternative research design was
that two of the countries that would enter the sample as non-reformers (Ecuador and Venezuela) were
in such difficulties that reaching meaningful conclusions would have been impossible. Macroeco-
nomic instability and lack of consensus on the need for reforms gave rise to extremely volatile eco-
nomic conditions, under which long-term trends on investment, productivity, and other variables
could not have been detected.

15
N E W A P P ROA C H TO A N A LY Z I N G R E F O R M S
their reforms in the early 1990s.
18
Jamaica is frequently considered to be an
example of the group of earlier reformers, but our own analysis puts it in
with the latter group, indicating that the reforms are best dated as begin-
ning around 1990. Given the much longer history of the Chilean reforms,
some added weight is given to this country in the chapters that follow.
Although the countries were selected for their reform history, they also
represent the vast majority of the population, economic output, and inter-
national trade of the Latin American and Caribbean region. As can be seen
in table 1-1, the nine countries account for 81 percent of total population,
90 percent of aggregate GDP, and 88 percent of international trade (the
average of exports plus imports). In terms of per capita GDP, they are slightly
above the regional average. Finally, other characteristics of the nine coun-
18. Argentina actually had a brief experience with reforms at the end of the 1970s, but the process
was aborted and not resumed until the Menem government took office in 1989.
Table 1-1. Weight of Nine Countries in Latin America and the Caribbean,
1998
GDP
GDP
Exports
Imports
(billions
per capita
(billions
(billions
Population
of 1995
(1995
of 1998
of 1998
Country
(millions)
dollars)
dollars)
dollars)
dollars)
Argentina
36.1
304.8
8,438
25.3
31.0
Bolivia
8.0
7.6
959
1.3
2.3
Brazil
166.3
711.9
4,281
51.1
60.8
Chile
14.8
76.9
5,187
14.8
17.1
Colombia
40.8
83.9
2,056
10.9
14.6
Costa Rica
3.8
9.8
2,550
5.4
6.2
Jamaica
a
2.5
4.7
1,869
1.4
3.1
Mexico
95.8
428.1
4,467
117.3
125.3
Peru
24.8
65.5
2,642
5.7
8.2
Subtotal
392.9
1,693.2
3,605
233.2
268.6
Total Latin America
b
485.5
1,876.1
3,865
263.4
307.2
Share of nine (percent)
80.9
90.3
111.5
c
88.5
87.4
Source: Project database, on the basis of ECLAC statistics.
a. Data for Jamaica are for 1997.
b. Total Latin America includes twenty countries for population, GDP, and GDP per capita; seven-
teen countries are included for exports and imports.
c. Ratio of the weighted average GDP per capita of the nine countries to the weighted average GDP
per capita of the twenty countries.

16
N E W A P P ROA C H TO A N A LY Z I N G R E F O R M S
tries are relatively diverse. They include the three largest countries in
the region (Argentina, Brazil, and Mexico), three medium-size economies
(Chile, Colombia, and Peru), and three smaller ones (Bolivia, Costa Rica,
and Jamaica). They also have substantial geographic diversity within the
hemisphere.
Building on an in-depth analysis of this group of countries, we can
arrive at a better comprehension of the processes stimulated by the eco-
nomic reforms. We can see which countries did better and why, which
types of firms did better and why, and how the diversity affected the distri-
bution of benefits. Only with this kind of understanding will we be in a
position to propose a set of policy recommendations in the final chapter of
the book.
The book is organized in the following manner. Chapter 2 analyzes the
international context in which the reforms took place, with emphasis on
trade and capital flows. Chapter 3 discusses the reforms, macroeconomic
policies, and social policies, together with their interrelations. Chapter 4 is
the first of two chapters that focus on the aggregate level of analysis, in this
case analyzing trends in investment, productivity, and growth. Chapter 5,
then, follows with an aggregate-level analysis of employment generation
(incorporating both quantity and quality dimensions) and equity. Chapter
6 turns to the sectoral and microeconomic levels, to examine questions
that could not be answered at the aggregate level. In particular, the chapter
focuses on whether the reforms have changed the structure of output, in-
vestment, and productivity so as to provide faster, more sustainable growth
as well as adequate employment opportunities. Chapter 7 concludes with a
summary of the findings and a set of policy recommendations.

17
2
The International
Context: Trade
and Capital Flows
T
he reform process in Latin America and the Carib-
bean is taking place in the context of an increas-
ingly integrated international economy.
1
While there is a growing realiza-
tion that the current globalization process has important historical
precedents, especially in the late nineteenth and early twentieth centuries,
there is also a consensus that this wave of integration is exceptional. The
globalization of capital markets is very extensive, while the integration of
markets for goods and services, technology, and information is creating a
gradual convergence in patterns of production and consumption around
the globe.
Globalization is viewed either as a process of multilateral lowering of
policy constraints to the free movement of goods and services across na-
tional and regional borders, or as a microeconomic phenomenon led by
the strategies and behavior of corporations.
2
These strategies have caused
intense international processes of economic restructuring at both the sec-
toral and firm levels, which has resulted in the largest wave of mergers and
1. An important input for the discussion of capital flows in this chapter was Griffith-Jones (2000);
Vivianne Ventura Dias contributed to the analysis of trade. Neither is responsible for the conclusions
drawn.
2. Oman (1994).

18
I N T E R N AT I O N A L C O N T E X T F O R T R A D E
acquisitions in economic history. Behind these microeconomic processes,
we find a technological revolution, particularly in the fields of communi-
cations, information technology, and transportation. Those changes have
reduced production costs, time, and complexity, thereby strengthening the
advantages of spreading technology costs on large production runs, mar-
keting global brands, and operating at a world scale.
3
All these changes had
an impact on Latin American economic performance in the last decades.
This chapter, however, focuses on the globalization of trade and capital
flows to and from the region, since a detailed analysis of the microeconomic
dimensions of globalization, particularly the technological revolution, is
beyond the scope of the book.
The basic argument of the chapter is that trends in the international
economy have had highly contradictory effects on the reform process and
the performance of the region’s economies. The reforms in general, espe-
cially privatization and the liberalization of trade and capital accounts, pro-
vided incentives for a large increase in private capital flows to the region in
the early 1990s. Those flows helped sustain the higher growth rates being
encouraged by the reforms themselves, even though they generated distor-
tions such as overvalued exchange rates. At the same time, the contraction
or reversals of the flows led to crises that were very costly in terms of growth
and investment. Likewise, trade liberalization permitted the increase in
imports of equipment and inputs required by the modernization effort,
but it also contributed to enlarged trade deficits that had to be financed by
volatile capital inflows. In summary, Latin American economies are still
vulnerable to balance-of-payments problems.
The chapter primarily focuses on Latin American and Caribbean coun-
tries’ participation in the globalization process since 1980. The second sec-
tion discusses changes in trade patterns and the impact of commodity prices
on foreign earnings. It also reviews the importance of international and
regional markets in the global integration of Latin America and the institu-
tional constraints of the new international trade regime. The third section
characterizes capital flows by volume and composition, paying special at-
tention to the volatility of different types of flows and to the relation be-
tween capital flows and economic growth patterns. The chapter finishes
with some conclusions about the links between the global economy and
the reform process and about their joint impact on Latin American and
Caribbean economic performance.
3. Turner and Hodges (1992).

19
I N T E R N AT I O N A L C O N T E X T F O R T R A D E
Latin American Trade Relations
The value of world trade was characterized by a dramatic upward trend
in the postwar period. According to the World Trade Organization (WTO),
world merchandise exports ballooned from $58 billion in 1948 to $5.3
trillion in 1997.
4
In real terms, the expansion of trade over the fifty years
exceeded the expansion of output by a large margin. The value of Latin
America’s trade also rose rapidly, although it grew more slowly than the
world average. Total Latin American merchandise exports in 1948 were
about $7 billion, rising to $230 billion in 1997. The increase in export
volume in Latin America was much lower than the world average in the
1960s and 1970s, and it was also lower than growth of the region’s gross
domestic product (GDP) (see table 2-1). In other words, exports were be-
coming less important as a share of output in Latin America, while the
opposite was happening elsewhere.
5
Trade policies in industrialized coun-
tries bore some responsibility for this trend, but it was basically due to
the decision of Latin American governments to industrialize through an
inward-oriented strategy.
This pattern changed beginning in the early 1980s. Export volume
expanded faster than the region’s GDP throughout this period and faster
than export volume for the world as a whole in 1990–98. Initially, this
shift could be attributed to the onset of the debt crisis, when Latin America
had to produce trade surpluses to meet its debt service in the absence of
capital inflows. The reform process may have been important in continu-
ing the strong performance of exports, however, even after capital flows
resumed. An additional factor in the 1990s was the opening of Latin Ameri-
can regional markets for trade in higher value added goods, as will be dis-
cussed below.
The rapid growth of export volume during the 1980s and 1990s was
frequently offset by negative price trends, particularly in 1980–85. There-
after, export prices improved, although some groups of products showed
poorer performance. Prices of nonfuel primary commodities enjoyed a very
favorable situation from late 1993 until mid-1997, when the financial cri-
4. WTO (1998).
5. The statistics on Latin American trade in the 1960s and 1970s were strongly influenced by the
behavior of Brazil and Venezuela. For example, a simple average of growth rates of export volume,
excluding Venezuela, exceeded GDP growth in 1955–65 and was roughly similar in 1965–73. See
Cárdenas, Ocampo, and Thorp (forthcoming, Introduction).

20
I N T E R N AT I O N A L C O N T E X T F O R T R A D E
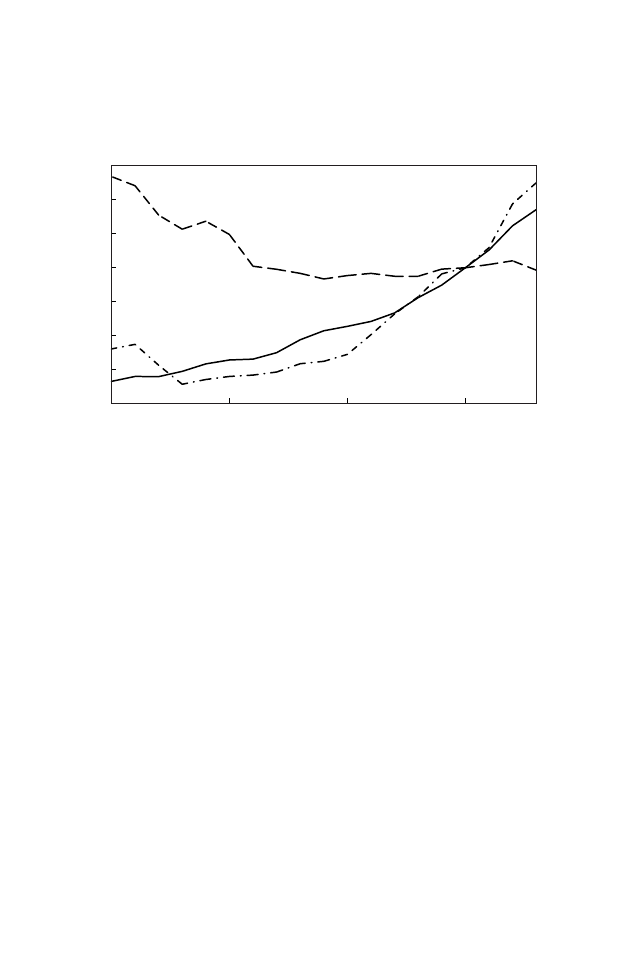
sis in Asia stalled a booming demand there for all primary products. Figure
2-1 shows that the terms of trade deteriorated for the region as a whole
during the 1980s, remained flat during the early 1990s, and improved
slightly from 1994 to 1997 before falling again.
Table 2-1 and figure 2-1 also show trends for Latin American imports.
With the single exception of the period 1980–85, the volume of imports
grew faster than that of exports; the difference was especially large in the
1970s. After 1985, the increase in the value of imports also far exceeded
that of exports, leading to increasing trade deficits. The very rapid growth
of imports was partly due to the pent-up demand for foreign goods of all
kinds (consumer items as well as capital and intermediate goods) after nearly
a decade of foreign exchange constraints. It was also due to the so-called
wealth effect following stabilization, and it was facilitated by the lowering
of tariffs and nontariff barriers and by overvalued exchange rates in many
countries of the region.
The product composition of Latin American and Caribbean merchan-
dise exports reflected the pattern for global trade as a whole, whereby pri-
mary goods had a declining share. While primary products still accounted
for more than half of the value of Latin American exports in 1980, they
had fallen to less than a quarter in 1998 (see table 2-2). These averages hide
sharp differences across countries, especially between Mexico and the rest.
In particular, the strong performance of manufactured exports in Mexico,
Table 2-1. Trade and Output Growth Rates, 1960–98
Percent
Region
Component
1960–70 1970–80 1980–85 1985–90 1990–98
World
GDP
5.2
3.7
2.0
3.3
2.3
Exports (volume)
7.4
5.1
2.5
6.4
6.7
Exports (value)
9.3
20.3
–0.6
12.1
6.3
Imports (volume)
8.6
5.4
2.7
7.1
7.0
Imports (value)
9.2
20.2
–0.4
12.0
6.3
Latin America GDP
5.5
5.6
0.6
1.9
3.4
Exports (volume)
3.1
2.2
5.5
5.1
9.3
Exports (value)
5.7
20.6
0.8
5.8
9.8
Imports (volume)
4.9
7.4
–5.9
6.4
14.3
Imports (value)
6.3
21.7
–8.1
9.7
14.3
Source: ECLAC (1998a) for 1960–95; United Nations (1999) for 1996–98.
21
I N T E R N AT I O N A L C O N T E X T F O R T R A D E
combined with the fact that Mexico accounted for nearly 40 percent of all
Latin American and Caribbean exports by the late 1990s, boosted the total
regional share of manufactured exports substantially. (See chapter 6 on the
comparison between Mexico and other countries.)
The geographic focus of Latin American trade flows also changed sub-
stantially in recent decades, especially in the 1990s. Two main develop-
ments helped to account for the changes, both linked to processes of regional
integration. First, the implementation of the North American Free Trade
Agreement (NAFTA) led to an impressive increase in the U.S. share in
Mexican exports and imports. Whereas the United States bought 63 to 70
percent of Mexican exports between 1965 and 1990, by the late 1990s it
purchased nearly 85 percent. As was the case for product composition, the
magnitude of Mexican trade also tends to bias regional averages toward its
geographic composition. Mexico accounted for 70 percent of all the Latin
American Integration Association (LAIA)
6
exports to the United States
Figure 2-1. Trade Indicators, 1980–98
Index, 1995 = 100
Source: ECLAC (1999b).
40
60
80
100
120
140
1980
1985
1990
1995
1998
Terms of trade
Export volume
Import volume
6. Eleven countries are members of LAIA: Argentina, Bolivia, Brazil, Chile, Colombia, Ecuador,
Mexico, Paraguay, Peru, Uruguay, and Venezuela.

22
I N T E R N AT I O N A L C O N T E X T F O R T R A D E
during the 1990s. The share of the United States as a destination of Latin
American exports, with Mexico included, thus increased from 33 percent
in 1965 to almost 50 percent in 1997. When Mexico is excluded, the U.S.
share actually fell, from 30 in 1965 to 25 percent in 1997. A similar picture
emerges for imports.
7
Second, integration was proceeding at a rapid pace among two groups
of countries in South America: the Southern Common Market (Mercosur),
which includes Argentina, Brazil, Paraguay, and Uruguay, with Bolivia and
Chile as associate members, and the Andean Community, which includes
Bolivia, Colombia, Ecuador, Peru, and Venezuela. These developments led
to a growing share of intra-regional trade, especially among the former
group; intra-Mercosur trade represented 7 percent of the group’s total in-
ternational trade in 1992 and 20 percent in 1998. The parallel increase for
the Andean Community was from 8 to 11 percent. Similar developments
were underway in Central America and the Caribbean, although these coun-
Table 2-2. Structure of Merchandise Exports, 1970–98
a
Percent
Type of export
1970198019901998
b
Commodities
56.9
54.5
38.9
22.7
Agriculture
33.0
18.6
15.0
12.1
Mining
8.0
5.4
4.8
2.9
Energy
15.9
30.5
19.1
7.7
Semi-manufactures
34.3
30.1
30.9
19.8
Manufactures
8.3
15.1
29.0
55.9
Traditional
2.2
4.5
6.5
9.2
Basic inputs
1.9
2.4
7.3
5.5
New industries, labor intensive
2.7
4.7
8.0
24.5
New industries, capital intensive
1.5
3.5
7.2
16.7
Other
0.5
0.3
1.2
1.6
Total
100.0
100.0
100.0
100.0
Amount (billions of dollars)
13.1
81.2
113.7
255.7
Source: Project database, on the basis of ECLAC statistics.
a. Countries include Argentina, Bolivia, Brazil, Chile, Colombia, Costa Rica, Ecuador, Jamaica,
Mexico, Peru, Uruguay, and Venezuela.
b. Data for Jamaica are for 1997.
7. ECLAC (1999b).

23
I N T E R N AT I O N A L C O N T E X T F O R T R A D E
tries were also becoming more integrated into the U.S. economic space.
Trade within the Central American Common Market rose from 22 to 25
percent between 1992 and 1998, while that of the Caribbean Community
(Caricom) grew from 6 to 19 percent between 1992 and 1997.
8
In contrast with the dynamic changes occurring in trade relations with
the United States and within the region, trade between Europe and Latin
America was flat in recent decades. Latin American and Caribbean exports
to the European Union fell from 22 to 14 percent of the total between
1990 and 1998. Trade with Japan and developing Asia currently represents
only a small share for the region as a whole (less than 6 percent of total
regional exports in 1998), but it has become a significant market for sev-
eral countries, especially Chile and Peru. By 1998, Chile was exporting 30
percent of all its goods to Asia, and Peru 23 percent.
9
Combining the data on export composition and geographic destina-
tion generates some important conclusions. Latin American trade with
Europe and Asia continues to be mainly of the inter-industry type, whereby
the region exports primary products (including processed raw materials)
and imports industrial goods. The Mexico-dominated trade with the United
States is more of the intra-industry kind, with manufactured goods ex-
changed on both sides of the ledger, although the Latin American manu-
factured exports tend to be less sophisticated. It is mainly within the region
itself that trade not only involves manufactures, but also consists of prod-
ucts that are intensive in technology and skilled labor. The challenge, then,
is to use the intra-regional trade as a building block to move toward higher
value added exports to other parts of the world.
The importance of this challenge becomes apparent if we examine trends
in Latin American competitiveness in the recent past. Regional exports lost
market share in the industrialized countries as a whole. Between 1985 and
1990, the share fell from 6.2 to 4.8 percent; between 1990 and 1996 it
grew somewhat to 5.3 percent. Although part of the lost ground was recov-
ered, the region remains far behind the performance of the very dynamic
East Asian exporters,
10
which increased their share from 6.3 to 9.0 percent
8. Relations within the Latin American and Caribbean regional integration groups are not limited
to trade. Investment flows across borders are also important, as are political relations among the
countries. For an extensive analysis of these topics, see ECLAC’s annual publication, Latin America
and the Caribbean in the World Economy.
9. ECLAC (1999b).
10. China, Hong Kong, Indonesia, Malaysia, Republic of Korea, Singapore, Taiwan (Province of
China), and Thailand.

24
I N T E R N AT I O N A L C O N T E X T F O R T R A D E
in the 1985–96 period.
11
Among industrialized countries, as we have al-
ready seen, a small gain was made in the U.S. market while a decline oc-
curred in Europe. This was in sharp contrast to the Asian exporters who
more than doubled their share in the latter, suggesting that the poor perfor-
mance of the region’s exports to Europe has more to do with the types of
goods exported than with market access.
Another competitiveness indicator classifies export specialization in
dynamic versus lagging sectors in industrialized country markets. The soft-
ware used to make the above calculations can also sort a country or region’s
exports into four groups: those for which an exporter gains market share in
dynamic sectors (rising stars), gains share in lagging sectors (falling stars),
loses share in dynamic sectors (lost opportunities), or loses share in lagging
sectors (retreat). Table 2-3 shows that Latin America increased its exports
in dynamic sectors from 13 percent in 1985 to 38 percent in 1996, while
significantly reducing its exports in lagging sectors. About half of that gain,
however, was due to Mexico. Moreover, the Asian exporters did much bet-
11. Authors’ calculations, using the database and software described in ECLAC/World Bank (1999).
Table 2-3. Latin American and Asian Exports to Industrialized Countries,
1985 and 1996
Percent
Rising
Falling Lost oppor-
Region (year)
stars
a
stars
a
tunities
a
Retreat
a
Total
Latin America (1985)
13.4
16.5
11.5
58.6
100.0
Latin America (1996)
37.6
29.5
13.1
29.8
100.0
Latin America, excluding
Mexico (1985)
8.1
32.4
11.1
48.3
100.0
Latin America, excluding
Mexico (1996)
21.3
38.4
11.3
29.1
100.0
Hong Kong, Korea, Singapore,
and Taiwan (China) (1996)
53.6
7.4
33.4
5.5
100.0
China, Indonesia, Malaysia,
and Thailand (1996)
62.2
28.4
5.5
3.9
100.0
Source: Authors’ calculations, on the basis of software and database described in ECLAC/World
Bank (1999).
a. See text for definitions.

25
I N T E R N AT I O N A L C O N T E X T F O R T R A D E
ter in the same period. The difference is due to the type of exports: natural
resource–based manufactured goods (typical of Latin America) are less
dynamic than others, such as higher value added manufactures (typical of
East Asia).
If Latin American and Caribbean countries want to promote exports
in the future, they must do so within the constraints of the new rules of the
game. The Uruguay Round of the General Agreement on Tariffs and Trade
(GATT, now the WTO) limited options in this sense. In particular, subsi-
dies contingent upon export performance and the use of domestic rather
than imported goods are explicitly prohibited. Nonetheless, more room
for maneuver remains than is generally realized. While direct subsidies of
exports can no longer be used, other options are still open. A variety of
macroeconomic policies are completely compatible with the new rules; for
example, exchange rates can be set to stimulate exports. Measures to sup-
port national competitiveness may also be used, as long as they are across
the board and not mainly oriented toward exports. These include policies
geared toward human resource development, technology promotion, in-
frastructure construction, market information, and the promotion of small
enterprises. Finally, business facilitation measures can be used to promote
foreign direct investment, which may prove useful for expanding a country’s
exports.
12
Capital Flows to Latin America
The behavior of capital flows to Latin America in the last two decades
was much more variable than the behavior of trade flows. There were ma-
jor reversals: after a significant surge between 1975 and 1981, the region
experienced a net outflow of capital from 1983 to 1990 before a new surge
occurred in the 1990s. A good deal of short-term volatility also character-
ized the large inflows of the last decade. As will be discussed later, one
reason for the current volatility has to do with the changing composition
of capital flows. Figure 2-2 summarizes the pattern of net private capital
flows to Latin America from 1975 through 1998.
The significant increase in the volume of private flows to Latin America
in the 1990s can be explained by both domestic and international factors.
The extensive structural reforms carried out by the majority of countries in
the region did much to encourage the return of private capital. More bal-
12. Kuwayama (1999); see also Tussie (1997).
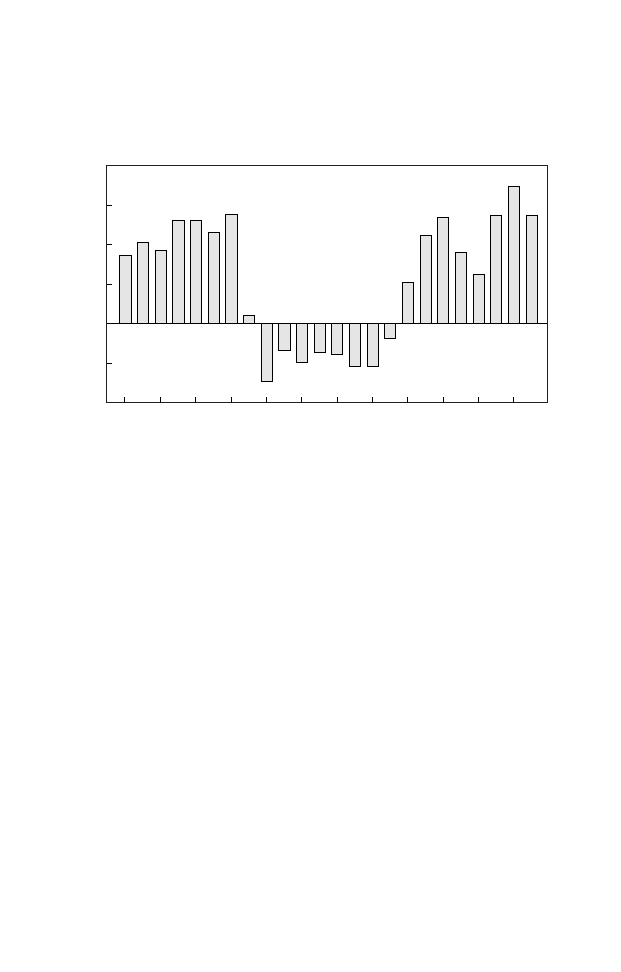
26
I N T E R N AT I O N A L C O N T E X T F O R T R A D E
anced macroeconomic policies, such as the elimination of budget deficits
and tighter monetary policies, were also crucial to the process. The reforms
served to both ease the entry of foreign capital and increase the creditwor-
thiness of Latin American borrowers.
External factors were also extremely important. In the early 1990s, the
recession in the industrialized countries and the reduction of U.S. interest
rates contributed to the influx of foreign funds to Latin America. This
implied that any change in this situation, such as a rise in U.S. interest
rates, could cause a reduction of capital flows to the region, as happened in
1994–95. Financial liberalization in industrialized countries and the grow-
ing international diversification of the portfolios of institutional investors
also served to encourage the flow of capital to emerging markets generally,
including Latin America.
13
The rise in flows to Latin America in the 1990s was accompanied by
increased volatility of those flows. Not only was the pattern of surges and
reversals repeated over time, but it also became more frequent in recent
Figure 2-2. Net Capital Inflows, 1975–98
Billions of 1990 dollars
a
Source: Griffith-Jones (2000), on the basis of ECLAC data.
a. Data were deflated by the U.S. consumer price index.
1975
1981
–20
0
20
40
60
1977 1979
1983
1989
1985 1987
1991
1997
1993 1995
13. See Griffith-Jones (1998) for a discussion of these factors.

27
I N T E R N AT I O N A L C O N T E X T F O R T R A D E
years. The two recent crises, namely, the Mexican peso crisis of 1994–95
and the international financial crisis of 1997–99, brought violent swings
in the levels of capital flows to Latin America. The peso crisis led to a
significant but fairly brief reversal of portfolio flows to the region in 1995,
while the international financial crisis that began in Asia caused major de-
clines in capital flows to Latin America and a currency crisis in Brazil.
Table 2-4 shows the mean, standard deviation, and coefficient of varia-
tion for each of the three sub-periods mentioned above. These calculations
show that the average volume of capital flows to Latin America in the 1990s
(in constant dollars) was approximately the same as the period before the
debt crisis, but that flows have become much more volatile. Furthermore,
the cycles of surges and declines have been far more frequent in the 1990s
than they were in the 1970s and 1980s. On the positive side, the recoveries
also seem quicker.
In comparison with trade flows, the pattern of capital inflows is more
closely linked to that of economic growth, as can be seen in figure 2-3.
During the period 1976–81, the region grew at an average of around 4.5
percent per year, while receiving capital flows at a similar share of GDP.
During the period of capital scarcity between 1982 and 1990, growth fell
to around 1.3 percent per year, while net capital flows to the region became
negative. Growth and capital inflows continued to follow a similar pattern
in the 1990s. After 1994, fluctuations of GDP growth were larger than
fluctuations in net capital movements as a share of GDP, whereas the op-
posite pattern was found previously.
Fluctuations of growth in Latin America result from a number of do-
mestic and external factors; volatile capital flows are only one of these fac-
tors, albeit a very important one. Moreover, the causality between flows
and growth runs both ways, since high growth rates are one of the factors
that attract foreign finance to developing economies. It is safe to conclude,
Table 2-4. Capital Flows to Latin America, 1975–98
Mean
Standard deviation
(billions of
(billions of
Coefficient of variation
Period
1990 dollars)
1990 dollars)
(percent)
1975–81
45.6
8.1
17.8
1982–90
–15.4
9.6
–62.3
1991–98
44.9
16.7
37.1
Source: Griffith-Jones (2000), on the basis of ECLAC data.
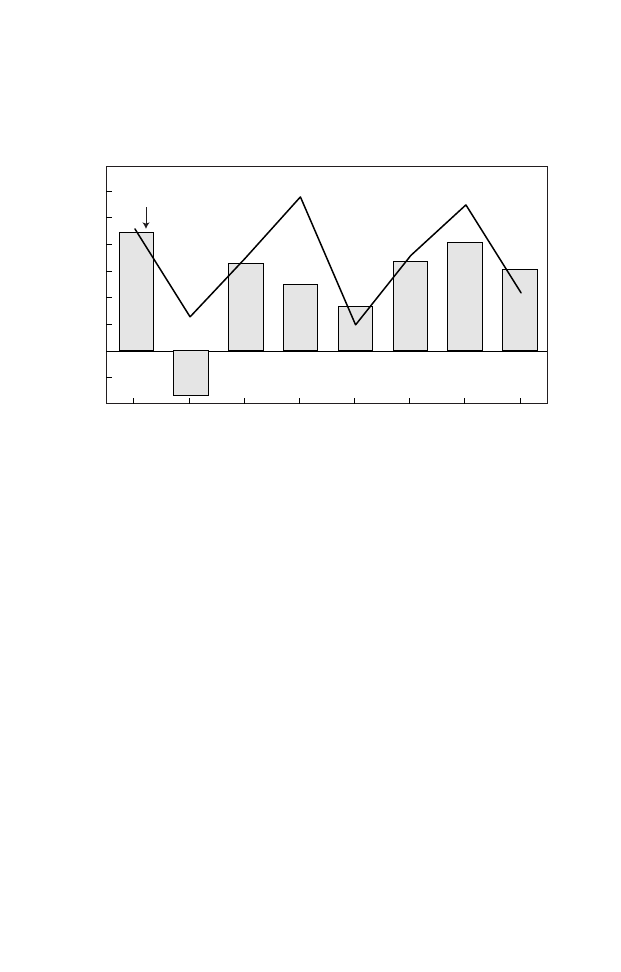
28
I N T E R N AT I O N A L C O N T E X T F O R T R A D E
however, that capital inflows contribute to higher levels of growth in Latin
America, and sharp reductions or reversals in flows have a strong
contractionary impact on the region’s economies, especially if they lead to
financial crises.
The effect of changes in levels of net capital flows on GDP growth
occurs in the first instance via the impact of flows on imports, although a
number of other mechanisms, such as variation in levels of bank lending,
are also important. Large inflows permit higher imports, which reduces the
external constraint to an increased use of productive capacity. Higher ag-
gregate demand then facilitates growth of output and employment. If capi-
tal flows continue, spare productive capacity is used up, and the confidence
of private actors increases. Flows may then increase levels of investment,
which would increase the likelihood of more sustainable growth. In this
scenario of sustained growth, positive effects of the capital flows could
interact with positive impacts from the reforms; these include the transfer
of more efficient technology that increases productivity, as well as more
dynamic responses from entrepreneurs, who see their efforts at investing
and innovating rewarded by higher profits and growth.
Figure 2-3. GDP Growth Rates and Net Capital Inflows, 1976–98
a
Percent
Source: Griffith-Jones (2000), on the basis of ECLAC data.
a. Net capital flows as a share of GDP.
1976–81 1982–90 1991–93
1994
1995
1996
1998
1997
–1
0
1
2
3
4
5
6
GDP growth rate
Capital
flows
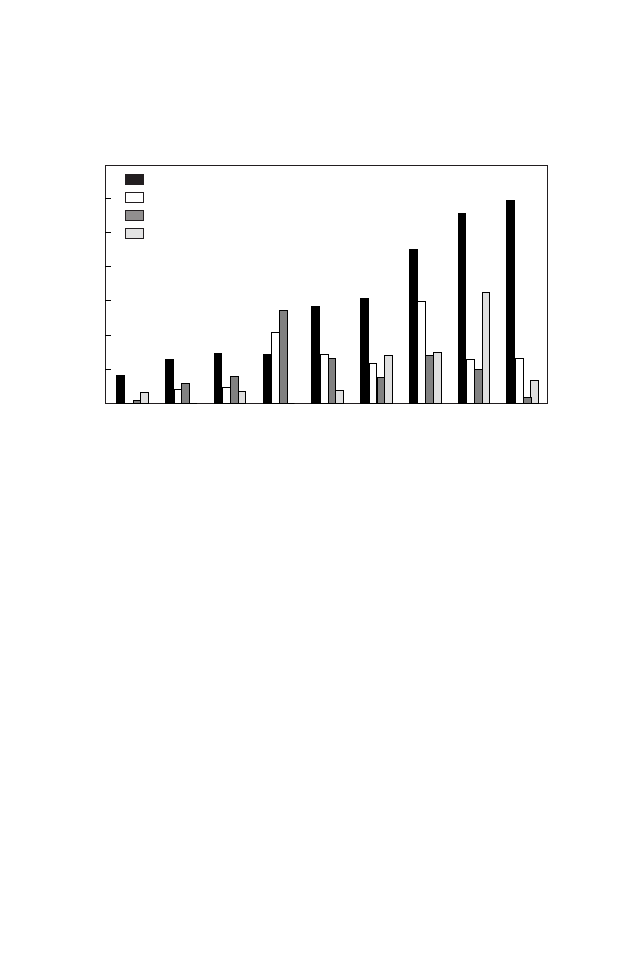
29
I N T E R N AT I O N A L C O N T E X T F O R T R A D E
A less rosy scenario is, unfortunately, more common. When capital
flows decline or are totally reversed, this leads in the first instance to a sharp
contraction of imports, as exports are slower to respond; the contraction in
imports then leads to a fall in growth. These links clearly operated for Latin
America in the 1983–89 period, when the reversal of capital flows and the
large increase in debt servicing were major factors in the dramatic fall in
imports (of around 40 percent in the first instance); this fall, in turn, was a
major factor in Latin America’s poor growth performance during those
years. Sharp declines or reversals of flows led to lower imports and lower
growth in the 1990s as well. In addition, large surges of capital flows con-
tributed to overvalued exchange rates, regardless of the exchange rate re-
gime adopted. This overvaluation discouraged investment in tradables and
especially in exports, which were meant to be one of the most dynamic
elements in reformed economies.
An important determinant of capital flow volatility is the term struc-
ture of net inflows. Figure 2-4 shows the breakdown of private capital flows
to Latin America between 1990 and 1998 into foreign direct investment
(FDI), bonds, portfolio equity, and commercial bank loans. Bonds and
Figure 2-4. Composition of Net Private Capital Inflows, 1990–98
Billions of dollars
Source: Griffith-Jones (2000), on the basis of World Bank data.
1990
1993
1991
1992
1994
1997
1995
1996
1998
10
20
30
40
50
60
FDI
Bonds
Portfolio equity
Commercial bank loans and others
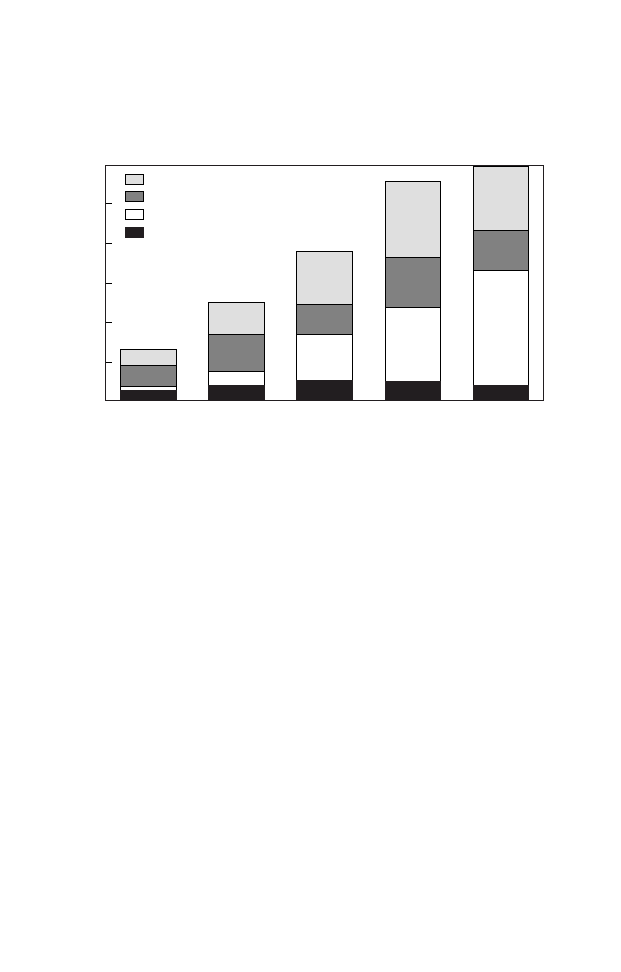
30
I N T E R N AT I O N A L C O N T E X T F O R T R A D E
equity (which tend to be more liquid) and bank lending (around 50 per-
cent of which was short-term in this period) have been more volatile than
FDI in the 1990s.
Figure 2-5 examines the behavior of FDI in more detail. Latin America
and the Caribbean received FDI flows of around $60 billion in 1998, a
significant increase over earlier years. Indeed, FDI flows to Latin America
boomed in the 1990s. Foreign direct investment to LAIA member coun-
tries surged from $5 billion in 1985–89 to $12 billion in 1990–94, reach-
ing $48 billion in 1995–98. Investment undertaken in 1990–97 accounted
for 45 percent of the accumulated stock of FDI, which exceeded $300
billion at the end of the period. Brazil received the largest volume of FDI,
but its share of total FDI stock in the region fell from 62 to 39 percent
during the decade, while Mexico’s rose from 21 to 26 percent.
14
Although privatization was an important force behind FDI flows, the
acquisition of private assets was also relevant, particularly in the second
half of the decade when large private domestic enterprises in manufactur-
Figure 2-5. Net Foreign Direct Investment Inflows, 1990–98
Billions of dollars
1990–94
1995
1996
1997
1998
Others
a
Mexico
Brazil
Argentina
Source: Griffith-Jones (2000), on the basis of ECLAC data.
a. Bolivia, Chile, Colombia, Costa Rica, Dominican Republic, Ecuador, El Salvador, Guatemala,
Haiti, Honduras, Nicaragua, Panama, Paraguay, Peru, Uruguay, and Venezuela.
10
20
30
40
50
14. ECLAC (1998c).

31
I N T E R N AT I O N A L C O N T E X T F O R T R A D E
ing, electricity, and oil were taken over by foreign investors.
15
This process
resulted in an important increase in the share of transnational corporation
(TNC) subsidiaries in the sales of the largest corporations in the region.
Among the 500 largest firms in all economic sectors, TNCs increased their
share in total sales from 27 percent in 1990–92 to 39 percent in 1998,
capturing 12 of the 16 percentage points that state-owned enterprises lost
as a result of privatization. A similar evolution took place among the 200
largest exporters, where TNCs increased their share from 31 to 45 percent,
and among the largest manufacturing firms (see chapter 6).
16
In this con-
text, greenfield investment played a less important role during the decade,
although the expansion and modernization of privatized firms attracted
relatively large inflows in 1994–96. Data suggest that a similar process
took place in 1998–99.
17
Other kinds of capital also became increasingly important in Latin
America in the 1990s, especially international bond issues. Before 1989,
Latin America and the Caribbean had only limited access to the interna-
tional bond market. Since then, the region has enjoyed extensive access,
and the importance of bond financing as a source of external finance has
risen significantly. Figure 2-6 shows that the volume of international bond
issues in Latin America and the Caribbean rose from less than $3 billion in
1990 to a peak of $54 billion in 1997. Bond issues by Latin American coun-
tries fell during the Mexican peso crisis in 1994–95, recovered rapidly, but
then fell again in 1998. Bond financing is relatively expensive for Latin
America, since margins have been high. Moreover, spreads, which had been
falling since the peso crisis, rose sharply as a result of the international
financial crisis that began in mid-1997. The crisis also reversed the previ-
ous improvement in the average maturity of Latin American bond issues.
18
15. In 1994–96 foreign investors focused on the creation of new assets related to large investment
projects and the modernization of firms they had already established in the region or acquired through
privatizations. In 1996–97, in contrast, investment was fundamentally oriented toward the acquisi-
tion of existing firms, as it had been during the first part of the decade. Estimates for 1997 indicate
that 71 percent of FDI ($41.7 billion of a total of $58.5 billion) in LAIA member countries involved
the acquisition of existing assets. Of this total, net purchases of assets from the private sector amounted
to $24.3 billion, or 58 percent of total asset acquisitions and 42 percent of total FDI (ECLAC,
1998c.).
16. ECLAC (2000b).
17. ECLAC (1998c) and (2000b).
18. It is important to note that the trend toward rising maturities before the crisis was offset by the
increasing share of bonds issued with options. Because options allow the lender to pull out before the
official maturity date, the apparent improvement may have been an illusion. See Griffith-Jones (2000).
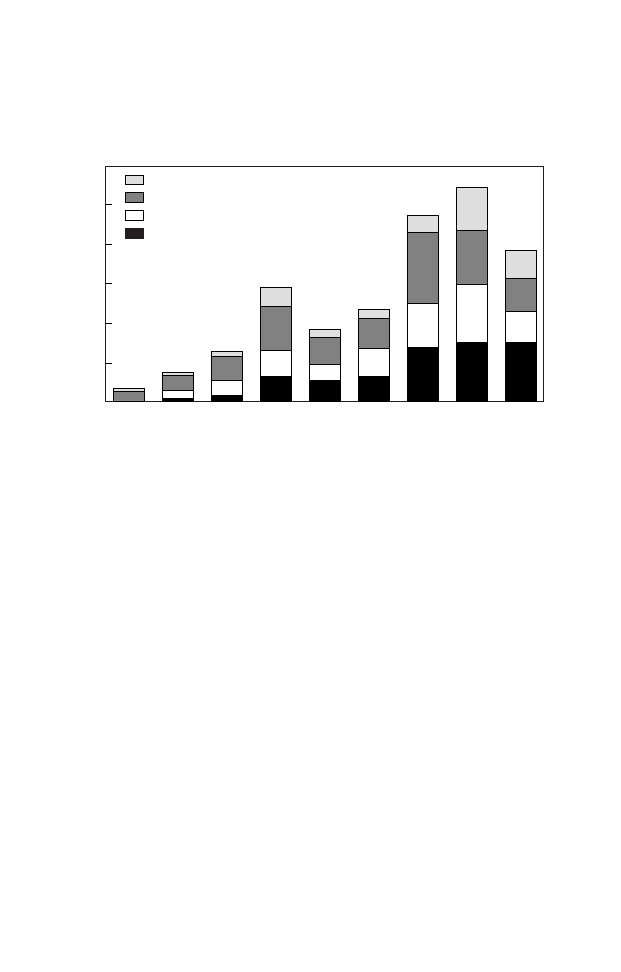
32
I N T E R N AT I O N A L C O N T E X T F O R T R A D E
International stock issues were another important source of capital for
Latin American countries in the 1990s, although to a much lesser extent
than bond issues. Stock issues fell sharply as a result of the Mexican peso
crisis; unlike bonds, they recovered only gradually in 1996–98, failing to
reach precrisis levels. The share of bank lending in total private capital
flows to Latin America was significantly less important in the 1990s than it
was in the 1970s. Banks that report to the Bank for International Settle-
ments (BIS) showed steady growth in outstanding claims to Latin America,
from around $200 billion in 1993–94 to nearly $300 billion in mid-1999.
The share of short-term claims (up to one year) on Latin American bor-
rowers increased during the 1990s, from around 37 percent in 1991 to
around 52 percent in the first half of 1999. Nonetheless, the share of short-
term claims in Latin America compares relatively favorably to that in Asia,
where the figure remained at over 60 percent between 1992 and 1997.
19
19. BIS (1999).
Figure 2-6. International Bond Issues, 1990–98
Billions of dollars
1990
1995
1996
1997
1998
Others
a
Mexico
Brazil
Argentina
Source: Griffith-Jones (2000), on the basis of IMF data.
a. Bahamas, Bolivia, Chile, Colombia, Costa Rica, Dominican Republic, Ecuador, Guatemala,
Jamaica, Panama, Peru, Trinidad and Tobago, Uruguay, and Venezuela.
10
20
30
40
50
1991
1992
1993
1994

33
I N T E R N AT I O N A L C O N T E X T F O R T R A D E
Conclusions
A number of key elements in the international environment have greatly
influenced the impact of the reforms on economic performance. With re-
spect to world trade, the value of Latin American exports in the postwar
period experienced a clear rising trend, although the region’s share in total
world exports fell until some recovery occurred in the 1990s. The accelera-
tion in the growth of exports in the recent decade is partly explained by the
economic reforms. Nonetheless, the increased growth of exports (in vol-
ume as well as value) did not lead to a comparable growth of output. It is
this divergence of trends that needs to be remedied.
Global capital flows also increased rapidly, and in this case Latin
America’s share grew. These trends are found with both portfolio flows
and FDI, although the former grew more than the latter. A key feature of
capital flows to Latin America was their volatility, and the cycles of surges
and steep declines became more frequent in the 1990s. Crises were also
more frequent, and higher volatility led to uncertainty, which discour-
aged investment that is crucial for allowing reforms to bear fruit and lead
to higher growth in the future. Far more clearly than in the case of trade,
levels of capital flows and growth seem to be closely correlated in Latin
America. When capital flows increase, economic growth accelerates; when
they fall significantly or are reversed, growth (or even output) falls.
There is an important relation between trends in trade and capital
flows. One of the reasons that Latin America exhibits a weak link between
exports and growth of GDP is that the creation of such a link requires a fair
amount of time for the development of supplier networks. That is, invest-
ment must occur in many sectors and firms of different sizes, including
small and medium-size suppliers as well as assembly plants, in order for
large exporting firms to transmit growth to other parts of the economy. If
the volatility of capital flows is such that the investment process is fre-
quently interrupted, the necessary incentives for investment will be absent.
Of course, perfect conditions will never exist, but the volatility in the 1990s
may have been exceptional. The highly problematic experience with capi-
tal flows in the 1990s, and much of the recent literature on the subject,
raises the possibility that large surges of easily reversible capital flows may
have net negative effects on long-term growth and development.
20
This is
20. See, for example, Bhagwati (1998); Radelet and Sachs (1998); Rodrik (1998).

34
I N T E R N AT I O N A L C O N T E X T F O R T R A D E
in contrast with growing empirical evidence that FDI and, potentially, trade
contribute to long-term growth.
21
In the final chapter, we recommend policy
measures for maximizing the benefits, while minimizing the problems, with
trade and capital flows.
21. See, for example, Borensztein, de Gregorio, and Lee (1995); Ffrench-Davis and Reisen (1998).

35
3
Structural Reforms
and Public Policies
T
he package of structural reforms has altered the con-
text in which the Latin American and Caribbean
economies operate, increasing the role of market mechanisms over that of
administrative controls, the role of the private sector at the expense of the
state, and regional integration into the global economy. The objectives of
macroeconomic policy, including fiscal, monetary, and exchange rate poli-
cies, have also shifted, giving renewed priority to establishing and main-
taining balanced accounts. Both the reforms and macroeconomic policies
are aimed at creating improved conditions for rapid growth via increased
investment and technological change. Social policy has also witnessed im-
portant advances during the current decade as all governments have in-
creased social expenditure, reflecting the view that this area can complement
other efforts to achieve economic progress while simultaneously increasing
equity in the societies. Nonetheless, problems remain because of lack of
consensus on the role of the public and private sectors and the inherent
difficulties in increasing the quality of social services.
The goal of this chapter is to provide systematic information on what
has happened in these policy spheres and to analyze the interrelations among
them in order to lay the basis for understanding the response of private
sector actors to the new policy initiatives. With respect to the reforms them-

36
S T R U C T U R A L R E F O R M S A N D P U B L I C P O L I C I E S
selves and macroeconomic policies, the countries essentially behaved in
two different ways, depending on their initial conditions. One group, for
which initial conditions were unusually difficult, became aggressive reform-
ers and implemented many changes in rapid order. A second group en-
joyed more favorable initial conditions, and these countries were more
cautious about undertaking profound structural reforms. Social policies
appear to have followed a different logic, based mainly on history. Coun-
tries with a strong tradition of social expenditure maintained this posture,
while others made special efforts to catch up. The interactions among the
reforms and policies were too often inconsistent, leading to less than opti-
mal responses by economic actors. This area will need attention in the
future.
The chapter first examines the reform process: the reasons for the
changes, the reforms that were most important, a set of indicators to mea-
sure the reforms, and differences among countries with respect to their
implementation. Next, it shifts to macroeconomic accomplishments and
the interactions between reforms and macroeconomic policies. Social policy
trends are also examined, with a special focus on expenditure in education
and health areas. A concluding section looks at the implications for topics
covered in other chapters, namely, investment, growth, employment, and
equity.
First Generation Structural Reforms
The structural reforms undertaken by Latin America and the Carib-
bean marked the most significant change in development strategy since the
initiation of the so-called import substitution industrialization (ISI) model.
As has been extensively documented, the ISI model rested on two main
pillars: a strong role for the state (that is, government expenditure as a large
share of gross domestic product (GDP), extensive regulations, and an in-
creasing presence of state-owned firms) and a relatively closed economy
(that is, high tariff barriers, quotas, and exchange controls).
1
Despite the ex post criticisms of these policies, they were quite success-
ful in increasing the sophistication and growth performance of a number
1. In an important work on this period, Cárdenas, Ocampo, and Thorp (forthcoming) argue that
the term ISI is inappropriate. They suggest that “state-led industrialization” or “accelerated industrial-
ization” is more accurate. They also stress that governments changed their policies during the period
rather than following a constant model throughout.

37
S T RU C T U R A L R E F O R M S A N D P U B L I C P O L I C I E S
of economies in the region. In the 1970s, for example, Brazil and Mexico
were frequently compared with Korea and Taiwan as newly industrializing
economies (NIEs). Average annual growth rates in Brazil and Mexico be-
tween 1950 and 1980 were 7.0 and 6.5 percent, respectively, while their
industrial sectors became powerful engines of growth and employment.
Their export baskets came to include a substantial role for industrial prod-
ucts, although the onset of oil exports in Mexico in the late 1970s lowered
the share in that country. Smaller economies also experienced successful
growth under the ISI model. Among project countries, Colombia and Costa
Rica grew more than 5 percent per year during the 1950–80 period.
2
In the 1960s and 1970s, the Asian NIEs adopted an explicit export
orientation that built on their prior experience with ISI. The Latin Ameri-
can countries, in contrast, chose a more mixed approach: Peru moved deeper
into import substitution; others, such as Argentina, Chile, Colombia, and
Costa Rica, began to promote exports; and Mexico and especially Brazil
relied on a combination of both. Almost all the countries in the region
sought to finance trade deficits, increase investment—and, in some cases,
consumption—through greater access to foreign capital, particularly loans
from international commercial banks with their new glut of petrodollars.
In Argentina and Chile, the borrowers were mainly from the private sector;
in other cases, public sector borrowing was dominant. Colombia alone did
not participate heavily in the borrowing spree, although it began to seek
more funds at the end of the 1970s.
Initially, the alliance between the banks—in need of new borrowers—
and the Latin Americans—in need of capital for domestic purposes—ap-
peared to be advantageous for all. The negative side was the buildup of a
large debt, which approached $350 billion in 1982. This debt might have
been manageable had international prices and interest rates continued on
the path that most observers expected, but significant changes occurred at
the beginning of the 1980s. Prices for commodities, except oil, fell sharply,
leading to large trade deficits. At the same time international interest rates
more than doubled. Since most of the new loans had been contracted at
floating interest rates and, increasingly, on a short-term basis, the condi-
tions were created for the debt crisis that began with the Mexican morato-
rium in August 1982.
In the early years after the debt crisis began, it was usually assumed that
stabilization programs would be sufficient to get through the crisis until
2. Data are from Hofman (2000).

38
S T R U C T U R A L R E F O R M S A N D P U B L I C P O L I C I E S
another credit cycle began. A new mood swept the region in the second
half of the decade, however, as it gradually became clear that this viewpoint
was unrealistic. A number of factors converged to push government leaders
toward more far-reaching decisions on economic policy.
3
One such factor was that as private capital sources dried up, the inter-
national financial institutions, especially the International Monetary Fund
(IMF) and the World Bank, began to assume a more important role in
international finance. For a number of years these institutions had been
pushing for policies known as structural adjustment (namely, greater open-
ness and deregulation); they were now in a position to require policy changes
along these lines in return for refinancing and new loans. At the same time
that these international actors acquired new influence in Latin America, a
group of local technocrats who had been advocating similar policies began
to obtain important posts in economic ministries and central banks.
Reinforcing trends were underway at the international political level.
In the leading industrialized countries, a set of conservative leaders (espe-
cially Reagan and Thatcher) were advocating policies in their own coun-
tries that were similar to those pushed by the World Bank and the IMF in
Latin America. Even more significant changes were taking place in Europe
with the fall of the Soviet Union and the end of communism in central and
eastern Europe. These changes undermined support for state-led develop-
ment strategies among local groups in Latin America and the Caribbean.
A final set of factors involved economic trends in developing coun-
tries. In the 1980s, the mainstream interpretation attributed the success of
the East Asian countries to their supposedly open and unregulated econo-
mies. While this interpretation was later altered substantially, at a crucial
moment many Latin American leaders believed that the main explanation
for Asian success, and their own relative failure, lay in these variables. Ex-
amples in the region reinforced this view. Chile, which provided the earli-
est case of a structural reformer in Latin America, emerged from the debt
crisis relatively quickly; its neighbor Peru, in contrast, sank ever deeper
into chaos under Alan García’s state-centered policies. Moreover, attempts
at heterodox stabilization, not only in Peru but also in Argentina and Bra-
zil, failed and led to hyperinflation.
All of these factors helped push Latin American governments to make
a major overhaul of their economic approach, moving in the direction of
3. See Stallings (1992) and Edwards (1995) for a similar analysis of causes behind the new develop-
ment strategy.

39
S T RU C T U R A L R E F O R M S A N D P U B L I C P O L I C I E S
the open economies and private sector leadership that characterized the
structural reform package. Expectations for the new development model
were initially very high. Their proponents thought that the policies would
not only speed up economic growth, but also lead to the generation of
more jobs and increased equality. A key mechanism was to lift regulations
and give more rein to the private sector, which was believed to be much
more efficient than its public sector counterpart, such that the former would
take the lead in the production process by investing more and increasing
productivity. The opening of the economies would reinforce this process:
competition from abroad would require greater efficiency and also provide
increased access to finance and technology.
The result of these two processes would be higher growth, based on a
shift in the direction of the region’s comparative advantage. The opening of
the economies would not only involve imports, but would also increase
exports, in particular, labor-intensive exports. This was a key link to faster
job creation, since it was believed that Latin American and Caribbean coun-
tries had a comparative advantage in labor-intensive products. The greater
volume of employment would, in turn, help to lower both the poverty that
had climbed to new levels during the 1980s and the inequality that was
higher in Latin America than in any other part of the world. Later in the
book we will identify where some of these initial assumptions may have
been erroneous, as we attempt to evaluate the new development model.
The Reform Content
The structural reforms can be defined in a variety of ways. We have
chosen to concentrate on a package of five basic reforms that were preva-
lent across the region, while acknowledging that others could be added to
the general list and that some additional reforms were quite important in
individual countries. Our five are as follows: liberalization of imports, lib-
eralization of the domestic financial system, opening the capital account of
the balance of payments, privatization, and tax reform. The common ele-
ment among them is greater reliance on market mechanisms, both domes-
tically and internationally. In describing the reforms below, we emphasize
the views of the reformers themselves; our analysis of the policies follows in
later chapters.
import liberalization. At the beginning of the reform period, Latin Ameri-
can markets were protected from international competition in a variety of

40
S T R U C T U R A L R E F O R M S A N D P U B L I C P O L I C I E S
ways. The two most important were high tariffs and import quotas on
industrial and agricultural products. Both forms of protection tended to
vary widely across sectors and even individual products, such that some
were heavily protected while others were not. The different levels of protec-
tion were exacerbated if effective protection was taken into account.
Advocates of reform voiced a number of arguments against protection.
First, it lowered the efficiency of the economy by closing it off from exter-
nal competition and by limiting exposure to new technologies. Second, it
led countries to stray from their comparative advantage and produce a broad
array of products, again with low levels of efficiency. Third, the resulting
high prices hurt consumers as well as exporters by making them pay the
cost of protecting local producers. Fourth, protection established the basis
for rent-seeking behavior, whereby bureaucrats accepted bribes and firms
devoted resources to gaining advantages in the system rather than increas-
ing their efficiency. Finally, while the legitimacy of the infant industry ar-
gument was generally acknowledged, it was argued that once high tariffs
were put into place, it was very hard to eliminate them.
One of the most pervasive reforms, then, was the dismantling of the
old protective structure. Quotas were eliminated; tariff rates were lowered;
and tariff dispersion was limited, with a few countries moving toward a
single flat rate. This process was not completely irreversible, however, as
external crises led to some temporary backtracking. In addition, while the
integration process in Latin America and the Caribbean generally supported
trade liberalization, it led to higher tariffs for a few individual items.
domestic financial reform. The domestic financial system during the
ISI period was an important instrument of government control of the
economy. First, interest rates on both deposits and loans were set by the
government. The real rates were often negative, at least ex post, as inflation
exceeded nominal rates. Second, reserve requirements were very high, so
the commercial banks had little freedom to expand their portfolios. Third,
the government issued administrative directives for the allocation of a sub-
stantial share of commercial bank credit. Fourth, government-owned banks
were responsible for a large amount of the lending that took place, often
intermediating between external sources of credit and local borrowers. To-
gether, these processes led to a situation typically referred to as financial
repression.
According to the critics, the results of financial repression were low
saving rates, since depositors frequently received negative interest on their

41
S T RU C T U R A L R E F O R M S A N D P U B L I C P O L I C I E S
funds; low monetization of the economies; low access to credit, especially
for small and medium-size enterprises; and credit directed to borrowers on
the basis of political connections, not the profitability of their projects.
The main changes in this area, then, were to free interest rates to be set by
market forces, to lower reserve requirements, to limit or end directed credit,
and to privatize or close government-owned banks. A related institutional
reform was the tendency toward making central banks autonomous of fi-
nance ministries. In this way, reference interest rates and reserve policies
were increasingly controlled by an independent entity whose main (or only)
goal was to control inflation. More will be said later on the consequence of
this reform for macroeconomic policy.
opening the capital account. Capital controls were usually a comple-
ment to trade protectionism and financial repression in the pre-reform
period. Exchange controls enabled governments to regulate the amount of
foreign currency that could be taken out of a country, and they required
economic actors to buy local currency through official channels at lower-
than-market rates. More specific restrictions concerned particular types of
capital flows. Foreign direct investment (FDI) was often a target, with re-
spect to the sectors in which it could be invested and capital repatriation.
4
Reformers charged that capital controls led to black markets in foreign
currency, taking many functions out of government hands and leading to
the same type of rent-seeking behavior described earlier. They were also
said to limit local firms’ access to foreign capital and the complementary
resources of technology and markets. The main reforms with respect to the
capital account were the elimination of exchange controls and the end to
restrictions on FDI and other types of flows. Most of these reforms were
aimed at limiting controls on capital outflows, but the surge of foreign
capital in the first half of the 1990s led a few governments to impose con-
trols on capital inflows (especially short-term flows) to limit their impact
on macroeconomic policy. The latter controls involved reserve requirements
on capital during a certain period (as in Chile and Colombia) or a tax on
capital inflows (as in Brazil).
4. It is interesting to note that FDI was regarded as the most negative kind of foreign capital in the
1970s, which explains the wave of nationalizations as well as controls. By the 1990s, in contrast, FDI
had become highly valued, not only for its links to export markets and technology, but also for its
long-term stability relative to volatile short-term portfolio flows.

42
S T R U C T U R A L R E F O R M S A N D P U B L I C P O L I C I E S
privatization. State-owned enterprises became especially common in Latin
America and the Caribbean during the 1970s, although some dated back
much earlier. Many of these enterprises were giant natural resource firms
that accounted for a large percentage of export receipts and government
revenues. They had been brought under government control because own-
ership by transnational corporations (TNCs) seriously limited the govern-
ments’ ability to manage their economies. Public utility monopolies were
also typically in the public sector from an early date. Other sectors were
later brought under government control for a variety of reasons.
Despite their similar ownership structure, the state enterprises were
managed in different ways. Some were treated as semi-autonomous entities
and were expected to make profits like any private firm; others served as an
instrument of diverse government aims, such as providing cheap inputs to
favored sectors or jobs to unionized workers. The latter type of firms typi-
cally ran large deficits, not necessarily because they were inefficient but
because of government pricing and employment policies. These deficits
had to be covered by general government revenues, which increased central
government disequilibria. Moreover, these firms typically did not have ac-
cess to sufficient capital for investment, so they tended to use technology
that was below the international state of the art.
The most common reform in this area was to sell the firms to the
private sector, whether domestic or foreign. Nonetheless, they were sold
under different conditions that had a strong impact on their later function-
ing. As will be seen in chapter 6, important variants included the price
paid, the buyer’s experience in the sector, the degree of competition, and
the regulatory framework. Bolivia developed a particularly interesting varia-
tion of privatization, known as capitalization. Under the rules of capitali-
zation, the buyer had to commit itself to a future investment program.
tax reform. During the ISI period, many Latin American governments
imposed very high marginal tax rates on corporations and wealthy indi-
viduals. Royalties and taxes on foreign corporations were especially attrac-
tive targets. Taxes on international trade were an important source of revenue
for some countries, as were excise taxes on particular items. From the re-
formers’ viewpoint, this tax system was inefficient for at least three reasons:
it led to intricate schemes for tax evasion; it undermined incentives to in-
vest and to export; and it impinged on other economic decisions by dis-
torting the price structure.

43
S T RU C T U R A L R E F O R M S A N D P U B L I C P O L I C I E S
The reform package included several changes in the tax structure to
correct the problems identified. The lowering of taxes on trade was dis-
cussed above in connection with import liberalization. Taxes on exports
were also lowered or eliminated altogether. In addition, the maximum rates
were lowered on individuals and corporations, and some of the ad hoc
taxes were rescinded. To make up for the loss of revenue, a value added tax
(VAT) was instituted or increased, becoming the main source of tax in-
come in many countries. The VAT was both easier to collect and consid-
ered more neutral than other taxes, thus having less impact on
decisionmaking by economic agents.
other reforms. In addition to these five, a number of other important
structural reforms have been implemented in some countries. Most nota-
bly, labor reform sought to create more flexible rules by eliminating prac-
tices such as lifetime employment and very high costs for dismissal; social
security reform transformed traditional “pay as you go” systems into pri-
vate “capitalization” schemes; and decentralization moved revenues and
responsibilities from the central government to provinces or municipali-
ties. These reforms were not as widespread as the five summarized above,
however.
The Reform Indexes
To study the five reforms, project economists created a set of indexes
for analyzing and comparing the implementation process.
5
The quantita-
tive indexes also give us the capacity to study the impact of the reforms
through econometric and other kinds of analysis.
6
Box 3-1 outlines the
components of the indexes. In general, the indexes measure the degree to
which the economy is more open and more market-led, with scores rang-
ing from 0 to 1. While a score of 1 indicates the greatest degree of openness
or market orientation, relative to other countries, it is crucial to note that a
5. Morley, Machado, and Pettinato (1999). The indexes were based on seventeen countries, rather
than only on the nine project countries.
6. Of course, cross-country quantitative indicators have disadvantages as well as advantages. They
obviously cannot include many important qualitative details. Likewise, when sources that include a
large number of countries are used, doubts arise on the reliability of individual observations.

44
S T R U C T U R A L R E F O R M S A N D P U B L I C P O L I C I E S
score of 1 is not necessarily ideal; it may well be that a somewhat lower
score would lead to better performance, at least on some variables.
7
Figure 3-1 shows the pattern of the five individual reforms as well as
the overall index for the 1970–95 period. The discussion in Morley,
7. Not surprisingly, there was a relatively high correlation between some of the pairs of indexes,
which leads to difficulties in econometric estimations. The correlation matrix among the five indexes
for the nine countries in the period 1970–95 is the following:
Trade reform
Financial reform
Capital account
Privatization
Tax reform
Trade reform
1.00
0.66
0.47
–0.10
0.59
Financial reform
0.66
1.00
0.26
0.10
0.66
Capital account
0.47
0.26
1.00
–0.15
0.27
Privatization
–0.10
0.10
–0.15
1.00
0.15
Tax reform
0.59
0.66
0.27
0.15
1.00
Box 3-1. Structural Reform Indexes
The basic structural reform index consists of five subindexes. They, in turn, gen-
erally have several components.
Components
Import liberalization: (1) average level of tariffs and (2) dispersion of tariffs.
Domestic financial liberalization: (1) control of bank lending rates (0 if con-
trolled, 1 if market determined); (2) control of bank deposit rates; and (3) re-
serves-to-deposits ratio.
Capital account opening: indexes of (1) controls on foreign direct investment;
(2) limits on profit repatriation and interest payments ; (3) controls on external
credits by national borrowers; and (4) controls on capital flows.
Tax reform: (1) maximum marginal rate on corporate income; (2) maximum
marginal rate on personal income; (3) value added tax rate; and (4) efficiency of
value added tax (ratio of VAT rate to the receipts from this tax as share of GDP).
Privatization: One minus the ratio of value added in state-owned enterprises to
nonagricultural GDP.
Data sources
The indexes are a modification and extension of those prepared by Eduardo Lora
of the Inter-American Development Bank.
a
For import liberalization, domestic
financial liberalization, and tax reform, the Lora indexes for 1985–95 were ex-
tended backward to 1970 and, in the case of financial liberalization, corrections

45
S T RU C T U R A L R E F O R M S A N D P U B L I C P O L I C I E S
Machado, and Pettinato stresses that the reform process has not been uni-
form across time or subject area.
8
In three of the five areas—namely, im-
port liberalization, financial liberalization, and tax reform—change started
in the 1970s in Argentina, Chile, and Colombia among the nine project
countries, as well as in Uruguay. These early reformers were responsible for
virtually all of the rise in the trade and financial reform indexes during the
1970s. The tax reform index also rose in this period, reflecting the adop-
tion of value added tax systems in a large number of countries. Capital
account controls were tightened in the early 1970s, due principally to policy
of errors on interest rates were made. For privatization, a new index was devel-
oped, with the basic information coming from World Bank.
b
The index on capi-
tal account opening was also created by the project since Lora did not have an
index on this topic. The main source was the IMF’s annual publication, Balance
of Payments Arrangements.
Construction
Each index is normalized to fall between zero and one, with one being the most
reformed or free from distortion or government intervention. The difference be-
tween each country’s raw index and the least liberalized country observation is
expressed as a percentage of the difference between the maximum and minimum
observations for all the countries over the entire period. Note that this implies
that the maximum value of any index is the level actually attained in some coun-
try between 1970 and 1995.
In formal terms, the index value for country i at time t is:
I
it
= (IR
it
– Min) / (Max – Min)
I
it
is the index value for country i in year t
IR
it
is the raw value of the reform measure for country i in year t
Max is the maximum value of the reform measure for all countries in all years
Min is the minimum value of the reform measure for all countries in all years
Source: Morley, Machado, and Pettinato (1999).
a. IDB (1996); see also Lora (1997).
b. World Bank (1995a).
8. Morley, Machado, and Pettinato (1999).
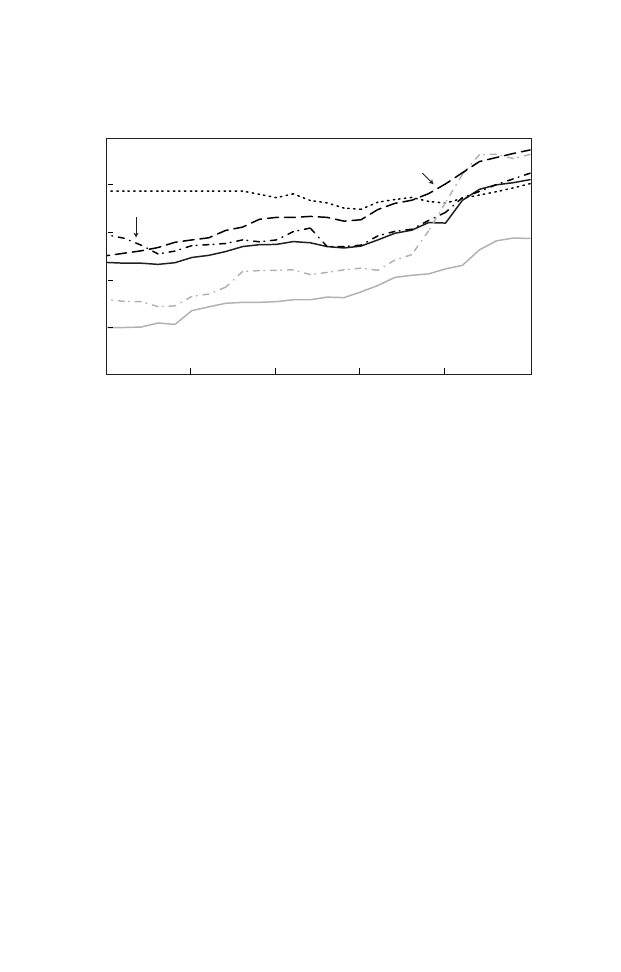
46
S T R U C T U R A L R E F O R M S A N D P U B L I C P O L I C I E S
changes under the second Perón government in Argentina and the military
government in Peru; this process was subsequently reversed with liberaliza-
tion under military governments in Argentina and Chile. In this early pe-
riod, the only privatizations were the sales of a large number of relatively
small state enterprises in Chile.
After 1982, the Latin American debt crisis not only stopped the re-
form process, but also reversed it in several of the early reforming coun-
tries. In response to the debt crisis, Argentina, Bolivia, and Chile imposed
temporary controls on capital account transactions. Many countries (among
them Argentina, Brazil, Chile, Colombia, Mexico, and Peru) increased tar-
iff and nontariff restrictions on imports. The process of financial liberaliza-
tion was either halted or reversed, and no further progress was made in
either tax reform or the opening of the capital account during this period.
A far more general and widespread adoption of the structural reform
package started around 1985 and accelerated significantly in the 1990s.
Countries such as Chile and Argentina, which had been leaders in the first
round, continued to extend their reforms. Most other countries in the re-
gion followed the early reformers by lowering tariffs and reforming their
Figure 3-1. Reform Indexes, 1970–95
a
1970
1985
1990
1995
Source: Morley, Machado, and Pettinato (1999).
a. Sample includes the nine project countries plus Dominican Republic, Ecuador, El Salvador,
Guatemala, Honduras, Paraguay, Uruguay, and Venezuela.
1975
1980
0.2
0.4
0.6
0.8
Privatization
Tax reform
Financial reform
Total
Import liberalization
Capital account opening

47
S T RU C T U R A L R E F O R M S A N D P U B L I C P O L I C I E S
tax systems. Moreover, almost all countries decontrolled their interest rates
and made efforts to integrate domestic and international capital markets
more closely.
On examining the reform process across the region, one important
pattern that emerges is the degree of convergence over time. Countries that
had relatively liberalized economies in 1985 tended to introduce fewer ad-
ditional reforms, while the others made a significant effort to catch up over
the subsequent decade. The success of the early reformers, particularly Chile,
was presumably an incentive for others to accelerate their own reform pro-
cesses. By 1995, the main elements of the reform package had been adopted
across almost all the countries of the region.
9
Aggressive versus Cautious Reformers
Despite the eventual convergence, the process started out quite differ-
ently. It is possible to identify a set of “aggressive” reformers versus others
who were more “cautious” on the basis of the speed and scope of the re-
forms. The former group undertook many reforms in a relatively short
period of time, while the latter implemented reforms more gradually. These
differences were closely correlated with initial conditions in the period pre-
ceding the reforms. Four elements, in particular, influenced later policy
choice: growth performance, inflation, degree of economic distortion (here
measured by the reform index), and level of governability.
These elements tended to cluster. At one extreme, Argentina, Bolivia,
Chile, and Peru scored poorly on all four elements (see table 3-1). On
average, the four had annual inflation rates of over 1,200 percent in the five
years preceding the initiation of the reform process. GDP in those same
periods contracted by an average of 0.7 percent. The reform index averaged
.477, indicating a high level of economic distortion, and governability had
broken down substantially. This included near civil war in Chile during
the Popular Unity government, a disintegrating state in Bolivia, the inabil-
ity of President Alfonsín to even complete his term in Argentina, and the
Sendero Luminoso guerrilla war in Peru.
9. Unfortunately, the reform index used in the project ends in 1995. More recent calculations using
the same indicators for the nine project countries show that privatization is the area where most
reform occurred in 1996–98. Bolivia, Brazil, Colombia, and Peru did the most in this area, followed
by Argentina and Chile. Activity was quite modest in the other four reform areas. The country that
carried out the most reforms was Brazil (see Paunovic, 2000).

48
S T R U C T U R A L R E F O R M S A N D P U B L I C P O L I C I E S
The same pattern is found in each of the countries individually, with
two exceptions. One is Argentina’s relatively high score on the reform in-
dex. This resulted from Argentina’s earlier period of reforms in the late
1970s when a number of changes were made, especially in the trade and
financial areas and opening the capital account. The reforms were then
suspended until the early 1990s. The other difference that stands out in the
table is the relatively low inflation rate in Chile, which averaged 228 per-
cent in the five years preceding the reforms and 609 percent in the single
Table 3-1. Initial Conditions among Aggressive and Cautious Reformers
Reform
Country
Year
a
Inflation
b
Growth
c
index
d
Governability
e
Aggressive reformers
Argentina
1989
1,191
(4,924)
f
–1.3
.664
Low
Bolivia
1985
1,100
(8,171)
f
–1.9
.445
Low
Chile
1974
228
(609)
f
1.8
.316
Low
Peru
1990
2,465
(7,650)
f
–1.5
.484
Low
Simple average
. . .
1,246
–0.7
.477
Low
Cautious reformers
Brazil
1990
708
4.4
.696
Medium
Colombia
1990
26
4.6
.689
Medium/high
Costa Rica
1986
27
2.0
.524
High
Jamaica
1989
14
1.9
.560
Medium
Mexico
1985
66
2.0
.578
Medium/high
Simple average
. . .
168
3.0
.609
Medium/high
Source: Authors’ calculations, on the basis of project data.
a. Year reforms began.
b. Consumer price indexes, December-December, averaged for five years preceding reforms.
c. Average annual growth rate of GDP, measured in constant 1980 dollars, for five years preceding
reforms.
d. Index reported in Morley, Machado, and Pettinato (1999) for year reforms began.
e. Authors’ evaluation of governments’ ability to make and carry out policy decisions at the end of
the pre-reform period.
f. Inflation in the year of highest price rises near the beginning of the reform period.

49
S T RU C T U R A L R E F O R M S A N D P U B L I C P O L I C I E S
highest year. This rate appears low in comparison with the other countries
in the group, but in the context of the times before the hyperinflations of
the 1980s, it was considered an extremely high rate as, of course, it is today.
The consequence of these traumatic experiences was to create an envi-
ronment in which governments and other important actors were willing to
experiment with drastic changes in economic policy, since the existing situ-
ation was considered unacceptable and unlikely to respond adequately to
modest policy shifts. The changes came about when a new government
came to power through a military coup in Chile but through elected gov-
ernments in the other three countries. The new governments increased the
capacity to govern, thus making policy change possible. In addition, the
very negative economic conditions led to the heavy involvement of the
international financial institutions, especially the IMF and the World Bank.
These institutions were strong advocates of the economic reforms, which
reinforced the new governments’ own inclinations toward extensive change.
The four countries responded to the multiple domestic and interna-
tional pressures by implementing a number of reforms in very rapid order.
In a process sometimes referred to as shock treatment, tariffs were lowered,
other taxes were cut, financial systems were liberalized, capital accounts
were opened, and public sector firms were sold.
10
All of these changes were
new when Chile undertook reform in the early 1970s, such that the coun-
try had little guidance to go by. For the other three, especially Argentina
and Peru in the 1990s, the Chilean experience offered both a positive model
and a source of lessons.
Table 3-1 also delineates the initial conditions of the cautious reform-
ers: Brazil, Colombia, Costa Rica, Jamaica, and Mexico. The contrast with
the aggressive reformers is quite stark. Average inflation among the five
countries in the preceding period was much lower at 168 percent, while
the previous growth rate was much higher at 3.0 percent. The level of eco-
nomic distortion was lower, with an index of .609, and problems of
governability did not match those among the aggressive reformers.
Another way of viewing the difference between the two groups is that
among the cautious reformers, the central actors believed the countries
10. Williamson provides a vivid example of the concept of aggressive reformers in describing the
Bolivian reforms of 1985. “[President] Paz’s advisors planned the equivalent of about five GATT
rounds, six Gramm-Rudmans, and more deregulation than had been accomplished by the Carter and
Reagan administrations together, all overnight” (1990, p. 356).

50
S T R U C T U R A L R E F O R M S A N D P U B L I C P O L I C I E S
were basically sound and had much worth preserving. The particular source
of pride varied across cases. For Brazil and Mexico, it was a powerful indus-
trial sector and economies among the dozen largest in the world. For Co-
lombia, it was a historical reputation for sensible policy decisions and a
stable economy. For Costa Rica, it was a popular set of social benefits that
underpinned a vibrant democracy. Jamaica fits marginally within this sec-
ond group. It experienced serious conflicts in the 1970s but never the soci-
ety-wide convulsions that characterized the aggressive reformers. Moreover,
although growth in Jamaica was quite weak, its economy was never dis-
rupted to the extent that the aggressive reformers’ had been.
In contrast to the aggressive reformers, the cautious reformers were
more gradual and selective in their changes, in part because domestic
opposition was more widespread. The international financial institutions
were an important force in overcoming domestic opposition, especially
in the two smaller countries, Costa Rica and Jamaica. The authors of
project case studies on those two countries report that reforms were “im-
posed” on Costa Rica by the World Bank’s structural adjustment loans
and “foisted on the people [of Jamaica] by . . . an unwilling administra-
tion and, later, by an unfocused one merely following to a limited extent
world economic fashion.”
11
As noted above, the average inflation rate among the cautious reform-
ers was quite high at 168 percent. This figure provides the basis for subdi-
viding this group of countries. Brazil and Mexico had serious inflation
problems, with price rises that were high either in absolute terms (Brazil
had an average of 708 percent in the five years preceding the reforms) or in
comparison to historical averages (Mexico’s average of 66 percent in the
five pre-reform years contrasted with the 16 percent average for the 1970s
and single-digit inflation earlier). The second subgroup (Colombia, Costa
Rica, and Jamaica) had inflation rates that averaged 22 percent per year,
suggesting that their macroeconomic conditions were basically sound, ac-
cording to the judgment of the times.
This categorization—the aggressive reformers, the cautious reformers
with macroeconomic problems, and the cautious reformers with stable
macroeconomic conditions—is useful for analyzing other topics in the book,
especially investment and growth patterns. The three groups also took some-
what different approaches to macroeconomic policy.
11. Villasuso (2000); King (2000).

51
S T RU C T U R A L R E F O R M S A N D P U B L I C P O L I C I E S
Macroeconomic Policies and Outcomes
The structural reform process in Latin America and the Caribbean did
not take place in a vacuum. The most important factors determining the
impact of the reforms, beyond the content of the reforms themselves, were
the international context and the macroeconomic policies of the respective
governments. While the literature makes some attempt to decide which of
these three factors was the most important in determining outcomes, our
focus in this chapter is on understanding the connections among them.
12
The change in macroeconomic policy stance in the region over the last
fifteen years has been as important as the change in development model.
The 1970s (or, more precisely, the decade between the first oil shock and
the onset of the debt crisis) marked a peak of loose macroeconomic policy,
as fiscal and current account deficits reached major proportions. Thus, six
of seventeen countries in the region for which data are available had fiscal
deficits that exceeded 3 percent of GDP in the period 1974–82, while ten
of nineteen had current account deficits over 5 percent of GDP in the same
years.
13
Current account deficits generally shrank during the remainder of
the 1980s, but fiscal deficits increased and inflation rose dramatically, reach-
ing four or even five digits in a number of countries. The association of
these excesses with the debt crisis and the high costs it entailed led to a
major shift in opinion among the region’s governments, which came to
revalue macroeconomic equilibrium.
Stabilization
In some cases stabilization preceded the reforms, in some cases the
two were simultaneous, and in one instance (Brazil) stabilization actually
came later. Even given this diversity, however, a set of stylized facts gener-
ally characterized the macroeconomic policies that accompanied the struc-
tural reforms. First, there was a narrow focus on lowering inflation to the
one-digit level or even to the average of the industrialized countries. The
tendency toward a single target for macroeconomic policy was reinforced
12. Some analysts try to distinguish among the various factors through use of an econometric
model (for example, Lora and Barrera, 1997); others simply argue that one or the other was more
important (for example, Rodrik, 1996).
13. Calculated on the basis of IMF, Government Finance Statistics Yearbook (various years), and
ECLAC data.

52
S T R U C T U R A L R E F O R M S A N D P U B L I C P O L I C I E S
T
able
3-2.
Inflation
T
rends,
1991–98
a
Pe
rcent
H
ighest
inflation
Countr
y
rate
(y
ear)
b
1991
1992
1993
1994
1995
1996
1997
1998
Argentina
4,924
(1989)
84.0
17.6
7.4
3.9
1.6
0.1
0.3
0.7
Bolivia
8,171
(1985)
14.0
10.5
9.3
8.5
12.6
7.9
6.7
4.4
B
razil
1,864
(1989)
475.0
1,149.0
2,489.0
929.0
22.0
9.1
4.3
2.5
Chile
I
c
609
(1973)
369.2
d
343.3
d
198.0
d
84.2
d
37.2
d
38.9
d
31.2
d
9.5
d
Chile
II
c
27
(1990)
18.7
12.7
12.2
8.9
8.2
6.6
6.0
4.7
Colombia
32
(1990)
26.8
25.1
22.6
22.6
19.5
21.6
17.7
16.7
Costa
Rica
15
(1986)
25.3
17.0
9.0
19.9
22.6
13.9
11.2
12.4
Jamaica
17
(1989)
80.2
40.2
30.1
26.9
25.5
15.8
9.2
7.9
M
exico
159
(1987)
18.8
11.9
8.0
7.1
52.1
27.7
15.7
18.6
Pe
ru
7,650
(1990)
139.0
56.7
39.5
15.4
10.2
11.8
6.5
6.0
Simple
average
e
. . .
98.0
149.0
291.9
115.8
19.4
12.7
8.6
8.2
Simple
av
erage,
ex
cluding
B
razil
e
. . .
50.9
24.0
17.3
14.2
19.0
13.2
9.2
8.9
Sour
ce:
P
roject
database,
on
the
basis
of
ECL
A
C
statistics;
Corbo
and
F
ischer
(1994:
32–33)
for
Chile
I.
a.
V
ariation
in
consumer
price
index,
December-December
.
b.
I
n
year
near
beginning
of
reforms.
c.
Chile
is
listed
twice
to
distinguish
two
phases
of
reforms.
d.
1974
–
81.
e.
Ex
cluding
Chile
I.

53
S T RU C T U R A L R E F O R M S A N D P U B L I C P O L I C I E S
by the move toward independent central banks that themselves had a
single target. Second, fiscal policy supported the fight against inflation
by shrinking deficits; this was done primarily by cutting expenditure rather
than by raising taxes or other revenues. Third, monetary policy was also
geared toward stabilization, although it could be expansionary if the de-
mand for real money balances rose. High interest rates were a key instru-
ment of stabilization, in combination with both floating exchange rates
and fixed or semi-fixed schemes. Finally, much less consensus prevailed
on exchange rate policy. In some countries and in some periods, the ex-
change rate was used primarily to lower inflation; in an increasing num-
ber of cases, it was set in order to maintain international competitiveness
and stimulate growth. The shift from the former to the latter approach
usually proved to be traumatic.
With respect to the inflation goal, the nine project countries were quite
successful, as were most other countries in the region. Table 3-2 shows the
declining rate of increase of consumer prices from the beginning of the
reform and stabilization period through 1998.
14
Every case demonstrates
improvement over the initial level, although those cases with the highest
initial inflation obviously saw the most dramatic declines. The patterns
were not always linear: a reversal sometimes occurred, but then the declin-
ing path was resumed.
Argentina, Bolivia, and Peru dropped rapidly from hyperinflation in
the 1980s to two-digit inflation and then continued to the single-digit
level; Chile did the same in the 1970s, as did Brazil in the 1990s. The
policy mix to produce stabilization varied, with some countries using ex-
change rate policy while others relied mainly on monetary or fiscal policy.
Costa Rica, Jamaica, and Mexico suffered temporary reversals in their sta-
bilization efforts; Colombia had double-digit inflation that only declined
moderately over the period.
Low and Volatile Growth
While stabilization policies had an undeniably positive impact on in-
flation, they also contributed to restraining growth rates in the short and
14. Several tables in this section include data for Chile in the 1970s and early 1980s as well as the
1990s. Given the longer time period covered by the Chilean experience, this provides some additional
data for the reader. For the sake of clarification, the table references are to Chile I (1974–81) and
Chile II (1990–98).

54
S T R U C T U R A L R E F O R M S A N D P U B L I C P O L I C I E S
medium run. Moreover, they were procyclical, as interest rates were raised
and fiscal expenditure was cut to slow price increases, protect the exchange
rate, or deal with balance-of-payments problems. Expansion of output thus
displayed a stop-go pattern in the 1990s, both for the project countries as
a group and for many of them individually. As table 3-3 shows, growth
rates peaked twice in the decade, in 1994 and 1997, and each peak was
followed by a sharp decline. Attempts to control inflation and retain or
regain investor confidence were important causes of both declines, which
were centered in Mexico in 1995 and in Brazil in 1998. Stabilization poli-
cies were also associated with temporary recessions in individual countries
(for example, Peru in 1990–91, Costa Rica in 1996, and Jamaica through-
out much of the decade). Similar experiences, although not shown in the
table, occurred in Chile in 1975, Costa Rica in 1982–83, Bolivia in 1985,
and Argentina in 1989–90. As discussed in chapter 4, when these stabiliza-
tion episodes coincided with the initiation of the reforms, the resulting
slowdown or contraction in growth contributed to a delay in investor
response.
The Twin Deficits
Tables 3-4 and 3-5 present the fiscal and current account deficits: the
so-called twin deficits. Here we see a more mixed picture than in the case of
Table 3-3. GDP Growth Rates, 1991–98
a
Percent
Country
1991
1992
1993
1994
1995
1996
1997
1998
Argentina
10.6
9.6
5.7
8.0
–4.0
4.8
8.6
4.2
Bolivia
5.3
1.6
4.3
4.7
4.7
4.4
4.4
4.7
Brazil
1.0
–0.9
4.2
4.5
1.6
1.7
2.2
0.0
Chile
8.0
12.3
7.0
5.7
10.6
7.4
7.6
3.4
Colombia
2.0
4.0
5.2
6.0
5.8
2.1
3.1
0.6
Costa Rica
2.3
7.7
6.3
4.5
2.4
–0.6
3.7
6.2
Jamaica
0.7
1.5
1.5
1.1
0.5
–1.7
–2.4
–0.7
Mexico
4.2
3.6
2.0
4.4
–6.1
5.2
6.8
4.9
Peru
2.8
–1.4
6.4
13.1
7.3
2.4
6.9
0.3
Simple average
4.1
4.2
4.7
5.8
2.5
2.8
4.5
2.6
Weighted average
3.5
2.8
3.9
5.3
-0.6
3.5
5.0
2.4
Source: Project database.
a. Based on constant 1980 dollars.

55
S T RU C T U R A L R E F O R M S A N D P U B L I C P O L I C I E S
the successful inflation results. The change in fiscal stance is perhaps the
best-known example of the more general shift in macroeconomic policy in
the region. The deficits of the nine project countries averaged 3.5 percent
of GDP in 1973–82, 4.4 percent in 1983–90, and an average of 1.4 per-
cent in 1991–98. The figure fell dramatically through 1994, when the av-
erage deficit was only 0.1 percent of GDP. It then began to expand again,
reaching 3.1 percent in 1998.
15
The decline in deficits was generally the
result of cuts in spending rather than increases in revenue, which caused
problems that will be discussed in the section on social policy.
These averages, of course, mask differences in the individual countries.
Only Chile maintained a surplus throughout the 1990s, while Argentina,
Mexico, and Peru alternated between surpluses and small deficits (less than
2 percent of GDP). In other cases, a significant shift occurred at some
point during the decade. Although deficits remained low in Colombia until
1996, the expansion of demand earlier in the decade had set the stage for
later problems. An inflexion point occurred in Costa Rica in 1994, Brazil
in 1995, and Jamaica in 1996. Bolivia had fiscal problems throughout the
decade. The earlier Chilean period saw a rapid reduction of the fiscal defi-
cit from 16.1 percent of GDP in 1971–73 to a surplus by 1976.
Current account deficits were also reduced in the 1990s compared to
the two previous decades, although the decline was less than that seen in
the fiscal area. The average current account deficit among the project coun-
tries was 4.6 percent of GDP in the period 1973–82 and 4.0 percent in
1983–90. This fell to 3.7 percent in 1991–98. As with the fiscal deficit, the
current account deficits were fairly small at the beginning of the 1990s
(averaging 1.9 percent of GDP in 1991). The smallest average deficits in
the 1990s have been in Brazil and Argentina. By the end of the decade,
most countries had substantially higher deficits. The average in 1998 was
5.5 percent, with deficits in five of the nine countries exceeding 5 percent.
In the case of Chile in 1973–81, a very large current account deficit devel-
oped, reaching a massive 14.5 percent of GDP by 1981.
Comparing tables 3-4 and 3-5 in terms of standard accounting identi-
ties leads to some interesting conclusions about the 1980s versus the 1990s.
In the former period, the average fiscal deficit across countries and years
exceeded the current account deficit, meaning that the private sector ac-
counts (savings minus investment) were in surplus. In the latter period, the
average fiscal deficit was less than half the size of the current account defi-
15. These numbers are not completely comparable across periods or across countries, since the
definition of the government sector varies to some extent and the data source changes in the 1990s.

T
able 3-4.
F
iscal Balance as P
er
cent of GDP
, 1983–98
a
Pe
rcent
A
ver
age
Countr
y
1983–901991–98
1991
1992
1993
1994
1995
1996
1997
1998
Argentina
–3.6
–0.7
–1.6
–0.1
1.4
–0.2
–0.6
–1.8
–1.4
–1.2
Bolivia
–5.2
–3.6
–4.3
–4.4
–6.1
–3.0
–1.8
–2.0
–3.4
–4.0
B
razil
–10.8
–3.3
–0.2
–1.8
–0.8
1.1
–4.9
–5.9
–6.1
–8.0
Chile
I
b
–16.1
c
0.8
d
–3.5
d
–0.9
d
0.6
d
0.1
d
1.5
d
3.3
d
4.5
d
0.8
d
Chile II
b
–0.4
1.9
1.5
2.3
2.0
1.7
2.6
2.3
2.0
0.4
Colombia
–1.5
–0.8
0.0
–0.1
0.3
2.6
–0.5
–2.0
–3.1
–3.4
Costa
Rica
–2.1
–3.9
–3.1
–1.9
–1.9
–6.9
–4.4
–5.2
–3.9
–3.3
Jamaica
–2.5
–1.3
2.4
2.2
3.3
1.3
2.2
–6.7
–8.3
–6.9
M
exico
–8.3
–0.3
–0.4
1
.6
0
.7
–0.3
–0.2
–0.1
–0.6
–1.2
Pe
ru
–5.1
–0.2
–0.9
–1.5
–1.2
3.0
–0.1
–1.0
0.0
–0.6
Simple
av
erage
e
–4.4
–1.4
–0.7
–0.4
–0.3
–0.1
–0.9
–2.5
–2.8
–3.1
Source:
P
roject
database,
on
the
basis
of
ECL
A
C
and
IMF
statistics;
Corbo
and
F
ischer
(1994:
32
–
33)
for
Chile
I.
a.
N
onfinancial
public
sector
ex
cept
Chile
and
Costa
Rica
(central
go
vernment
only).
b.
Chile
is
listed
twice
to
distinguish
two
phases
of
reforms.
c.
1971–73.
d.
1974–81.
e.
Simple
av
erage
ex
cluding
Chile
I.

T
able 3-5.
C
urr
ent A
ccount Balance as P
er
cent of GDP
, 1983–98
Pe
rcent
A
ver
age
Countr
y
1983–901991–98
1991
1992
1993
1994
1995
1996
1997
1998
Argentina
–1.5
–2.5
–0.3
–2.4
–3.0
–3.6
–1.0
–1.3
–3.7
–4.5
Bolivia
–9.4
–5.8
–5.3
–7.3
–7.2
–1.2
–4.9
–5.6
–6.9
–7.9
B
razil
–0.7
–1.7
–0.4
1.6
0.0
–0.2
–2.6
–3.1
–4.2
–4.5
Chile I
a
–2.9
b
–5.0
c
–0.4
c
–5.2
c
1.7
c
–3.7
c
–5.2
c
–5.4
c
–7.1
c
–14.5
c
Chile
II
a
–5.2
–3.4
–0.3
–2.2
–5.6
–3.0
–2.1
–5.2
–5.4
–6.2
Colombia
–1.9
–3.2
5.7
2.0
–4.4
–4.5
–5.4
–5.8
–6.2
–6.6
Costa
Rica
–7.5
–3.5
–1.8
–5.6
–8.2
–2.9
–3.4
–1.2
–2.2
–2.8
Jamaica
–6.7
–3.7
–6.4
0.8
–4.3
0.2
–3.5
–4.0
–5.3
–7.0
M
exico
0
.2
–3.9
–4.7
–6.7
–5.8
–7.0
–0.5
–0.7
–1.9
–3.8
Pe
ru
–3.3
–5.5
–3.5
–5.0
–5.7
–5.4
–7.3
–5.9
–5.3
–6.1
A
verage
d
–4.0
–3.7
–1.9
–2.8
–4.9
–3.1
–3.4
–3.6
–4.6
–5.5
Source:
P
roject
database,
on
the
basis
of
ECL
A
C
and
IMF
statistics;
Corbo
and
F
ischer
(1994:
32
–
33)
for
Chile
I.
a.
Chile
is
listed
twice
to
distinguish
two
phases
of
reforms.
b.
1971–73.
c.
1974–81.
d.
Simple
av
erage
ex
cluding
Chile
I.

58
S T R U C T U R A L R E F O R M S A N D P U B L I C P O L I C I E S
cit, so the private sector was the main source of deficit spending. An im-
portant exception to this generalization was Brazil, where the fiscal deficit
in the 1990s was larger than the current account deficit, while in Costa
Rica the two were approximately the same size. These results reflect the
general trend during the period of governments retreating in favor of the
private sector.
Real Interest and Exchange Rates
Real interest and exchange rates, shown in tables 3-6 and 3-7, are closely
connected to the twin deficits and have other impacts on the economies as
well. As an integral part of monetary policy, interest rates were used to
buttress fiscal policy in the 1990s, especially as fiscal deficits began to rise.
They were also used to support the exchange rate in those cases in which an
exchange rate anchor was part of the stabilization strategy. High lending
rates thus typified most countries in the current decade.
16
Only Argentina,
Chile, and Mexico had real lending rates in the 10 percent range for any
substantial part of the 1990s. In Colombia and Costa Rica, rates averaged
in the 10-20 percent range, while in Bolivia, Brazil, Jamaica, and Peru, as
well as Chile in the 1970s, real rates were even higher
17
(see table 3-6).
High real interest rates had at least two negative impacts on the region’s
economies. First, they expanded fiscal deficits since they increased the
amounts governments had to pay in interest. This problem was especially
serious for those countries with large internal debts resulting from previous
deficits. Second, high domestic interest rates had a negative impact on in-
vestment—especially for small firms, since large firms have access to inter-
national credit markets—and thus on the expansion of output and
employment. This further increased fiscal deficits, since low growth re-
duces tax revenues and increases government transfer payments.
Real exchange rates followed equally problematic trends. Real depre-
ciation was typical of many Latin American and Caribbean countries in
the 1980s, because of both the lack of capital inflows and the resulting
necessity to increase exports. Real appreciation was the pattern during much
16. Even for countries with low rates in the Latin American context, the cost of capital was high
compared to the Group of Seven nations, where similar rates in the 1990s were around 6–8 percent.
17. In Argentina, Bolivia, and Peru, a large percentage of bank loans were made in dollars rather
than local currency. In the case of Peru and especially Bolivia, the dollar rates were substantially lower
than those shown in table 3-6.

59
S T RU C T U R A L R E F O R M S A N D P U B L I C P O L I C I E S
T
able 3-6.
R
eal I
nter
est R
ates, 1988–98
a
Pe
rcent
A
ver
age
Countr
y
1988–901991
1992
1993
1994
1995
1996
1997
1998
Argentina
n.a.
n.a.
n.a.
n.a.
5.7
14.0
10.3
8.8
9.6
Bolivia
21.1
16.2
29.8
41.8
44.3
37.0
38.6
43.3
29.4
B
razil
214.8
76.9
138.5
157.6
–0.4
18.7
26.3
37.7
50.7
Chile
I
b
n.a.
n.a.
c
n.a.
c
n.a.
c
16.3
c
18.9
c
15.6
c
10.1
c
14.7
c
Chile II
b
15.6
5.7
7.4
10.3
8.0
9.2
9.3
9.0
14.5
Colombia
14.3
12.9
8.1
11.0
14.4
18.2
17.8
13.3
19.8
Costa
Rica
10.3
7.8
5.2
18.4
17.2
11.0
7.5
8.3
9.6
Jamaica
10.7
–13.0
–18.3
17.7
10.6
19.7
14.1
24.3
24.0
M
exico
n.a.
n.a.
n.a.
11.2
12.5
17.4
1.9
11.6
11.1
Pe
ru
716.7
67.2
57.7
32.8
24.2
14.5
13.0
19.7
21.9
A
verage
d
143.4
24.8
32.6
37.6
15.2
17.7
15.4
19.6
21.2
Source:
IMF
(2000);
ECL
A
C,
on
the
basis
of
official
statistics,
for
B
razil;
Corbo
and
F
ischer
(1994:
32
–
33)
for
Chile
I.
a.
Rates
ar
e
av
erage
annual
shor
t-term
lending
rates
to
businesses,
deflated
by
the
consumer
price
index.
b.
Chile
is
listed
twice
to
distinguish
two
phases
of
reforms.
c.
1974–81.
d.
Simple
av
erage
ex
cluding
Chile
I.

60
S T R U C T U R A L R E F O R M S A N D P U B L I C P O L I C I E S
T
able
3-7.
R
eal
E
ffective
Exchange
R
ates,
1987–98
a
(1990
=
100)
A
ver
age
Countr
y
1987–901991
1992
1993
1994
1995
1996
1997
1998
Argentina
126.9
71.0
62.8
57.6
57.2
61.0
62.1
60.3
59.0
Bolivia
86.7
99.7
104.2
110.4
116.2
119.0
111.1
108.4
104.0
B
razil
125.0
131.7
141.2
136.7
137.9
121.4
114.3
113.1
118.5
Chile
I
b
80.3
c
164.9
d
197.7
d
166.8
d
134.4
d
149.7
d
150.8
d
130.6
d
113.5
d
Chile II
b
97.1
99.7
96.2
98.2
94.8
89.2
86.0
80.2
82.4
Colombia
91.1
101.0
89.4
85.7
74.7
74.8
69.4
65.0
69.3
Costa
Rica
102.2
109.8
104.6
104.5
105.0
101.4
100.4
102.6
103.9
Jamaica
84.2
116.4
135.3
126.8
130.0
125.4
105.6
90.7
85.1
M
exico
113.1
90.9
83.9
80.0
82.2
121.6
108.3
93.9
94.0
Pe
ru
140.4
83.1
83.7
93.1
87.9
87.7
86.4
86.8
88.1
A
verage
e
107.4
100.4
100.1
99.2
98.4
100.2
93.7
89.0
89.4
Source:
P
roject
database,
on
the
basis
of
ECL
A
C
statistics;
Corbo
and
F
ischer
(1994:
32
–
33)
for
Chile
I.
a. The
av
erage
of
the
index
es
for
the
real
ex
change
rate
for
the
curr
ency
of
each
countr
y
against
the
curr
encies
of
its
main
tr
ading
par
tners,
w
eighted
accor
ding
to
the
relativ
e
magnitude
of
impor
ts
fr
om
those
countries
in
the
period
1992
–
96.
Consumer
price
index
es
w
er
e
used
to
deflate
the
index
es.
b.
Chile
is
listed
twice
to
distinguish
two
phases
of
reforms.
c.
A
verage
1970–73.
d.
1974–81;
1973
=
100.
e.
Simple
av
erage
ex
cluding
Chile
I.

61
S T RU C T U R A L R E F O R M S A N D P U B L I C P O L I C I E S
of the 1990s. In some cases, the appreciation stemmed from government
policy that employed an exchange rate “nominal anchor” to fight inflation.
In other cases, it was simply very difficult to avoid appreciation in the face
of the massive capital inflows described in chapter 2. The result was a ten-
dency toward larger trade and current account deficits as exports became
more expensive and imports cheaper. In response to the large current ac-
count deficits, governments felt compelled to restrain growth, often by
raising interest rates. The alternative was perceived to be a foreign exchange
crisis.
The amount of appreciation varied, of course, depending on the par-
ticular range of years selected. Table 3-7 shows the average for the period
1987–90 and the yearly variation between 1991 and 1998. The countries
with the largest appreciation in this period were Argentina (66 percent
between 1989 and 1993, but stable thereafter), Mexico (40 percent be-
tween 1987 and 1994, followed by a large devaluation), and Colombia and
Jamaica (33 percent in 1991–98 and 1992–98, respectively). Chile and
Brazil had lesser appreciation in the 1990s, while Bolivia, Costa Rica, and
Peru (since 1991) generally managed to maintain the real value of their
exchange rates. Chile also had a large appreciation in 1979–82 when the
local currency was pegged to the dollar.
If we combine the information in tables 3-2 through 3-7, we can
compare patterns of macroeconomic policy and outcomes across project
countries and relate them to the three types of reformers (that is, aggres-
sive, cautious but unstable, and cautious and stable). The four aggressive
reformers put strong emphasis on reducing large fiscal deficits and infla-
tion, but they were less concerned about other aspects of macroeconomic
policy, especially large current account deficits. The rationale, whether
explicit or implicit, was that any deficits originating in the private sector
would be self-correcting. Nevertheless, a current account deficit led to a
crisis in Chile in the early 1980s.
Both of the cautious but unstable reformers continued to have macro-
economic problems, which eventually resulted in foreign exchange crises.
In the case of Mexico, the manifestation was a very large current account
deficit; in Brazil the use of higher interest rates to protect the currency both
exacerbated existing fiscal problems and created a major recession. Follow-
ing the 1994–95 peso crisis, Mexico’s macroeconomic policy became much
more orderly: the devaluation cut the external deficit and interest rates
came down, while the fiscal deficit remained small. Moreover, growth re-
sumed, but inflation was slow to fall, and real wages suffered as a conse-

62
S T R U C T U R A L R E F O R M S A N D P U B L I C P O L I C I E S
quence. It is too early to tell if Brazil will follow a similar path after the
1999 devaluation, although growth seems to be picking up.
Among the cautious and stable reformers, the pattern diverged some-
what after the beginning of the reform process. Costa Rica maintained
macroeconomic equilibrium in relative terms, despite fiscal problems de-
riving from the failure of an important bank. Colombia and Jamaica en-
countered more generalized disequilibria with appreciated exchange rates,
high interest rates, and rising fiscal deficits. Colombia also had a large cur-
rent account deficit, while growth rates in Jamaica were low or negative.
Nonetheless, no country in this group faced macroeconomic problems as
serious as those of Mexico and Brazil.
Links between Reforms and Macroeconomic Policy
An important question to ask about the reforms themselves as well as
about the relation between the reforms and macroeconomic policies is
whether they have been consistent and mutually reinforcing, or whether
they have been so contradictory as to undermine the effectiveness and cred-
ibility of the package as a whole. Not surprisingly, the evidence seems to
support an ambivalent conclusion, across both countries and time periods
and also across reform and policy areas.
Consistencies
At the most general level, the trend toward a more equilibrated macro-
economic policy stance, together with a set of reforms that opened new
opportunities to the domestic and foreign private sectors, gave an impor-
tant psychological boost to entrepreneurs; in Keynesian terms, it raised
animal spirits. The reforms-cum-macroeconomic stability also ended the
external financial constraint that had crippled the region during most of
the 1980s.
18
In particular, the new context attracted substantial amounts of
foreign direct investment. The overall result in some cases was new invest-
ment, the incorporation of new technology, and ultimately better growth
opportunities. Nonetheless, as discussed in chapter 4, this process was sub-
ject to significant lags as firms waited to see if the reforms would continue.
Other conditions at the microeconomic level were also necessary to supple-
18. This, of course, was in the context of substantial international liquidity and low interest rates in
the industrialized countries.

63
S T RU C T U R A L R E F O R M S A N D P U B L I C P O L I C I E S
ment the initial reforms and the new stability in order for investment to
occur in more than a few favored sectors.
At a more specific level, the most successful mix of reforms and macro-
economic policy occurred in the area of inflation. Governments generally
targeted macroeconomic policy at taming inflation, as seen earlier. Trade
liberalization supported these efforts in two important ways. First, inputs
could be imported at lower prices, thus making it possible for local compa-
nies to produce cheaper goods. Second, competition with foreign products
constrained the ability of local business to raise prices, even if all their
inputs were local. Privatization also helped to lower inflation through a
positive impact on fiscal deficits. When loss-making firms were privatized,
subsidies were eliminated and fiscal accounts improved permanently. In
addition, privatization brought in one-time revenues that helped lower
deficits in the short run; in the longer run, other arrangements had to be
sought to replace revenues generated by selling state firms. For govern-
ments that used such revenues to pay down debt, the lower interest pay-
ments helped to perpetuate lower deficits; those that used them to increase
spending tended to run into trouble later on.
Inconsistency Syndromes
Other areas displayed significant contradictions among reforms and
macroeconomic policies that undermined governments’ growth-with-equity
goals. Our case studies point to three principal inconsistency syndromes.
The first, which affected all countries except Bolivia and Costa Rica, in-
volved opening the capital account, which produced a rush of short-term
capital into the countries and led to appreciation of the local currency. The
appreciation, in turn, made imports cheaper and exports more expensive,
thus increasing the trade deficit. It also sent mixed signals to firms that had
been encouraged by the trade reforms to begin selling abroad and to invest
in new capacity oriented toward exports. While the trade deficit could be
covered in the short run by the very capital inflows that caused the appre-
ciation, the flows were reversible and could leave the country as quickly as
they entered in response to domestic problems or international financial
trends. In the best of cases, the capital outflows caused disruptions in the
local economy; in the extreme, they resulted in currency crises that were
extraordinarily costly and took years to overcome.
A second syndrome centered on financial liberalization and monetary
policy, which became more difficult to manage if accompanied by capital

64
S T R U C T U R A L R E F O R M S A N D P U B L I C P O L I C I E S
account opening. Financial liberalization was designed to end financial re-
pression, so it is not surprising that domestic interest rates rose following
the reforms. Our evidence suggests that overshooting was quite typical in
such situations, leading to local interest rates substantially higher than in-
ternational rates. This was especially problematic for small firms that did
not have access to the international markets. Even more important for the
economies as a whole were problems that financial liberalization caused for
the banking sector. Local banks frequently were not adept at evaluating
long-term credit risks because of government influence over interest rates
and credit allocation before the reforms. When large amounts of foreign
capital entered countries, thereby increasing the availability of credit, the
banks became overextended. Particular problems resulted if they had bor-
rowed in foreign currency, since their debts then ballooned when the rever-
sal of capital inflows forced a devaluation. In this way, banking crises merged
with currency crises.
The third syndrome involved fiscal policy. All governments in our study
sought to lower or eliminate their fiscal deficits, but several of the reforms
made this more difficult. One was tax reform, which lowered rates on indi-
viduals and corporations. At least in the short run, there is no evidence in
our cases to support the idea that lowered tax rates have increased revenues
as supply-side theorists have argued in the industrialized countries. An-
other reform that interfered with lowering fiscal deficits was import liber-
alization. This was especially important for the smaller and less-developed
countries that relied heavily on tariffs as a source of government revenue.
For them, import liberalization caused problems in the short run that might
or might not be offset in the longer run by a trade version of the supply-
side argument (that is, lower tariffs stimulate economic growth, which leads
to other sources of revenue). The behavior of the exchange rate was an
important element in determining the ultimate outcome. A third reform,
decentralization, exacerbated the fiscal deficits of the central governments
by transferring revenues to provinces and municipalities without always
transferring the counterpart obligations. As mentioned above, privatization
could help fiscal policy in the short run, but it created its own trap later on.
Social Policy and Social Expenditure
Social policy was an integral part of the reform process from the begin-
ning, at least in principle. The basic idea was to get the government out of
productive activities, where the private sector could do a better job, thus

65
S T RU C T U R A L R E F O R M S A N D P U B L I C P O L I C I E S
freeing public resources for social expenditure. Among the blueprints for
reform, both the World Bank’s market-friendly model and the Washington
Consensus embodied this idea.
19
One of the World Bank’s main elements
was “investment in people,” including education, health care, nutrition,
and family planning. Likewise, one of the ten items in the Washington
Consensus was adjusting fiscal priorities to give greater importance to health
and education. These policies were widely perceived as having double value:
they would lead to higher productivity and thus better economic perfor-
mance at the same time that they increased equity and mobility in very
unequal societies.
Social policy, broadly speaking, is a rather vague concept referring to
all government interventions to improve the welfare of the population and
to incorporate excluded groups. In practice, its meaning varies from coun-
try to country in terms of both the areas covered and types of activities
involved. While all would include health and education, others would also
include programs oriented toward particular groups (for example, labor,
the elderly, women, the handicapped, and minorities) or to solve particular
problems (such as poverty alleviation, urban reconstruction, or agrarian
reform). Cutting across these activities, we focus on social expenditure,
which is a central component of almost all of them.
The overall category of social expenditure, in turn, includes a variety
of activities that have different effects on economic performance and on
the distribution of income and welfare. Latin American statistics typically
divide social spending into four categories: education, health, social secu-
rity, and other (including housing subsidies). The first two, which are often
referred to as human capital, are valued because they are useful in promot-
ing economic development and are progressive in terms of distribution.
(Funding for university education is a partial exception, in that it is not a
progressive expenditure but is important in promoting growth.) Social se-
curity and housing subsidies, in contrast, normally have a regressive im-
pact. As will be discussed further in chapter 5, public spending on primary
and secondary schooling as well as on health care are concentrated on the
lower part of the income distribution structure, while social security and
housing subsidies provide disproportionate benefits to the middle income
strata.
20
19. World Bank (1991); Williamson (1990).
20. ECLAC (1999c, chapter 4).

66
S T R U C T U R A L R E F O R M S A N D P U B L I C P O L I C I E S
T
able
3-8.
Changes
in
Social
Expenditur
e,
1980–97
1997
dollars
and
per
cent
Social
expenditur
e
as
shar
e
P
er
capita
social
expenditur
e
of
total
public
expenditur
e
Social
expenditur
e
as
shar
e
of
GDP
Countr
y
1980–81
1990–91
1996–97
1980–81
1990–91
1996–97
1980–81
1990–91
1996–97
H
igh
spending
Argentina
1378
1222
1570
50.1
62.2
65.1
16.7
17.7
17.9
B
razil
368
476
566
44.4
51.0
54.2
9.7
11.0
11.8
Chile
558
451
725
62.4
60.8
65.9
18.4
13.0
14.1
Costa
Rica
4
8
7
4
4
5
5
5
0
a
66.0
64.4
65.1
a
19.5
18.2
20.8
a
M
edium
spending
Colombia
1
5
6
1
8
1
3
9
1
27.2
29.7
38.2
7.8
8.1
15.3
Jamaica
1
9
4
b
234
244
a
22.8
b
26.8
19.2
a
n.a.
9
.2
9
.7
a
M
exico
3
3
3
2
8
3
3
5
2
28.8
41.6
52.9
7
.9
6
.5
7
.8
Lo
w
spending
Bolivia
6
0
5
5
119
34.6
25.8
44.2
5.6
6.0
12.0
Pe
ru
133
c
41
76
a
23.6
c
14.3
37.5
a
4.6
c
2.0
6.0
a
Si
mple
av
erage
407
376
510
40.0
41.8
49.1
11.3
10.2
12.8
Sour
ce:
ECL
A
C
(1999c)
and
M
ostajo
(2000),
on
the
basis
of
the
ECL
A
C
Social
Dev
elopment
Division
database.
a.
Only
1996.
b.
1985.
c.
1980.

67
S T RU C T U R A L R E F O R M S A N D P U B L I C P O L I C I E S
Social expenditure declined in most Latin American and Caribbean
countries in the 1980s (see table 3-8). This reflected the urgent need to cut
fiscal deficits, which we have seen were large during that decade. In the
process, a low priority was accorded to social spending in comparison with
other sectors, such as general administration, defense, and debt service.
One study that examined fiscal trends during the 1980s found that social
spending was markedly procyclical, except in Chile and Colombia. That is,
when economic activity contracted, social spending fell by even more, with
a decline in the share of social spending in GDP, and when economic activ-
ity expanded, social spending increased.
21
To differing degrees and with differing emphases, countries gave greater
priority to the social area in the 1990s. All nine project countries increased
per capita social expenditure in that decade; except for Peru, the increase
more than made up for the decline of the 1980s. After taking account of
inflation, the average rise in social expenditure per capita between 1980–
81 and 1996–97 was 25 percent. With the exception of Brazil, Jamaica,
and Colombia, the overall figures represented a decline during the 1980s
and a sizable rise in the 1990s.
22
Social expenditure as a share of total pub-
lic expenditure followed a similar pattern, with an average increase of 23
percent over the seventeen year period. The share in 1996–97 was generally
higher than 1980–81, but the intraperiod pattern was more mixed. The
most common situation involved modest change during the 1980s fol-
lowed by a large rise in the 1990s. Finally, social expenditure as a share of
GDP also rose in most countries, but at a slower pace (13 percent) than for
the other two indicators.
At the country level, two differing trends seem to have been at work.
Four countries already had relatively high levels of social expenditure by a
combination of the three indicators shown in table 3-8. These countries
(Argentina, Brazil, Chile, and Costa Rica) improved their performance
modestly, but there was little room to make big increases, especially in
terms of social spending within total spending. Chile was a partial excep-
tion to this generalization, since social spending rose by an average of 7
percent per year and the share of total expenditure increased from 61 to 66
percent in the 1990s. Another group of countries had much lower social
21. Cominetti and di Gropello (1995); see also Cominetti and Ruiz (1998).
22. Our data on social expenditure for Brazil include only spending by the federal government.
These data underestimate social expenditure by the public sector because they do not include spend-
ing at the state and municipal levels (ECLAC, 1999c, Box 4.1).

68
S T R U C T U R A L R E F O R M S A N D P U B L I C P O L I C I E S
spending at the beginning of the decade (Bolivia, Colombia, Jamaica,
Mexico, and Peru); they put a high priority on catching up in the 1990s.
Bolivia and Peru made especially dramatic improvements, although from
very low initial levels, while Colombia also made an important effort from
a higher starting point.
Beyond the issue of the quantity of social services, Latin American
countries at the beginning of the 1990s had serious problems with the
quality of those services. With respect to education, issues included poor
training of teachers, high student-teacher ratios, poor quality of textbooks,
lack of other equipment, and an emphasis on rote learning rather than
problem solving. In the health area, indicators of poor quality were long
waits for treatment, poor training of doctors, high patient-doctor ratios,
and lack of medicines and new treatments. The poor quality of public
housing was as common in Latin America as in other parts of the world.
The pension systems frequently reached only a small percent of the popu-
lation, and high inflation rates eroded their value.
To deal with the quality problems, many Latin American and Carib-
bean governments began reforms in the social area. While some of the new
policies were parallel to the economic reforms that were identified earlier
in the chapter, others embodied quite different approaches. In practice,
most countries tried a combination. One type of reform involved improv-
ing the central government’s delivery of services in education, health, hous-
ing, and social security through better training of personnel, better facilities,
more participation of beneficiaries, and so on. A second, which had sub-
stantial overlap with the first in terms of goals, focused on the decentraliza-
tion of social services to municipal and provincial levels of government,
especially with respect to education and health. The idea behind this pro-
cess was that if the administration of services were moved to the local level,
it would be both more efficient and more equitable. The third approach
was the one most closely related to the economic reforms since it involved
privatizing certain aspects of the delivery of social services. Specifically, a
number of countries encouraged the establishment of private schools, health
care, and pension systems for those who could afford to pay, leaving the
rest of the population in the public system.
23
While all of these reforms have their critics, the privatization approach
23. Reform of the central government system is discussed in ECLAC (1997, chapter 5), decentrali-
zation in di Gropello and Cominetti (1998), and privatization of the health and pension system in
ECLAC (1998b, chapter 7).

69
S T RU C T U R A L R E F O R M S A N D P U B L I C P O L I C I E S
is especially controversial because it infringes on the principle that all citi-
zens have an equal right to social services. The privatized system offers
first-class services to those who can afford to pay, while the public sector
usually provides services of much lower quality. Thus students in private
schools perform better on standardized tests and are more likely to go on to
secondary and university education and to get good jobs. People who re-
ceive treatment from doctors in the private health system have access to
preventive care, the latest international treatments, and good hospital facili-
ties, while those who must rely on the public system must wait in very long
lines to receive inadequate care. The new pension systems, following the
Chilean example, involve individual workers paying into private pension
funds, which will later be responsible for providing pensions to retirees.
These social policy trends are not independent of the economic re-
forms and macroeconomic policies that were examined earlier in the chap-
ter. The 1980s manifested clear contradictions between macroeconomic
and social policies. The need to reduce fiscal deficits to cut inflation rates
collided with the need to expend resources to achieve social and economic
goals. The macroeconomic priority usually won out. This had a negative
impact on public welfare in the short run; it is also likely to have created
longer-run problems that are more difficult to measure in terms of eco-
nomic growth and productivity. In the 1990s, the contradiction between
macroeconomic stabilization and social policy was less severe as govern-
ments became more aware of the benefits of social spending, especially on
education. It was the reduction of fiscal deficits in the 1980s, however, that
permitted higher social spending in the 1990s. The economic reforms con-
tributed through the sale of loss-making state firms and additional rev-
enues from privatizations.
Whether social policies will continue to coexist harmoniously with
reforms and macroeconomic policies remains to be seen. Per capita social
expenditures can be increased in three ways: growth of GDP, increased
public expenditure as a share of GDP, and increased priority of social ex-
penditure as a share of total public expenditure. In addition, the impact of
a given amount of money can be increased by raising the efficiency and
productivity of the expenditure.
24
This list serves as an indicator of the
areas to watch. If growth slows, the rate of increase of social expenditure
may also slow or even fall. Macroeconomic prudence currently limits pub-
lic expenditure as a share of GDP (since high taxes are considered to dis-
24. For a discussion of the efficiency of social expenditure see ECLAC (1998b, chapters 1 and 6).

70
S T R U C T U R A L R E F O R M S A N D P U B L I C P O L I C I E S
courage investment), and some countries are approaching their maximum
social spending as a share of total public spending. Rapid growth may there-
fore be the only way to avoid a contradiction among these policy areas.
Later chapters of this book discuss whether the reforms and macroeco-
nomic policies being followed are likely to lead to high growth rates in the
future, thus preventing the resurgence of this contradiction.
Conclusions
The reform process led to the adoption of a series of changes in eco-
nomic policy in Latin America and the Caribbean that reflected main-
stream economists’ critiques of the import substitution model. The reforms
were adopted to varying degrees across the region. Among the nine project
countries, four engaged in rapid, comprehensive reforms, while the other
five were more gradual and selective. We argued that the difference had to
do with initial conditions, whereby those with especially grave problems
were willing to experiment with deeper reforms. Later chapters examine
whether the differences in speed and scope affected outcomes.
Macroeconomic policy change was more homogeneous, with all nine
countries making substantial progress in lowering inflation. Fiscal deficits,
which are crucial determinants of inflation rates, fell in the 1990s with
respect to the two previous decades, but they began to rise again in the
mid-1990s. Interest rate and exchange rate policies diverged more than
fiscal policy. With a few exceptions, however, real interest rates remained
relatively high, in part to protect exchange rates. The real exchange rates, in
turn, generally tended to appreciate, either as an explicit government policy
to combat inflation or as a result of large inflows of foreign exchange. The
relation between the reforms and macroeconomic policy was sometimes
mutually reinforcing, especially with respect to inflation, but in other cases
inconsistencies dominated. We identified three inconsistency syndromes,
involving capital account opening, trade reform, and the exchange rate;
domestic financial reform, banking regulation, and interest rates; and tax
reform, privatization, and fiscal policy.
Social policy, operationalized as social spending, became a more im-
portant component of the policy package in the 1990s. In the 1980s, social
expenditure was one of the first items to be cut to lower deficits. In the
following decade, however, governments appeared to come to the conclu-
sion that better social conditions could make a positive contribution to
economic growth. In addition, they would help to deal with the high levels

71
S T RU C T U R A L R E F O R M S A N D P U B L I C P O L I C I E S
of inequality that characterized the region. Thus social spending increased
in all project countries in the 1990s, accompanying the return to higher
growth rates.
A major conclusion of the chapter is that the structural reforms must
not be viewed in isolation but rather as part of a policy package that in-
cludes the macroeconomic and social areas. These three elements can work
together to create a propitious environment that encourages private sector
actors to invest and increase output, or they can be contradictory, thus
sending mixed signals and undermining incentives for the private sector.
In addition, international economic trends will have an impact on all three,
and they must be taken into account as well.
These policies are relevant for all of the remaining topics of the study—
investment, growth, employment, and equity—but several particularly
strong links can be identified. The reforms and macroeconomic policies,
together with the international context, are the dominant factors influ-
encing investment decisions and the incorporation of new technology. A
properly educated labor force is a necessary complement, especially with
respect to new technology and higher productivity. Since growth is heavily
determined by investment and technological trends, these same policies
are indirectly relevant for analyzing growth. Social expenditure is also a
key factor in the analysis of employment generation, quality of employ-
ment, and equity.

72
I N V E S T M E N T, P RO D U C T I V I T Y, A N D G ROW T H
72
4
Investment, Productivity,
and Growth: Recovery
and Modest Advances
H
aving reviewed the process of economic reforms,
together with the public policies that accompa-
nied them and the international context in which they took place, we can
now turn to the main task of the book—analyzing the impact of the re-
forms first at the aggregate level and then at the sectoral and microeconomic
levels. This chapter, then, uses an aggregate, economy-wide approach to
focus on investment, productivity, and growth.
1
Most of the literature on the impact of the reforms is concerned with
their effect on the growth rate of gross domestic product (GDP), and the
analysis concentrates on macroeconomic variables. This is hardly surpris-
ing, since the principal reason for undertaking the reforms in the first place
was to increase the efficiency of Latin American and Caribbean economies
in order to raise growth rates. Illustrative of this approach is the title of one
of the early reform manifestos: “Toward renewed economic growth in Latin
America.”
2
Other benefits, especially employment generation, were expected
to follow from more dynamic growth.
1. Major inputs for this chapter include Hofman (2000), Moguillansky and Bielschowsky (2000), and
Katz (2000). These authors are not responsible for the conclusions reached on the basis of their data.
2. Balassa and others (1986).

73
I N V E S T M E N T, P RO D U C T I V I T Y, A N D G ROW T H
The early literature advocating the reforms as a way of raising growth
rates stressed the need to move from production that was overwhelmingly
oriented toward the domestic market to a greater emphasis on exports.
Three economic arguments were presented to support the benefits of ex-
port-led growth: greater efficiency at the microeconomic level as a result of
more competition; better exploitation of economies of scale, especially for
small and medium-size countries; and moderation of stop-go cycles deriv-
ing from foreign exchange shortages or recurring crises in agricultural pro-
duction.
3
The most important instrument for achieving export-led growth
was argued to be a competitive exchange rate, although this was considered
a necessary but not sufficient condition. Eliminating the special privileges
enjoyed by import-substitution firms and providing positive incentives for
exports were also required, together with credibility for the policies from
the point of view of investors. Many of these same issues are still on the
agenda more than two decades later.
The more recent literature on the link between growth and reforms
aims to determine whether the predicted positive relation actually came
about. A surprising degree of consensus has been reached on the topic.
The dominant conclusion is that while growth obviously improved in
comparison with the lost decade of the 1980s, it was quite modest.
ECLAC, in a statement that is representative of others in the literature,
says: “Most of the region’s economies have grown at moderate rates, which,
while respectable, are lower than in the past and insufficient to redress
technological and social lags.”
4
In a somewhat more positive vein, ex-
perts at the IDB indicate that growth in the 1990s was well above what it
would have been in the absence of the reforms. Nonetheless, they agree
that growth rates were unsatisfactory, below historical rates, and much
lower than in the high-growth countries of East Asia.
5
The questions that
now need to be addressed are why growth rates were disappointing, com-
pared to expectations, and how to improve performance.
Some of the literature trying to measure the impact of the reforms on
growth links the two directly, in the presence of certain control variables.
In a typical example, Eduardo Fernández Arias and Peter Montiel regress
per capita GDP on various structural reform proxies and macroeconomic
3. See, for example, Krueger (1978); Bhagwati (1978). Krueger says that while in theory incentives
for exports and import substitutes should be equated at the margin, in practice countries with a
positive export bias did better. She cites Brazil and South Korea as examples (pp. 282-83).
4. ECLAC (1996, p.11).
5. IDB (1996).

74
I N V E S T M E N T, P RO D U C T I V I T Y, A N D G ROW T H
variables, while controlling for initial GDP, education, terms of trade, and
external demand. They find that the reform variables had a highly signifi-
cant positive effect on growth. While investment and productivity are im-
plicitly assumed to be important, they are not explicitly incorporated into
the analysis.
6
Others examine investment directly, either as an end in itself or as part of
a two-step analysis of growth.
7
Lora and Barrera argue that the reforms’ main
contribution to economic growth was the turnaround in total factor produc-
tivity growth in the 1990s compared to the 1980s. (It was negative in the
1980s.) An increase in the investment coefficient was also important, but of
lesser magnitude.
8
Rodrik, in contrast, says that while the relation between
investment and growth is erratic in the short run, “in the long run, invest-
ment is key.”
9
He adds that policymakers and analysts have neglected the
central role of investment for growth in developing countries, suggesting
the need to focus on investment incentives if performance is to improve.
Our approach in this chapter assumes that it is essential to study the
behavior of all three variables: investment, productivity, and growth. It is
necessary to understand the relative importance of investment and produc-
tivity behavior in explaining growth rates, in comparison to other factors
that also have an impact. Moreover, the three variables provide different
kinds of information: investment and productivity trends give us some
leverage in forecasting future growth rates.
10
We proceed in the following way. The next section examines data on
long-term trends in investment and productivity. We then discuss the im-
pact of the reforms in these areas, differentiating transitory versus perma-
nent effects as well as three resulting phases in investment and the
incorporation of technical progress. We also provide an econometric model
of the determinants of investment, including the structural reforms. This is
followed by an examination of growth patterns, using growth-accounting
techniques to link the various factors and to illuminate differences among
countries. We then discuss the impact of the reforms on growth, again
6. Fernández Arias and Montiel (1997).
7. ECLAC (1996) is an example of the former, Lora and Barrera (1997) of the latter.
8. Lora and Barrera (1997).
9. Rodrik (1999, p.15). De Gregorio and Lee (1999) argue that the importance of investment
declines as a determinant of growth when other variables are added to the equation. When those
variables are not included, investment incorporates their effect, and the coefficient for investment is
larger.
10. Of course, these issues are complicated since there is a reverse causation between growth and
investment, via the accelerator relation.

75
I N V E S T M E N T, P RO D U C T I V I T Y, A N D G ROW T H
presenting econometric evidence. A final empirical section returns to the
issue of exports and their contribution to growth. The conclusions empha-
size what can and cannot be learned at the aggregate level, establishing the
basis for the subsequent analysis of sectors and types of agents.
Long-term Trends in Investment and Productivity
Investment and productivity in the post-reform period need to be seen
in the long-term perspective of the behavior of these variables during the
postwar period as a whole. A very simple representation of these trends is
depicted in table 4-1, which shows four benchmark years: 1950 (the begin-
ning of the period), 1980 (at or near the peak of investment resulting from
the ISI model), 1990 (at or near the trough following the debt crisis), and
1998 (the latest available year).
11
A clear pattern emerges from the table, as reflected in both the simple
averages and the majority of the individual countries. Investment as a share
of GDP rose significantly in the three decades between 1950 and 1980,
from 16 to 21 percent (an average annual increase of 1 percent). That im-
provement in investment performance was practically wiped out by the
crisis of the 1980s, during which time the average investment coefficient
fell back to only 17 percent (an average annual drop of 2.2 percent during
the decade). Half the countries (Argentina, Brazil, Colombia, and Peru)
had lower investment coefficients in 1990 than they had had in 1950.
Between 1990 and 1998, however, the average investment coefficient rose
by 3.8 percent a year, to 23 percent, more than recovering its 1980 peak.
12
By 1998, Bolivia and Chile were far above their previous highs. Mexico, in
contrast, was still substantially below its 1980 level, while Brazil was below
its 1950 level. The explanations for these different outcomes are quite com-
plex; no single factor can account for them.
13
The data on investment raise two main questions: is the investment
sustainable, and is it sufficient? The issue of sustainability, in turn, involves
11. Due to lack of information, Jamaica could not be included in most of the analysis in this
chapter.
12. Note that this result—investment at a new peak—is based on simple averages. Data based on
weighted averages show investment still below previous peaks because of the poor performance of
Mexico and especially Brazil, which account for a very large share of any weighted average for Latin
America and the Caribbean.
13. As would be expected, public sector investment fell as a share of GDP in most countries during
the 1970–98 period, while private sector investment rose. See Moguillansky and Bielschowsky (2000,
appendix A-6).

76
I N V E S T M E N T, P RO D U C T I V I T Y, A N D G ROW T H
two subpoints. First, we need to know if investment rates will remain at
their current levels or if they will rise or fall in the coming years. As ex-
plained in the next section, the answer is that we still cannot predict. With
the single exception of Chile, the reforms and other new features of the
regional economies are not yet consolidated. They still depend on both
positive and negative transitory factors that derive from the vast changes
the economies have undergone. Future results will depend on whether gov-
ernments and the private actors in the various countries can work together
so as to adequately balance the risk and return factors that stimulate invest-
ment. In practice, this implies finding ways—within the new rules of the
game—to compensate for the absence of the old incentives that firms re-
ceived during the import substitution period.
Second, sustainability also depends on how investment is being fi-
nanced. The relative contribution of national versus external savings is par-
ticularly important. Figure 4-1 provides a set of indicators on the relation
between savings and investment in the project countries.
14
Little external
savings occurred during the 1980s; investment had to be financed by na-
Table 4-1. Gross Fixed Investment as a Share of GDP, 1950–98
a
Percent
Country
1950198019901998
Argentina
15.5
25.1
12.5
23.5
Bolivia
9.1
14.2
13.9
26.5
Brazil
18.8
23.6
15.5
16.9
Chile
19.1
18.6
21.6
28.9
Colombia
16.0
16.8
14.0
15.4
Costa Rica
16.0
23.9
23.1
26.6
Mexico
14.8
24.8
18.4
20.8
Peru
18.3
23.5
17.5
25.2
Simple average
16.0
21.3
17.1
23.0
Source: Project database.
a. Based on constant 1980 dollars.
14. The data in figure 4-1 are not totally comparable with others in the book since they are based
on total investment (including inventory movements), while elsewhere we work with fixed invest-
ment. Another difference is in base years for constant dollar calculations (1995 in figure 4-1, com-
pared to 1980 for the rest of the book).
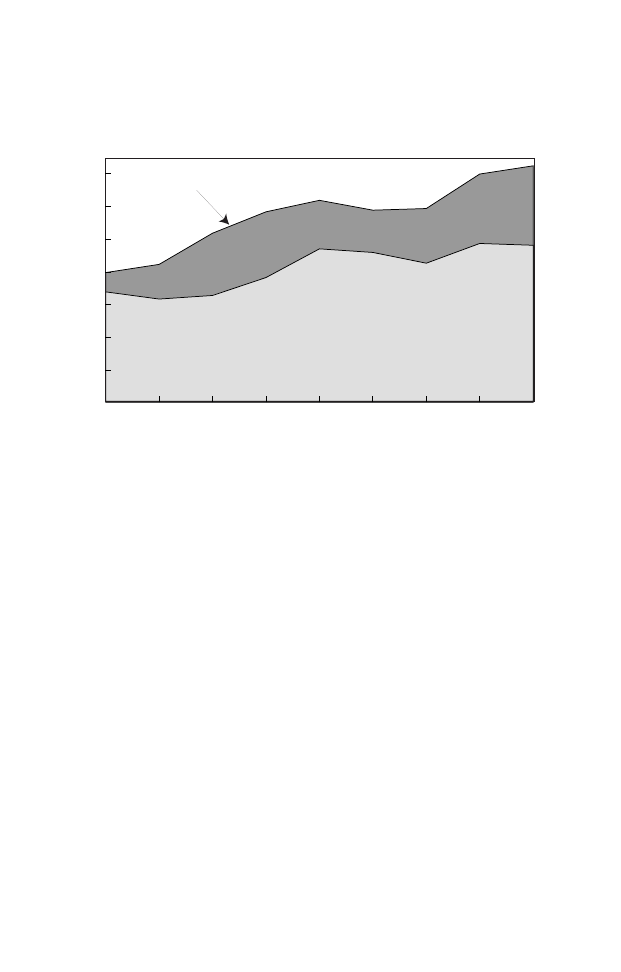
77
I N V E S T M E N T, P RO D U C T I V I T Y, A N D G ROW T H
tional savings. In the 1990s, the return of foreign capital flows changed
that pattern substantially. By 1998, external savings had risen to account
for over 5 percent of GDP, compared to nearly 19 percent for national
savings. The 5 percent figure for foreign savings, which is the same as the
current account deficit, is about the limit of what investors seem willing to
finance, even in a period of substantial liquidity. Higher national savings
would be advisable, but at the same time there are serious doubts about
whether policies to stimulate savings are effective (as opposed to savings
increasing as a function of higher growth).
As to whether investment has been sufficient, the answer depends in
the first instance on the growth rate that has been adopted as a target.
Several years ago, ECLAC suggested that a 6 percent growth rate is needed
to tackle the social issues pending in the region (poverty, unemployment,
and others).
15
There seemed to be substantial agreement around a figure of
this magnitude. The next step was to estimate the investment coefficient
Figure 4-1. Investment and Its Financing, 1990–98
a
Percent of GDP in 1995 dollars
1990
1993
1994
1995
Source: Project database.
a. Based on simple averages for eight project countries (excluding Jamaica).
1991
1992
12
14
16
18
20
22
24
1996
1997
1998
Gross investment
External savings
National savings
15. ECLAC (1996).

78
I N V E S T M E N T, P RO D U C T I V I T Y, A N D G ROW T H
needed to achieve this rate of growth. Here, more controversy arose. Based
on capital-output ratios for a number of countries, the hypothesized in-
vestment rate of 28 percent of GDP (in 1980 dollars, but with the struc-
tural characteristics of the 1990s) was put forward. This is nearly five
percentage points higher than the simple average shown in table 4-1 for
1998, which suggests that more investment is indeed needed.
16
The invest-
ment analyses for this project come to similar conclusions, based on stud-
ies of individual countries and sectors.
17
Comparisons with other regions
also indicate that Latin America needs higher investment, even if there is
disagreement on the precise numbers.
18
Trends in labor productivity levels are similar to those for investment.
A large increase in productivity occurred between 1950 and 1980 (an an-
nual average increase of 2.8 percent), a decline in the 1980s (1.2 percent,
on average), and a recovery to previous peak levels by 1998 (2.0 percent
annual growth in the 1990s). Nonetheless, only Argentina, Chile, and
Colombia had productivity levels in 1998 above those of 1980; Bolivia
and Peru fell particularly far behind in this period (see table 4-2).
The general view in the literature, which is reinforced by our case stud-
ies, is that productivity trends are closely linked to investment. Greater
Table 4-2. GDP per Worker, 1950–98
Thousands of 1980 dollars
Country
1950198019901998
Argentina
6.9
14.1
10.6
15.2
Bolivia
3.2
5.3
4.2
4.4
Brazil
3.1
9.5
8.5
8.6
Chile
5.9
10.9
11.1
16.1
Colombia
4.0
8.1
8.9
10.0
Costa Rica
3.7
9.2
8.2
8.8
Mexico
5.8
17.0
16.0
16.1
Peru
3.9
8.4
5.5
6.2
Simple average
4.6
10.3
9.1
10.7
Source: Project database.
16. ECLAC (1996, pp. 51-59).
17. See Moguillansky and Bielschowsky (2000).
18. See Stallings (1995) for a comparison of investment rates and other aspects of the development
process in Latin America, East Asia, Southeast Asia, and Sub-Saharan Africa.
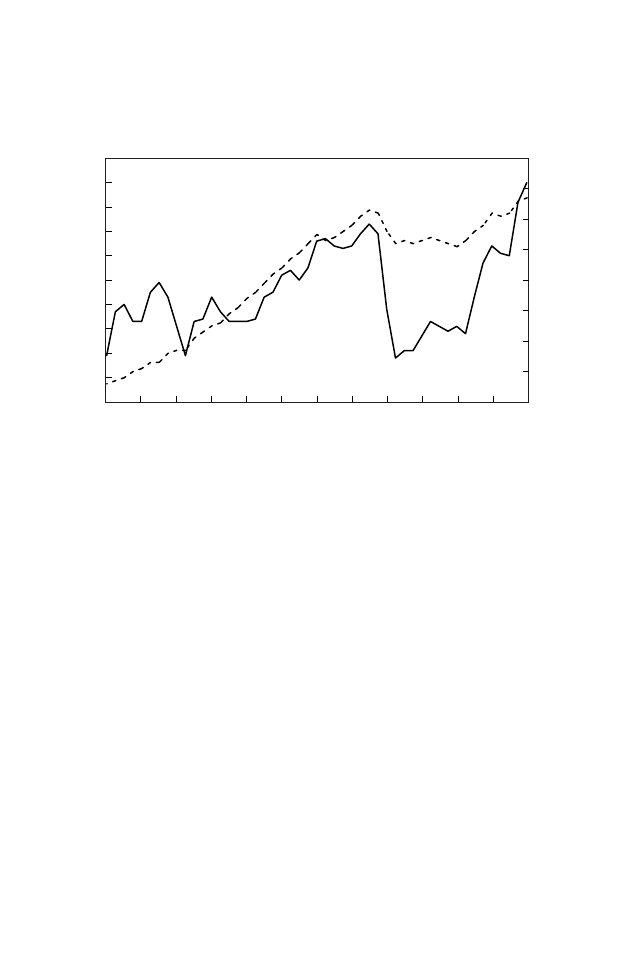
79
I N V E S T M E N T, P RO D U C T I V I T Y, A N D G ROW T H
amounts of capital per worker should therefore result in increased output
per worker. Figure 4-2 illustrates the link for the simple averages of invest-
ment and labor productivity among the project countries. As expected, the
two have similar trajectories, although productivity falls much less than
investment during the 1980s.
Of course, investment is not the only factor that affects productivity.
Higher rates of education are among the most important determinants of
productivity, as will be seen later in the chapter. Other factors that have
been found to be important determinants of labor productivity include the
age and health of the labor force, management and organizational arrange-
ments in the firm, technological advances, and public sector activities such
as training and support for research and development.
19
In one of the project volumes, Katz argues that it is necessary to take
into account macroeconomic conditions (especially interest and exchange
Figure 4-2. Investment and Labor Productivity Trends, 1950–98
a
Percent
1954
1970 1974
Source: Project database.
a. Based on simple averages for eight project countries (excluding Jamaica).
1958 1962
GDP per worker
Investment as share of GDP
Thousands of 1980 dollars
15
16
17
18
19
20
21
22
23
5
6
7
8
9
10
11
1966
1978
1994
1982 1986 1990
19. Recent theory on endogenous growth stresses that human capital is a complement to physical
capital, as is organizational improvement or disembodied technical progress. For a summary of this
literature, see Aghion and Howitt (1998).

80
I N V E S T M E N T, P RO D U C T I V I T Y, A N D G ROW T H
rates), sectoral factors (namely, the market structure, the regulatory frame-
work, and institutions), and firm level variables (particularly the accumu-
lation of technological capabilities, organizational models, and
entrepreneurial strategies) to understand trends in labor productivity. The
incorporation of technological change depends on the interaction of firms,
governments, research centers, and financial institutions, which together
constitute the so-called national innovation systems. Katz argues that in-
novation systems in Latin America underwent two important changes after
the reforms. The reduction of state involvement in technological efforts
resulted in an increased privatization of the determinants of technological
progress. In addition, foreign presence increased dramatically through the
substitution of domestic by foreign inputs and a larger presence of
transnational corporations (TNCs) in the production structure.
20
Overall, in the 1990–98 period, when the effects of the reform process
began to be felt in Latin America and the Caribbean, investment and pro-
ductivity improved somewhat, but this mainly represented a recovery from
the losses suffered during the debt crisis. Chile was an important excep-
tion, doing well on both indicators. Most other countries improved on one
or the other. The two largest countries in the region, Brazil and Mexico,
face serious challenges on both; their ability to raise investment and pro-
ductivity rates will have a significant impact throughout the region.
Post-Reform Phases of Investment and Technological Change
Analyzing the reforms’ impact on investment and productivity is a
complex task because many things were happening simultaneously. In ad-
dition, the reforms themselves had different effects over time. The project
studies of individual country experiences suggest the need to distinguish a
transitional period from a consolidated one in order to understand the
potential impact of the reforms. Given the timing of the initiation of the
reforms, almost all of the project countries are still in the transition period.
Extrapolating on the basis of what has occurred up till now could result in
quite misleading conclusions. Recognizing the various phases enables us at
least to speculate on the more permanent aspects in light of what we are
able to measure of past trends.
21
20. Katz (2000, chapter 6).
21. The idea of investment phases is developed in Moguillansky and Bielschowsky (2000, chap-
ter 1); see this source for further detail.

81
I N V E S T M E N T, P RO D U C T I V I T Y, A N D G ROW T H
At a high level of abstraction, the new environment created by the
reforms and macroeconomic variables can be conceptualized as consisting
of three phases based on the type of factors influencing investment.
22
Dur-
ing the years after the reform process began, positive and negative transi-
tory factors dominated the decisionmaking environment. Only later would
these transitory factors dissipate, leaving actors to make decisions based on
the permanent signals that determine investment in any capitalist society,
such as macroeconomic stability, anticipated demand, relative prices, and
technological upgrading. Such factors are relevant for industrialized coun-
tries as well as Latin America and for any point in time. During the transi-
tion period between the destruction of the old economic model and the
consolidation of the new one, the transitory factors operate alongside the
permanent ones, such that the three phases are not mutually exclusive.
Even so, we can identify a first phase that is dominated by negative transi-
tory factors. These are replaced by positive transitory factors in the second
phase and by permanent factors in the third phase, when the transition is
complete and the new model is consolidated.
The negative transitory factors that dominated the initial post-reform
phase tended to depress investment. Economic actors were very cautious
because the immediate post-reform period was characterized by singular
uncertainty. Most of the rules of the game had changed, and the governments
that had made those changes still lacked credibility in the eyes of potential
investors; it was unclear whether the reforms would be continued. Relative
prices were also changing rapidly, while domestic and especially interna-
tional competition was becoming much more relevant than before. The
uncertainty caused by the initiation of the reform process itself was greatly
magnified when macroeconomic conditions or international economic trends
were unstable or negative. As described above, this was the case with most
of the project countries. Conditions ranged from hyperinflation at the macro-
economic level to an almost total lack of liquidity on the international side.
Investment in fixed capital was highly unusual under such uncertainty;
firms tended to defer irreversible decisions until the situation became clearer.
They reacted defensively, rationalizing production processes and introduc-
ing disembodied technical change to increase productivity. This typically
involved adopting new management techniques, reducing product mix,
22. On a less abstract level, firms and productive sectors in a given country tend not to be simulta-
neously at the same phase. The level of abstraction of stylized facts permits us to concentrate on traits
that are key to the analysis in this chapter.

82
I N V E S T M E N T, P RO D U C T I V I T Y, A N D G ROW T H
increasing the use of imported inputs, dismissing workers, and downsizing.
In the extreme, the new rules and prices sent such strong negative signals
that firms decided to shut down plants that were no longer competitive.
The second phase featured a quite different set of transitory factors
that raised investment above “normal” levels, but these processes set in only
when the initial uncertainty and lack of credibility had been at least par-
tially overcome. These investments tended to be one-time occurrences, be-
cause as soon as the desired target was reached, less investment related to
that target was needed.
The first factor stimulating this type of investment involved the mod-
ernization of equipment to reduce costs. Following the rationalization pro-
cess, but still defensive in orientation, modernizing investment aimed to
raise quality and productivity by replacing old equipment that was sub-
stantially behind international standards. Such investments had a very high
marginal return since they could rehabilitate capital stock that would oth-
erwise have become obsolete. A second factor pertained to the new export
orientation. At least some economies required large new investments to
support a sharp increase in the export coefficient, which derived from new
market opportunities including those from participation in regional inte-
gration schemes. These investments were sometimes earmarked for new
product development, but more typical was the expansion of existing fa-
cilities and upgrading to meet the quality demands of foreign customers.
Strategic repositioning of transnational corporations also led to tem-
porary increases in investment. The reforms opened new possibilities for
TNCs, which had frequently been banned from certain sectors of Latin
American economies. New investment was necessary to take advantage of
new opportunities. In addition, TNCs were less deterred by uncertainty
than were domestic firms, since their new investments represented a much
lower share of their total capital.
23
A final factor involved investment re-
lated to privatizations. While privatizations per se do not provide new in-
vestments, new investments often accompany privatizations, either through
legal obligations (such as those in Bolivia or Peru) or through attempts to
raise productivity in newly acquired firms.
The first post-reform phase thus features abnormally depressed invest-
ment because of the predominance of negative transitory factors, whereas
positive transitory factors are the most significant in the second phase,
23. We are talking here only of new (greenfield) investment or expansion. Purchase of existing firms
would not involve new investment from a national accounts perspective, as opposed to that of an
individual firm.

83
I N V E S T M E N T, P RO D U C T I V I T Y, A N D G ROW T H
causing investment to rise beyond what it would be under normal condi-
tions. The third phase emerges when the transitory factors disappear or
have relatively little weight in comparison to permanent investment incen-
tives. At this point, the transition is complete, and the new model deter-
mines economic performance. Whether the new model will feature higher
investment-to-GDP ratios than the previous one is an empirical question
that cannot be determined before the fact.
The case studies of the project countries find
evidence to support the
existence of the three phases.
24
The reforms were not a homogeneous pro-
cess in the region, in terms of either the moment in which they were initi-
ated or the form in which they were implemented. Chile and Argentina
began the process in the 1970s; the latter reversed course after a few years,
only to return to the reforms with renewed vigor in the 1990s. Bolivia,
Costa Rica, and Mexico began transforming their economies in the second
half of the 1980s, while Peru, Colombia, and Brazil (together with Argen-
tina) did so at the beginning of the 1990s. This timing sequence meant
that the reforms were initiated in the various countries under markedly
different macroeconomic circumstances and in varying international con-
texts. In Colombia and Costa Rica, the reforms were launched in an envi-
ronment of macroeconomic stability, while the remaining countries initiated
reforms in the context of powerful internal and external disequilibria.
The resulting uncertainty strongly influenced investor response to the
reforms. In those countries that initiated the reforms under conditions of
recession, gross fixed investment fell as a percentage of GDP during the
years immediately following the reforms (see table 4-3). Not only were the
coefficients well below the peaks reached during the 1970s and 1980s, they
also tended to be below or at most comparable to the minimum levels
achieved during the earlier decades. Exceptions to this pattern included
Costa Rica, which began its reforms under positive macroeconomic condi-
tions, and Bolivia and Peru, where the previous minimums occurred dur-
ing years of extreme political instability (1983 and 1985, respectively).
Following the period during which investment coefficients declined,
all countries went through a period of more stable macroeconomic condi-
tions (namely, lower inflation and higher growth) and a generally more
favorable international context.
25
These conditions led to rising investment,
24. See Moguillansky and Bielschowsky (2000, chapter 1).
25. The recovery of the investment coefficients occurred within the particular international context
of the 1990s, except in Chile, where the recovery took place during the 1980s (see table 4-4). Three
elements establish the favorable context of the 1990s: greater access to foreign financing, buoyant
external demand, and high export prices.

84
I N V E S T M E N T, P RO D U C T I V I T Y, A N D G ROW T H
at least in part because of the positive transitory factors mentioned earlier:
modernization, exports, privatizations, and TNC strategies. As a result,
investment coefficients rose above their minimums for the 1970s and 1980s,
albeit still below the maximum levels achieved during those decades (see
table 4-4). Only in the second half of the 1990s did the coefficients tend to
reach levels similar to those observed for the pre-reform period.
Our analysis indicates that of the eight countries with investment data
available, only Chile has reached the third phase when the reforms are
consolidated and investment is determined by normal factors. Arguably
such a point was reached in 1990, when the new democratic government
assumed power and proceeded to follow macroeconomic policies that did
not differ significantly from those of its military predecessor, which had
initiated the reform process. The investment coefficient in Chile in the
third phase has been far higher than in its own past as well as higher than in
other countries in the region in the present. The same will not necessarily
characterize a third phase in all of the other countries, nor will such perfor-
mance necessarily continue in Chile.
26
Table 4-3. Investment Coefficients for the Initial Post-Reform Period
Compared to Previous Levels
Percent
Minimums and maximums
Initial post-reform phase
for the pre-reform period (1970–90)
a
Country
Years
Coefficient
Year
Minimum
Year
Maximum
Argentina
1990
12.7
1989
14.7
1977
26.7
Bolivia
1985–89
13.2
1983
9.1
1978
19.9
Brazil
1990–93
14.5
1984
16.3
1975
25.8
Chile
1974–76
14.6
1975
14.9
1970
21.6
Colombia
1990–91
13.5
1989
15.2
1982
17.8
Costa Rica
1986–91
20.5
1982
14.3
1979
26.6
Mexico
1985–90
17.1
1983
16.6
1981
26.5
Peru
1990–92
17.7
1985
16.0
1975
27.6
Source: Adapted from Moguillansky and Bielschowsky (2000), on the basis of project data.
a. Except in the case of Chile, where a lack of information makes it necessary to use the period
1970–75.
26. For an important discussion of the reasons for Chile’s success, see Moguillansky (1999).

85
I N V E S T M E N T, P RO D U C T I V I T Y, A N D G ROW T H
Chile now has twenty-five years of experience with reformed policies,
far longer than any other country. Bolivia, Costa Rica, and Mexico have
been carrying out reforms for about fifteen years, but none has yet entered
the third phase. In Bolivia, the privatizations were begun late in the reform
process, and the resulting investment boom generated by foreign invest-
ment is still being sustained by legal obligations that accompanied the sale
of state firms. Costa Rica has enjoyed a recent surge of investment associ-
ated with the repositioning of transnational firms in the region; this is
driving the investment rate above what would probably be normal levels.
In Mexico, the inconsistency between the reforms and macroeconomic
policies eventually led to a major financial crisis in 1994–95. The resulting
devaluation and accompanying export boom are still providing transitory
incentives for investment. In addition, an inflow of foreign investment has
resulted from the North American Free Trade Agreement (NAFTA). Thus
all three cases need a few more years before investment coefficients stabilize
at their new normal levels.
The remaining four cases—Argentina, Brazil, Colombia, and Peru—
have less than a decade of experience with the reforms, so it is not surpris-
ing that they are still in a transition period. Brazil, in particular, did not
escape hyperinflation until 1994, and other types of macroeconomic insta-
bility, especially a large fiscal deficit, are still creating a situation of substan-
Table 4-4. Investment Coefficients for the Post-Reform Period
Percent
Phase 1
Phase 2
Phase 3
Country
Years
Coefficient
Years
Coefficient
Years
Coefficient
Argentina
1990
12.7
1991–98
20.5
. . .
. . .
Bolivia
1985–89
13.2
1990–98
17.9
. . .
. . .
Brazil
1990–94
14.7
1995–98
16.8
. . .
. . .
Chile I
a
1974–76
14.6
1977–81
16.7
. . .
. . .
Chile II
a
1982–85
14.2
1986–89
18.3
1990–98
25.1
Colombia
1990–91
13.5
1992–98
17.8
. . .
. . .
Costa Rica
1986–91
20.5
1992–98
23.2
. . .
. . .
Mexico
1985–90
17.1
1991–98
b
19.7
. . .
. . .
Peru
1990–92
17.7
1993–98
23.3
. . .
. . .
Source: Moguillansky and Bielschowsky (2000), on the basis of project data.
a. Chile is listed twice to distinguish two reform periods.
b. Does not include 1995.

86
I N V E S T M E N T, P RO D U C T I V I T Y, A N D G ROW T H
tial uncertainty. This was compounded, of course, when the international
financial crisis spilled over into the Brazilian economy and eventually re-
sulted in the January 1999 devaluation.
Beyond the relatively short time period involved, Argentina, Colom-
bia, and Peru have encountered additional problems that conflict with the
consolidation process. Argentina and Peru have been subject to particu-
larly volatile growth patterns. Argentina, with a fixed exchange rate regime,
was highly exposed to changes in international financial flows. Peru suf-
fered from stop-go growth caused by macroeconomic imbalances and ex-
acerbated by climatic phenomena. Reform implementation in Colombia
conflicted with other policy goals, especially decentralization and a large
increase in social spending. The result has been a deviation from Colombia’s
traditional stable economic performance, which has caused great uncer-
tainty in recent years and a reduction in investment.
The Impact of the Reforms on Investment
Investment and productivity trends result from the behavior of rel-
evant actors, who respond to the macroeconomic context, the international
environment, and the enactment of reforms under different degrees of un-
certainty. To better ascertain the significance of these determinants of in-
vestment behavior, we employed an econometric model in which the
dependent variables are gross fixed investment as a percentage of GDP and
investment in machinery and equipment as a percentage of GDP. The in-
dependent variables are the change in output lagged one period (the accel-
erator effect), indicators of macroeconomic instability (in particular, the
change in consumer prices, the variation of the real exchange rate, and the
burden of external debt), the international environment (that is, foreign
direct investment inflows), and the economic reforms.
The results of the econometric analysis are generally consistent with
the expectations arising from the literature on investment as well as the
previous discussion (see table 4-5).
27
The coefficient on lagged output was
positive and significant; its value was notably greater for the regressions
referring to machinery and equipment than for those measuring total in-
vestment. This is consistent with the points made earlier about the negative
27. These results are similar to those achieved by Lora and Barrera (1997). They are also compatible
with those of Fernández Arias and Montiel (1997) and Servén and Solimano (1993). The authors
thank Claudio Pini for carrying out the econometric analysis.

87
I N V E S T M E N T, P RO D U C T I V I T Y, A N D G ROW T H
T
able 4-5.
Deter
minants of I
nvestment Rates
a
Independent
variable
(1)
(2)
(3)
(4
)
(5)
(6)
(7)
(8)
GDP (–1)
1.168
1.831
1.905
1.259
2.993
2.833
2.33
2.859
(4.794)
(7.577)
(6.976)
(5.356)
(9.641)
(11.826)
(9.308)
(12.300)
E
xternal
debt
–0.209
–0.196
–0.194
(–8.293)
(–7.105)
(–4.390)
F
or
eign
dir
ect
inv
estment
0.038
0.017
(3.319)
(0.686)
Inflation
–0.040
–0.051
–0.059
–0.035
–0.070
–0.071
–0.050
–0.070
(–3.745)
(–3.529)
(–3.712)
(–3.308)
(–4.414)
(–4.912)
(–2.955)
(–4.922)
R
eal
ex
change
rate
–0.04
(–2.501)
A
verage
reform
index
0.018
0.265
(0.228)
(2.468)
P
riv
atization
index
0.327
0.533
0.372
0.557
(4.542)
(7.924)
(3.941)
(7.589)
T
rade
reform
index
0.025
0.408
0.219
0.369
(0.360)
(4.166)
(2.296)
(3.862)
Summar
y
statistic
R
2
0.716
0.612
0.595
0.745
0.488
0.520
0.599
0.523
A
djusted
R
2
0.687
0.575
0.561
0.716
0.445
0.474
0.545
0.472
N
u
mber
of
obser
vations
112
128
128
109
128
128
112
125
Sour
ce:
A
uthors
’
regr
essions
based
on
M
oguillansky
and
B
ielscho
wsky
(2000);
t
statistics
ar
e
sho
wn
in
par
entheses.
a.
The dependent v
ariable for equations 1–4 is gross fix
ed inv
estment as a shar
e of GDP
, while for equations 5–8 it is investme
nt in machiner
y and equipment as a shar
e
of
GDP
. The
model
is
a
panel,
using
fix
ed
effects
and
or
dinar
y
least
squar
es
estimation,
for
data
on
eight
countries
(Argentina
, Bolivia,
B
razil,
Chile,
Colombia,
Costa
Rica,
M
exico,
and
Pe
ru)
for
the
period
1979–95.
Independent
variables
ar
e
first
differ
ences
of
the
logs
of
GDP
with
a
one-period
lag
(the
accelerator
relation),
the
logs
of
external
debt
as
a
shar
e
of
GDP
with
a
one-period
lag,
for
eign
dir
ect
inv
estment
as
a
shar
e
of
GDP
,
the
coefficient
of
variation
for
the
consumer
price
index,
the
coefficient
of
variation
for
the
real
ex
change
rate,
and
the
thr
ee-y
ear
av
erage
of
the
reform
index
es
described
in
chapter
3.

88
I N V E S T M E N T, P RO D U C T I V I T Y, A N D G ROW T H
impact of a recessionary macroeconomic context on investment perfor-
mance immediately after the reforms, as well as with the strong recovery in
investment in machinery and equipment that takes place with advances
toward stabilization.
The variation of the real exchange rate, the consumer price index, and
the external debt burden had the anticipated negative effects on invest-
ment, highlighting the importance of uncertainty during the first phase for
encouraging wait-and-see behavior. Foreign direct investment (FDI) had a
positive and significant impact on total investment, although its magni-
tude is small. This makes sense given that even at its high point in 1997–
98, FDI represented on average less than 20 percent of total investment in
the principal recipient countries in the region. Moreover, an important
part of this flow was directed toward the purchase of existing assets, both
through participation in the privatization of public enterprises beginning
in the early 1990s and through private sector mergers and acquisitions.
This was especially true after the crisis of 1995, and it extended even to
Chile following the recession of 1998–99.
The average reform index had a positive impact on both dependent
variables, although it is significant only for equations explaining invest-
ment in machinery and equipment. Among the indices of specific reforms,
that corresponding to privatization was positive and highly significant in
all cases. Trade reform was significant only for investment in machinery
and equipment, as was to be expected given the elevated presence of im-
ports in that sector.
Reforms and Growth
At this time a major problem for any study of the reforms is the rela-
tively short period they have been in effect. As already indicated, Chile is
the single exception, since the reforms there began in the mid-1970s. A
second group of countries implemented reforms in the mid-1980s, while
in the majority of the project countries the reforms date only from around
1990. Since it is unreasonable to expect that the full benefits of the reforms
would appear in the short run, this factor must be taken into account in
interpreting the results. We use two approaches to deal with this problem
of timing. First, we put special emphasis on the 1991–98 period when
examining growth outcomes; this gives the maximum possible time frame
for the impact of the reforms to be manifested. Second, we report on some
econometric results that cover a longer period, 1970–95, since a few coun-
tries undertook some reforms in the 1970s.

89
I N V E S T M E N T, P RO D U C T I V I T Y, A N D G ROW T H
An additional problem of timing emerges from the particular growth
pattern in Latin America in the last two decades, which exhibited minimal
growth in the 1980s followed by a reactivation in the 1990s. This pattern
lends itself to the possible confusion of a period representing recovery from
recession with that of growth per se. We therefore examine the growth
trajectory of each of the project countries and define a post-crisis “growth
period” as beginning when aggregate GDP returned to the peak before the
recession of the 1980s. Table 4-6 shows these periods for each country,
including a base period, a crisis period, a post-crisis recovery period (if
relevant), and a growth period.
28
Table 4-7 uses this periodization to organize the data on behavior of
GDP between 1950 and 1998. The simple average for the nine countries
shows that annual growth in the base period was 5.2 percent, falling to
0.2 percent in the crisis period. The post-crisis period, which is divided
into recovery and growth subperiods, had average annual rates of 5.3 and
4.0 percent, respectively. In other words, GDP expanded somewhat more
slowly on average in the recent growth period than it did in the base
period. A final point of importance concerns the comparison between
the growth period and the 1990s, which was identified earlier as being of
particular interest for our analysis since it represents the most recent re-
sults. The average growth rate for the 1990s at 3.9 percent was slightly
Table 4-6. Periodization of Economic Growth, 1950–98
Post-crisis period
Country
Base period
Crisis period
Recovery
Growth
Argentina
1950–1980
1980–1990
1990–1992
1992–1998
Bolivia
1950–1978
1978–1986
1986–1990
1990–1998
Brazil
1950–1980
1980–1992
. . .
1992–1998
Chile
1950–1970
1970–1984
1984–1987
1987–1998
Colombia
1950–1980
1980–1986
. . .
1986–1998
Costa Rica
1950–1980
1980–1985
. . .
1985–1998
Jamaica
1950–1974
1974–1986
. . .
1986–1998
Mexico
1950–1980
1980–1986
1986–1989
1989–1998
Peru
1950–1980
1980–1990
1990–1994
1994–1998
Source: Hofman (2000), on the basis of project data.
28. For further details, see Hofman (2000).

90
I N V E S T M E N T, P RO D U C T I V I T Y, A N D G ROW T H
lower than the 4.0 percent found during the growth period. Four of the
nine countries saw their growth rates decline slightly in the 1990s with
respect to the growth period as a whole, and Jamaica saw almost no growth
at all in that decade.
These calculations all use simple averages, which give equal weight to
the nine countries. Growth outcomes, however, demonstrate a substantial
difference between the simple and weighted averages. As indicated in table
4-7, the weighted averages show a sharper decline from the base period
with respect to the 1990s, from 6.0 percent to 3.2 percent. The reason
becomes clear on analyzing individual country performance.
The four countries that grew most slowly in the base period (Argen-
tina, Bolivia, Chile, and Peru) were the fastest growing in the 1990s. This
group also grew substantially faster in the 1990s than in its own past (with
the exception of Peru, which grew at about the same rate). On average
among the four, growth in the base period was 4.0 percent, rising to 5.6
Table 4-7. GDP Growth in Selected Periods, 1950–98
a
Percent
Base
Crisis
Post-crisis period
1990s
Country
period
period
Recovery
Growth (1991–98)
High growth
Argentina
3.8
–1.1
10.1
4.5
5.8
Bolivia
3.5
–1.7
3.5
4.3
4.3
Chile
3.9
1.4
5.2
7.6
7.7
Peru
4.9
–1.2
5.1
4.2
4.6
Simple average
4.0
–0.7
6.0
5.2
5.6
Low growth
Brazil
7.0
1.3
. . .
2.4
1.8
Colombia
5.1
2.8
. . .
3.8
3.6
Costa Rica
6.5
0.2
. . .
4.0
4.0
Jamaica
5.5
–1.2
. . .
2.1
0.2
Mexico
6.5
1.0
2.4
3.3
3.1
Simple average
6.1
0.8
. . .
3.1
2.5
Simple average, total
5.2
0.2
5.3
4.0
3.9
Weighted average, total
6.0
0.8
4.9
3.4
3.2
Source: Hofman (2000), on the basis of project data.
a. Average annual compound growth rate.

91
I N V E S T M E N T, P RO D U C T I V I T Y, A N D G ROW T H
percent in the 1990s. The largest increase was found in Chile, where growth
rates nearly doubled.
The remaining five countries (Brazil, Colombia, Costa Rica, Jamaica,
and Mexico) grew more slowly in the 1990s than in the base period and
more slowly in the 1990s than did the other four countries. This group did
especially poorly in the 1990s per se. The simple average growth rate of the
five in the base period was 6.1 percent, compared to 3.1 percent in the
growth period and 2.5 percent in the 1990s. The most dramatic declines in
growth occurred in Brazil, Mexico, and Jamaica; since the first two are the
largest countries in the region, this explains the difference between the
simple and weighted averages shown in table 4-7.
A similar pattern emerges if we use per capita rather than aggregate
growth rates (see table 4-8). Among the nine countries as a group, the
gap between growth in the base period and in the 1990s is smaller in per
capita terms than in aggregate terms, since population growth rates fell
Table 4-8. Per Capita GDP Growth in Selected Periods, 1950–98
a
Percent
Base
Crisis
Post-crisis period
1990s
Country
period
period
Recovery
Growth (1991–98)
High growth
Argentina
2.1
–2.6
8.7
3.2
4.6
Bolivia
1.2
–2.9
1.3
2.1
1.8
Chile
1.6
–0.2
3.5
5.4
6.1
Peru
2.1
–2.7
3.3
2.4
2.8
Simple average
1.8
–2.1
4.2
3.3
3.8
Low growth
Brazil
4.1
–0.7
. . .
0.8
0.1
Colombia
2.3
1.3
. . .
2.0
1.9
Costa Rica
3.1
–2.6
. . .
1.4
1.4
Jamaica
2.4
–1.5
. . .
1.4
–1.0
Mexico
3.5
–2.0
0.4
1.7
1.2
Simple average
3.1
–1.1
. . .
1.5
0.7
Simple average, total
2.5
–1.5
3.4
2.3
2.1
Weighted average, total
3.2
–1.3
3.1
1.7
1.5
Source: Hofman (2000), on the basis of project data.
a. Average annual compound growth rate.

92
I N V E S T M E N T, P RO D U C T I V I T Y, A N D G ROW T H
during the postwar decades. At the country level, the main difference is
with respect to Peru. While Peru was a high-growth country in compari-
son with others in the 1990s, it nevertheless grew a bit slower in the
1990s in aggregate terms than it did in the base period; in per capita
terms, in contrast, growth increased in the 1990s over the base period.
Note also that while the high- and low-growth countries do not overlap
in the 1990s with respect to aggregate growth rates, in per capita growth
Colombia (in the slow-growth group at the aggregate level) slightly ex-
ceeded Bolivia (in the high-growth group).
Accounting for Differences in Growth
Growth among the nine countries as a whole thus fell between the base
period and the 1990s, although two subgroups demonstrated contrasting
behavior. The reasons for these trends can first be approximated through a
growth-accounting framework, which divides overall growth into three
components: labor accumulation, capital accumulation, and total factor
productivity.
29
Table 4-9 shows the trends with respect to factor accumulation for all
countries except Jamaica. The group of eight countries as a whole increased
labor input between the base period and the 1990s. Since hours worked fell
in most countries, this increase implies a larger number of persons work-
ing. Capital accumulation, in contrast, fell sharply between the base period
and the later years.
The two subgroups displayed diverging tendencies. For the group of
faster-growing countries, the growth rate of labor input more than doubled,
rising from 1.2 percent in the base period to 2.7 percent in the 1990s.
Argentina’s contribution to this result, however, was minimal. In the slower-
growing countries, the rate actually fell from 2.7 percent to 2.4 percent, as
a result of decreases in Colombia and especially Brazil. The next chapter on
employment uncovers a similar pattern: employment problems in the re-
gion were especially severe in Argentina, Brazil, and Colombia, where em-
ployment creation was slow throughout the 1990s.
Capital accumulation experienced a relatively small decline in the fast-
29. The growth-accounting framework is controversial and not completely consistent with other
types of analysis used in the volume. Among the problems that should be kept in mind are the
following: (1) the framework assumes a steady-state economy; (2) the residual (total factor productiv-
ity) captures much more than productivity; and (3) there are serious measurement problems involved.
On measurement problems, see Griliches (1998).

93
I N V E S T M E N T, P RO D U C T I V I T Y, A N D G ROW T H
growing countries, from 4.2 percent to 3.9 percent; the large declines in
Argentina and Peru were partially offset by increases in Bolivia and espe-
cially Chile. In the slow-growth group, the fall was much more dramatic,
from 7.2 to 3.4 percent, with three of the four countries suffering substan-
tial declines.
30
Despite these different tendencies with respect to the past,
the two groups had similar growth rates for both labor input and capital
accumulation in the 1990s. The variation within groups was much higher
than the variation between groups. This suggests that other variables must
explain much of the difference in GDP growth rates in the 1990s.
Labor input in table 4-9 is measured simply by the number of hours
worked. It would be useful, however, to be able to adjust these figures to
reflect changes in the quality of labor input. Fortunately, researchers have
30. These results may appear to be inconsistent with the previous discussion of the investment
coefficient; it has to do with the way capital stock is calculated, as explained below.
Table 4-9. Factor Inputs to Growth, 1950–98
a
Percent
Labor input (hours worked)
Capital accumulation
Post-crisis
Post-crisis
Base
growth
Base
growth
Country
period
period
1991–98
period
period
1991–98
High growth
Argentina
1.2
1.5
1.5
4.9
2.9
2.5
Bolivia
1.0
3.5
3.5
2.8
3.3
3.3
Chile
0.4
2.9
2.8
4.2
6.2
6.8
Peru
2.0
2.9
3.0
5.0
3.7
2.9
Simple average
1.2
2.7
2.7
4.2
4.0
3.9
Low growth
Brazil
2.9
1.4
1.4
9.8
2.7
2.6
Colombia
2.3
2.0
2.0
4.1
3.8
3.8
Costa Rica
2.9
3.4
3.1
7.2
4.4
4.6
Mexico
2.6
3.0
3.1
7.7
2.4
2.4
Simple average
2.7
2.5
2.4
7.2
3.3
3.4
Simple average, total
1.9
2.6
2.6
5.7
3.7
3.6
Source: Hofman (2000), on the basis of project data.
a. Average annual compound growth rate.

94
I N V E S T M E N T, P RO D U C T I V I T Y, A N D G ROW T H
devoted considerable attention to this topic. The most important compo-
nent of quality, considered to have a direct effect on productivity, is the
level of education and its rate of change. An individual’s level of education
affects the type of work he or she can do and the efficiency with which the
work is performed. The number of years of formal education of the popu-
lation between 15 and 64 years of age is the main indicator available for
measuring quality change. Differences between this and better measures
are probably small at the primary and secondary level, if not the tertiary
level.
31
In most Latin American countries, the education systems have under-
gone noteworthy expansion in recent decades. They still display shortcom-
ings, however, in the quality of their results, their degree of adaptation to
the requirements of the economic and social environment, and the extent
to which they are accessible to different strata of society.
32
In the case of the
project countries, average years of education rose from six and a half to ten
years between the base period and the 1990s. Despite all the differences
between the fast- and slow-growing countries, the average education level
for the two groups was virtually identical throughout the 1950–98 period
although there are significant differences between individual countries.
33
To measure capital stock, we use the generally accepted perpetual in-
ventory model.
34
This methodology disaggregates capital stock into several
types with different service lives: machinery and equipment (15 years),
nonresidential construction (40 years), and dwellings (50 years). In any
given year, investment adds to capital stock, while some stock is withdrawn
in the accounting sense due to the end of its useful life as defined above,
even though it may continue to be used in practice.
35
31. The preferred measure would be level of education of the labor force rather than the population
as a whole. In addition, neither the educational level of the population as a whole nor that of the labor
force takes into account the important element of on-the-job training.
32. ECLAC/UNESCO (1992).
33. Data in equivalent years of education. For more detail, see Hofman (2000).
34. On the methodology, see Goldsmith (1951). Among the problems with this measure are that it
takes no account of whether these assets are actually in use at any particular moment. The reform
process presents an additional problem: much of the existing stock of capital may become obsolete as
trade liberalization brings access to the latest international technology. These quality issues cannot be
captured in this methodology.
35. This implies that two countries with the same amount of new investment in a given year may
have quite different accumulation rates. The one with the more rapid accumulation in the past will
have a lower rate of accumulation in the present, since more stock will be withdrawn from use.

95
I N V E S T M E N T, P RO D U C T I V I T Y, A N D G ROW T H
An important aspect of physical investment is that it embodies techni-
cal progress in the form of quality improvements in successive vintages of
capital. The quality effect of physical investment comes from three sources:
embodied technical progress, change in the average age of capital stock,
and change in its composition. With respect to composition, the most
important aspect is the relative weight of machinery and equipment com-
pared to residential and nonresidential construction. Among the eight coun-
tries, this component increased in Argentina, Chile, Colombia, Costa Rica,
and Mexico, while it fell in Brazil and Peru and remained about constant in
Bolivia. In absolute terms, Brazil and Peru had the lowest share of machin-
ery and equipment, with 33 and 21 percent, respectively, in comparison
with an average for the eight countries of 42 percent.
36
The average age of capital stock showed mixed trends. For nonresiden-
tial construction, age declined in all cases between 1950 and 1980, but it
increased or stayed constant during the 1980s and continued to increase in
all cases except Chile and Bolivia in the 1990s. Machinery and equipment
followed similar trends until 1990, when average age began to fall in all
eight countries.
Technical progress and the resulting productivity were very unevenly
distributed. Indeed, it is with respect to productivity that we can begin to
distinguish between the high- and low-growth countries in the 1990s
rather than only with respect to their own past performance. Factor in-
puts grew at fairly similar rates when compared across the two groups;
education levels were also nearly identical. As table 4-10 shows, however,
productivity trends for labor and capital increased at very different rates.
Labor productivity among the faster-growing group rose by four times
the rate found among the slower-growing set (2.9 percent in comparison
to 0.7 percent). With respect to productivity of capital stock, the fast-
growing countries had an average rate of increase of 1.6 percent, while
the others fell slightly.
These results are summarized in the data for total factor productiv-
ity, which report a figure for productivity of all factors combined as well
Likewise, capital stock growth trends could be quite different from, and perhaps even have a different
sign than, those for investment. (The differences in project countries with respect to investment and
capital stock over the 1950–98 period can be observed by comparing tables 4-1 and 4-9.)
36. Hofman (2000).

96
I N V E S T M E N T, P RO D U C T I V I T Y, A N D G ROW T H
as other residual elements not captured in the analysis. Table 4-11 shows
data for two measures: total factor productivity and doubly-augmented
total factor productivity. The latter takes into account quality improve-
ments in both labor and capital as well as their quantitative changes. We
find the same pattern as for labor and capital productivity. The fast-grow-
ing countries increased their productivity between the base period and
the 1990s, going from 1.9 percent to 2.8 percent on the basic measure
and from 0.9 to 1.9 percent with respect to augmented productivity. (Bo-
livia was an exception to the trend, as the productivity growth rate fell.)
The slower-growing countries, in contrast, saw the basic measure decline
from 2.3 to 0.7 percent and the augmented measure fell from 1.1 percent
to –0.4 percent. These tendencies were repeated in each of the individual
countries.
Table 4-10. Growth of Labor and Capital Productivity, 1950–98
a
Percent
Labor productivity
(hours worked)
Capital productivity
Post-crisis
Post-crisis
Base
growth
Base
growth
Country
period
period
1991–98
period
period
1991–98
High growth
Argentina
2.5
2.9
4.3
–0.8
1.8
2.7
Bolivia
2.5
0.8
0.8
0.7
1.0
1.0
Chile
3.5
4.6
4.8
–0.3
1.3
0.9
Peru
2.9
1.3
1.6
–0.1
0.5
1.7
Simple average
2.9
2.4
2.9
–0.1
1.2
1.6
Low growth
Brazil
3.9
1.0
0.4
–2.6
–0.3
–0.7
Colombia
2.8
1.8
1.6
0.9
0.0
–0.2
Costa Rica
3.5
0.8
0.9
–0.7
–0.3
–0.6
Mexico
3.8
0.3
0.0
–1.1
0.9
0.7
Simple average
3.5
1.0
0.7
–0.9
0.1
–0.2
Simple average, total
3.2
1.7
1.8
–0.5
0.7
0.7
Source: Hofman (2000), on the basis of project data.
a. Average annual compound growth rate.

97
I N V E S T M E N T, P RO D U C T I V I T Y, A N D G ROW T H
To summarize the relative contributions to growth rates of labor accu-
mulation, capital accumulation, and productivity, three of the four fast-
growing countries (Argentina, Chile, and Peru) saw the main contribution
from increased productivity, while all of the other countries relied more
heavily on factor accumulation (see table 4-12). Insofar as productivity is a
crucial determinant of a country’s ability to compete in the world economy,
this would suggest that the group of countries that grew fastest in the
1990s—largely on the basis of higher productivity—will enjoy additional
advantages in the future.
37
Table 4-11. Growth of Total Factor Productivity, 1950–98
a
Percent
Doubly augmented
Total factor productivity
total factor productivity
Post-crisis
Post-crisis
Base
growth
Base
growth
Country
period
period
1991–98
period
period
1991–98
High growth
Argentina
1.5
2.4
4.0
0.6
1.6
3.2
Bolivia
2.0
1.2
1.2
0.9
0.0
0.0
Chile
2.0
3.9
3.9
1.2
2.8
2.8
Peru
1.9
1.3
2.0
0.9
0.8
1.5
Simple average
1.9
2.2
2.8
0.9
1.3
1.9
Low growth
Brazil
2.6
0.7
0.1
1.4
–0.3
–0.7
Colombia
2.4
1.2
1.1
1.4
–0.1
–0.3
Costa Rica
2.2
0.6
0.7
1.2
–0.4
–0.3
Mexico
1.8
0.9
0.7
0.5
0.0
–0.3
Simple average
2.3
0.9
0.6
1.1
–0.2
–0.4
Simple average, total
2.1
1.6
1.7
1.0
0.6
0.8
Source: Hofman (2000), on the basis of project data.
a. Average annual compound growth rate.
37. An important debate on the relative merits of growth through factor accumulation or produc-
tivity began shortly before the Asian crisis broke out. See Krugman (1994) and responses (Gibney and
others, 1995; Rostow, 1995).

98
I N V E S T M E N T, P RO D U C T I V I T Y, A N D G ROW T H
T
able 4-12.
Contributions to GDP G
ro
wth, 1950
–
98
Pe
rcent
B
ase
period
P
ost-crisis
gr
owth
period
1991–98
Countr
y
Labor
C
apital
TFP
a
Labor
C
apital
TFP
a
Labor
C
apital
TFP
a
H
igh
gro
wth
Argentina
1
8
4
3
3
9
2
4
3
0
4
5
9
2
3
6
8
Bolivia
1
9
2
4
5
7
4
9
2
3
2
8
4
9
2
3
2
8
Chile
7
4
1
5
2
2
1
2
7
5
1
2
1
2
9
5
1
Pe
ru
23
38
39
40
28
32
37
20
42
Simple
average
1
7
3
7
4
6
3
4
2
7
3
9
2
9
2
4
4
7
Lo
w
gr
owth
B
razil
3
1
3
2
3
7
3
5
3
6
2
9
4
7
4
5
8
Colombia
2
4
2
9
4
7
2
6
4
1
3
2
2
7
4
3
2
9
Costa
Rica
2
5
4
1
3
4
5
6
3
1
1
3
4
4
3
8
1
8
M
exico
1
9
5
3
2
8
3
2
3
9
2
9
3
5
4
2
2
2
Simple
average
2
5
3
9
3
6
3
7
3
7
2
6
3
8
4
2
2
0
Simple
av
erage,
total
2
1
3
8
4
1
3
6
3
2
3
2
3
4
3
3
3
3
Source:
H
ofman
(2000),
on
the
basis
of
pr
oject
data.
a.
T
otal
factor
pr
oductivity
.

99
I N V E S T M E N T, P RO D U C T I V I T Y, A N D G ROW T H
The Impact of the Reforms on Growth
The four countries identified as aggressive reformers in chapter 3 were
the same ones that grew most rapidly in the 1990s; the cautious reformers,
in contrast, grew more slowly. On the surface, this relation appears to pro-
vide evidence that more reforms lead to higher growth, but the situation is
actually much more complicated. The reforms worked together with mac-
roeconomic and international trends. The elimination of hyperinflation,
in particular, had a very positive impact on growth. In addition, the aggres-
sive reformers chose to undertake many reforms in a very short time period
because they were in such dire straits with respect to hyperinflation and
negative growth in the preceding years; their economies were much more
distorted than others and this was often accompanied by problems of
governability. Not surprisingly, the change in policy orientation led to new
investment and an acceleration of growth rates, after a period in which
economic actors waited to see if the new policies would be continued.
Initially, of course, this expansion was only recovery from the previous
recession, but it eventually became growth per se. This can be thought of as
a type of regression to the mean trajectory, though with respect to rates
rather than levels. One of the mechanisms bringing about the increase in
growth has to do with potential investments (and therefore productivity
increases) that were not undertaken in those countries with poor initial
conditions. Once the changes were carried out, and assuming the other
factors were also favorable, the potential for especially high growth rates
was present for some period of time.
38
The group of countries that had been doing reasonably well in the pre-
reform period had less reason to undertake major structural changes in
their economies. Although they did implement gradual and selective re-
forms, they got a smaller boost from them because of the lack of a reservoir
of unexploited opportunities. These countries also encountered serious mac-
roeconomic problems that had a negative effect on growth rates. Mexico
and Brazil already had high inflation rates at the beginning of the reform
period. The type of stabilization policies they followed, which relied on an
overvalued exchange rate, eventually resulted in foreign exchange crises.
Colombia, Costa Rica, and Jamaica also began to suffer macroeconomic
disequilibria during the 1990s. The causes were sui generis: a desire to ex-
38. Note the parallel situation with respect to the phases of investment; of course, the two are
related insofar as investment is an important determinant of growth rates.

100
I N V E S T M E N T, P RO D U C T I V I T Y, A N D G ROW T H
pand social spending in Colombia at the same time that a substantial share
of central government revenues had been decentralized to the regions; the
failure of an important bank in Costa Rica; and a one-time hike in the
inflation rate in Jamaica, caused by the delayed effects of a monetary and
credit expansion in the late 1980s. In the cases of Colombia and Jamaica,
overvaluation of the exchange rate was also a significant factor.
In addition to these qualitative links between reforms and growth, sev-
eral econometric exercises provide further insights into the relation between
the two variables (see table 4-13). The results are closely related to those
Table 4-13. Determinants of Per Capita GDP Growth
a
Independent variable
(1)
(2)
(3)
(4)
Investment coefficient
0.179
0.181
0.178
0.186
(11.103)
(11.102)
(11.114)
(11.508)
International activity level
0.040
0.050
0.040
0.038
(3.528)
(3.604)
(3.600)
(3.420)
Exchange rate variation
–0.049
–0.050
–0.043
–0.049
(–5.841)
(–5.981)
(–5.280)
(–5.993)
Crisis dummy
–0.018
–0.018
–0.020
–0.018
(–4.209)
(–4.093)
(–4.636)
(–4.046)
Average reform index
0.034
(2.121)
Trade reform index
0.027
(1.667)
Capital account index
0.056
(3.486)
Privatization index
0.052
(2.437)
Summary statistic
R
2
0.60
0.60
0.61
0.59
Adjusted R
2
0.57
0.57
0.58
0.56
Number of observations
198
198
198
198
Source: Authors’ regressions; t statistics are shown in parentheses.
a. The dependent variable is the first difference of the logs of per capita GDP. The model is a panel,
using fixed effects and ordinary least squares estimation, with data on nine countries (Argentina,
Bolivia, Brazil, Chile, Colombia, Costa Rica, Jamaica, Mexico, and Peru) for the period 1970–95.
Independent variables are the first difference of the logs of investment as a share of GDP, first differ-
ence of the logs of exports to developed countries, the coefficient of variation of monthly movements
of the exchange rate, a dummy whose value is 1 during crisis periods (varying by country), and the
average level for the previous five years of the reform indexes described in chapter 3.

101
I N V E S T M E N T, P RO D U C T I V I T Y, A N D G ROW T H
discussed earlier with respect to the model to explain investment perfor-
mance. Both sets of equations are based on short-run models that test the
impact of the reform indexes (plus other variables) on the annual change in
investment or GDP. In the case of the growth equations, the dependent
variable was change in GDP per capita between 1970 and 1995. Indepen-
dent variables included investment, a variable representing the international
environment, a volatility measure, a dummy for crisis years during the
period, and the reform indexes.
39
Investment always has a positive and significant effect on growth. This
is clearly consistent with the growth-accounting analysis, in which invest-
ment is one of the key determinants of growth. Nonetheless, investment
becomes less important with the addition of other variables into the analy-
sis, since the latter may work through their impact on investment. Invest-
ment also has a different impact on growth in different sectors, as will be
seen in chapter 6.
To measure the impact of the international environment, the growth
rate of exports from developing countries to member countries of the Or-
ganization for Economic Cooperation and Development (OECD) is used
as a proxy of the international activity level. This is meant to reflect the
expansionary or contractionary stance of the world economy, which our
analysis suggests would play an important part in determining growth pat-
terns. As expected, the coefficient is positive and significant.
To test for the expected negative effect on growth of macroeconomic
instability, two variables were tried: the annual inflation rate and the coef-
ficient of variation of the monthly levels of the real exchange rate. Coeffi-
cients on both were negative and significant, but the latter led to a better fit
of the model so only this variable is reported in table 4-13. These results are
consistent not only with the extensive literature on the determinants of
growth, but also with the discussion earlier in the chapter on the negative
impact of macroeconomic instability on investors.
A dummy was used to capture the effect of the worst crisis years in the
period, where the years vary by country. Its coefficient was negative and
significant, suggesting that these particular years had relevance beyond that
captured in the other variables.
The reform indexes, including both the aggregate index and several of
the individual ones, had a positive and significant effect on growth. The
coefficients suggest that an increase of 10 percent in the average reform
39. The authors want to thank Lucas Navarro for his role in carrying out the econometric analysis.

102
I N V E S T M E N T, P RO D U C T I V I T Y, A N D G ROW T H
index would produce an increase of about 0.2 percent in GDP growth
rates. This result is based on the long-run impact of the reforms. That is,
the reform variable in table 4-13 is the five-year average of the reform in-
dex. Regressions using the current-year value, the three-year average, and
the five-year average found an increasingly positive impact with larger co-
efficients and higher significance levels. Only the five-year average was sig-
nificant at the 5 percent level. While the impact appears to be small, this
depends on the pre-existing growth rate; the lower the rate, the more im-
portant the reform-generated increment. This point relates back to the ag-
gressive versus cautious reform categories presented in chapter 3. Specifically,
for the aggressive reformers with their low or negative growth rates in the
period leading up to the reforms, the increment is more significant than
for the cautious reformers with higher base rates.
The individual indexes that proved to be significant included import
liberalization, privatization, and the opening of the capital account. Nei-
ther the tax nor financial reform indexes were significant. These results
with respect to the reforms are similar to those found in the regressions
with investment, except that the capital account index was not significant
for explaining the latter.
40
Growth and the External Sector
A final topic of importance to the reform-growth process has to do
with changes in the relation between growth and the international economy
as a result of the reforms. The expectation was that post-reform growth
would be more export oriented, even if not necessarily export led. A greater
emphasis on exports, together with more efficient import substitution,
would produce a trade surplus or a lower trade deficit. This section inves-
tigates the role played by exports in the new economic model and examines
changes in imports as well. The data provide the basis for evaluating the
impact on the trade balance, which is a key aspect of the sustainability of
the new economic model. A trade deficit, in turn, must be financed by
external savings.
40. Since the model employed concentrated on the short-term links between growth and the vari-
ous explanatory variables, variables normally found in long-run growth equations were not always
relevant. One example is the insignificance of education, which is a stalwart of long-term models. The
results of the model discussed here are usefully compared with those in Escaith and Morley (forth-
coming), which uses the project data to construct a long-term growth model. In this model, for
example, education is highly significant, as are structural characteristics of the economies.

103
I N V E S T M E N T, P RO D U C T I V I T Y, A N D G ROW T H
The export coefficient has indeed increased in all eight of the project
countries.
41
From 1980 to 1990, using the 1990-based data, the average
export coefficient rose from 14.3 to 19.6 percent. Between 1990 and 1998,
using the 1995-based series, the coefficient increased from 16.7 to 23.5
percent. The 1980s, then, experienced an average increase of 37 percent,
with another 41 percent added in the 1990s. As usual, the averages mask
big differences across countries. Mexico’s coefficient nearly tripled between
1980 and 1998, and Costa Rica’s coefficient nearly doubled, while Chile’s
had already increased significantly in the 1970s. Argentina and Brazil also
saw large increases, although they started from very low initial levels. Even
after the increases, Argentina and Brazil only export about 10 percent of
their GDP, compared with over half in Costa Rica and nearly one-third in
Chile and Mexico (see table 4-14). The trend in the import coefficients was
quite different from that of exports over the same period. The import coef-
ficient declined slightly in 1980–90 and then rose by 68 percent between
1990 and 1998. Import behavior was somewhat more homogeneous among
countries than was the case for exports. Most countries underwent a de-
cline or only a small increase in the 1980s and a large rise in the 1990s.
Whether the export boom in the 1980s and 1990s constituted export-
led growth is a tricky question, since disagreement exists in the literature
on what the term means.
42
In the 1980s, exports in the project countries
grew rapidly, but GDP was practically stagnant. Two factors produced this
results. Export coefficients in all project countries except Chile and Costa
Rica were very low at the beginning of the 1980s. The increase in exports
thus could not have an important impact on growth. In addition, to in-
crease exports countries had to become more competitive, which implied
the substitution of imported inputs for domestic supply, as shown in chapter
6. Moreover, value added in the fast growing maquila exports was usually
below one-fourth of their value. As a result, the value added of exports did
not grow as fast as the export value. Consequently, the net effect on growth
was much smaller than would be expected if domestic content had not
decreased. Exports continued to grow rapidly in the 1990s, becoming more
diversified in both composition and destination, but the question remains
about their contribution to the rest of the economies. One study on Chile
argues that growth was export-led because of positive spillover effects on
41. These data are consistent with those in table 2-1, which show exports growing much faster than
GDP in the last two decades.
42. See discussion of the different definitions in García, Meller, and Repetto (1996).

104
I N V E S T M E N T, P RO D U C T I V I T Y, A N D G ROW T H
T
able 4-14.
Expor
t and I
mpor
t Coefficients, 1980
–
98
a
Pe
rcent
1980
b
1990
b
1990
c
1998
c
Countr
y
E
xport
Impor
t
E
xport
Impor
t
E
xport
Impor
t
E
xport
Impor
t
Argentina
5
.7
9
.7
10.5
4.8
8.8
3.8
11.0
13.9
Bolivia
14.5
15.7
18.7
20.8
19.2
25.0
20.4
32.2
B
razil
5.0
7.9
8.2
6.6
7.1
4.0
8.7
11.5
Chile
24.3
35.5
33.6
30.1
26.6
20.8
33.5
30.1
Colombia
17.4
21.4
21.6
17.5
13.3
8.9
17.5
21.6
Costa
Rica
d
23.5
34.1
34.4
41.1
33.6
35.9
51.0
51.9
M
exico
d
10.3
17.3
18.6
19.8
14.8
18.0
32.2
33.7
Pe
ru
13.6
13.5
11.5
11.4
10.4
9.7
13.4
17.1
Si
mple
av
erage
14.3
19.4
19.6
19.0
16.7
15.8
23.5
26.5
Source:
P
roject
database,
on
the
basis
of
ECL
A
C
statistics.
a.
E
xpor
ts
and
impor
ts
as
a
shar
e
of
GDP
.
b.
B
ased
on
1990
dollars.
c.
B
ased
on
1995
dollars.
d.
M
aquila
expor
ts
and
impor
ts
ar
e
included
for
M
exico
and
for
Costa
Rica
in
1998.

105
I N V E S T M E N T, P RO D U C T I V I T Y, A N D G ROW T H
nontradables sectors.
43
Similar studies are needed for other countries be-
fore any firm conclusions can be reached on the role of export in growth.
Table 4-15 puts the trade situation into a longer-term perspective. A
small positive trade balance characterized the 1950–73 period.
44
This was
followed by a swing toward deficits in the latter half of the 1970s, as im-
ports exceeded exports when foreign capital flooded into the region in the
form of private bank loans. Once the debt crisis broke and Latin American
countries no longer had access to international capital markets, they had to
generate trade surpluses to service their debt. On average, this period of
surpluses lasted from around 1982–83 until the early 1990s, when access to
capital markets was again a possibility and trade deficits matched capital
account surpluses. Such an externally based account is incomplete, how-
ever, because it overlooks the internal factors that contributed to the deficits.
The reforms themselves played an important role, especially trade liberal-
ization, privatization, and the opening of the capital account, as did pent-
up demand for consumer goods and new demand for investment goods.
Current account deficits may play a positive role in economic growth
because their financing implies that the country receives external savings.
43. See García, Meller, and Repetto (1996).
44. This result is based on simple averages. Weighted averages demonstrate a small deficit in the
1950–73 period, mainly because of the deficit in Brazil.
Table 4-15. Trade Balance as a Share of GDP, 1950–98
Percent
a
Country
1950–73
1974–82
1983–91
1992–98
Argentina
0.2
1.0
2.5
–2.3
Bolivia
4.9
5.3
–4.5
–7.7
Brazil
–1.8
–4.4
2.3
–0.3
Chile
3.1
–3.9
4.6
3.0
Colombia
–0.8
–0.1
0.4
–3.1
Costa Rica
–3.6
–7.0
–2.3
–1.0
Mexico
–0.9
–1.0
3.3
–2.4
Peru
2.0
–1.7
1.7
–3.2
Simple average
0.4
–1.5
1.0
–2.1
Source: Project database, on the basis of ECLAC statistics.
a. Calculated in constant dollars.

106
I N V E S T M E N T, P RO D U C T I V I T Y, A N D G ROW T H
45. This figure of 5 percent is the counterpart of the figure for external finance of investment, as
discussed earlier in the chapter.
Problems arise, however, when deficits reach levels that cannot be sustained.
Increasing current account deficits in the economies of the region raise
new concerns about their vulnerability. By the late 1990s, trade deficits
alone reached nearly 3 percent of GDP on average among the project coun-
tries. To this must be added an additional 2 percent for factor payments in
a typical country, which means that the current account deficits approached
5 percent.
45
Recent history indicates that this level is about the limit of
what the capital markets are willing to finance, even in a period of abun-
dant liquidity.
Thus, the vulnerability issue is a very important one with two separate
but related components. One centers on the behavior of the current ac-
count, both the trade balance and factor payments (dividends and inter-
est). Although the current account is usually in deficit in developing
countries, we have seen that the size of the deficit varied substantially. In
the face of the expectation that the reforms would shrink deficits, the op-
posite occurred through the end of the 1990s. To evaluate the significance
of this trend, we need to know whether investments are underway that
might narrow the gap.
The other component of external vulnerability concerns the type of
foreign capital that finances the current account deficit. Chapter 2 pre-
sented evidence of two diverging trends in capital inflows in the 1990s
compared to the period before the debt crisis. On the one hand, the vola-
tility of inflows rose because of the increased role of short-term capital.
On the other hand, foreign direct investment constituted an increased
share of total inflows. Since FDI is the most stable kind of capital, and it
is often linked to exports, governments implemented policies to attract
this type of flow.
Overall, the issue of external vulnerability remains high on the agenda
in Latin America and the Caribbean, as was shown during the economic
downturn in South America in 1998–99. In some ways, the reforms exac-
erbated the problem through the unrestricted opening of the capital ac-
count in many countries. At the same time, the new investment resulting
from the reforms may be producing exports that are less sensitive to wide
price fluctuations. One measure of the success of the reforms and associ-
ated policies in the future will be their capacity to reinforce the latter while
minimizing the former.

107
I N V E S T M E N T, P RO D U C T I V I T Y, A N D G ROW T H
Conclusions
In most project countries in the 1990s, investment and labor pro-
ductivity recovered their previous levels after significant declines in the
1980s. As measured by simple averages, both variables are now back to or
a little above their levels at the end of the import-substitution period. A
similar pattern occurred for growth among project countries, but the
recovery process in this instance was less complete; growth in the 1990s
remained below that in the 1950–80 base period. Predicting the future
growth path requires evidence on investment and productivity at the sec-
toral level.
On the aggregate level, the reforms—especially privatization and trade
liberalization, but also the capital account opening—had a positive impact
on both investment and growth. According to the econometric evidence,
this impact was fairly small, although qualitative evidence at the sectoral
and firm levels presented in chapter 6 suggests that the reforms may have
been more important than the econometric evidence indicates. We have no
econometric evidence with respect to productivity, but the growth account-
ing exercises suggest that this was the crucial factor in explaining the be-
havior of high-growth versus low-growth countries. The reforms led to a
more efficient allocation of resources, but macroeconomic stabilization also
played a significant role.
The performance of investment, productivity, and growth was hetero-
geneous across countries. Three cases exhibit a consistent pattern with re-
spect to the three variables. In Chile, all three variables increased substantially
in comparison with earlier periods, while in Mexico and Brazil all three
declined (or remained constant in the case of investment in Mexico). These
consistent patterns are the expected ones since investment, productivity,
and growth are known to reinforce each other, but most of the countries
had a more mixed performance.
Chile achieved a virtuous circle among the three variables only from
the mid-1980s, more than a decade after its reforms began; earlier post-
reform economic performance had been extremely volatile. Positive out-
comes, including increases in factor inputs and productivity of all factors,
were stimulated by macroeconomic policies that became consistent with
the reforms, thanks to the policy shift after the crisis of the early 1980s.
These policies reduced uncertainty through close collaboration between
public and private sectors. In addition, although Chile was the recipient of
substantial amounts of foreign capital, it kept its external accounts under

108
I N V E S T M E N T, P RO D U C T I V I T Y, A N D G ROW T H
control through rapid export growth and a high domestic savings rate,
including a fiscal surplus.
Brazil and Mexico, in contrast, have yet to stimulate a sustained, posi-
tive relation among investment, productivity, and growth, although Mexico
may be heading in this direction with policy adjustments following the
1994–95 crisis. The key factor in both cases was inconsistency between the
reforms and macroeconomic policy, centering on the use of the exchange
rate to tame inflation. In Mexico, this led to a large current account deficit
that made investors hesitant to undertake major projects, which might have
stimulated higher growth. The situation in Brazil was more serious. The
reforms had to co-exist with hyperinflation until 1994, and then the high
interest rates to protect the overvalued exchange rate both enlarged the
fiscal deficit and hindered investment. While the situation changed par-
tially after the January 1999 devaluation, the outcome is not yet clear.
The other cases demonstrate a mixed pattern, with either investment
or productivity exceeding their previous levels, but not both. Among the
mixed cases, Argentina, Bolivia, and Peru saw an increase in growth com-
pared with the base period, while it fell in Colombia and Costa Rica. On
the surface, the difference was explained by productivity trends, but the
factors underlying productivity probably related back to the initial condi-
tions when the reforms began. That is, the former group of countries faced
especially negative circumstances and had thus lost past opportunities for
investment and productivity gains in comparison with their more success-
ful neighbors. Once the reforms were implemented and macroeconomic
conditions became more stable, they quickly began to catch up, in large
part through increased access to foreign capital flows. Whether these gains
will persist remains to be seen. Countries that had been doing well previ-
ously did not have this opportunity for an easy catch-up; they may even
have lost out in terms of investment to the other group.
The reforms did not eliminate, and may have exacerbated, external
vulnerability. Trade deficits returned to levels not seen since the 1970s.
The increased role of volatile short-term capital flows in financing the
deficits led to new problems for macroeconomic management. More-
over, given the trade and current account deficits, a sharp drop in finan-
cial flows could cause serious recession if governments have to slow their
economies to prevent foreign exchange crises. This process was evident
in the aftermath of the international crisis in 1998 and especially 1999.
Again, we need more evidence at the sectoral and microeconomic levels
to evaluate future prospects.

109
I N V E S T M E N T, P RO D U C T I V I T Y, A N D G ROW T H
Aggregate-level analysis can provide useful insights into patterns of
investment, productivity, and growth, and it can also provide evidence for
linking the reforms to these processes. It can depict the heterogeneity among
countries with respect to investment and growth and give clues to the
sustainability of the process. At the same time, an aggregate level of analy-
sis, which is typical of the vast majority of studies on the reforms, leaves
many questions pending, most notably with regard to the types of struc-
tural change that have taken place in the various economies and the charac-
teristics of the investment and productivity trends that are underway. These
are essential pieces of information for making policy recommendations to
improve existing policies.

110
E M P L OY M E N T A N D E Q U I T Y
110
5
Employment
and Equity:
Continuing
Challenges
T
he impact of the structural reforms on employment
and equity has attracted less attention than the re-
lation between reforms and growth.
1
The empirical analyses that have been
carried out have generally found that the reforms had a negative impact on
both employment generation and equity. This result is opposite to that
predicted by the literature of the late 1970s and early 1980s, which pro-
vided the theoretical underpinnings for the reforms.
That literature argued that removing the distortions caused by the
import substitution industrialization (ISI) model would generate more
employment, especially for unskilled workers.
2
Several mechanisms were
specified to link the reforms to increased employment. The most basic
was that a more efficient allocation of resources would facilitate faster
growth, and faster growth would result in more job creation. This would
occur even if the elasticities remained the same, but the elasticities were
1. This chapter draws extensively on data and analysis in Weller (2000) and Morley (2000). These
authors are not responsible for the conclusions that are drawn here.
2. Perhaps the most important of the early works that argued for structural reforms and linked
them to the “employment problem,” were those of Krueger (1978, 1981–83). The fact that Krueger
served as chief economist of the World Bank in the early 1980s gave her opinions a weight well
beyond academic circles.

111
E M P L OY M E N T A N D E Q U I T Y
also expected to be more favorable, owing to a shift in investment and
the production structure. Investment and technical change were projected
to be more labor intensive once the alleged biases in favor of capital and
against labor were eliminated. An increased emphasis on exports would
also create jobs, because exports were thought to be more labor intensive
than import-competing products. This last point was consistent with the
sectoral analysis, which asserted that agriculture and light industry would
be especially favored under a new trade strategy. Finally, it was increas-
ingly argued that if the high costs of hiring workers were lowered, more
jobs would be created.
The mechanisms for increasing equity were closely related to those for
expanding employment.
3
The most obvious link was through the creation
of new low-skill jobs, which would presumably be filled by those who were
unemployed or underemployed and thus had very low incomes. Insofar as
many of these new jobs were created in rural areas, they would help allevi-
ate the greatest pockets of poverty, which were located there. It was also
expected that the greater demand for unskilled labor would have a positive
impact on the relative wages of those who were already employed. That is,
the wage differential between skilled and unskilled workers would decrease,
thus improving the distribution of income. The gap between profits and
wages was also expected to decrease, given some evidence that protection
had increased the former at the expense of the latter. Finally, reducing the
productive role of the state would free up funds that could be devoted to
social expenditure in benefit of poorer groups.
The empirical literature on the impact of the reforms is paying increas-
ing attention to employment; an important example is a recent set of stud-
ies by the Inter-American Development Bank (IDB).
4
The International
Labour Organization (ILO) has also studied the topic extensively.
5
Both
the IDB and ILO argue that the growth rate of employment was lower in
3. While there is no doubt that the proponents believed the reforms would benefit employment,
there is more disagreement about whether better income distribution was an explicit goal of the
reformers. Balassa and others clearly said that it was (1986, pp. 93–94), as did Krueger (1983, pp.186–
87). Williamson specifically excluded it from the Washington Consensus measures, saying that the
Washington of the Reagan-Bush years had no interest in the subject (1990, pp. 413–14; 1993, p.
1329). Perhaps Bulmer-Thomas’s conclusion that the new economic model was “not primarily adopted”
to reduce poverty and improve distribution is the best summary (1996, p. 310).
4. IDB (1998b); see also World Bank (1995b and 1995c); ECLAC (1997); Edwards and Lustig
(1997).
5. See especially the annual Panorama Laboral de América Latina y el Caribe.

112
E M P L OY M E N T A N D E Q U I T Y
the 1990s than in the last half of the 1980s, unemployment rose, informal-
ity increased, and improvement in real wages mainly benefited skilled work-
ers. The explanation and remedy for these problems differ, however, with
the IDB stressing the need for more flexible labor markets and the ILO
more protection for workers.
Academic analysts, as well as ECLAC and the IDB, have done more
work on equity. These studies express a difference of opinion on the impact
of the reforms per se. While all authors agree that the distribution of in-
come in Latin America is the most unequal in the world, the IDB analysis
stresses that inequality increased primarily during the lost decade of the
1980s and that it did not get any worse during the 1990s. IDB authors go
so far as to argue that the reforms actually improved distribution in com-
parison with what it would otherwise have been.
6
The studies included in
the Bulmer-Thomas and Berry volumes, in contrast, argue that the reforms
have led to further deterioration of an already deplorable situation.
7
This chapter analyzes employment, equity, and the linkages between
the two, always at the aggregate level. We argue that both employment and
equity deteriorated as a result of the reforms, but that the changes were less
dramatic than is often believed. While job creation slowed somewhat in
the 1990s with respect to the 1950–80 base period, mainly because of slower
GDP growth, the more serious problems arose because of the low quality
of many new jobs. Primary distribution of income—the measure most
closely related to the functioning of the economy—deteriorated somewhat
in most of the project countries. This trend would probably be more pro-
nounced if we had the proper data. Nonetheless, significant offsetting fac-
tors were also at work, especially the end of hyperinflation and the long-run
impact of education trends; the household distribution patterns therefore
changed less than was predicted, by either proponents or critics of the
reforms.
8
The chapter begins with demographic and educational shifts and their
role in determining long-term trends in both employment and equity. It
then moves to the impact of the reforms on employment, unemployment,
and wages. Next it focuses on the wage differential and its role in linking
labor markets and income distribution. The following sections examine
6. Londoño and Székely (1997); IDB (1997). For annual data and analysis of distribution trends,
see ECLAC’s Social Panorama of Latin America.
7. Bulmer-Thomas (1996); Berry (1998).
8. In his volume for the project, Morley (2000) stresses the lack of change in distribution. Our
emphasis is slightly different, mainly because we give greater weight to the lack of data on the wealthy.

113
E M P L OY M E N T A N D E Q U I T Y
primary and household income distribution, analyzing their respective de-
terminants in addition to the wage differential, with emphasis on the re-
forms. The final empirical section discusses the impact of social expenditure
on employment and equity. We again conclude by identifying the ques-
tions that can and cannot be answered by aggregate-level analysis.
The Supply Side: Demography and Education
Experts clearly agree that long-term trends in employment are deter-
mined by changes in the labor supply. Specifically, changes in the economi-
cally active population (EAP) over the long run are explained by changes in
the size of the working-age population (WAP) and the extent to which that
population decides to participate in the labor market (the total participa-
tion rate, or TPR). The latter two variables have followed different trends
in Latin America in the postwar period. On the one hand, as the demo-
graphic transition proceeds, the annual growth rate of the WAP is falling,
reducing pressure on the labor market. On the other hand, the degree of
labor force participation, which is the outcome of both long-term pro-
cesses and temporary fluctuations, is still increasing, mainly because of
greater female participation.
Among the nine project countries, Argentina, Chile, and Jamaica had
the lowest rates of WAP growth in the 1990s with less than 2 percent per year,
while Bolivia, Costa Rica, Mexico, and Peru had rates over 2.5 percent;
Brazil and Colombia were in between. WAP trends are affected by migra-
tory flows as well as by birth and death rates. In Argentina and Costa Rica,
immigration contributed to a quickening of the WAP growth rate, while in
Bolivia, Jamaica, Mexico, and Peru, emigration reduced this variable.
The participation rate reflected offsetting trends. As mentioned above,
the most important factor raising the TPR was the increasing role of women
in the labor force. Other processes, however, worked to reduce participa-
tion rates, including urbanization, growth in the education system, and
increased coverage of the pension system. This second group of factors
meant that people entered the labor force later and retired earlier. As a
consequence, the TPR in the region as a whole grew by 0.2 percentage
points per year between 1990 and 1997–98, thus maintaining the trend of
the previous decade. Figure 5-1 combines the effects of demographic and
participation changes to show their impact on the growth of the economi-
cally active population, which fell from 2.9 percent in the 1980s to 2.5
percent in the 1990s.
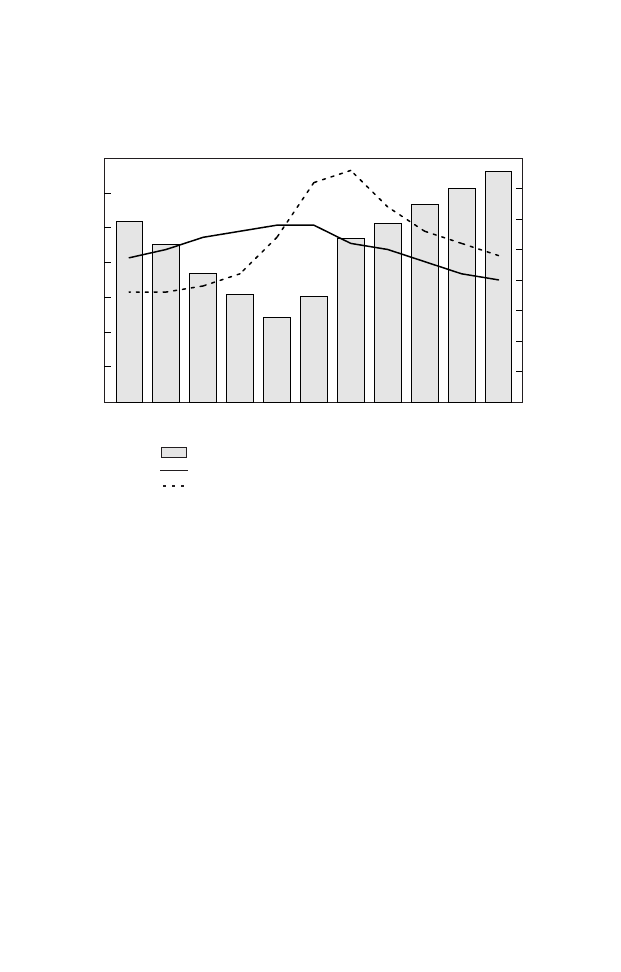
114
E M P L OY M E N T A N D E Q U I T Y
These long-term trends are always subject to short-term variations
caused by temporary economic circumstances. The TPR is particularly prone
to fluctuate around its long-term trend rate, owing to the impact of supply
and demand factors that change over the course of the business cycle. These
variations consist mainly of people entering and leaving the labor market.
Most of these people pertain to the secondary labor force, that is, house-
hold members who do not usually generate most of the family income.
The TPR fluctuates around its average in both the expansion and con-
traction stages of the cycle, and not always in the same direction. When the
economy is expanding beyond its long-term trend rate, the TPR may in-
crease because extra employment opportunities encourage people who were
formerly inactive to seek work. If the expansionary phase of the cycle is a
prolonged one, however, the TPR may fall as participants from the second-
Figure 5-1. Changes in Labor Supply, 1950–2000
a
Percent (TPR)
1950
1970 1975
Source: Weller (2000).
a. Based on weighted averages for twenty Latin American countries.
1955 1960
Total participation rate (TPR)
Growth of the working age population (WAP)
Growth of the economically active population (EAP)
Percent (WAP and EAP)
1965
1980
2000
1985 1990 1995
42
44
46
48
50
52
0.5
1.0
1.5
2.0
2.5
3.0
3.5

115
E M P L OY M E N T A N D E Q U I T Y
ary labor force withdraw from the market to continue their studies or to
take advantage of other opportunities. During downturns in the cycle (be-
low the long-term trend), equivalent situations arise. The TPR may in-
crease as the secondary labor force returns to the market; if the adverse
economic conditions persist, participation may decline as people lose con-
fidence in their prospects of finding work.
9
The other important change in the labor force had to do with levels of
education and experience. In terms of educational attainment, the general
education indexes of the region at the beginning of the 1990s were quite
good by international standards, especially for primary and tertiary educa-
tion, although they lagged somewhat in the case of secondary schooling.
10
By the middle of the decade, almost all countries had achieved gross enroll-
ment rates of close to 100 percent at the primary level, and enrollment at
the higher levels had also increased.
11
Although young people spent more
time in the education system, a high proportion of the labor force still had
a very low level of education in most of the project countries. The situation
was particularly serious in Brazil, where almost 60 percent of the work
force had six years of schooling or less in the mid-1990s.
12
At the same
time, the demographic transition and especially the fall-off in WAP growth
led to an increase in the average age of the region’s economically active
population, meaning that the work force was more experienced and that
pressure from the supply of inexperienced people had eased.
Changes in the education profile of the population have important
implications for equity. Improving the education level at the bottom of the
income distribution is one of the most important ways of making the dis-
tribution less regressive. The effect of increasing education at the other end
of the distribution is more ambiguous: increasing the supply of skilled la-
bor should drive down the wage premium of these individuals, but as long
as demand is increasing faster than supply, the opposite will occur. Popula-
tion trends interact with shifts in education stock. As the older generation
9. In the 1990s, for example, the TPR in Latin America went through the following fluctuations:
(1) rising in the context of growth, due to a perception of opportunities from the demand side (1991–
93); (2) falling, still in a growth situation, due to a lessening of pressure from the supply side (1994);
(3) rising at a time of recession, due to greater supply pressure (1995); (4) falling in a recession, due to
a perception that the demand situation was poor (1996); (5) a return to the first stage as growth
recovered (1997); and (6) increasing participation during recession as in 1995 (1998).
10. IDB (1993).
11. ECLAC (1999d).
12. Weller (2000), on the basis of consultant reports. For a discussion of education problems in
Brazil, see Birdsall and Sabot (1996).

116
E M P L OY M E N T A N D E Q U I T Y
with poorer education levels disappears from the scene and the younger
generation obtains more education than their parents and grandparents,
this will eventually lead to greater equality.
13
The Impact of the Reforms on Employment
The strong correlation between the labor supply and the generation of
total employment causes difficulties for the analysis of labor demand and
its possible relation to changes brought about by the reforms. To minimize
this problem, we concentrate on trends among wage earners, a category
more closely related to labor demand. Table 5-1 illustrates the differences
between total employment and wage earners, as well as changes over time;
it shows economic growth by decade in the postwar period, creation of
total and wage employment, and the respective elasticities. Leaving aside
the 1980s, which were clearly atypical,
14
elasticities did not differ signifi-
cantly in the 1990s from the 1950–80 period. Insofar as the 1990s re-
flected the impact of the reforms, it can be inferred that the reforms did
13. For an analysis of the impact of demography on equity, see Duryea and Székely (1998).
14. Especially high elasticities in the 1980s resulted from an increasing labor supply in the face of
very slow growth; nonetheless, the EAP was growing more slowly than in the 1970s.
Table 5-1. Employment Growth and Elasticities, 1950s to 1990s
a
Annual weighted average
Wage
Employment
Growth
employment
GDP
Growth of
elasticity
of wage
elasticity
Period
growth
employment
re: output
employment
re: output
1950s
5.1
1.9
0.4
2.5
0.5
1960s
5.7
2.3
0.4
2.7
0.5
1970s
5.6
3.8
0.7
4.7
0.8
1980s
1.2
2.9
2.6
2.4
2.0
1990–97
3.7
2.2
0.6
2.2
0.6
Average
4.3
2.6
0.9
2.9
0.9
Source: Weller (2000), on the basis of official statistics.
a. For the 1950s to 1970s, employment growth corresponds to growth of the labor force. From the
1950s through the 1980s, 20 countries are included; for 1990–97, the number is 17.

117
E M P L OY M E N T A N D E Q U I T Y
Table 5-2. Employment Growth and Elasticities, 1990–97
Wage
Employment
Growth
employment
Growth of
elasticity
of wage
elasticity
Country
employment
re: output
employment
re: output
Argentina
1.7
0.4
2.3
0.5
Bolivia
6.6
1.6
4.7
1.1
Brazil
1.2
0.3
1.1
0.3
Chile
2.5
0.3
3.3
0.4
Colombia
1.4
0.3
1.1
0.2
Costa Rica
2.7
0.8
2.7
0.8
Jamaica
1.2
0.9
2.2
1.6
Mexico
2.9
1.1
4.0
1.5
Peru
3.8
0.6
1.7
0.3
Simple average
2.7
0.7
2.6
0.7
Source: Weller (2000), on the basis of official statistics.
not affect—either positively or negatively—the quantitative relationship
between GDP growth and employment creation. Rather, what stands out
in the table for the last decade are lower growth rates, which led to more
sluggish employment creation, especially for wage earners.
The data in table 5-1, however, are weighted averages for the Latin
American region, and as we have seen in previous chapters, comparisons
over time based on weighted averages can be misleading because of the
changing behavior of the largest economies. Table 5-2 focuses on the simple
averages for the nine project countries during the 1990s. These were some-
what more positive than the weighted regional averages with respect to
employment creation (mainly because of the relatively poor employment
performance in Brazil) although not for elasticities. The nine countries
displayed important differences, however: a relatively low elasticity for wage
employment in five cases (Argentina, Brazil, Chile, Colombia, and Peru), a
high elasticity in three (Bolivia, Jamaica, and Mexico), and an average elas-
ticity in Costa Rica.
Moving from aggregate employment statistics to the types of jobs that
were created in the 1990s, table 5-3 contrasts wage and nonwage work in
the nine countries. The number of wage earners increased more slowly
than the self-employed: 2.5 percent versus 2.7 percent on average for the

118
E M P L OY M E N T A N D E Q U I T Y
T
able 5-3.
E
mplo
yment G
ro
wth b
y
T
ype of J
ob
, 1990s
Pe
rcent
W
age
ear
ners
Self-
D
omestic
F
amily
Countr
y
(period)
P
rivate
P
ublic
T
otal
emplo
yed
ser
vice
members
Others
T
otal
Change
in
emplo
yment
Argentina
(1991–97)
1.7
3.2
1.8
–1.0
2.3
n.a.
0.9
1.1
Bolivia
(1990–97)
5.5
–1.4
4.7
5.5
–2.9
11.6
16.1
5.5
B
razil
(1992–97)
1.1
1.0
1.1
1.5
3.8
–1.9
3.1
1.2
Chile
(1990–97)
n.a.
n.a.
3.3
2.4
–0.6
–4.2
0.2
2.5
Colombia
(1991–97)
1.4
–0.6
1.1
4.0
0.1
–7.5
–1.4
1.4
Costa
Rica
(1990–97)
3.5
0.1
2.7
2.8
2.8
–4.4
7.8
2.7
Jamaica
(1989–96)
3.1
–1.8
2.2
–0.5
n.a.
–4.2
14.7
1.2
M
exico
(1991–97)
4.1
3.4
4.0
4.1
8.4
3.0
-5.1
3.4
Pe
ru
(1991–97)
4.3
–4.7
1.7
5.3
1.7
n.a.
n.a.
3.8
Simple
av
erage
3.1
–0.1
2.5
2.7
2.0
–1.1
4.5
2.5
Contribution
to
total
change
Argentina
(1991–97)
86.9
13.8
100.7
–20.0
14.7
0
4.5
100.0
Bolivia
(1990–97)
42.8
–1.4
41.4
34.7
–2.8
12.3
14.4
100.0
B
razil
(1992–97)
45.0
4.0
49.0
34.2
22.5
–15.7
10.0
100.0
Chile
(1990–97)
n.a.
n.a.
84.1
22.4
–1.4
–5.5
0.3
100.0
Colombia
(1991–97)
47.4
–3.7
43.8
92.0
0.2
–31.3
–5.0
100.0
Costa
Rica
(1990–97)
63.9
0.7
64.6
20.0
4.4
–6.7
17.7
100.0
Jamaica
(1989–96)
122.0
–16.5
105.5
–11.8
0
–16.0
22.2
100.0
M
exico
(1991–97)
57.9
4.3
62.2
28.7
9.0
11.2
–11.0
100.0
Pe
ru
(1991–97)
32.3
–13.9
18.4
81.0
0.6
0
0
100.0
Simple
average
n.a.
n.a.
63.3
31.2
5.2
–5.7
5.9
100.0
Source:
W
eller
(2000),
on
the
basis
of
national
household
sur
veys.

119
E M P L OY M E N T A N D E Q U I T Y
nine. Given the employment structure, however, new wage jobs accounted
for 63 percent of all new employment, while self-employment contributed
31 percent. Within the wage-earner category, private sector jobs increased
at a 3 percent annual rate, while public sector jobs shrank.
In three of the nine countries (Bolivia, Colombia, and Peru) wage jobs
grew more slowly than total employment, in part because private firms
could not compensate for the significant contraction of employment in the
public sector. In Argentina, Chile, Jamaica, and Mexico, wage-earner cat-
egories grew faster in relative terms, increasing their weight in the total
employment structure. In Brazil and Costa Rica, wage earners as a group
grew at about the same rate as total employment.
According to ILO data, the increase in the number of wage earners in
the private sector in the 1990s was concentrated in microenterprises (that
is, with fewer than six workers) and small firms (between six and twenty
workers). Jobs in these two groups grew at 3.7 percent between 1990 and
1998 in comparison to only 2.3 percent in medium-size and large firms.
15
The ILO’s concept of the informal sector, which has permeated the litera-
ture on employment, combines jobs in the microfirm and the nonwage
categories. Although the definition of the concept centers on the produc-
tivity level of firms, in practice it has been measured by a proxy that groups
microenterprises, the self-employed, domestic service, and nonremunerated
family members. On this basis, nearly 60 percent of new jobs in the seven
project countries with data available were in the informal sector. They were
especially prevalent in Brazil, where formal sector jobs fell in absolute terms,
and in Colombia. Informal jobs were least important in Argentina and
Chile.
16
The idea behind the concept of the informal sector is that this type
of job is of low quality, with poor working conditions, low salaries and
productivity, and a lack of legal and social protection. Clearly this is not
completely true, since both the self-employed and some microenterprises
include good jobs. The concept continues to be used because of lack of
information on the characteristics of such occupations and the assumption
that the majority are indeed precarious.
More precarious yet is the situation of the unemployed, whose pres-
ence in Latin America increased. Unemployment fell only slightly in the
1990s in comparison to the 1980s, despite higher growth of GDP. Average
15. ILO (1999). The figures are based on weighted averages for twelve countries.
16. Estimated from data in ILO (1999). No information is available for Bolivia and Jamaica. Note
that these estimations of increased informality are substantially lower than those shown in previous
ILO publications, due to changes in definitions and sampling methods.

120
E M P L OY M E N T A N D E Q U I T Y
unemployment in the project countries in 1980–89 was 9.2 percent, fall-
ing to 8.2 percent in 1990–98.
17
Not surprisingly, unemployment jumped
in Mexico and Argentina in 1995, although jobs recovered fairly quickly in
Mexico. Later in the decade, unemployment rose in Colombia, in particu-
lar, and in Brazil, as GDP growth rates fell in those two countries, and
unemployment rates remained high in Argentina. Table 5-4 shows that the
simple average for unemployment in project countries rose from 7.6 per-
cent in 1994 to nearly 9.0 percent in 1995 and remained at that level through
1998. With the generalized fall in growth rates in South America in 1999,
unemployment reached historic highs in that subregion.
The other side of the labor market equation involves remunerations.
Average real wages in the formal sector in Latin America as a whole, as well
as in the project countries, improved during the 1990s or at least held their
own. In Argentina, Mexico, and Peru, however, wages in 1998 were lower
than in 1980 (see table 5-5). Because of the especially large drop in Peru
between 1980 and 1990, the simple average for the nine countries also
remained lower in 1998 than in 1980. In five countries, real wages fell at
17. The sharp drop in Jamaica’s traditionally high rates of unemployment skews the simple aver-
ages. Excluding Jamaica, unemployment among project countries actually rose from 6.9 to 7.2 per-
cent between the 1980s and 1990s.
Table 5-4. Unemployment Rates, 1990–98
Percent
Country
19901991
1992
1993
1994
1995
1996
1997
1998
Argentina
7.4
6.5
7.0
9.6
11.5
17.5
17.2
14.9
12.9
Bolivia
7.3
5.8
5.4
5.8
3.1
3.6
3.8
4.4
4.1
Brazil
4.3
4.8
5.8
5.4
5.1
4.6
5.4
5.7
7.6
Chile
7.8
8.2
6.7
6.5
7.8
7.4
6.4
6.1
6.4
Colombia
10.5
10.2
10.2
8.6
8.9
8.8
11.2
12.4
15.3
Costa Rica
5.4
6.0
4.3
4.0
4.3
5.7
6.6
5.9
5.4
Jamaica
15.3
15.4
15.7
16.3
15.4
16.2
16.0
16.5
15.5
Mexico
2.7
2.7
2.8
3.4
3.7
6.2
5.5
3.7
3.2
Peru
8.3
5.9
9.4
9.9
8.8
8.2
8.0
9.2
8.4
Simple
average
7.7
7.3
7.5
7.7
7.6
8.7
8.9
8.8
8.8
Source: Project database, on the basis of ECLAC statistics.

121
E M P L OY M E N T A N D E Q U I T Y
the beginning of the 1990s but then recovered (Bolivia, Brazil, Colombia,
Costa Rica, and Jamaica). Mexico and Peru experienced the opposite trend,
with an early increase followed by declines; in the Mexican case, this trend
was clearly the result of the 1995 financial crisis. In Argentina, the elimina-
tion of inflation was accompanied by nearly constant real wages. Only
Chile had continuous increases throughout the decade.
Theory tells us that there should be a trade-off between wages and
volume of employment created. On the surface, this does not appear to
have occurred among project countries during the 1990s. That is, wages
rose everywhere (except Argentina), but both employment and unemploy-
ment behavior varied widely across countries (with increased unemploy-
ment in Argentina).
18
One hypothesis is that regional labor markets are far
Table 5-5. Average Real Wages in the Formal Sector, 1980–98
1990 = 100
Country
19801991
1992
1993
1994
1995
1996
1997
1998
Argentina
a
130.0 101.4 102.7 101.3 102.0 100.9 100.7 100.2
99.1
Bolivia
b
64.9
93.4
97.1 103.6 111.8 112.6 113.9 123.1 127.5
Brazil
c
91.3
85.2
83.3
91.5
92.2
95.7 103.3 106.0 106.1
Chile
d
95.4 104.9 109.6 113.5 118.8 123.6 128.7 131.8 135.3
Colombia
e
85.0
97.4
98.6 103.2 104.1 105.4 107.0 109.8 108.4
Costa Rica
f
115.8
95.4
99.3 109.5 113.6 111.4 109.1 110.0 117.6
Jamaica
g
103.4
71.4
75.4
91.6 108.4 105.0 106.7 117.5 120.9
Mexico
a
128.3 106.5 114.3 124.5 130.4 113.5 102.3 101.1 103.9
Peru
h
309.3 115.2 111.1 110.2 127.4 116.7 111.2 110.4 108.2
Simple
average
124.8
96.8
99.0 105.4 112.1 109.4 109.2 112.2 114.1
Source: Weller (2000), on the basis of official statistics.
a. Manufacturing industry.
b. Private sector in La Paz; figure for 1980 is actually for 1985.
c. Workers covered by social and labor legislation.
d. Average wages of nonagricultural workers until April 1993; then general index of hourly wages.
e. Blue-collar workers in manufacturing.
f. Workers affiliated with social security system.
g. Nonagricultural workers in the private sector; figure for 1980 is actually for 1986.
h. Private sector workers in Lima.
18. Econometric analysis in Weller (2000) shows a negative relationship between employment
creation and wages, but the coefficient is not significant. See table 5-7 in this chapter.

122
E M P L OY M E N T A N D E Q U I T Y
from equilibrium, but a proper analysis of this topic would require better
data than are currently available. Sectoral-level data are particularly impor-
tant, since labor markets in Latin America tend to be heavily segmented by
sectors as well as by other characteristics.
Table 5-6 provides a simple qualitative summary of various changes:
the employment rate, unemployment, wage employment compared to to-
tal employment, real wages, and labor productivity. The table assigns a plus
where conditions improved, a minus where they deteriorated, and an equal
sign where they remained relatively constant, which enables us to compare
across issue areas and across countries. The most positive trends occurred
with respect to real wages, which were often linked to productivity rises.
Rising unemployment appears to be the biggest problem; it was also fre-
quently related to productivity but in an inverse direction. Changes in the
level and type of employment (wage earners as a share of total new jobs)
occupy intermediate positions in the nine countries.
Table 5-6 also provides the basis for comparing labor market results
across the nine countries. If we convert the pluses and minuses into +1 and
Table 5-6. Changes in Labor Market Indicators, 1990s
a
Occupation
Unemploy-
Wage
Real
Labor
Country
level
b
ment
c
employment
d
wage
e
productivity
f
Argentina
–
–
+
=
+
Bolivia
+
+
–
+
–
Brazil
–
–
=
+
+
Chile
+
+
+
+
+
Colombia
=
–
–
+
+
Costa Rica
+
=
=
+
+
Jamaica
–
=
+
+
–
Mexico
+
–
+
+
=
Peru
+
–
–
+
+
Source: Weller (2000), based on consultant reports.
a. The evaluation refers to changes between the beginning of the 1990s and 1998 (Bolivia and
Peru: 1997). + means a favorable change; - means an unfavorable change; = means very little or no
change.
b. Change in the rate of employment (employed as share of WAP).
c. Change in unemployment rate (unemployed as share of EAP).
d. Growth of wage employment with respect to total employment.
e. Change in real average wages in the formal sector.
f. Change in average labor productivity.

123
E M P L OY M E N T A N D E Q U I T Y
–1, Chile clearly emerges at the top with positive marks in all five catego-
ries (a score of 5). Costa Rica follows with a score of 3, reflecting a weaker
performance in unemployment and the creation of wage jobs. Mexico also
displays a relatively positive pattern, with a score of 2, despite the increased
unemployment and drop in wages resulting from the 1994–95 crisis. Bo-
livia and Peru scored 1 in this exercise. Both faced increasing informalization
in the 1990s; Bolivia also suffered from low productivity and Peru from
unemployment and underemployment. Argentina, Brazil, Colombia, and
Jamaica had the most difficult labor conditions. They shared a general set
of characteristics featuring weak generation of employment (and thus high
unemployment), accompanied by increases in productivity (except Jamaica),
but only moderate growth of salaries.
How do the overall trends among labor variables and the specific dif-
ferences among countries relate to the reforms? Up till now, we have been
examining trends in the 1990s as a proxy for the post-reform period, but
Weller’s book for the project provides elements to link reforms and em-
ployment more directly. Table 5-7 reports the results of an econometric
exercise to test the relevance of several variables, including the reforms.
19
The table first shows a basic equation in which growth of employment is
the dependent variable, and GDP growth, salaries, a trend term to repre-
sent technological progress, the real exchange rate, and economic openness
are independent variables. Only the growth rate, together with the real
exchange rate and the openness variable, are statistically significant at the 5
percent level. Equations (2) through (4) add three measures of the reform
index. These include the average reform index, trade reform, and capital
account opening, expressed in five-year averages. All coefficients are nega-
tive and significant.
Two main conclusions emerge from the table. First, expansion of out-
put is closely related to the generation of employment. Our hypothesis,
which is embodied in figure 1-1 (chapter 1), is that GDP growth is the
main transmission mechanism between the reforms and the quantitative
dimension of employment. The implication is that the weak growth rates
of the 1990s—in comparison to the earlier years of the postwar period, not
to the 1980s—caused a good part of the employment problem. The stop-
go pattern that characterized growth in the 1990s further hindered job
19. Weller (2000, chapter 4). The econometric analysis was carried out by Lucas Navarro.

124
E M P L OY M E N T A N D E Q U I T Y
creation. High and stable growth of output would appear to be a crucial
prerequisite for increasing job growth.
A second conclusion drawn from the econometric analysis is that the
reforms hindered the growth of employment.
20
The coefficient indicates
that a 10 percent increase in the average reform index led to a decline in
employment creation of about 0.4 points. As was the case with the analysis
Table 5-7. Determinants of Employment Creation
a
Independent variable
(1)
(2)
(3)
(4)
GDP
0.402
0.389
0.299
0.331
(6.168)
(6.022)
(5.046)
(5.469)
Real wages
–0.050
–0.031
–0.033
–0.040
(–1.014)
(–0.655)
(–0.707)
(–0.837)
Trend
–0.077
(–1.494)
Real exchange rate
0.046
0.043
0.041
0.049
(2.136)
(2.082)
(2.088)
(2.288)
Trade openness
–0.148
–0.079
–0.082
–0.113
(–2.317)
(–1.138)
(–1.230)
(–1.802)
Average reform index
–0.063
(–2.776)
Trade reform index
–0.066
(–2.866)
Capital account index
–0.030
(–2.586)
Summary statistic
R
2
0.377
0.392
0.395
0.387
Adjusted R
2
0.284
0.301
0.305
0.296
N
78
78
78
78
Source: Weller (2000); t statistics are shown in parentheses.
a. The dependent variable for all equations is the first difference of the logs of the number of
occupied persons. The model is a panel, using fixed effects and ordinary least squares estimation, for
data on six countries (Argentina, Brazil, Chile, Colombia, Costa Rica, and Mexico) for the period
1985–98. Independent variables are the first difference of the logs of GDP, the real wage in the formal
sector, an index of the real exchange rate, the ratio of exports plus imports to GDP, and the reform
indexes described in chapter 3. All variables except GDP and wages are five-year averages.
20. These results are consistent with such studies as IDB (1997) and Márquez and Pagés (1998).

125
E M P L OY M E N T A N D E Q U I T Y
of growth, the importance of the impact varies with the base rate of em-
ployment growth. The higher this rate, the smaller the negative impact. Of
course, in so far as the reforms increase growth, this partially offsets the
negative impact of the reforms per se. Nonetheless, the direct effect is clearly
negative. This conclusion holds for both the average reform index and for
trade and capital account reforms. It also holds in both the short and me-
dium run.
Although not shown in the table, other exercises indicate that the nega-
tive impact was especially strong for the manufacturing sector.
21
There are
at least two reasons that the sectoral analyses provide stronger conclusions.
On the one hand, the data are of better quality than for the labor force as a
whole. Also only wage earners are included, such that labor supply factors
are weaker as a determinant of employment creation. On the other hand,
manufacturing is the sector most likely to have been hurt by increased
imports deriving from trade reform.
The impact of the reforms on employment occurred in distinct phases.
As discussed in the previous chapter, investors hesitated to put new money
into big projects in the immediate aftermath of the reforms, especially since
these were frequently accompanied by macroeconomic instability. The re-
sulting uncertainty led them to concentrate on defensive activities, which
included disembodied technological change, cost cutting, downsizing, and
layoffs; this pattern was especially prevalent in the tradables sectors. Only
after the reforms gained more credibility did firms begin to invest and hire
more workers.
Using annual data to examine the pattern of employment in the pre-
reform, reform, and post-reform periods for each of the nine project coun-
tries, Weller confirms that phases existed in employment as well as in
investment.
22
Not surprisingly, the employment patterns were not simple.
While employment generally fell in the immediate aftermath of the re-
forms, particular country characteristics and the international context caused
significant differences. For example, the sequencing of stabilization and
reforms appears to have been important, as were sociopolitical aspects of
domestic conditions at the time the reforms were initiated. The evolution
of the international economy, especially with respect to the availability of
international finance, was also relevant.
21. Weller (2000, chapter 4). For the manufacturing sector, the adjusted R
2
rises from the range of
.22 to .28 shown in table 5-7 to a range of .52 to .60. The size of the coefficients also increases.
22. Weller (2000, chapter 4).

126
E M P L OY M E N T A N D E Q U I T Y
Another factor that has to be taken into account is the previous situa-
tion with respect to employment itself. Three of the four aggressive reform-
ers (Argentina, Bolivia, and Peru) had experienced significant declines in
employment rates prior to the reforms, because of especially difficult inter-
nal conditions that led people to withdraw from the labor market.
23
For
this reason, participation rates surged after the reforms and stabilization,
which stimulated increased employment from the supply side and offset
the expected downturn. The tendency toward lower elasticities and em-
ployment rates could also be counteracted by especially dynamic GDP
growth rates.
Inconsistency between the reforms and the macroeconomic policies
accompanying them further weakened the ability of many economies to
create jobs. An overvalued exchange rate, in conjunction with the trade
opening, stimulated imports, and undermined exports. Firms that pro-
duced import-competing goods were under special pressure, and part of
their initial response was to dismiss workers. In addition, the combination
of reforms and an overvalued exchange rate affected the relative prices of
capital and labor, lowering the former with respect to the latter. The out-
come was an incentive to substitute capital for labor, especially unskilled
labor. This set of issues is better studied at the sectoral level, since not all
sectors were affected in the same way; the analysis will thus be taken up in
the next chapter.
Wages and the Wage Differential
As discussed above, real wages increased in the 1990s in all nine project
countries, with the exception of Argentina where they remained stationary
throughout the decade. This conclusion, however, is based on the behavior
of average wages in the formal sector, and in some cases data are only avail-
able for the capital city or are limited to the manufacturing sector. A great
deal of work is clearly needed to improve the data on remunerations in
general, but our particular concern in this section is to decompose average
wages to see what happened to the remunerations of different categories of
workers. The literature suggests the wage differential is a key link between
labor markets and income distribution.
24
23. The fourth aggressive reformer, Chile, also had a decline in the employment rate, but in this
case it was due to a long-term decline in the participation rate.
24. Bulmer-Thomas (1996); ECLAC (1997); IDB (1998b).

127
E M P L OY M E N T A N D E Q U I T Y
The aim is to study the divergence (if any) in trends between the wages
of high- and low-skill workers. This can be operationalized in several ways;
the most common is by educational level. Weller compares two versions of
an education-based wage gap during the 1990s: (1) the difference between
wages for workers with university education and those with the average
remuneration level of the sample and (2) university graduates versus those
with 7-9 years of schooling (the equivalent of complete primary education,
or perhaps a bit more depending on the educational structure of each coun-
try) (see table 5-8). The second method generally resulted in a larger differ-
ential.
25
An increase in the differential is found in all cases except Costa
Rica, although it is small in Argentina and negligible in Brazil.
Morley uses slightly different periods and compares university gradu-
ates to those having only primary education. His data indicate a similar
pattern with some exceptions.
26
For example, the differentials in Argentina
and Brazil were substantially larger than those shown in table 5-8, and
Chile, like Costa Rica, suffered no increase in the wage gap. These differ-
25. Weller (2000, chapter 6).
26. Morley (2000, chapter 5).
Table 5-8. Wage Differentials by Education Level, 1990s
a
Percent
University graduates vs.
University graduates vs.
average wage
7–9 years of education
Country (period)
Initial year
b
Final year
c
Initial year
b
Final year
c
Argentina (1991–97)
164.3
169.6
218.3
227.9
Bolivia (1989– 96)
235.0
292.9
251.8
506.4
Brazil (1992–97)
380.2
383.5
553.2
553.3
Chile (1990–96)
231.6
247.9
366.1
448.6
Colombia (1988–95)
222.2
261.6
276.7
327.2
Costa Rica (1990–96)
285.0
273.2
323.1
316.7
Mexico (1991–97)
182.1
232.1
160.1
302.2
Peru (1991–97)
220.7
275.0
321.0
403.1
Simple average
240.1
267.0
308.8
385.7
Source: Weller (2000), on the basis of consultant reports.
a. Ratio of average wages of specified groups.
b. Initial year of period indicated for each country.
c. Final year of period indicated for each country.

128
E M P L OY M E N T A N D E Q U I T Y
ences are accounted for partly by the difference in base years for the com-
parisons. Morley’s analysis of Chile is based on the period 1987–96, while
Weller uses 1990–96. The difference was crucial since the wage gap shrank
in the 1987–90 period, only to open up again in the 1990s. Furthermore,
the group used for comparison with university graduates in the Morley
analysis was broader than that used by Weller; it included workers with less
than complete secondary education, rather than primary. Morley also in-
cluded Jamaica, which was excluded by Weller for lack of information.
Finally, Weller used wage earners as the population for analysis, whereas
Morley used the population as a whole. These kinds of differences clearly
affect the results, so care must be taken in interpreting them. Nonetheless,
the majority of trends are similar in the two sources.
Another way to operationalize the wage differential is to compare re-
sults for white-collar and blue-collar workers. Data are available for a num-
ber of countries including Chile, Colombia, Costa Rica, Mexico, and Peru.
Almost all cases show the same pattern as that embodied in the educational
comparisons: white-collar workers received larger wage increases than did
blue-collar workers, again with the exception of Costa Rica.
27
Both of these measures point to a widening gap in wages based on skill
level, which is the opposite of what proponents of the reforms expected.
Theoretical analysis would point to relative prices favoring cheaper capital
over more expensive labor as the main cause of the phenomenon. This
change in relative prices would lead to a substitution of labor by capital
and thus a higher capital-labor ratio. According to data gathered by Morley,
however, relative price trends did not manifest themselves in any consistent
pattern with respect to the capital-labor ratio in project countries. The
ratio rose in Brazil, Chile, Costa Rica, and Mexico in the 1990s, fell in
Argentina, Bolivia, and Peru, and remained about the same in Colombia
and Jamaica.
28
If relative prices do not explain the widening wage gap, one alternative
is firm restructuring that was not associated with skilled labor as a comple-
ment to capital. For example, restructuring that involved increased use of
27. García-Huidobro (1999); Ramírez and Núñez (1999); Montiel (1999); López (1999); Saavedra
and Díaz (1999). There is also some indication of an increased wage gap between small and large
firms, but the differences are not large and information is not available for many countries (Weller,
2000).
28. Morley (2000, chapter 5). Morley’s calculations are based on the Penn Tables. Other project
data shows a somewhat closer relationship, but there still is no strong correlation between the wage
gap and the capital-labor ratio.

129
E M P L OY M E N T A N D E Q U I T Y
outsourcing for services could lead to the employment of more skilled
workers in the tertiary sector and fewer unskilled workers within the firm
itself. The operation of the labor market provides another explanation: the
declining strength of unions probably played a role in some countries, since
less-skilled workers were less likely to be represented by labor unions, as
did policy with respect to the minimum wage, which has frequently been
allowed to lag with respect to the average wage.
Trends in Primary Income Distribution
The income distribution that is most closely linked to outcomes from
the labor market is the primary distribution, which measures income ac-
cruing to the factors of production. The available data mainly consider
labor and to a limited extent capital; we have no data on other factors,
notably land. This distribution, in which the unit of analysis is the indi-
vidual, differs from the household-based measures that are most commonly
cited, and the trends may be different. The primary distribution is the
most relevant, however, insofar as we are trying to understand the impact
of the reforms on distribution, and the operation of the labor market is a
key intervening factor. Note that it does not incorporate the role of unem-
ployment since it includes only those individuals with “earned” income.
29
Table 5-9 shows both primary and household distributions for project
countries, as calculated by Morley from consultant reports.
30
All of the
data come from the household surveys that are now routinely administered
throughout the region. These instruments provide a great deal of informa-
tion on household characteristics and on certain types of income. None-
theless, they have two major flaws in terms of studying the impact of the
reforms on distribution. First, they do not necessarily include all types of
income; for example, profits would not normally be included. Second,
they do not sample the wealthiest groups in society, which we have reason
to believe were primary beneficiaries of the reforms.
31
The analysis below
29. It is extremely complicated to go from primary to household distribution on an empirical basis.
A simulation method for doing so is being used in a joint UNDP/ECLAC/IDB project; see Vos and
others (forthcoming).
30. Morley (2000, chapter 5).
31. Examples of the processes through which this may have occurred include the sale at subsidized
prices of many state firms, one-time gains on the newly reinvigorated regional stock markets, privi-
leged access to newly liberalized financial markets to leverage existing capital, tax reforms that lowered
marginal rates on the highest incomes, high interest rates that benefited holders of financial wealth,
and the use of public money to rescue private sector banks.

130
E M P L OY M E N T A N D E Q U I T Y
thus probably underestimates the impact of the reforms in increasing in-
equality.
We were able to study the primary distribution in only eight of the
nine project countries; data are not available for Jamaica. The Theil index
is used for measuring the primary distribution. (For information on this
index and a comparison with the better known Gini coefficient, see box
5-1.) Three patterns can be distinguished among the cases. A first involves
declining inequality in Chile (in the 1990s), Costa Rica, and Peru. Pre-
reform measures were not available for Chile or Costa Rica, but comparing
the early post-reform years with the latest available observation shows that
Table 5-9. Primary and Household Distribution of Income
Country
Pre-reform
Post-reform
Latest
Primary distribution
a
Argentina
b
.293 (1986)
.268 (1991)
.283 (1996)
Bolivia
b
.668 (1985)
.486 (1989)
.595 (1996)
Brazil
.680 (1985)
.700 (1990)
.710 (1997)
Chile
n.a.
.658 (1987)
.636 (1996)
Colombia
b
.582 (1988)
.596 (1993)
.625 (1996)
Costa Rica
n.a.
.490 (1988)
.478 (1995)
Jamaica
n.a.
n.a.
n.a.
Mexico
.200 (1984)
.270 (1989)
.290 (1996)
Peru
.579 (1985)
.502 (1991)
.485 (1996)
Household distribution
c
Argentina
a
.407 (1986)
.461 (1991)
.486 (1996)
Bolivia
a
.590 (1985)
.430 (1989)
.480 (1996)
Brazil
.590 (1985)
.610 (1990)
.590 (1997)
Chile
n.a.
.560 (1987)
.553 (1996)
Colombia
.516 (1978)
.531 (1991)
.533 (1995)
Costa Rica
.500 (1986)
.466 (1988)
.456 (1995)
Jamaica
d
.436 (1989)
.382 (1993)
.369 (1996)
Mexico
.474 (1984)
.537 (1989)
.540 (1994)
Peru
.519 (1985)
.467 (1991)
.435 (1996)
Source: Morley (2000), on the basis of consultant reports.
a. Theil index. Wide differences in the size of the index for primary distribution are because of the
particular subgroups of the population that were analyzed.
b. Urban only.
c. Gini coefficient.
d. Expenditure rather than income data.

131
E M P L OY M E N T A N D E Q U I T Y
inequality decreased slightly. A second pattern is found in Brazil, Colom-
bia, and Mexico, where inequality increased from the pre-reform period to
the latest year. Again, none of the changes was very large. Finally, Argentina
and Bolivia followed a mixed pattern with a decline in inequality between
the pre-reform and early post-reform period, after which inequality began
to rise again. It is important to stress that these results pertain only to
reforms in the 1980s and 1990s. Both Chile and Argentina suffered sig-
nificant increases in inequality during their reform experiences in the 1970s,
although it is hard to determine whether this arose because of the reforms
per se or the repressive policies of the military governments.
32
Data on trends in household distribution for all nine project countries
are also shown in table 5-9, this time using the Gini coefficient. In the
majority of the cases, the patterns are similar to those for primary distribu-
tion. The most important exception is the continuing increase in inequal-
ity in Argentina in the household data. This difference is likely due to the
fact that the household data capture the impact of unemployment, which
was rising rapidly in Argentina. In addition, Brazil does not demonstrate a
clear trend in household distribution. There is also an earlier observation
for Costa Rica, which indicates that inequality fell throughout the period
as in the primary distribution. Finally household distribution data (of
expenditure) are available for Jamaica; they show greater equality over
the period.
The trends in primary distribution are related to trends in the wage
gap. For the first two groups of countries above, the wage gap generally
behaved in the same way as the distribution measures. That is, the wage
gap shrank in Chile and Costa Rica and income distribution improved.
33
Likewise, the gap widened in Brazil, Colombia, and Mexico, and income
distribution became more unequal. The situation is more complicated for
Argentina, Bolivia, and Peru. These countries experienced very high infla-
tion around the time the reforms were implemented. Theory and empirical
evidence tell us that lowering high inflation will have a positive impact on
distribution because inflation levies a heavy tax on the poorest groups in
society.
34
This factor was at least partially responsible for the one-time im-
provement of distribution in Argentina and Bolivia, after which inequality
32. On distribution in the 1970s, see Berry (1998). On Argentina in the 1970s, see Altimir and
Becarria (1999); on Chile, see Larrañaga (1999).
33. This is according to the Morley data, which differ for Chile in comparison with Weller’s data;
see earlier discussion in the text.
34. Morley (1995, especially chapter 7).

132
E M P L OY M E N T A N D E Q U I T Y
began to increase again, in line with the skill gap. Peru presents a special
case in that the wage gap increased substantially, but the index suggests that
inequality fell slightly. This seemingly greater equality was really less dis-
persion around a declining average income in the 1985–90 period; that is,
everyone was getting poorer.
35
In the 1990s, per capita income growth was
positive although poverty continued to rise.
Box 5-1. Two Measures of Inequality
There are various measures of inequality, all of which are highly correlated. This
chapter uses two measures: the Gini coefficient and the Theil index.
Definitions
The Gini coefficient is a summary statistic derived from the Lorenz curve. This
curve plots cumulative percentages of total income received against cumulative
percentages of income recipients, starting with the smallest income recipient.
The Gini coefficient gives the area between the observed Lorenz curve and the
line of absolute equality as a proportion of the total area under the line of abso-
lute equality. The formal representation is:
G = (N + 1)/N – (2/N)
∑
i
q
i
N is the number of equal-sized groups (for example, income deciles) into which
the population is divided
q
i
is the cumulative share of income received by each group
In principle, the Gini can vary between 0 (perfect equality) and 1 (perfect in-
equality). In practice, it normally varies between around 0.25 and 0.60.
The Theil index is a measure of income inequality within a specific population.
If a population is partitioned in a definite number of groups such that each
individual in the population belongs to one and only one group, the index can be
decomposed into two elements. One component (B) measures the contribution
of inequality between groups’ average incomes to total income inequality. The
other component (W) measures the contribution on inequality within each group
to total inequality. Likely groups would involve education, sector, region, and so
on. The formal representation is:
35. A similar phenomenon, but in a more extreme form, holds for Jamaica. Although no data are
available for primary distribution, household income distribution was improving during a period in
which per capita income was falling.

133
E M P L OY M E N T A N D E Q U I T Y
Further evidence on the process behind the inequality trends can be
obtained by decomposing the Theil index to cast light on sources of in-
equality. Decompositions were carried out for a number of variables: edu-
cation, occupation, age, gender, and rural-urban location. Table 5-10 shows
the education decomposition, which is the most important. The total in-
dexes (which are generally the same as those shown for primary distribu-
tion in table 5-9) are divided into two components: variation in inequality
explained by differences between groups with different levels of education
and variation explained by differences within those same groups; together
T = B + W =
∑
i
y
i
ln(y
i
/p
i
) +
∑
i
y
i
T
i
T is the Theil index for the total population
y
i
is the income share of the ith group
p
i
is the population share of the ith group
T
i
is the Theil index for the ith group
The Theil index varies between 0 ( perfect equality) and log N (perfect inequal-
ity), where N is the size of the population. The index can be normalized to fall
into a 0 to 1 range.
Advantages
The main advantage of the Gini coefficient is that its values are easily interpret-
able. A disadvantage is that different Lorenz curves can have the same Gini coef-
ficient.
The main advantage of the Theil index is that it is decomposable. Its two com-
ponents indicate the sources of inequality.
Differences
For any given distribution of income, the relative level of the Gini and the Theil
would be similar although the Theil has a slightly wider range. The two indexes
give different weights to different parts of the distribution under consideration.
The Gini coefficient gives more weight to the middle part of the distribution,
while the Theil gives more weight to the lowest deciles.

134
E M P L OY M E N T A N D E Q U I T Y
T
able
5-10.
Decomposition
for
Theil
Index
of
Education
P
er
cent
contribution
to
total
variation
Countr
y
T
otal
Theil
V
ariation
within
gr
oups
V
ariation
betw
een
gr
oups
Argentina
1986
1991
1997
1986
1991
1997
1986
1991
1997
0.293
0.268
0.283
73.0
70.9
66.1
27.0
29.1
33.9
Bolivia
1985
1989
1996
1985
1989
1996
1985
1989
1996
0.668
0.486
0.595
88.2
80.0
70.3
11.8
20.0
29.7
B
razil
1985
1990
1997
1985
1990
1997
1985
1990
1997
0.772
0.854
0.809
61.1
61.8
65.0
38.9
38.2
35.0
Chile
1987
1996
1987
1996
1987
1996
n.a.
0.653
0.636
n.a.
100
77.9
n.a.
0
22.1
Colombia
1988
1993
1996
1988
1993
1996
1988
1993
1996
0.432
0.522
0.457
73.3
76.5
63.5
26.7
23.5
36.5
Costa
Rica
1988
1995
1988
1995
1988
1995
n.a.
0.355
0.328
n.a.
68.9
62.6
n.a.
31.1
37.4
Jamaica
1989
1993
1996
1989
1993
1996
1989
1993
1996
0.341
0.26
0.251
96.0
83.2
83.6
4.0
16.8
16.4
M
exico
1984
1989
1996
1984
1989
1996
1984
1989
1996
0.20
0.27
0.29
80.0
77.8
89.7
20.0
22.2
10.3
Pe
ru
1985
1991
1996
1985
1991
1996
1985
1991
1996
0.537
0.435
0.386
87.9
90.6
79.0
12.1
9.4
21.0
Source:
M
orley
(2000),
on
the
basis
of
consultant
repor
ts.

135
E M P L OY M E N T A N D E Q U I T Y
the two must sum to 100 percent. Groups, in this case, were usually de-
fined as those with less than primary education, completed primary school-
ing, completed secondary schooling, and some university education or more.
Differences between average incomes of groups with different educa-
tion levels (for example, average income of university graduates versus that
for people with only primary education) were a significant and rising source
of inequality in this analysis. According to table 5-10, the differences be-
tween groups generally explain anywhere between one-fifth and one-third
of inequality in the primary distribution of income.
36
The share increased
in every country except Brazil and Chile. This evidence is broadly consis-
tent with trends in the skill differential, suggesting that differences in edu-
cation, which have always been an important factor in distribution, have
become even more important in recent years.
According to Morley, the relatively small change in income distribu-
tion in many of the countries seems to result from two offsetting features
of the changing education structure of the labor force and its effect on
labor market outcomes. On the one hand, inequality increased as a greater
share of income went to the most-educated segment of society. The skill-
intensive growth of the 1990s further increased the variance of income
among the educated: post-reform growth created opportunities that were
primarily open to the best educated, not just the well educated. On the
other hand, progressive trends were also at work. Improvements in educa-
tion moved people up the distribution. This is progressive because a smaller
fraction of the labor force was in the lower end of the distribution. It is
especially important because the variance of income among the less edu-
cated was in many cases bigger than it was for the better educated (for
example, greater differences in income among workers in microenterprises
than among those working for large firms). On balance, even in most coun-
tries with rising wage inequality, these various effects just about cancelled
each other out, and the distribution changed less than would have been
expected on the basis of the wage differentials alone.
37
As important as wage differentials and intergroup inequality were,
Morley indicates that they only explained about one-third of total income
variance. That means that two-thirds must have come from other sources.
Some of these sources are captured in the other decompositions that were
36. Jamaica has a lower level of between-group variation, probably due to the use of expenditure
rather than income data. Expenditure data are known to be more equally distributed than those for
income.
37. For more details on this argument, see Morley (2000, chapter 5).

136
E M P L OY M E N T A N D E Q U I T Y
carried out. Differences in average income across occupational groups proved
to be the second largest source of inequality after education, accounting for
anywhere from 20 to 38 percent of the total. Although each of the country
studies had a different breakdown of occupations, the typical one included
owners or employers, employees, self-employed or the informal sector, and
in some cases also government and agriculture. Thus, for example, if the
average income of employers increased in comparison to employees, this
would increase between-group variance. Of the seven countries with data
available with respect to occupation, all saw an increase in between-group
variance in the 1990s, although the change was small in Brazil and Colom-
bia; data are unavailable for Chile and Jamaica.
38
Gender and urban-rural location do not appear to have been impor-
tant sources of inequality; each accounted for less than 10 percent of the
total despite big differences in income between groups. Although this re-
sult contradicts some studies that focus on the importance of urban-rural
differentials, it is due to the way that the Theil index is calculated. The
small share of women in the work force and of the rural population in the
total population holds down the between-group variance.
The case study on Argentina combined the various factors just dis-
cussed into a single analysis, to arrive at the cumulative impact of between-
group variance in education, occupation, age, and sector. Each was added
after taking account of the impact of those already in the analysis. Together,
they explained 48 percent of the variance in inequality among the entire
work force of Greater Buenos Aires in 1986 before the reforms and 58
percent in 1997. When the population was limited to wage earners, the
percentages were five to seven points higher.
39
The most important result of the decomposition analysis was to rein-
force the importance of educational differences in creating inequality, as
already suggested in the behavior of the education-based skill gap. Addi-
tional evidence on this effect comes from special studies carried out by
project consultants on the top income groups in the household surveys.
According to Morley’s analysis of these studies, decomposition of the Theil
index between university graduates and all others showed that the contri-
bution of the university group to overall inequality was so great that it
completely offset favorable trends in the rest of the population. Put an-
other way, earnings inequality would have declined in every country, with
38. Morley (2000, chapter 5).
39. Altimir and Beccaria (1999).

137
E M P L OY M E N T A N D E Q U I T Y
the possible exception of Argentina, had it not been for increased inequal-
ity within the university group and between it and everyone else.
40
The Impact of the Reforms on Household
Income Distribution
The more extensive data that exist on household distribution, in com-
parison with primary distribution, enable us to move beyond before-and-
after analysis and to estimate directly the impact of the reforms on equity.
To do so, Morley constructed a regression model for the nine project coun-
tries (plus seven others) for the period 1970–95.
41
The strategy was to build
a model based on variables identified in the literature as affecting distribu-
tion and then to add the reform indexes (see table 5-11).
In contrast to almost all other studies, Morley finds evidence of the
existence of a so-called Kuznets curve.
42
This is the inverted U-shaped curve
discovered by Simon Kuznets in the 1950s to fit the relation between in-
come and its distribution in the United States and Britain. Kuznets argues
that on the way up the income curve, distribution becomes more unequal,
while beyond an inflection point, inequality falls. A representation of the
basic Kuznets curve is shown in figure 5-2.
Two trend terms in the model describe changes in the shape of the
Kuznets curve. The first, which is in the intercept of the equations, is nega-
tive and significant, suggesting a downward shift of the curve over time;
this is progressive since inequality does not rise as much in the period of
increasing inequality. This process is illustrated by the shift between curves
(1) and (2) in figure 5-2. The second trend term, which interacts with the
income term itself, is positive and significant. The interpretation here is
that the left-hand slope of the Kuznets curve becomes steeper over time,
while the right-hand side becomes flatter and the inflection point shifts to
the right. Growth becomes less progressive, since countries encounter greater
inequality in the early years and it takes them longer to reach the positive
part of the curve. This change is illustrated in curve (3).
The regression model reinforces the previous discussion about the
importance of education and its unequal impact on remunerations, de-
40. Morley (2000, chapter 7).
41. The other seven were the Dominican Republic, Ecuador, El Salvador, Honduras, Paraguay,
Uruguay, and Venezuela (Morley, 2000, chapter 4).
42. (Kuznets, 1955). The reason that this study differs from others with respect to the Kuznets
curve is that it has a much larger number of observations and covers a longer period of time.

138
E M P L OY M E N T A N D E Q U I T Y
Table 5-11. Determinants of Gini Coefficient of Income Inequality
a
Independent variable
(1)
(2)
Income
–0.0001
–0.0001
(–7.971)
(–7.246)
1/income
–336.4263
–251.9830
(–4.002)
(–3.394)
Inflation
0.0138
0.0165
(1.703)
(1.979)
University education
–0.0039
–0.0093
(–1.381)
(–3.564)
Primary education
0.2311
0.1441
(3.258)
(2.032)
Trend
–0.0030
(–3.176)
Trend * income
0.0000
0.0000
(7.146)
(5.780)
Average reform index
0.0633
(2.900)
Privatization index
0.0604
(3.011)
Tax reform index
0.0514
(2.717)
Financial reform index
–0.0228
(–2.337)
Capital account index
–0.0156
(–0.918)
Trade reform index
0.0282
(1.620)
Urban sample dummy
–0.0320
–0.0305
(–6.704)
(–6.325)
Expenditure survey dummy
–0.0838
–0.0813
(–2.862)
(–2.726)
ECLAC survey dummy
–0.0530
–0.0523
(–9.448)
(–9.565)
Household survey dummy
–0.0154
–0.0132
(–3.018)
(–2.729)
Summary statistic
R
2
0.976
0.979
Adjusted R
2
0.973
0.976
Number of observations
262 262
Source: Morley (2000); t statistics are shown in parenthesis.
a. The dependent variable is the Gini coefficient. The model is a panel, using fixed effects and
ordinary least squares estimation for data on seventeen countries, for the period 1970–95. Indepen-
dent variables are GDP per capita; the inverse of GDP per capita; a dummy for inflation (1 if over
1000 percent per year, otherwise 0); percent of population with university education; percent of
population with less than primary education; a trend term; a trend term multiplied by GDP per
capita; the current level of the reform indexes (described in chapter 3); and dummies for urban only
sample, expenditure rather than income data, samples where ECLAC was the source, and household
rather than individual data.
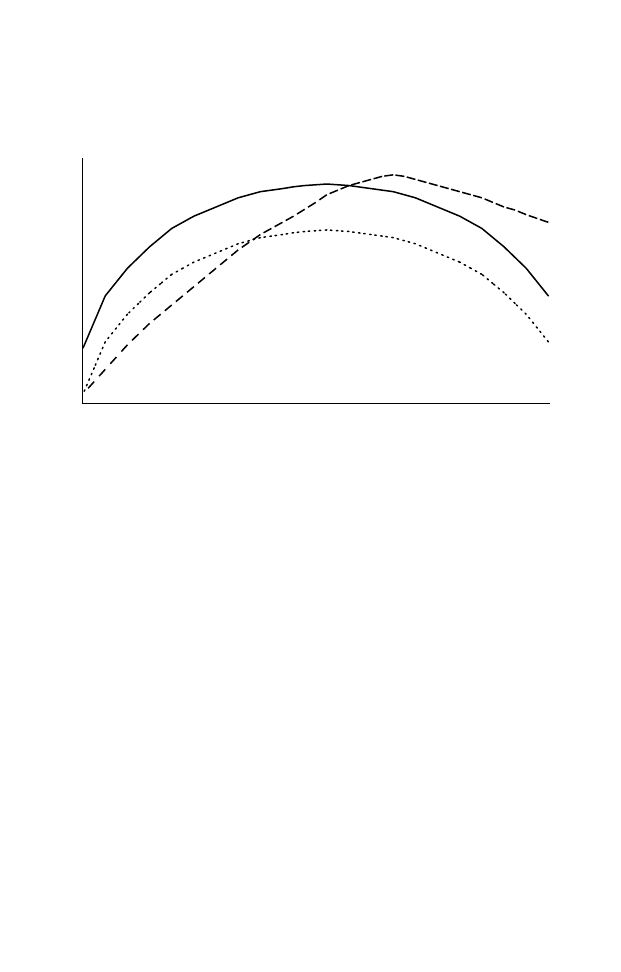
139
E M P L OY M E N T A N D E Q U I T Y
pending on the amount of education an individual has. A low level of
education (no more than primary schooling) has a large negative effect
on income distribution. The higher the share of such people in a society,
the more unequal the distribution will be. Conversely, university educa-
tion is progressive, but the effect is much less important than the low-
schooling variable.
The model suggests that inflation is regressive, at least at very high
levels. Inflation episodes of over 1000 percent have a negative impact on
distribution. This is consistent with the point made earlier that ending
hyperinflation in several countries may have helped lower inequality, at
least in the short run. Lower levels of inflation do not seem to have much
impact on inequality.
The distribution of land is the model’s only measure of asset distribu-
tion. This variable is significant only with the use of a random effects model
(which has a single intercept for all countries). In that case, the unequal
distribution of land in Latin America has a negative impact on the distri-
bution of income, as would be expected. If a fixed effects model is used, the
Figure 5-2. Examples of Kuznets Curves
Inequality
Income
a. Basic Kuznets curve.
b. Kuznets curve modified by trend term in intercept.
c. Kuznets curve modified by trend term interacting with income.
Curve 3
c
Curve 1
a
Curve 2
b

140
E M P L OY M E N T A N D E Q U I T Y
individual country intercepts appear to absorb the effect of land distribu-
tion, and the variable loses its significance.
43
With respect to the impact of the reforms on the level of the Gini
coefficient, the equations indicate that the overall reform variable had a
small, but negative, effect on distribution. This confirms the qualitative,
case-study evidence from sources such as Bulmer-Thomas and Berry.
44
The
size of the coefficient on the overall reform index means that increasing the
index by 10 percent would increase the Gini coefficient by two thirds of a
percentage point.
Two notes of caution need to be added about the impact of the re-
forms. First, when we discuss the effects of the reforms, other variables are
being held constant. If the reforms increased the growth rate or lowered
inflation, as they seem to have done in some countries, the positive effect
of those two factors may have outweighed the direct negative effect of the
reforms themselves. Second, some of the individual reforms may have had
different, offsetting impacts, such that particular reform packages may have
produced different effects depending on which components were imple-
mented. This finding draws into question the frequent assumption in the
literature that the reforms were a mutually reinforcing package. Clearly
this was not the case with respect to income distribution.
45
To further study this last point, Morley disaggregates the overall re-
form index into the five components presented in chapter 3: trade liberal-
ization, domestic financial liberalization, capital account opening, tax
reform, and privatization. Interpreting the impact of the individual reforms
is complicated. To enlarge the sample, surveys with different characteristics
were used, including some surveys that cover only urban areas, together
with others that are based on a national sample. A dummy was included in
the equations in the case of an urban-only sample to capture the difference.
The dummy was always significant and negative, meaning that inequality
was lower in urban areas than in a country as a whole. This then provides
three possible sets of observations: urban only, national, and a combina-
tion of the two (including the urban dummy). The model presented in
table 5-11 is the combined sample.
While the three samples give relatively similar results for the aggregate
reform index, they provide quite different results for the individual re-
43. Other variables, including inflation and higher education, also have a larger impact if individual
country coefficients are not incorporated into the model.
44. Bulmer-Thomas (1996); Berry (1998).
45. See the correlation matrix of the individual reforms in chapter 3 (note 7).

141
E M P L OY M E N T A N D E Q U I T Y
forms. That is, at least some of the individual reforms appear to have be-
haved differently in urban and rural settings. Table 5-12 summarizes the
outcomes. Three of the reforms provide consistent results across the three
samples: trade liberalization and tax reform were always regressive, and
capital account opening was always progressive. In some cases, the coeffi-
cients are statistically significant, while in other cases they are not. Domes-
tic financial reform and privatization appear regressive in two of the three
samples, but each is progressive in one sample, suggesting that we really do
not know enough about these two reforms to make a judgment.
The regressive impact of tax reform is not at all surprising. Tax reform
was defined to involve lowering the maximum rates on personal and cor-
porate taxes and shifting from direct to indirect (value added) levies. Even
though evidence suggests that tax evasion is prevalent in Latin America,
some taxes were paid at the high rates, so that the shift in types and rates of
taxes would be expected to increase inequality.
46
If this led to more invest-
ment and jobs, as argued by supply-side economists in the United States,
such an effect would be captured in other variables.
The effect of trade reform on income distribution is more controver-
sial. While Londoño and Székely, for example, find a positive relation be-
tween trade reform and equality, Morley’s results are consistent with other
studies in finding a negative relation.
47
In particular, trade reform appears
46. ECLAC (1998b).
47. Londoño and Székely (1997). There are several differences between the Londoño and Székely
analysis and the one reported here: they use only urban samples, they cover a much shorter time
period, and they do not include other variables in their equations. Hence, the different results are not
surprising. Other studies that find a negative relation include Robbins (1996) and, to some extent,
Spilimbergo, Londoño, and Székely (1997).
Table 5-12. Impact of Individual Reform Indexes on
Household Income Distribution
Type of reform
Combined sample
Urban sample
National sample
Import liberalization
Regressive
Regressive
Regressive*
Capital account opening
Progressive
Progressive *
Progressive*
Tax reform
Regressive*
Regressive
Regressive*
Domestic financial liberalization
Progressive*
Regressive*
Regressive
Privatization
Regressive*
Progressive
Regressive
Source: Morley (2000).
* Significant at 1 percent level.

142
E M P L OY M E N T A N D E Q U I T Y
to be more regressive in the national than in the urban regressions, suggest-
ing that the negative effect on agriculture of the loss of protection and
subsidies was more significant than the loss of protection in manufactur-
ing. As was discussed earlier in this chapter, it was expected that trade open-
ing would favor unskilled labor in general and agriculture in particular,
which would have improved distribution; we have already seen that this
did not happen.
Finally, opening the capital account appears to have been progressive.
This particular reform has received little attention to date, so we do not
have any results to compare. One way in which increased foreign capital
would affect distribution would be through lowering interest rates in the
domestic market as larger firms go abroad to seek funds. Another mecha-
nism involves reducing the profit rates (consistent with other results on
factor distribution) of local entrepreneurs and financial institutions. Whether
it would also have the additional progressive impact of increasing the de-
mand for labor depends on the type of foreign capital and the response of
local firms.
The Impact of Social Expenditure on Equity
Given the extraordinarily high degree of inequality in Latin America
and the Caribbean, many proponents of the reforms have looked to gov-
ernment social expenditure, particularly on education and health, as a way
to mitigate inequality. Such expenditure would have the added advantage
of simultaneously promoting growth by improving the quality of the labor
force. To close this chapter then, we examine the evolution and impact of
social expenditure. The analysis is not easy: appropriate data are scarce, and
they are generally not comparable across countries. Nonetheless, we can
obtain some initial insights into the question at hand; a more detailed analysis
must await better information.
In chapter 3, we found that social spending increased in all nine project
countries in the 1990s in comparison with the previous decade. Nonethe-
less, as seen in table 5-13, priorities varied across countries in terms of
human capital expenditure (that is, education and health) versus other types
of expenditure (in particular, social security). The distinction is important
since education (especially primary education) and health are the most pro-
gressive types of expenditure in that a large share goes to low-income fami-
lies. Social security benefits, in contrast, go mostly to middle-income

143
E M P L OY M E N T A N D E Q U I T Y
T
able 5-13.
Social E
xpenditur
e on H
uman Capital, 1990–97
Education
a
H
ealth
a
H
uman
capital
b
Shar
e
of
social
expenditur
e
c
Countr
y
1990–91
1996–97
1990–91
1996–97
1990–91
1996–97
1990–91
1996–97
H
igh
spending
d
Argentina
2
2
8
3
3
4
2
7
4
3
6
2
5
0
2
6
9
6
41.1
44.3
B
razil
e
55
43
115
89
170
132
35.7
23.2
Chile
8
9
1
6
7
7
2
1
2
8
1
6
1
2
9
5
35.5
40.8
Costa
Rica
1
1
3
153
f
174
193
f
287
346
f
64.6
62.8
f
M
edium
spending
d
Colombia
7
0
1
1
3
2
6
9
5
9
6
2
0
8
52.7
53.3
Jamaica
1
1
4
132
f
61
6
4
f
175
196
f
74.5
80.2
f
M
exico
1
1
3
1
5
3
1
4
1
g
164
g
254
317
89.9
90.1
Lo
w
spending
d
Bolivia
2
8
5
9
1
1
1
4
3
9
7
3
71.4
61.2
Pe
ru
3
1
3
7
1
0
8
4
1
4
5
n.a.
55.3
Si
mple
av
erage
9
3
132
9
8
124
192
257
58.2
56.8
Source:
M
ostajo
(2000),
on
the
basis
of
ECL
A
C’
s
Social
Dev
elopment
Division
database.
a.
E
xpenditur
e
in
1997
dollars.
b.
S
um
of
education
and
health.
c.
H
uman
capital
as
a
shar
e
of
social
expenditur
e.
d.
Ranked
accor
ding
to
total
social
expenditur
e
(see
table
3-8).
e.
O
nly
includes
central
(federal)
go
vernment.
f.
Only
1996.
g.
Includes
social
security
.

144
E M P L OY M E N T A N D E Q U I T Y
groups.
48
Consequently, an initial, very broad indicator to analyze the dis-
tributive impact of social spending is the allocation among different uses.
Table 5-13 indicates that per capita spending on education and health
rose in almost all countries in the 1990s. The largest increase was in Co-
lombia, with a 117 percent rise; Chile and Bolivia also had large increases
of 84 and 87 percent, respectively. Human capital as a share of social ex-
penditure followed a different pattern: countries with a tradition of high
social expenditure had large social security programs and thus high expen-
ditures in this area; they had a correspondingly smaller share devoted to
human capital. This pattern held for all project countries except Costa
Rica. In Argentina, Brazil, and Chile, less than half of social spending was
on human capital, while in the medium- and low-expenditure countries
(plus Costa Rica) the majority was devoted to this purpose. Since Mexican
statistics combine health and social security expenditures, it is impossible
to make such a comparison. If we assume that education and health expen-
ditures were approximately equal, then Mexico would fit in the second
group with a high share of human capital in social expenditure. Compar-
ing the early and late 1990s, human capital as a share of social spending
rose in five of the eight countries with information available, although the
simple average fell slightly from 58 to 57 percent.
Going beyond the share allocated to human capital, figure 5-3 pro-
vides a more specific measure of the redistributive impact of primary edu-
cation and health spending for eight of the nine project countries. (No data
are available for Mexico.) Based on an index of concentration, which shows
the ratio of social spending directed to the poorest 20 percent of the popu-
lation compared to the richest 20 percent, the figure demonstrates that
primary education is more focused on the poor than is health. In addition,
it shows the very wide range of behavior with respect to spending in the
two areas; this diversity is found both across countries and between the two
types of expenditure. In the case of Colombia, for example, spending on
health is regressive (the concentration index is around 1) while primary
education spending is very progressive (an index of nearly 9). Argentina is
equally redistributive in both areas since both indexes are around 8.
Table 5-14 provides more detailed evidence on the behavior of total
social spending in the four project countries with data available (Argen-
tina, Brazil, Chile, and Colombia). The first indicator is a targeting index,
which compares the amount of social expenditure received by poor groups
48. See discussion in ECLAC (1999c).
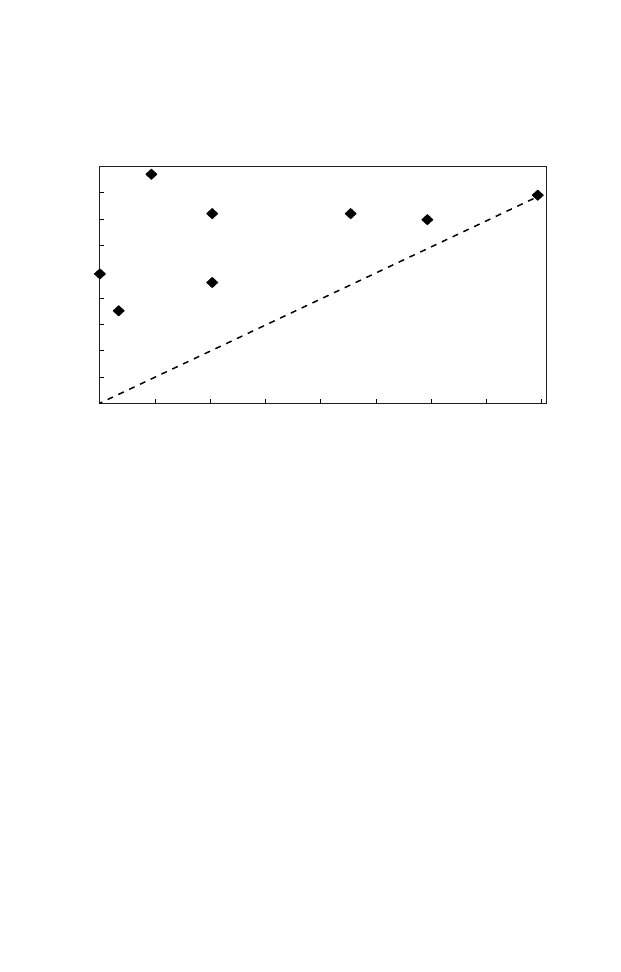
145
E M P L OY M E N T A N D E Q U I T Y
of the population (according to individual country standards) compared
to their share in the population as a whole. Although the data indicate that
some redistribution occurred, the country with the highest share still did
not reach a level of 2, which would mean that the poor received twice the
expenditure as the average citizen. In general, all countries were somewhat
redistributive, but there is still space for greater targeting if countries desire
to follow such a policy.
The second measure in the table is the concentration index discussed
earlier. On this measure, Chile stands out with spending directed to the
bottom quintile representing more than seventeen times the share to the
top quintile, whereas the others range between two and three times. High
concentration of social expenditure among low-income groups in Chile
did not result from a much higher share of social expenditure going to
the lowest quintile. The main determinant was the small share going to
the top quintile in comparison with other countries (2 percent and 12
percent respectively). Argentina and Brazil present fairly similar distribu-
Figure 5-3. Index of Concentration: Primary Education and Health
a
Primary education
Source: Mostajo (2000), based on country studies.
a. Ratio of benefits of bottom 20 percent to top 20 percent.
b. No information available on health.
1
2
3
4
5
6
7
8
1
2
3
4
5
6
7
8
Colombia
Jamaica
b
Costa Rica
Bolivia
Peru
Chile
Brazil
Argentina
Health
45˚

146
E M P L OY M E N T A N D E Q U I T Y
tions of social expenditure, although the former is relatively more pro-
gressive since a smaller share goes to the top two quintiles. Colombia
shows the least progressive situation among the four countries; the lowest
quintile receives the smallest share in the sample, while the top quintile
receives the largest.
49
The third indicator shows the percentage of total social expenditure
received by groups defined as poor in each country. The share varies be-
tween about one-fourth and one-half of the total. While this indicator needs
to be considered in conjunction with the share of the population that is
poor in each country (the ratio shown in the targeting index), it nonethe-
less is useful in demonstrating the potential for additional targeting of so-
cial expenditure.
In terms of the distributive impact, table 5-15 shows that social expen-
diture significantly increased household incomes of the lowest quintile.
The effect on incomes ranged from 41 percent in Colombia to 142 percent
in Argentina, with an average of 87 percent. In other words, calculating the
monetary equivalent of the benefits provided through the social programs
and adding them to the autonomous income of the households, social spend-
ing has significant impact on the welfare of the poorest 20 percent of the
Table 5-14. Redistributive Impact of Social Expenditure, 1990s
Share of social
Targeting
Concentration
expenditure received
Country (year)
index
a
index
b
by the poor (percent)
c
Argentina (1998)
1.8
3.4
23.6
Brazil (1994)
d
1.5
3.0
48.1
Chile (1996)
1.9
17.3
37.6
Colombia (1992)
1.3
1.9
56.3
Simple average
1.6
6.4
41.4
Source: Mostajo (2000), based on country studies.
a. Ratio of the percent of social expenditure received by the poor to the percent of the poor in the
population.
b. Ratio of the percent of social expenditure received by the poorest 20 percent of the population to
the percent of the social expenditure received by the richest 20 percent.
c. The definition of the poor varies by country.
d. Data include only the state of São Paulo.
49. Mostajo (2000), based on country studies (Government of Argentina, 1999; Government of
Chile, 1998; IPEA, 1999; and Vélez, 1996).

147
E M P L OY M E N T A N D E Q U I T Y
population. For example, social benefits accounted for 31 percent of total
consumption of this quintile in Colombia and 54 percent in Argentina.
Social expenditure also had a positive impact on income distribution,
reducing the gap between the income of the highest and lowest income
quintiles. Without social expenditure, the income of highest quintile on
average among the four countries would have been sixteen times higher
than that of the lowest quintile; with social expenditure the ratio fell to
nine. Concentration of social expenditure on the lowest quintile explains
most of the reduction of the gap, independently of the characteristics of
the income distribution in the country. The largest reductions in the gap
occurred in Argentina and Brazil. This positive impact of social spending
resulted mainly from expenditure on education and health, which accounted
for about 75 percent of total expenditure received by low-income groups.
50
Based on the meager data we have, then, the picture is heterogeneous
across countries: some countries appear to have done better than others in
distributing social expenditure in a progressive way. This depends partly
Table 5-15. Impact of Social Expenditure on Income Distribution, 1990s
Top quintile income/lowest quintile income
Increase in the
Excluding
Including
income of the
social
social
lowest quintile
Country (year)
expenditure
expenditure
(percent)
Argentina (1998)
14.2
6.1
142.2
Brazil (1994)
a
24.6
12.6
97.6
Chile (1996)
14.8
8.9
68.0
Colombia (1992)
11.0
7.9
41.2
Simple average
16.2
8.9
87.3
Source: Mostajo (2000), based on country studies.
a. Data include only the state of São Paulo.
50. Mostajo (2000), based on country studies. These results do not appear as positive when Latin
American countries are compared with other regions of the world. Even including social expenditure,
the average gap in the four countries in table 5-15 is larger than the gap excluding social expenditure
in middle-income countries such as Ireland, Israel, and Spain or low-income countries such as India
and Indonesia. The average income gap excluding social expenditure was 5 in the former and 6 in the
latter. In Malaysia and Thailand, the relative shares were 12 and 9 before social expenditure, still well
below the Latin American level (calculated from World Bank, 2000). For a more extensive compari-
son of inequality across regions, see Stallings, Birdsall, and Clugage (2000).

148
E M P L OY M E N T A N D E Q U I T Y
on the historical evolution of social spending programs in each case. Those
with a longer trajectory tended to have large social security systems that
drained money from other, more progressive functions. Even given these
historical constraints, however, some countries have done more than oth-
ers in targeting spending on lower-income groups.
We have no systematic quantitative data about how the distributional
impact of social spending was affected by the reforms, but qualitative in-
formation provides some insights. Targeting of social policies in the 1970s
and 1980s was weak. In most countries, social expenditure was either purely
compensatory or closely linked to social benefits to employees in the for-
mal sector. In both cases, institutional fragmentation, poor management,
and the action of interest groups led to inefficiency in the allocation of
expenditure.
51
In the 1990s, many governments became more concerned
with the issue of poverty alleviation and tried to increase the targeting of
social spending.
52
At the same time, it would appear that the share of primary education
and basic health expenditures have declined in importance over the course
of the decade. Of the five countries for which calculations can be made
(Bolivia, Chile, Colombia, Costa Rica, and Jamaica), all except Costa Rica
experienced a fall in the share of these indicators as a share of total social
expenditure per capita between 1980-81 and the latter part of the 1990s.
53
This falling share, in the face of higher per capita spending, may represent
backsliding in terms of poverty alleviation, although it may also indicate
that governments are trying to respond to multiple demands with limited
resources. Governments tend to perceive a tradeoff within social expendi-
ture between poverty alleviation (which would imply increased spending
on basic services, which are far from universally available) and greater com-
petitiveness for the economies (which would point to greater spending at
the secondary and university levels of education). While some experts have
51. Mostajo (2000), based on country studies.
52. Many official government statements point in this direction. For example, the Chilean Minis-
try of Planning and Cooperation says: “Social expenditure was more selective [in 1990–96] with a
stronger concentration on the poorest sectors in the country. In addition to a general increase in
resources allocated to social expenditure, targeting has increased” (Government of Chile, 1996, p.
232). Similarly, the Argentinean government says: “Public social expenditure is concentrated on the
sectors with the lowest income and it is progressive, a characteristic that was strengthened between
1996 and 1998” (Government of Argentina, 1999, p. 14). Authors’ translation.
53. These figures are calculated on the basis of table 3-8 from chapter 3 and table 10 in Ganuza,
León, and Sauma (1999). The latter reports on a recent study of social expenditure sponsored by the
United Nations Development Program (UNDP), ECLAC, and UNESCO.

149
E M P L OY M E N T A N D E Q U I T Y
argued that no such trade-off exists, the perception remains an impedi-
ment to greater targeting of expenditure.
54
In summary, our evidence on the distributive impact of social expendi-
ture points to three conclusions. First, based on data for four of the nine
project countries, it would appear that social expenditure had a strong re-
distributive impact. The poor generally received a large amount of social
expenditure on basic services, which substantially reduced the income gap
between rich and poor. Nonetheless, there is still substantial scope for in-
creased targeting. Second, we have no direct evidence on whether the trend
toward a large share for the poor was strengthened as a result of the re-
forms. Since qualitative evidence suggests that targeting increased in the
1990s, and special attention was paid to reducing poverty, it seems likely
that the redistributive impact of expenditure also increased. At the same
time, the need for greater competitiveness as a result of the reforms stimu-
lated the concern to improve human capital in Latin American and Carib-
bean countries. Third, much remains to be done in terms of improving the
stock of human capital. In addition, given the very high levels of income
concentration in the region, improving distribution via social spending
and other means has become an end in itself in a number of countries.
Conclusions
This chapter has shown that both employment and equity trends in
the 1990s are a source of concern. While the elasticities of employment
creation with respect to GDP growth were about the same as the average
for the postwar period as a whole, GDP growth was slower, and therefore
employment growth also declined, especially with respect to wage earners.
This was partly due to supply factors, since the increase in the economi-
cally active population slowed from its peak in the 1970s, but demand was
also slack and volatile in many countries. The quality of new jobs suffered
as well. The substantial majority (six of ten) were in microenterprises or
self-employment. While good jobs can certainly be found in both of these
categories, the bulk are characterized by low productivity and low wages,
and they frequently lack access to benefits. The reforms were not able to
change secular trends; perhaps it was naïve to expect that they would. In-
54. On this argument, see Birdsall, Graham, and Sabot (1998). Their book is indeed titled Beyond
Tradeoffs.

150
E M P L OY M E N T A N D E Q U I T Y
deed, they may have exacerbated problems by increasing the heterogeneity
in the labor market.
With respect to equity, the trends are less clear. Our evidence suggests
that little change occurred as a result of the reforms, but that evidence is
based on incomplete data. In particular, the data leave out the very group
that is likely to have benefited most: namely, the wealthiest in society. What
our data do enable us to say is that educational differences became more
significant as a result of the reforms (and of technological progress more
generally). This translated into special opportunities for the best educated,
and it was reflected in a growing skill premium between the best educated
and others. Other factors were also at work, including demographic trends,
the end of hyperinflation, and some progressive aspects of education. These
frequently offset the regressive impact of wage differentials. While govern-
ments’ social expenditure ameliorated inequality in the region to some ex-
tent, it still remains the highest in the world.
Within this overall picture, countries displayed important differences
with respect to employment and equity, just as they did in the areas of
investment, productivity, and growth. The good performers were not al-
ways the same as in the previous analysis, however, and the pattern was far
more complex. The attempt to characterize the heterogeneity across the
nine project countries on labor and equity measures during the 1990s led
to the definition of four groups. Chile and Costa Rica showed a relatively
positive performance on both variables, while Argentina, Brazil, and Co-
lombia suffered setbacks on both. In Bolivia and Mexico, strong employ-
ment growth was unable to prevent increased inequality, but in Jamaica
and Peru mediocre labor market performance was accompanied by lower
inequality.
These patterns were related to the reforms, but also to many other
factors, economic and social, historical and contemporary, which are be-
yond the scope of this book. The econometric evidence discussed earlier
suggested that the reforms had a negative (if small) impact on both em-
ployment and equity. Argentina, Brazil, and Colombia were examples of
this prediction. All three began their reforms in the 1990s, so they had
little time to put a new economic model into operation during the decade.
More important, macroeconomic policies in the three countries were fre-
quently inconsistent with the reforms, leading to substantial uncertainty
among potential investors. This resulted in volatile growth, which had nega-
tive implications for employment and thus for equity.
Chile and Costa Rica, by contrast, were able to offset any negative

151
E M P L OY M E N T A N D E Q U I T Y
impulses coming from the reforms through stable macroeconomic policies
that helped promote investment and growth. (Clearly we are referring to
Chile in the 1990s; during the first fifteen years of Chilean reforms, both
employment and equity showed highly negative trends.) Steady growth led
to relatively satisfactory employment growth with an emphasis on wage
jobs, constant or declining rates of unemployment, and moderate or high
growth of productivity and salaries. The shrinking wage differential helped
produce greater equality on the primary distribution measures (and house-
hold distribution in Costa Rica). High levels of social spending also ac-
companied the reforms in the context of a relatively even distribution of
education.
The remaining four cases, where employment and equity variables
moved in opposite directions, have more complicated roots. Bolivia and
Mexico began their reforms in the mid-1980s, and by the early 1990s both
had begun to enjoy quite dynamic rates of job creation. In Mexico, the
financial crisis interrupted the positive dynamic, doubling rates of unem-
ployment and depressing real wages. Although increased growth was be-
ginning to make a dent in these problems by the end of the decade, our
latest distributional measures (to 1996) do not reflect the incipient recov-
ery in the labor market. Bolivia’s case is different, since it was the country
with the most stable growth pattern during the 1990s. The failure of Bolivia’s
strong job creation to produce more progressive distributional trends is
probably linked more closely to the quality of jobs created than to quanti-
tative trends, as in Mexico. Since most of Bolivia’s new jobs were in the
informal sector, heterogeneity increased between these new jobs of a rela-
tively precarious nature and the small number of high-skill jobs. This is
reflected in the especially large increase in the skill premium in Bolivia.
Finally, Jamaica and Peru displayed the anomalous pattern of medio-
cre labor market performance together with increased equality. Labor
market problems in the two countries had different characteristics. Unem-
ployment was typically high in Jamaica, although it did not increase in the
1990s. While job creation was sluggish, it centered on wage jobs with ris-
ing remunerations but stagnant productivity. Peru, by contrast, created a
relatively large number of jobs, but most were in the informal sector; wages
increased until mid-decade but then began to fall. Wages in 1998 were
far below those for 1980. These labor market patterns were combined
with more progressive distribution in both countries, but less dispersion of
income did not necessarily mean greater welfare for the population. The
case of Jamaica is clear, since per capita income fell during the 1990s. A

152
E M P L OY M E N T A N D E Q U I T Y
similar situation was found in Peru between 1985 and 1991. Some im-
provement took place in the 1990s, when the poorer groups in the country
improved their relative position, but poverty continued to increase even
though distribution improved. As the authors of the Jamaica study on in-
come distribution said, “The decline in inequality in Jamaica . . . hardly
provides a lesson for other reforming economies to emulate.”
55
These characterizations are based on aggregate-level data. As a conse-
quence, they can not address many of the factors that would cast light on
both employment and distributional trends, especially differential behav-
ior by size of firm and different characteristics by sector. Sectoral and
microeconomic analyses are necessary to find out what kinds of firms are
creating jobs, how fast they are doing so, and how productivity and wages
vary across types of firms. After examining such data in the next chapter,
we will be in a better position to explain the complex relations between the
reforms, employment, and equity and to make policy recommendations
for improvements.
55. King and Handa (2000).

153
H E T E RO G E N E I T Y I N R E S P O N S E S O F S E C TO R S A N D F I R M S
153
6
Heterogeneity
in Responses of
Sectors and Firms
A
basic tenet of the analytical framework presented
in chapter 1 is that the impact of the economic
reforms on growth, employment, and equity depends on the way in which
they modify firm behavior regarding investment and the incorporation of
technological progress. After studying the impact of the reforms at the ag-
gregate level in the previous two chapters, we now turn to the behavior of
economic actors in response to the reforms, identifying the most impor-
tant determinants of their actions and their main effects.
1
Although the reforms did not aim at promoting specific sectors or
firms, neither were they meant to be neutral. At the sectoral level, expecta-
tions focused on increasing the share of exports in total output and reduc-
ing that of formerly protected sectors. This would be a straightforward
result of moving from import substitution to an export-led growth model.
A central objective of the reforms was to overcome the strong anti-export
bias that had developed under protection policies, because the resulting
trade deficits represented a serious constraint on growth. The long-run
1. This chapter draws heavily on information and analysis developed in Moguillansky and
Bielschowsky (2000), Katz (2000), and Weller (2000), although our conclusions do not necessarily
coincide with those reached in the three works.

154
H E T E RO G E N E I T Y I N R E S P O N S E S O F S E C TO R S A N D F I R M S
sustainability of an export orientation would depend to a large degree on
whether the reforms could overcome, or at least reduce, external constraints
on growth.
Not all kinds of potential exports were expected to benefit equally from
the reforms. Trade liberalization and the phasing out of industrial and agri-
cultural policy, which was believed to have artificially increased labor costs
and reduced the cost of capital, would lead a country to specialize in areas
in which it had comparative advantages. The proponents of the reforms
generally assumed that Latin America’s comparative advantage lay in un-
skilled labor; they therefore predicted two additional outcomes. First, la-
bor-intensive sectors would produce the most dynamic export performance
and, consequently, the most rapid growth and employment creation. Sec-
ond, small firms, which presumably specialize in labor-intensive sectors,
would grow faster than larger ones, which were concentrated in capital-
intensive, protected sectors.
2
The growth of labor-intensive export sectors and the share of small
firms in such sectors are therefore outcomes against which we should assess
the impact of the reforms at the microeconomic level. But that is not the
whole story. The reforms—especially privatization and capital account lib-
eralization—also aimed at reducing the share of government, eliminating
state-owned enterprises, and promoting foreign direct investment (FDI)
flows into the region. As a consequence, subsidiaries of transnational cor-
porations (TNCs) were expected to be increasingly important players un-
der the new rules of the game, providing technological and managerial
skills to improve efficiency in sectors in which countries had comparative
advantages.
The reforms aimed at changing firm behavior, but they were not the
only cause of the changes analyzed in this chapter. As was the case in earlier
sections of the book, firms were also influenced by macroeconomic policy
decisions, the dynamics of the international context, particularly regarding
finance, technology, and demand, and longer-term lagged effects (inertia)
of economic changes that had taken place much earlier. We do not attempt
to isolate the effects of the reforms. Instead, we analyze how growth and
employment at the sectoral and microeconomic levels were influenced by a
2. For example, Balassa and others state: “The proposed measures will be of special benefit to small
and medium-sized businesses, which have particularly suffered the consequences of high protection,
the lack of imported inputs, and price controls. At the same time, such businesses provide a large
potential source of employment creation in Latin America” (1986, p. 94).

155
H E T E RO G E N E I T Y I N R E S P O N S E S O F S E C TO R S A N D F I R M S
combination of the reforms and other, sometimes contradictory, economic
signals.
The analysis begins with an overview of the impact of the reforms on
the sectoral structure of the economy as a whole. We then disaggregate
further, focusing on producers of exportables in the most important tradables
sectors, namely agriculture, mining, and manufacturing.
3
We also discuss
the services sectors that strongly influence the international competitive-
ness of exports, including electricity and telecommunications. These ser-
vices are among the most important areas in terms of the impact of the
privatization reforms. At the microeconomic level, we consider the behav-
ior of specific firms, particularly in highly concentrated sectors with very
few players. The focus of the analysis, however, is on the dynamics of dif-
ferent types of firms defined according to size and ownership, including
subsidiaries of transnational corporations, large domestic firms (usually
part of diversified conglomerates), small and medium-size enterprises, and
state-owned enterprises.
4
The Sectoral Dynamics of the Economy as a Whole
At the most general level, structural change in Latin American produc-
tion was moderate after the reforms. Table 6-1 shows that the tradables
sectors continued their long-term trend of reducing their share in the region’s
economies. They were less important as a share of output in 1998 than
they were before the reforms began. Despite the similar downward trend,
countries demonstrate substantial differences in the share of tradables.
5
Analyzing data for output structure at the single-digit level of the In-
ternational Standard Industrial Classification for the nine countries in 1970,
3. Definitions of tradables versus nontradables sectors vary considerably. In this chapter, we use the
most straightforward definition: all sectors that produce goods are considered tradables, and services
are considered nontradables. This definition presents shortcomings, for example when applied to
tourism, a services sector that is an important source of foreign exchange in several project countries
(Costa Rica, Jamaica, and Mexico). Other services are also becoming increasingly tradable (for ex-
ample, banking and insurance).
4. We do not discuss technological and structural changes within firms. For a detailed analysis of
firm behavior at the plant level in the manufacturing, mining, and telecommunication sectors, see
Katz (2000, chapters 3 and 4). For an analysis of changes within large domestic conglomerates oper-
ating in the manufacturing sector, see Peres (1998).
5. Of the nine project countries, Bolivia, Colombia, and Peru had the highest share of tradables in
1997 (an average of 43 percent of total output among the three); Brazil, Mexico, and Jamaica were at
the opposite extreme (only 28 percent on average), while Argentina, Chile, and Costa Rica were in
between the others (an average of 37 percent).

156
H E T E RO G E N E I T Y I N R E S P O N S E S O F S E C TO R S A N D F I R M S
1980, 1990, and 1997 uncovers only four types of significant, repeated
changes during the period after the reforms: a decline in manufacturing in
Brazil, Chile, Colombia, and Jamaica; an increase in financial services in
Argentina, Chile, Costa Rica, Jamaica, Mexico, and Peru; an increase in
transportation and communications in Bolivia, Chile, Costa Rica, and Ja-
maica; and a decline in government in Bolivia, Brazil, Chile, and Costa
Rica. No comparable data are available for the last category in Argentina
and Mexico.
6
These four changes are linked to the reform process in fairly direct
ways. The decline in manufacturing in the four countries was related to the
trade opening that increased the competition faced by local producers; a
similar phenomenon occurred in Argentina during the first reform phase
in the 1970s. For Mexico, with its large maquila (in-bond) industry, manu-
facturing as a share of total output increased between 1985 and 1997. Like-
wise, the decline in the role of government was compatible with the new
emphasis on the leading role of the private sector. Only in Colombia did
government participation increase after the reform period began. The in-
creased importance of finance, transportation, and communications is a
logical complement to the reform process, since all are necessary for raising
a country’s competitiveness.
Previous chapters highlighted the fast pace at which exports grew, both
in value and in volume, after the early 1980s and particularly in the 1990s.
Table 6-1. Sectoral Value Added as Share of Total Output, 1970–98
a
Simple average in percent
Year
Agriculture
Mining
Manufacturing
Services
b
1970
14.3
5.5
22.5
57.7
1980
12.2
6.0
22.6
59.2
1985
12.6
5.3
21.8
60.3
1990
12.6
5.3
21.3
60.8
1998
11.2
5.1
19.7
63.9
Source: Project database, on the basis of ECLAC statistics.
a. Includes Argentina, Bolivia, Brazil, Chile, Colombia, Costa Rica, Jamaica, Mexico, and Peru.
b. Includes construction.
6. The criterion used to define a significant change was a shift of two or more points of GDP. The
category “other services” was not included, since its content varies substantially across countries.

157
H E T E RO G E N E I T Y I N R E S P O N S E S O F S E C TO R S A N D F I R M S
Unlike the trends observed for output, the sectoral structure of exports
changed significantly in those decades, and different sectoral patterns of
growth clearly emerged within the project countries.
Primary products and semi-manufactures accounted for 89 percent of
the value of Latin American exports in 1970 but less than 40 percent 1998
(including maquila); the other 60 percent was accounted for by manufac-
tured goods, whose share was just 11 percent of the total in 1970 (see table
6-2). These averages hide sharp national differences. They are skewed by
the weight of the largest exporter (Mexico), whose foreign sales are highly
diversified. When Mexico is excluded from the statistics, for example, pri-
mary products and semi-manufactures still accounted for 61 percent of
Latin American exports in 1998, and manufactured exports drop from 60
percent of the region’s total to 36 percent. Maquila exports have played an
important role in Mexico’s boom in manufacturing exports, but that is not
the whole story. When we exclude the maquila from Mexico’s total exports,
the share of manufacturing is still 73 percent, that is, twice the average for
the other eight project countries.
Within manufacturing, traditional industries and natural resource–
based sectors moderately increased their share in total Latin American exports
in 1970–98, while foreign sales from labor-intensive and capital-intensive
industries increased strongly in the 1990s (see table 6-3). Manufactured
goods with higher technological content also represented an increasing share
of manufactured exports. Once more, the dynamics change dramatically
when Mexico is excluded from the statistics. When Mexico is included,
labor-intensive industries grew from less than 4 percent of total Latin
American exports in 1970 to 27 percent in 1998. When Mexico is ex-
cluded, they accounted for only 10 percent in 1997 (see table 6-4). Maquila
exports again played an important role, but do not fully explain the differ-
ence. Capital-intensive industries had more than twice as large a share in
Mexico’s exports in 1998 than in the other eight project countries. The
only other project country that had an export dynamic similar to Mexico’s
was Costa Rica, where labor-intensive manufactures rose from 5 percent of
total exports in 1980 to about 28 percent in 1998. The other seven project
countries diversified their manufacturing exports more in the 1970s and
1980s than in the 1990s.
Mexico’s integration into the North American market (mainly but not
exclusively through maquila exports) gave it a very different export struc-
ture and performance from other large and medium-size countries in the
region. As a consequence, Mexico is the only project country that made a

158
H E T E RO G E N E I T Y I N R E S P O N S E S O F S E C TO R S A N D F I R M S
T
able 6-2.
St
ructur
e of M
exican versus R
egional Expor
ts, 1970–98
a
Percent
of
total
exports
P
rimar
y pr
oducts
Semi-manufactur
es
M
anufactur
es
Year
M
exico
Other
8
T
otal
M
exico
Other
8
T
otal
M
exico
Other
8
T
otal
1970
45.3
53.7
52.6
26.7
37.3
36.0
27.7
8.5
11.0
1980
80.7
38.7
49.8
9.7
37.2
29.9
9.5
23.4
19.7
1985
67.7
36.4
46.7
14.3
35.2
28.3
17.9
27.2
24.1
1990
46.8
30.2
35.0
13.7
37.1
30.4
38.7
30.9
33.1
1998
(including
maquila
)
b
9.9
30.0
19.8
6.5
31.0
18.6
83.2
36.3
60.0
1998
(ex
cluding
maquila
)
b
17.6
30.0
25.4
8.7
31.0
22.9
73.1
36.3
49.7
Sour
ce:
P
roject
database,
on
the
basis
of
ECL
A
C
statistics.
a.
W
eighted
av
erages;
includes
Argentina,
Bolivia,
B
razil,
Chile,
Colombia,
Costa
Rica,
Jamaica,
M
exico,
and
Pe
ru.
T
otals
do
no
t
add
to
100
percent
because
other
expor
ts
ar
e
not
included.
b.
Does
not
include
Jamaica.

159
H E T E RO G E N E I T Y I N R E S P O N S E S O F S E C TO R S A N D F I R M S
significant gain in market share in world exports to the industrialized coun-
tries (see table 6-5). Costa Rica and Chile also increased their market shares,
but at a slower pace than Mexico.
Investment and technical progress are the main long-term forces be-
hind the dynamics of GDP, employment, and export growth. The response
of investment to the reforms at the sectoral level is particularly useful for
identifying specialization and growth trends, which may still be too weak
to be detected at the aggregate level. The extent to which investment trends
point to a strengthening of sectors that produce tradable goods in general
and exports in particular is a key element in our final assessment of the
impact of the reforms.
Analyzing particular sectors and the types of firms operating within
them also enables us to understand the effects of the two reforms that were
most important for aggregate investment trends (namely, trade liberaliza-
tion and privatization). It also makes it possible to determine the degree to
which the dynamism of investment extended to different kinds of firms
(for example, small and large, national and foreign).
The determinants of sectoral investment are found in the interaction
among the economic reforms, macroeconomic policy, and the international
context. Together, these lead to the emergence of new firms, market struc-
tures, and business strategies. The reforms had an especially powerful im-
pact on the emergence of new economic actors and market structures. These
Table 6-3. Structure of Manufacturing Exports, 1970–98
a
Percent of total exports
Natural
Labor-
Capital-
Traditional resource–based
intensive
intensive
High-tech
Year
industries
industries
industries
industries
industries
b
1970
2.7
2.5
3.8
2.1
2.2
1980
5.7
3.0
6.4
4.7
2.6
1985
5.2
5.8
8.2
4.9
2.9
1990
7.1
8.1
9.5
8.4
4.3
1998
c
9.7
5.5
26.9
17.9
21.6
Source: Project database, on the basis of ECLAC statistics.
a. Weighted averages; includes Argentina, Bolivia, Brazil, Chile, Colombia, Costa Rica, Jamaica,
Mexico, and Peru.
b. Includes high-tech labor- and capital-intensive industries already included in the previous two
columns.
c. Does not include Jamaica.

160
H E T E RO G E N E I T Y I N R E S P O N S E S O F S E C TO R S A N D F I R M S
processes reduced barriers to entry, changed the operation of specific mar-
kets through privatization and deregulation, and determined the evolution
of investment.
Investment data at the sectoral level are particularly poor in Latin
America.
7
National statistics are available for only six of the nine project
countries (Bolivia, Brazil, Chile, Colombia, Costa Rica, and Peru), and the
information is not comparable across countries. The coefficient of sectoral
investment as a share of GDP before and after the reforms demonstrate
heterogeneous dynamics (see table 6-6). Investment in tradables sectors
grew significantly in Bolivia, Chile, Colombia, and Costa Rica, while it
decreased in Brazil and Peru. In manufacturing, the coefficients doubled in
Chile and improved significantly in Costa Rica.
The sectoral structure of investment also showed very heterogeneous
behavior.
8
Overall, tradables accounted for only one-fifth to one-third of
Table 6-4. Structure of Mexican versus Regional Manufacturing Exports,
1970–98
a
Percent of total exports
Labor-intensive
Capital-intensive
High-tech
industries
industries
industries
b
Year
Mexico
Other 8
Mexico
Other 8
Mexico Other 8
1970
11.7
2.6
6.7
1.4
7.6
1.4
1975
9.1
6.2
7.7
4.0
5.1
2.7
1980
3.1
7.5
3.6
5.1
1.4
3.0
1985
10.6
7.1
3.3
5.7
2.4
3.2
1990
14.3
7.6
15.2
5.7
5.6
3.7
1998
(including maquila)
c
43.6
9.7
23.4
12.2
36.8
6.1
1998 (excluding maquila)
c
23.9
9.7
31.6
12.2
19.9
6.1
Source: ECLAC, on the basis of official statistics.
a. Weighted averages. Includes Argentina, Bolivia, Brazil, Chile, Colombia, Costa Rica, Jamaica,
Mexico, and Peru. Does not include exports from traditional and natural resource–based industries.
b. Includes high-tech labor- and capital-intensive industries already included in the previous two
columns.
c. Does not include Jamaica.
7. Improving these data was a major contribution of the work presented in Moguillansky and
Bielschowsky (2000).
8. Shares were calculated by dividing sectoral investment coefficients from table 6-6 by total invest-
ment coefficients from Moguillansky and Bielschowky (2000, appendix A-1).

161
H E T E RO G E N E I T Y I N R E S P O N S E S O F S E C TO R S A N D F I R M S
total investment. They strongly increased their share in Chile and Colom-
bia, rose moderately in Costa Rica, fell slightly in Brazil, and fell strongly
in Bolivia and Peru. Patterns within tradables were also different across
countries. Higher shares in total investment sometimes resulted from a
country’s comparative advantage (for example, mining in Chile and Co-
lombia), and other times reflected long-term development policies (for ex-
ample, manufacturing in Brazil).
Table 6-7 uses these data, together with qualitative evidence collected
by project consultants for two of the three countries not included in table
6-6, to rate the dynamism of sectoral investment in eight of the project
countries. Two general trends emerge. First, at this broad level of analysis
just one sector (telecommunications) increased its share in total invest-
ment and showed a higher investment-to-GDP ratio after the reforms in
all eight countries. Second, only one country (Chile) showed high invest-
ment performance for almost all sectors in the 1990s than in the 1980s.
9
GDP and employment growth were a joint result of the dynamics of
investment and the incorporation of technical progress; the ratio between
them gives us one measure of productivity. While total factor productivity
would be a preferable measure, we use average labor productivity as a proxy
Table 6-5. Latin America’s Share in World Exports to
the Industrialized Countries, 1980 and 1996
Percent
Country
19801996
Argentina
0.35
0.24
Bolivia
0.04
0.02
Brazil
1.01
0.83
Chile
0.23
0.28
Colombia
0.25
0.25
Costa Rica
0.07
0.10
Jamaica
0.06
0.05
Mexico
1.26
2.27
Peru
0.21
0.09
Source: Authors’ calculations, on the basis of ECLAC’s CAN software.
9. We should keep in mind that a pre-reform period in Chile would mean the 1960s and early
1970s, for which sectoral investment data and qualitative evidence are unavailable.

162
H E T E RO G E N E I T Y I N R E S P O N S E S O F S E C TO R S A N D F I R M S
Table 6-6. Investment Coefficients by Sector, 1970–97
Percent of GDP
Post-reform
Country and sector
Pre-reform
Phase 1
Phase 2
Phase 3
Bolivia
1970–84
1987–89
1990–97
. . .
Tradables
n.a.
5.11
6.16
Oil and natural gas
3.40
3.94
Manufacturing
1.40
1.47
Mining
0.31
0.75
Infrastructure
n.a.
1.56
2.72
Electricity
0.83
1.69
Water and sewage
0.32
0.17
Telecommunications
0.41
0.86
Brazil
1970–89
1990–94
1995–97
. . .
Tradables
5.05
2.60
3.80
Oil and natural gas
0.95
0.50
0.40
Manufacturing
3.90
2.00
3.30
Mining
0.20
0.10
0.10
Infrastructure
4.58
2.34
2.18
Electricity
1.83
0.91
0.55
Water and sewage
0.35
0.19
0.13
Telecommunications
0.62
0.49
0.70
Transportation
1.78
0.75
0.80
Chile
1970–73
1980–85
1986–89
1990–97
Tradables
n.a.
5.18
6.32
8.98
Oil and natural gas
0.93
0.80
0.81
Manufacturing
1.87
2.31
3.81
Mining
2.38
3.21
4.36
Infrastructure
n.a.
4.68
4.14
5.59
Electricity
1.82
1.56
1.52
Water, sewage, roads,
and harbors
1.47
1.15
1.71
Telecommunications
0.47
0.68
1.50
Other infrastructure
0.92
0.75
0.86

163
H E T E RO G E N E I T Y I N R E S P O N S E S O F S E C TO R S A N D F I R M S
Colombia
1975–89
1990–91
1992–95
. . .
Tradables
3.33
3.30
4.69
Oil and natural gas
0.96
1.05
2.22
Manufacturing
2.37
2.25
2.47
Infrastructure
4.04
3.52
5.84
Water
0.30
0.35
0.60
Telecommunications
0.37
0.40
0.71
Electricity
1.95
1.68
2.45
Transportation
1.42
1.09
2.08
Costa Rica
1970–85
1986–91
1992–94
. . .
Tradables
5.89
7.36
8.26
Agriculture
1.75
2.45
2.82
Manufacturing
4.14
4.91
5.44
Infrastructure
5.71
5.87
7.79
Electricity and tele-
communications
1.90
1.83
2.60
Transportation
3.81
4.04
5.19
Peru
1970–89
1992–93
1994–97
. . .
Tradables
7.99
4.18
4.79
Agriculture
0.38
0.75
0.79
Oil and natural gas
0.74
0.21
0.22
Manufacturing
4.84
2.23
2.84
Mining
2.03
0.99
0.94
Infrastructure
3.94
3.48
3.84
Electricity and water
0.81
1.14
1.24
Transportation and tele-
communications
3.13
2.34
2.60
Source: Moguillansky and Bielschowsky (2000).
Table 6-6. Investment Coefficients by Sector, 1970–97 (continued)
Percent of GDP
Post-reform
Country and sector
Pre-reform
Phase 1
Phase 2
Phase 3

164
H E T E RO G E N E I T Y I N R E S P O N S E S O F S E C TO R S A N D F I R M S
T
able 6-7.
D
ynamism of S
ector
al I
nvestment after the R
efor
m
s
a
Countr
y
M
ining
Oil and gas
M
anufacturing
T
elecommunications
E
lectricity
T
ranspor
tation
Argentina
M
edium
H
igh
M
edium
H
igh
M
edium
M
edium
Bolivia
M
edium
M
edium
Lo
w
H
igh
H
igh
n.a.
B
razil
Lo
w
L
ow
M
edium
H
igh
Lo
w
L
ow
Chile
H
igh
M
edium
H
igh
H
igh
H
igh
H
igh
Colombia
n.a.
H
igh
M
edium
H
igh
M
edium
Lo
w
Costa Rica
n.a.
n.a.
H
igh
H
igh
H
igh
H
igh
M
exico
n.a.
M
edium
M
edium
H
igh
M
edium
H
igh
Pe
ru
M
edium
Low
Low
H
igh
M
edium
H
igh
Source:
M
oguillansky
and
B
ielscho
wsky
(2000),
on
the
basis
of
the
pr
oject
sectoral
studies.
a. H
igh (lo
w) dynamism implies that the inv
estment-to-GDP coefficients wer
e bigger (smaller) after the r
eforms than in the pr
e-
reform period, ex
cept for Argentina and
Chile,
for
which
the
base
period
is
the
early
1990s
and
early
1980s
respectively
. When
coefficients
ar
e
not
significantly
diffe
re
nt
between
periods,
dynamism
is
qualified
as
medium.
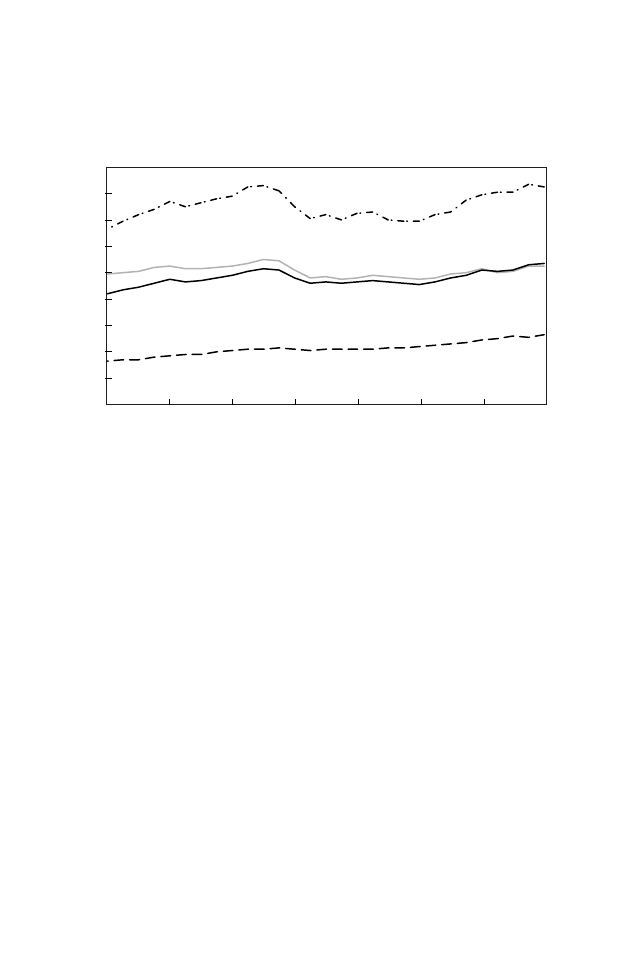
165
H E T E RO G E N E I T Y I N R E S P O N S E S O F S E C TO R S A N D F I R M S
because of lack of data on capital utilization at the sectoral level. Figure 6-
1 shows trends in labor productivity for the nine countries, disaggregated
into three broad sectors of activity. Average labor productivity declined in
the 1980s and then rose in the 1990s. By 1997–98, however, it barely
exceeded the level of 1980. At the sectoral level, productivity increases ac-
celerated in agriculture as the result of significant processes of moderniza-
tion and declining employment. In manufacturing, productivity suffered a
sharp decline in the 1980s and then grew again. Finally, the services sector
excluding utilities overcame the stagnation of the 1980s as average produc-
tivity began to rise, albeit at slow rates.
This review of sectoral dynamics raises four important issues. First,
the share of tradables in GDP fell moderately, while their share in em-
ployment dropped, as will be seen later in the chapter. We need to iden-
tify the forces that led to the corresponding increase of employment in
services and ask whether they were related to the reforms. Second, project
countries exhibited two distinct export patterns. Mexico’s different per-
formance regarding manufacturing exports was a result of its integration
Figure 6-1. Average Labor Productivity by Sector, 1970–98
a
Thousands of 1980 dollars (purchasing power parity)
1982
1990
1994
Source: Hofman (1999), on the basis of project data.
a. Based on simple averages for the nine project countries.
1974
1978
Manufacturing
Agriculture
Total
Services
2
4
6
8
10
12
14
16
1986

166
H E T E RO G E N E I T Y I N R E S P O N S E S O F S E C TO R S A N D F I R M S
in the North American economic area in general and of the maquila op-
erations in particular. With the exception of Costa Rica, the other coun-
tries maintained and sometimes increased their specialization in primary
products and natural resource–based semi-manufactures. We now need
to determine the impact of these different patterns of specialization on
production and employment.
Third, investment did not flow mainly to tradables and potential ex-
ports, and some nontradables, such as telecommunications, experienced
very fast growth. Within the investment that went to the tradables sectors,
a disaggregated analysis must now examine whether it was concentrated in
export-oriented subsectors. It is also necessary to find out why other infra-
structure sectors did not perform as well as telecommunications. Finally, a
deeper analysis of the heterogeneous dynamics of productivity needs to
explore whether the overall picture of relatively slow productivity growth
in services is hiding more dynamic sectors that are crucial for the competi-
tiveness of the tradables sectors.
These questions require a more detailed analysis of specific sectors.
The following sections present such an analysis of manufacturing, agricul-
ture, mining, electricity, and telecommunications, focusing on the dynam-
ics of investment and the incorporation of technological progress in each
sector. Employment is considered separately because of the different break-
down of available information.
Specialization and Heterogeneity in Manufacturing
The most important change in the structure of manufacturing pro-
duction in the 1970s and 1980s was the increase in the relative weight of
subsectors that process natural resources, particularly in Argentina, Bra-
zil, Chile, and Colombia.
10
In the 1990s, in contrast, metal products and
the automobile industry were the most dynamic (see table 6-8). The weight
of activities such as textiles, garments, leather products, and footwear in
the production structure diminished throughout the three decades. These
trends, together with the evolution of investment in the sector, reflect the
significant specialization process that occurred in manufacturing after
the reforms.
10. These subsectors present important economies of scale, are highly capital-intensive, and pro-
duce homogeneous goods, such as paper and cellulose, basic chemicals, iron and steel, and nonferrous
metal products. See Katz (2000, chapter 2).

167
H E T E RO G E N E I T Y I N R E S P O N S E S O F S E C TO R S A N D F I R M S
Investment in the manufacturing sector followed a sequence of phases
similar to the pattern for total investment.
11
In an initial phase when nega-
tive transitory factors determined the investment process, the investment-
to-GDP ratio and the investment index fell. Uncertainty and inconsistencies
related to macroeconomic policy and the international context led to this
decline as corporate strategies reflected wait-and-see behavior. Both indexes
recovered during a second phase, when some of the negative elements were
reversed or weakened. Only Chile entered a third phase, in which normal
long-term factors dominate investment. In the Chilean case, the indexes
clearly exceeded their pre-reform levels, although this need not hold true
for all countries (see table 6-9).
The manufacturing sector can play an important role in alleviating
balance-of-payments constraints to growth by increasing exports in response
to the signals sent by the reforms. To find out the extent to which this
occurred, we need to consider what happened to the structure of manufac-
turing investment and whether there was a relation between those changes
Table 6-8. Growth Rate of Value Added and Employment in
Manufacturing Subsectors, 1990–96
a
Percent
Subsector
Value added
Employment
Metal products, excluding transportation equipment
4.5
–1.1
Transportation equipment
4.9
–1.9
Food, beverages, and tobacco
4.3
0.3
Natural resource–based industries
3.0
–1.3
Textile, garments, leather, and footwear
–0.6
–3.5
Other industries
5.4
0.3
All manufacturing
3.9
–0.8
Source: Weller (2000), using ECLAC’s PADI data base.
a. Simple average for six countries (Argentina, Brazil, Chile, Colombia, Mexico, and Peru). Data
exclude small firms and microenterprises.
11. We were able to get disaggregated information for only six of the project countries. Moreover,
the data for Colombia, Mexico, and Peru only go up to 1994 or 1995, and the periodization differs
slightly from that presented in table 6-6. Similarly, lack of data for the period preceding the reforms in
Chile (1960–74) and Argentina (1970–89) forces us to use the initial post-reform levels as a base for
the investment index. Given that investment in that period was very low, the index will tend to
overestimate the impact of the reforms on investment in the following phases.

168
H E T E RO G E N E I T Y I N R E S P O N S E S O F S E C TO R S A N D F I R M S
T
able 6-9.
In
vestment in Manufacturing, 1970–97
Countr
y
P
re-r
efor
m
P
hase
1
P
hase
2
P
hase
3
Index of manufacturing inv
estment
Argentina
1970
–
9
0
n.a.
1991
100.0
1992
–
97
a
166.0
…
…
B
razil
1970
–
89
100.0
1990
–
94
78.0
1995
–
97
a
130.0
…
…
Chile
1960
–
7
4
n.a.
1974
–
85
100.0
1986
–
89
177.0
1990
–
97
a
460.0
Colombia
1970
–
89
100.0
…
…
1990
–
95
a
166.0
…
…
M
exico
1970
–
85
100.0
1986
–
90
67.0
1990
–
94
a
118.0
…
…
Pe
ru
1970
–
8
9
100.0
1990
–
95
a
37.0
…
…
…
…
M
anufacturing
inv
estment
as
per
centage
of
total
GDP
Argentina
1970
–
90
3.3
1991
2.0
1992
–
97
a
3.0
…
…
B
razil
1970
–
89
3.9
1990
–
94
2.0
1995
–
97
a
3.3
…
…
Chile
1960
–
7
4
n.a.
1974
–
85
1.4
1986
–
89
2.3
1990
–
97
a
3.8
Colombia
1970
–
89
2.3
…
…
1990
–
95
a
2.2
…
…
M
exico
1970
–
85
1.9
1986
–
90
1.0
1990
–
94
a
1.4
…
…
Pe
ru
1970
–
8
9
4
.8
1990
–
95
a
2.6
…
…
…
…
Sour
ce:
M
oguillansky
and
B
ielscho
wsky
(2000)
on
the
basis
of
project
sectoral
studies.
a.
Data
ar
e
not
av
ailable
for
later
years;
periodization
ther
efor
e
does
not
necessarily
indicate
the
end
of
phase.

169
H E T E RO G E N E I T Y I N R E S P O N S E S O F S E C TO R S A N D F I R M S
and export dynamics after the reforms. Table 6-10 divides the manufactur-
ing sector into dynamic versus nondynamic subsectors, with the former
defined as subsectors that increased their participation in total manufac-
turing investment between the pre-reform period and the 1990s. Of the
twenty-eight subsectors considered in national statistics, those categorized
as dynamic ranged from a low of nine (the average for Argentina, Brazil,
Mexico, and Peru) to a high of sixteen (in Chile and Colombia).
By definition, investment in the dynamic subsectors grew faster than it
did in the rest of the manufacturing sector, but the differential between the
dynamic and the nondynamic subsectors was considerable. In all countries
except Peru, investment in the dynamic subsectors was substantially higher
Table 6-10. Index of Investment and Output in Manufacturing
Investment index
a
Output index
b
Country
Pre-reform
1990s
Pre-reform
1990s
Argentina
Dynamic subsectors
c
n.a.
n.a.
100
127
Others
n.a.
n.a.
100
88
Brazil
Dynamic subsectors
c
100
125
100
133
Others
100
97
100
117
Chile
Dynamic subsectors
c
100
d
392
100
d
185
Others
100
d
288
100
d
144
Colombia
Dynamic subsectors
c
100
198
100
162
Others
100
119
100
172
Mexico
Dynamic subsectors
c
100
147
100
162
Others
100
76
100
138
Peru
Dynamic subsectors
c
100
49
100
112
Others
100
21
100
100
Source: Project database.
a. Index of gross fixed domestic investment (100 = pre-reform period).
b. Index of GDP (100 = pre-reform period).
c. Dynamic subsectors are those that increased their participation in total manufacturing invest-
ment between the pre-reform period and the 1990s.
d. In Chile, due to lack of data, the base period is 1979–81.

170
H E T E RO G E N E I T Y I N R E S P O N S E S O F S E C TO R S A N D F I R M S
than in the laggards. In Peru, all investment fell in comparison with the
pre-reform period. In the other cases, the increase in the dynamic subsectors
ranged from 25 percent in Brazil to 292 percent in Chile. Investment in
the lagging subsectors, in contrast, fell in the 1990s in comparison with the
pre-reform period in Brazil and Mexico, but it rose (at a slower rate) in
Chile and Colombia.
Table 6-10 further shows that the same subsectors that were dynamic in
investment were also dynamic in the expansion of output. The data for Ar-
gentina fit the same pattern. What differs in the data on growth of output is
the relative dynamism between fast-growing subsectors and the rest of the
manufacturing sector. Brazil, Mexico, and Peru demonstrated a bigger differ-
ence between dynamic and nondynamic subsectors with respect to output
than to investment. In Chile and Colombia, the relation ran in the other
direction. For Argentina, of course, we cannot make such a comparison.
Thus the reforms helped some manufacturing subsectors, while others
fell further behind. This was true for both investment and output. Whether
the dynamic subsectors were intensive in labor, capital, or natural resources
affects their potential for generating employment and improving the dis-
tribution of income. A closely related issue is the relative size of the firms in
the dynamic versus the lagging subsectors.
Table 6-11 lists the subsectors that were dynamic in at least three coun-
tries and the type of firm that led the investment process in those sectors.
Foodstuffs and metal products were the only subsectors that were dynamic
across all the countries under consideration,
12
while pharmaceuticals and
cosmetics as well as basic steel were dynamic in five countries, and bever-
ages, plastics, and chemicals and petrochemicals were dynamic in four coun-
tries. At the other extreme, subsectors such as furniture, leather goods, and
nonelectric machinery were dynamic in at most one country.
Subsidiaries of transnational corporations were important investors in
dynamic subsectors, particularly in foodstuffs; pharmaceuticals, cosmetics,
and miscellaneous chemicals; and transportation equipment (that is, pas-
senger and freight vehicles). Large domestic conglomerates or firms led
investment in foodstuffs, beverages, nonmetallic mineral products (cement),
cellulose and paper, and metal products. The major investors in the dy-
namic subsectors were thus large corporations, both domestic and foreign.
The information in table 6-11 has two important shortcomings, al-
12. Metal products include all metal goods (such as scaffolding, pipes, nails, and screws) except
machinery and equipment.

171
H E T E RO G E N E I T Y I N R E S P O N S E S O F S E C TO R S A N D F I R M S
though they do not change the general conclusion. First, the data on manu-
facturing investment do not include maquila plants, which are particularly
important in Mexico.
13
The Mexican apparel industry and electrical ma-
chinery and equipment (which includes electronics) both involved maquila
assembly and both were very dynamic. The principal investors in the maquila
industry were large and medium-size subsidiaries of foreign companies.
14
Table 6-11. Characteristics of Dynamic Manufacturing Subsectors
Subsector
Countries
Main investors
a
Foodstuffs
b
Argentina, Brazil, Chile, Colombia,
TNC, CDF
Mexico, Peru
Metal products
Argentina, Brazil, Chile, Colombia,
Large and medium-
Mexico, Peru
size domestic
firms
Pharmaceuticals, cos-
Argentina, Brazil, Colombia, Mexico, TNC
metics, and miscel-
Peru
laneous chemicals
Basic steel
Argentina, Brazil, Chile, Colombia,
CDF
Mexico
Beverages
Argentina, Chile, Colombia, Mexico
CDF, TNC
Plastics
Brazil, Chile, Colombia, Mexico
Large and medium-
size domestic
firms
Chemicals and petro-
Argentina, Chile, Colombia, Peru
TNC
chemicals
Other products of non-
Chile, Colombia, Mexico
CDF
metallic minerals
(cement)
Tobacco
Argentina, Chile, Mexico
CDF, some TNC
Pulp and paper
Chile, Colombia, Peru
CDF
Transportation equip-
Argentina, Brazil, Mexico
TNC
ment
Source: Moguillansky and Bielschowsky (2000), on the basis of project data.
a. TNC = subsidiaries of transnational corporations ; CDF = conglomerates of large domestic firms.
b. Includes “other foodstuffs,” which is dynamic in four countries.
13. This is also true in Costa Rica, which was not included in this section for lack of disaggregated
investment data.
14. The average employment at a Mexican maquila in 1998 was around 300 people. Calculations
based on data from the National Institute of Statistics, Geography, and Informatics (INEGI).

172
H E T E RO G E N E I T Y I N R E S P O N S E S O F S E C TO R S A N D F I R M S
Second, the investment role of small and medium-size domestic firms
may be underestimated. Investment data for those firms are particularly
difficult to collect, and in the case of small firms, investment more often
involves the creation of new firms than the expansion of existing units.
Peres and Stumpo indicate that small and medium-size firms were impor-
tant in foodstuffs, chemicals, and plastics in the six countries considered in
table 6-11.
15
Nonetheless, large firms were the dominant investors, includ-
ing in the majority of maquila activities, while smaller enterprises played a
much less important role.
Among large firms, TNCs are concentrated in subsectors that are tech-
nology intensive (such as automobiles and pharmaceuticals) or marketing
intensive (including brand-name foods and cleaning and hygiene prod-
ucts). Large domestic firms and conglomerates tend to specialize in the
production of natural resource–based commodities, such as basic steel, tra-
ditional foods, cement, and cellulose and paper.
16
Transnational corporations that invested in the region followed three
types of strategies. Some investors aimed at developing an efficient plat-
form for exporting to the United States, as was the case with FDI in the
automobile industry in Mexico and the maquila plants in Mexico and else-
where in the Caribbean Basin. Other TNCs sought to develop their access
to natural resources, like minerals in Argentina, Peru, and Chile or oil in
Argentina, Colombia, and Venezuela. For a third group, the main goal was
to gain access to domestic or subregional markets, such as Mercosur or the
Andean Community. This happened in tradables sectors, such as automo-
biles in Argentina and Brazil or agroindustry in Argentina, Brazil, and
Mexico, as well as in nontradables such as banking, telecommunications,
electricity, and natural gas distribution in almost all countries. What is
notable about Latin America is the absence of important investments
directed toward developing strategic assets, particularly technology. Al-
though numerous joint-ventures have been forged between foreign and
domestic firms, most of them have aimed at developing marketing strate-
gies, where the domestic partners contribute mainly through opening their
well-established commercialization networks to foreign products.
17
TNCs gained ground with respect to domestic firms and conglomer-
ates. The share of foreign firms in the sales of the 100 largest domestic
manufacturing corporations in the region increased from 46 to 61 percent
15. See Peres and Stumpo (2000).
16. For a detailed account of the strategy of domestic conglomerates after the reforms, see Garrido
and Peres (1998) and Peres (1998).
17. ECLAC (1998c).

173
H E T E RO G E N E I T Y I N R E S P O N S E S O F S E C TO R S A N D F I R M S
in 1990–98.
18
Although the strong dynamism of the automobile industry
explains most of the increased foreign presence during 1990–94, the main
force behind the changes in participation in 1995–98 was the takeover of
large domestic firms by foreign investors, particularly in Argentina, Brazil,
and Mexico. Foreign takeovers were also significant in Chile after the sharp
slowdown of growth in 1998–99. These data refer to sales, but it is likely
that investment performance followed a similar path, given the great in-
crease in foreign investment in medium-size and large countries in the re-
gion.
19
This reflects the advantages that TNCs enjoy in terms of managerial
and technological capacities, opportunities for diversifying investment risk
across countries, and control over oligopolistic markets, as well as their
long experience operating in open markets under strong competition and
uncertainty.
The reforms shaped the sectoral structure of manufacturing invest-
ment through several transmission mechanisms. Specifically, the reforms
had a positive impact on subsectors with natural comparative advantages,
including foodstuffs, cellulose and paper, chemicals and petrochemicals,
and basic steel, and on subsectors in which the strengthening of intellectual
property rights encouraged investment by foreign firms, as occurred, for
example, in pharmaceuticals.
20
Trade opening had a negative impact on
investment in less dynamic subsectors, such as textiles and apparel (outside
the maquila sector) and leather goods. In these subsectors, competition
from imported products accounted for the poor performance of invest-
ment and for their declining weight in total manufacturing production.
This was particularly important for employment dynamics as we will see in
the last section of the chapter.
Trade liberalization, however, cannot account for the dynamics of
investment in all sectors. In particular, sectoral promotion policies ex-
plained the very good performance of the automobile industry and of
maquila production of electronics, car parts, and apparel. The automo-
bile industry continued to be protected from foreign competition and
received special promotion in all producing countries in the region for
most of the decade after the reforms, although promotional schemes were
gradually phased out. The maquila plants enjoyed a tax-free regime, mini-
mal transaction costs, and market access through subregional free trade
18. Garrido and Peres (1998) and ECLAC (2000b).
19. Although in some years the flows of investment to manufacturing fell as a percentage of the
total due to the strength of foreign investment in the privatization of services, the amount of foreign
investment in manufacturing grew throughout the period.
20. This factor also played an important role in the evolution of investment in the mining sector.

174
H E T E RO G E N E I T Y I N R E S P O N S E S O F S E C TO R S A N D F I R M S
agreements.
21
The recovery of domestic demand in the 1990s had a posi-
tive impact on housing and other construction, which in turn stimulated
investment in metal products and cement.
Table 6-12. Index of Exports and Trade Balance according to Investment
Dynamism in Manufacturing
a
Country
Pre-reform
Phase 1
Phase 2
Phase 3
Dynamic subsectors
Export index
Argentina
100.0
242.2
306.2
. . .
Brazil
100.0
194.7
258.3
. . .
Chile
. . .
100.0
168.0
350.2
Colombia
100.0
. . .
298.0
. . .
Mexico
100.0
434.5
1062.3
. . .
Peru
100.0
190.5
301.2
. . .
Trade balance as percent of total trade
b
Argentina
22.8
41.2
2.3
. . .
Brazil
40.9
43.6
-2.0
. . .
Chile
. . .
–13.9
0.2
–10.2
Colombia
–20.3
. . .
–14.4
. . .
Mexico
–37.8
–4.3
–5.0
. . .
Peru
4.4
2.7
–2.2
. . .
Lagging subsectors
Export index
Argentina
100.0
218.0
319.0
. . .
Brazil
100.0
282.3
379.1
. . .
Chile
. . .
100.0
170.6
484.7
Colombia
100.0
. . .
492.8
. . .
Mexico
100.0
370.4
826.4
. . .
Peru
100.0
196.3
280.3
. . .
Trade balance as percent of total trade
b
Argentina
–0.4
–0.1
-0.6
. . .
Brazil
–18.3
7.9
1.0
. . .
Chile
. . .
–77.9
–77.4
–75.3
Colombia
–70.1
. . .
–54.6
. . .
Mexico
–50.2
–24.0
–35.1
. . .
Peru
–23.4
–12.9
–34.8
. . .
Source: Adapted from Moguillansky and Bielschowsky (2000), on the basis of project data.
a. Periodization follows that of table 6-9.
b. Trade balance as a percentage of total trade is calculated as (X – M)/(X + M).
21. For the countries in this study, the North American Free Trade Agreement (NAFTA) is impor-
tant with respect to maquila and automobile exports, and the Southern Common Market (Mercosur)
is important with respect to automobile exports.

175
H E T E RO G E N E I T Y I N R E S P O N S E S O F S E C TO R S A N D F I R M S
Exports from sectors that were dynamic in investment grew very rap-
idly after the reforms, reaching levels three or four times higher than in the
pre-reform period; Mexico turned in a particularly strong performance (see
table 6-12). Nonetheless, exports from lagging subsectors grew even faster
in all countries except Mexico and Peru. This unexpected result may be
partially explained by their relatively low participation in exports before
the reforms, which made it easier for them to achieve high growth rates.
Chile, in particular, featured very low exports from lagging subsectors in
the initial period. The difference in the growth rate of exports between
dynamic and lagging subsectors also suggests that a significant part of their
strong expansion was not based on the creation of new production capac-
ity; the utilization of previously installed capacity was probably significant.
Indeed, sectoral evidence at the country level shows that production capac-
ity originally installed for the domestic market was shifted toward the ex-
ternal market.
Despite strong growth in exports of the dynamic subsectors, all coun-
tries show growing trade deficits or decreasing surpluses in the manufac-
turing sector. Such deterioration of the trade balance reflects the impact of
macroeconomic policies, particularly exchange rate overvaluation, and a
high income elasticity of demand for foreign products. Negative trade bal-
ances also indicate that investment was not sufficient to overcome or even
significantly reduce the trade component of the external constraint on
growth. Export growth was accompanied by even faster import growth,
which resulted from the substitution of imports for domestic inputs fol-
lowing trade liberalization. A similar process took place in the larger coun-
tries with respect to capital goods.
22
The falling share of domestic inputs in production increased the effi-
ciency of manufacturing firms, allowing them to use better, cheaper inputs
from abroad. At the same time, it also destroyed supplier chains, which
may help to explain the poor investment performance of small and me-
dium-size firms, particularly in sectors in which they were previously linked
to larger firms through subcontracting. Similarly, the most dynamic ex-
porters in the region, namely the maquila plants, did not foster local sup-
plier chains; domestic production could never competitively supply more
than three percent of inputs demanded by those plants.
23
The destruction
of supplier chains and the inability to supply inputs to the maquila plants
22. For a detailed account, see Katz (2000, chapters 2 and 5); Reinhardt and Peres (2000); Peres
(1998).
23. Buitelaar and Padilla (2000).

176
H E T E RO G E N E I T Y I N R E S P O N S E S O F S E C TO R S A N D F I R M S
provide a microeconomic explanation of why export growth did not spread
to other sectors of the region’s economies.
The greater competitiveness of exports in the manufacturing sector
stemmed not only from investment, but also from an increase in produc-
tivity in the 1990s. Moguillansky and Bielschowsky show that dynamic
subsectors experienced labor productivity growth rates above those found
in the lagging subsectors in Argentina, Brazil, and Mexico.
24
Although pro-
ductivity growth was weaker in the dynamic subsectors in Colombia and
Chile, labor productivity at the end of the period was appreciably higher
than in the pre-reform years. Even in Peru, where the indexes did not reach
their previous levels, productivity grew once the initial period of decline in
investment was overcome. All of this suggests that strong modernization
processes are underway.
An alternative approach for evaluating the dynamism of labor produc-
tivity is to compare the relative productivity of the manufacturing sector in
the project countries with that of the United States, which is a good proxy
for the current technological frontier. Katz develops this indicator for eight
countries
25
(see table 6-13). The region’s low labor productivity is striking:
in seven of the eight countries, manufacturing productivity was less than
24. Moguillansky and Bielschowsky (2000, chapter 2).
25. See Katz (2000, chapter 3). This study is based on information that includes mainly large and
medium-size firms.
Table 6-13. Labor Productivity in Manufacturing with Respect to
the United States, 1970–96
Country
1970198019901996
Argentina
0.42
0.41
0.55
0.67
Brazil
0.28
0.26
0.29
0.37
Chile
0.25
0.24
0.23
0.20
a
Colombia
0.29
0.25
0.37
0.34
Costa Rica
n.a.
n.a.
0.15
0.14
b
Jamaica
0.26
0.16
0.16
0.13
b
Mexico
0.32
0.30
0.44
0.38
c
Peru
0.33
0.25
0.16
0.15
Source: Katz (2000), using ECLAC’s PADI database.
a. Information for 1995.
b. Information for 1992.
c. Information for 1994.

177
H E T E RO G E N E I T Y I N R E S P O N S E S O F S E C TO R S A N D F I R M S
40 percent of the productivity of the U.S. manufacturing sector in the
mid-1990s.
In the 1970s, the productivity gap widened somewhat between the
project countries and the United States, while in the following decade the
gap remained constant or even fell, except in Peru where it continued to
widen. In the 1990s, only Argentina and Brazil displayed strong perfor-
mances. Examining the period as a whole, it is important to highlight that
much of the improvement in productivity can be traced to processes of
modernization that unfolded as a result of the external debt crisis, before
the widespread effects of the reforms were felt. Virtually all of the produc-
tivity gains that occurred in Colombia and Mexico, and half of Argentina’s,
took place in the 1980s. Only Brazil, which was a notorious latecomer and
a cautious reformer, experienced most of the reduction in its productivity
gap in the 1990s. Thus, the reforms were not the only force pressuring
firms to increase efficiency; the dynamics of domestic and foreign markets
were also very important.
A disaggregated analysis at the subsectoral level supports a similar con-
clusion about the different forces stimulating modernization. Katz describes
a very heterogeneous situation across subsectors. In more than 70 percent
of the subsectors that narrowed the gap in 1970–96, the shrinkage was
already occurring between 1970 and 1990, that is, before the reforms could
have a significant effect on the industrial structure. Production growth was
instrumental in shrinking the gap. The subsectors that narrowed that gap
correlated significantly with subsectors that experienced higher growth rates
of production. The dynamics of the productivity gap may be explained by
specific sectoral regimes that also played a role in shaping trends in manu-
facturing investment. A particularly important component of those regimes
is the fast process of technological change that took place in many indus-
tries at the national and international levels.
The concept of the productivity gap may also be used to explore the
position of small and medium-size enterprises (SMEs) relative to the larger
firms and to ascertain whether the former were able to narrow their differ-
ence with respect to the latter. The productivity of SMEs in seven project
countries varied between one-fourth and two-thirds of the corresponding
levels for large firms in the mid-1990s.
26
Although labor productivity in
26. Peres and Stumpo (2000). Data do not include Bolivia and Jamaica. That paper defines SMEs
according to the definitions used in each country, which coincides with the disaggregation of available
information. The lower limit varies from 5 to 10 workers, while the upper limit reaches 499 in Brazil,
250 in Mexico, and 200 in Chile. Microenterprises (that is, firms with less than 5 or 10 workers) are
not included in the analysis.
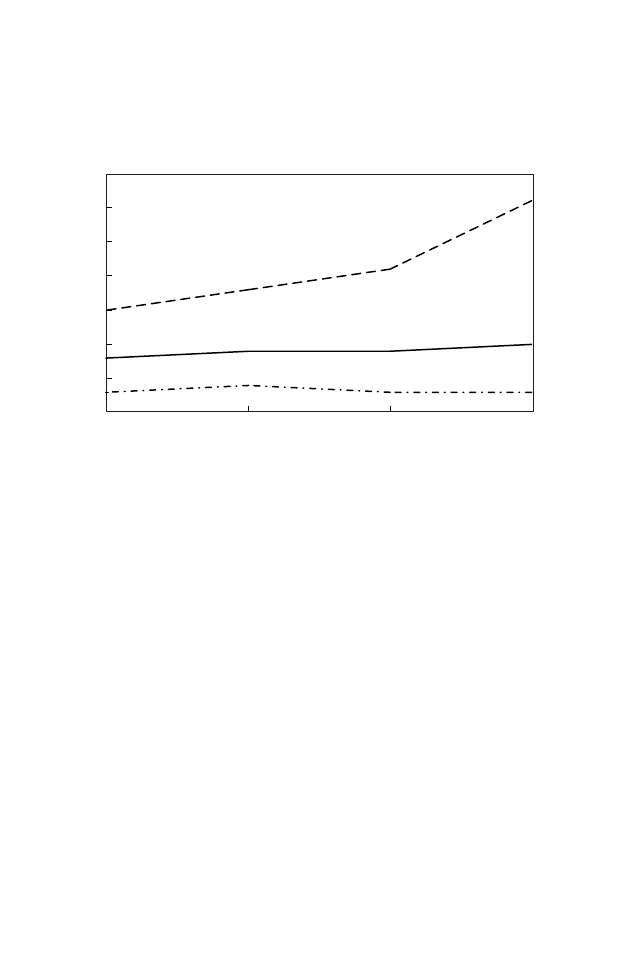
178
H E T E RO G E N E I T Y I N R E S P O N S E S O F S E C TO R S A N D F I R M S
SMEs increased in all seven countries between the mid-1980s and the mid-
1990s, the productivity gap narrowed in only four countries (Argentina,
Brazil, Costa Rica, and Mexico), while it widened in three (Chile, Colom-
bia, and Peru). This means not only that SME efficiency continued to lag
far behind that of larger firms, but that heterogeneity across firms did not
decrease.
Although data for microenterprises and informal activities are very dif-
ficult to obtain, information is available on the dynamics of labor produc-
tivity for the aggregates of large and medium-size firms, on the one hand,
and small firms and microenterprises, on the other. Figure 6-2 shows that
all productivity gains in manufacturing took place in the former and that
the productivity gap increased over time, which is particularly troublesome
given the important role these firms played in job creation.
Specialization and Polarization in Agriculture
The economic reforms had a strong impact on agriculture. Trade liber-
alization, privatization of state enterprises that produced agricultural in-
Figure 6-2. Average Labor Productivity in Manufacturing, 1970–96
a
Thousands of 1980 dollars
1990
1996
Source: Weller (2000), using ECLAC's PADI database.
a. Based on simple averages for the nine project countries.
b. Includes self-employed.
1970
1980
Medium and large enterprises
Small firms and microenterprises
b
Total
5
10
15
20
25
30

179
H E T E RO G E N E I T Y I N R E S P O N S E S O F S E C TO R S A N D F I R M S
puts, and the restructuring or elimination of some of the public agrarian
institutions increased heterogeneity with respect to input and product prices,
the availability of services and resources, and types of producers. Some
crops significantly increased their share in total production, while others
lost. Productivity and foreign trade also presented a mixed performance,
while the existing heterogeneity among types of producers deepened. Most
countries experienced all these effects simultaneously, particularly when
geographic areas specialized in activities that differed in their relative use of
production factors and in the economic actors involved in production.
27
The most important transformations in the agricultural sector resulted
not only from the reforms, but also from processes that began at least a
decade earlier. The most significant were the incorporation of new tech-
nologies, reduction of cultivated land, increase of land dedicated to live-
stock and forest plantations, and employment decline. The structure of
production also changed: there was a strong development of new, highly
dynamic activities linked to external markets and to the most modern
agribusiness, as well as a poor performance of more traditional exports
based on commodities whose profitability deteriorated because of low in-
ternational prices.
The annual growth rate of agriculture and livestock was 3.5 percent in
the 1970s, 2.1 percent in the 1980s, and 2.6 percent in 1990–98. These
aggregate figures hide large differences among countries. In five project
countries (Argentina, Bolivia, Chile, Costa Rica, and Peru),
agricultural
GDP grew faster in the 1990s than in the previous two decades,
28
while the
trade balance improved except for Peru. In Brazil and Mexico production
grew faster in the 1990s than in the previous decade, although growth rates
were below those of the 1970s; the trade balance improved in the former
and deteriorated in the latter. Finally, in Colombia, the agricultural growth
rate was below that of the previous two decades, and the trade balance
deteriorated.
29
The structure of agricultural production is changing in favor of com-
mercial crops with a greater elasticity of domestic and external demand. At
27. In the Andean countries, for example, new modern forms of production, which are capital-
intensive and technologically sophisticated but which also make intensive use of labor (such as flowers
in Colombia and Ecuador), were developed alongside natural resource exploitation and capital-inten-
sive plantations. At the same time, there were important nuclei of peasant production, which were
mainly run by the indigenous population in the Bolivian altiplano or in mountainous areas of Peru
and Ecuador. This complex scenario was further complicated by the cultivation of illegal crops.
28. In both Chile and Costa Rica, growth decelerated sharply in the second half of the 1990s.
29. See Tejo (1999).

180
H E T E RO G E N E I T Y I N R E S P O N S E S O F S E C TO R S A N D F I R M S
the same time, total cultivated area has stagnated or even fallen. This spe-
cialization process displayed three different patterns in the introduction
and expansion of new products. In Brazil, domestic demand was the main
growth factor, while in Argentina, Chile, and Costa Rica, external demand
was key. Both factors operated in Mexico, albeit with varying intensity
across regions of the country.
In the region as a whole, oleaginous products led expansion, followed by
fruits and vegetables and planted forests.
30
Livestock grew faster than agri-
culture. Cereals and cane sugar were very dynamic until the first half of the
1980s, but thereafter they showed an important deceleration. Production
of roots and tubers stagnated over the last quarter century, as did coffee pro-
duction after the mid-1980s. As expected, the most dynamic products corre-
spond to the most modern, capital-intensive producers in commercial
agriculture. Cultivation by small producers in traditional labor-intensive
agriculture has stagnated or the cultivated area has been reduced.
31
Despite all these changes, poverty and indigence continued to present
serious problems in rural areas, and in some cases poverty even increased.
In addition to demographic changes, income and assets saw a greater con-
centration. This was especially true of land, as has historically been the case
throughout the region despite policies implemented to eliminate the prob-
lem. Limitations of human, physical, and social capital as well as imperfect
markets (for example, for credit, information, technology, and insurance)
made it impossible or very difficult for small rural producers to shift to-
ward products with higher demand and better prices.
Land tenure became increasingly concentrated in larger farms over the
last two decades, while the number of smaller units decreased significantly.
The last agricultural censuses of Bolivia and Chile, as well as studies for
Argentina, Brazil, Colombia, and Mexico, show a strong decline in the
number of small production units in the last two decades, a process that
intensified in the 1990s. The reduction of cultivated area in Brazil and
Chile was accompanied by the elimination of small units. In contrast with
other regions of the world, land tenure and ownership structure are still
pressing political issues in many Latin American countries. The current
30. In oleaginous products the fastest growing project countries were Argentina, Bolivia, and Brazil
thanks to soybean expansion, followed by Costa Rica’s production of African palm. In fruits and
vegetables, most of the expansion took place in Argentina, Brazil, Chile, Costa Rica, and Mexico,
whereas planted forestry increased remarkably in Argentina and Chile.
31. Dirven (1999).

181
H E T E RO G E N E I T Y I N R E S P O N S E S O F S E C TO R S A N D F I R M S
concentration process is a step backward after the land reforms implemented
in the 1960s and 1970s.
32
New economic actors entered agricultural activities, particularly large
TNCs in agribusiness and related marketing chains, while established firms
and many family-based firms left the market. The pattern varied among
specific sectors.
33
Different forces determined the new situation regarding
sectors and actors, among which the most important were research and
extension efforts by public and private entities and changes in interna-
tional demand. For example, the expansion of soybeans was boosted by the
research efforts of national agricultural technology centers in Argentina
and Brazil, while the private sector was behind the introduction and ex-
pansion of sunflowers. In Chile, the private sector strongly invested in the
expansion of fruit production, based on the results of a long-term public
support program. Also in Chile, the national agricultural research agencies
and specialized international centers obtained new high-performance vari-
eties of cereals, while the private sector, especially international companies
producing hybrid seeds, was the main force behind productivity increases
in corn production.
Economic reforms, particularly trade liberalization, had an important
impact on the integration of the region’s agricultural sector into the inter-
national market and gave rise to new situations in the domestic markets.
Domestic producers faced new competition from foreign products, some
of which were strongly subsidized by the European Union and the United
States. Starting in the late 1980s and continuing through the 1990s, im-
ports of agricultural and food products increased significantly and started
to compete with domestic products for the local market. Domestic pro-
ducers had to specialize in activities for which they had comparative ad-
vantage, leaving other products to foreign suppliers. Consumers benefited,
but producers that could not compete had to leave the market. While, this
process increased efficiency, as shown by productivity growth (see figure
6-1), it also led to land concentration and polarization within the agricul-
tural sector. The losers were not always producers without comparative
advantages; overvalued domestic currencies and distortions in the interna-
tional market forced out a number of competitive producers.
The share of agricultural products in the region’s total exports generally
fell in the 1990s. Most countries tended to compensate for low international
32. David and Morales (forthcoming, chapter 2).
33. Tejo (1999).

182
H E T E RO G E N E I T Y I N R E S P O N S E S O F S E C TO R S A N D F I R M S
prices in their agricultural exports by increasing export volumes. In the same
period, agricultural imports increased in price and volume in all countries
except Argentina and Chile, where import volume increased while prices fell.
New trends in world food demand affected the ways in which agricul-
tural and food products were produced, processed, and internationally
traded. Countries that adjusted their exports toward high-quality agricul-
tural products (for example, products that are packaged, frozen, reprocessed,
or of recognized origin and that meet international sanitary regulations)
could increase their share in international markets in the 1990s. Brazil,
Chile, and Mexico were among the countries that benefited from such new
opportunities, exporting products with higher value added and obtaining
significant price increases.
Another important effect of trade liberalization on agriculture in Latin
America was the strong increase of imports of chemical inputs such as
pesticides, herbicides, and fertilizers. While herbicide imports were small
in the 1970s and 1980s, they were a significant component of total im-
ports in the 1990s. The increase of pesticide imports was even stronger,
especially in Argentina and Bolivia. In Brazil and Mexico, local production
is more developed, such that pesticides and herbicides had a relatively low
share in total imports; this may hide high levels of imported chemical in-
puts for their production, however. This strong growth of chemical inputs
widened the productivity gap between large and small producers in the
region, because the latter do not have the financial resources to use those
inputs intensively. Environmental deterioration may be another negative
effect of this increased use of chemical inputs.
Natural Advantages and Access to
Foreign Investment in Mining
Privatization, the elimination of restrictions on foreign direct invest-
ment, and the strengthening of property rights have had a strong impact
on the performance of the mining sector in Latin America.
34
Accumulated
capital stock and technological experience of relevant economic actors was
also important. The evolution of international markets for minerals pro-
vided the context in which the various changes occurred.
35
34. Unless otherwise indicated, the data in this section come from Moguillansky and Bielschowsky
(2000, chapter 3).
35. Mining exports more than doubled in Argentina from 1990 to 1998, although they started
from a very low base. Exports also increased substantially in Chile and Peru; they fell in 1998 when
these countries were hit hard by the international crisis.

183
H E T E RO G E N E I T Y I N R E S P O N S E S O F S E C TO R S A N D F I R M S
Beginning in the early 1990s, the region’s mining sector experienced
dynamic investment in both exploration and exploitation.
36
Investment
in exploitation was heavily concentrated in Chile, with Brazil occupying
a distant second place (see table 6-14). Gross fixed capital formation as a
percentage of total GDP for this sector rose sharply in Chile, passing
from 1 percent in 1975–79 to 4.4 percent in 1990–97, while in Brazil it
fell from 0.2 percent to 0.1 percent over the same period. It remained
constant at about 0.9 percent in Peru after a sharp drop in the early 1990s
(see table 6-6).
37
Trends in mining investment were determined primarily by the inter-
action of three factors: the evolution of the world market, new sectoral
regimes, and the strategies of investing companies. Sectoral evolution was a
function of the global market, which is characterized by relatively regular
cycles of underinvestment and overinvestment caused by indivisibilities
and projects with long maturity periods. Over the long term, growth rates
of consumption and production tend to coincide.
The value of annual worldwide consumption of minerals and metals
grew from $93 billion to $172 billion between 1980 and 1996. This pe-
riod can be divided into two phases characterized by different dynamics.
The growth rate decelerated during the 1980s in comparison with the two
Table 6-14. Investment in Mining, 1990–97
Billions of dollars and percent
Country
Total investment
Share by country
Argentina
2.3
9.1
Brazil
4.4
17.6
Chile
15.5
61.7
Peru
2.9
11.6
Total
25.1
100.0
Source: Moguillansky and Bielschowsky (2000), on the basis of project data.
36. The region as a whole increased its participation in total world exploration from 26 to 29
percent during the 1990s; investment was concentrated in Chile (51 percent) and Brazil (24 percent),
with the remainder mainly in Peru (12 percent) and Argentina (10 percent).
37. The periodization used in this section and in the section on electricity and telecommunication
differs from the one used in the section on manufacturing. This is due both to a lack of available
quantitative information and, more fundamentally, to the fact that the principal determinant of the
evolution of these sectors (namely, privatization) occurred during what was identified as the second
phase in the evolution of the investment process. Therefore, it is more useful to work with a periodization
that includes two stages: before and after privatization.

184
H E T E RO G E N E I T Y I N R E S P O N S E S O F S E C TO R S A N D F I R M S
previous decades; it then accelerated in the late 1980s and early 1990s.
Following the usual cyclical pattern, rising consumption stimulated in-
creased supply, which was made possible by greater investments, and a de-
cline in prices that was accentuated toward the end of the decade as a result
of the international crisis.
Price reductions forced a series of technological innovations designed
to reduce costs, raise productivity, and increase profits.
38
These innova-
tions, such as mechanization, automated methods of control, robotization,
new methods of processing minerals, and the use of satellites in explora-
tion, were carried out mainly by TNC subsidiaries, particularly in iron,
copper, and gold exploitation.
The growing role of TNCs was facilitated by important reforms that
eliminated restrictions on foreign capital, modified the systems for grant-
ing concessions, and changed the tax regime. Chile was the first country to
establish a legal framework (in 1974) that did not discriminate between
national and foreign capital in the mining sector, followed by Argentina
and Peru in the early 1990s and Brazil in 1995. Changes in legislation
governing mining concessions sought to reduce uncertainty and risk in
areas where investment costs could be recovered only in the long run. In
1980 Chile enacted so-called full legal concessions, which brought conces-
sions exclusively within the realm of the judiciary. Expropriation would
entail full indemnity calculated according to the commercial value of the
concession, based on its present value. Similarly, Peru instituted a plan in
1992 which granted new concessions indefinitely.
39
Changes in tax systems
tended to simplify the tax structures and in a few cases, such as Chile, to
award virtually complete exemptions from income tax. In addition, several
countries reduced the costs associated with payment of taxes on external
remittances of capital and profits.
Chile’s legislative changes involving taxation and concessions did not
induce significant flows of mining investments in exploitation during the
1970s and 1980s: FDI averaged only $90 million annually in the period
1974–89; it rose to $800 million in 1990 and peaked at $1.7 billion in
38. Katz (2000, chapter 4).
39. New types of concession contracts have also been introduced in the privatization of oil and
natural gas. In Argentina and Peru, privatization has been almost total, while in Bolivia and Colombia
it has been only partial, and in Brazil and Mexico state monopolies are still in charge. Reforms in the
way concessions are granted have been instrumental for higher FDI flows to this sector, particularly in
Argentina, Bolivia, and Colombia. Moguillansky and Bielschowsky (2000, chapter 3) present a de-
tailed analysis of the dynamics of investment in this sector.

185
H E T E RO G E N E I T Y I N R E S P O N S E S O F S E C TO R S A N D F I R M S
1993–97. The state enterprise Codelco (Corporación Nacional del Cobre)
was the principal investor until 1988. The change in the regulatory system
permitted the acceleration of investment during the 1990s, but it had little
effect until the global market began an upward trend.
40
The principal actors in mining before the 1970s were TNC subsidiar-
ies, although medium-size and large local companies also played a role,
particularly in Peru and Brazil. The nationalizations of the 1970s strength-
ened the role of public enterprises, some of which remain important actors
today (for example, Codelco) or did until the late 1990s (for example,
CVRD, Companhia do Vale do Rio Doce, in Brazil).
The strategies and performance of public enterprises varied widely
among the different countries. Codelco undertook significant processes of
modernization, investment, and the forging of alliances with other firms
for exploration and exploitation, all of which opened access to financing.
Investment in Peru’s public enterprises diminished from $259 million in
1975–79 to $27 million in 1990–92. This explains the decline in gross
capital formation as a portion of total GDP in the mining sector as noted
above. In Brazil, the state was the principal owner of mineral deposits until
the privatization of CVRD in 1997. The decline of investment in Brazilian
mining can be attributed to a lack of exploration owing to the scarcity of
resources available to the public sector, restrictions on foreign investment
that remained in force until 1995, and a lack of infrastructure (including
energy, roads, and transportation). State investments remained stable at
about $36 million in 1978–95, while national private investment was ex-
tremely unstable and foreign investment fell from $51 million in 1978–85
to $10 million in 1990–95.
In the early 1990s, foreign firms stepped up their role in the region’s
mining sector through privatizations in Peru and the expansion of invest-
ment into areas not allocated to Codelco in Chile, although domestic capi-
tal retained a significant presence. In Brazil, however, foreign investment
did not flow heavily into the mining sector after investment liberalization
because of the saturation of the global market and because the lack of ex-
ploration in previous years meant that knowledge was scarce regarding the
country’s mineral reserves. The latter may be the principal reason for the
low level of investment in Brazilian mining, while elsewhere in the region
it grew rapidly. In the second half of the 1990s, foreign investment was
40. In 1974–85, important investments were undertaken in exploration that laid a base for later
exploitations.

186
H E T E RO G E N E I T Y I N R E S P O N S E S O F S E C TO R S A N D F I R M S
substantial not only in Chile but also in Peru, where investment in mining
became more dynamic in 1997–98.
41
In Argentina, foreign investment in
mining jumped from only $2 million in 1992 to $316 million in 1996,
suddenly ranking it among the most attractive countries in the world for
mining investment.
Investments by foreign corporations and large national firms tended
to be of a long-range nature and to employ cutting-edge technology. They
thus contributed to technological progress in the sector. These firms had
little difficulty financing their investments, and they frequently allied with
one another to undertake large-scale projects. Changes in the legal frame-
work that eliminated restrictions on contracting foreign loans, along with
decreases in taxes on capital remittances and profits, provided a boost in
favor of using resources from abroad. Since TNCs operate as global corpo-
rations, however, they had little incentive to establish higher value added
activities within the countries where mining takes place. Mines therefore
tend to function as enclaves, with scant, albeit increasing, articulation to
the rest of the national economy.
The stimulation of investment in mining appears to be concentrated
in relatively few countries and products. Besides the obvious fact that this
reflects variation in the availability of deposits, the difference between the
performance of Chile and Peru up until the mid-1990s illustrates the ad-
vantage the former enjoyed by being the first to establish a regulatory frame-
work favorable to foreign investment, and thus to be in a position to take
advantage of the change in the world market in the late 1980s.
Technological Revolution and Privatization in
Electricity and Telecommunications
The electricity and telecommunications sectors underwent great changes
in the 1990s. For a long time, the predominant actors in production and
investment in these sectors were public firms that often failed to optimize
performance, since their behavior was determined by objectives that fre-
quently contradicted one another: generating employment, providing low-
price services to low-income consumers, and subsidizing other firms at
public expense.
42
This behavior was not conducive to the incorporation of
41. Expectations were also raised for important investments in so-called mega-projects, a group of
large projects mainly in the fields of copper mining and natural gas, which, if realized, would represent
investments of close to $5 billion.
42. Unless otherwise indicated, the data in this section come from Moguillansky and Bielschowsky
(2000, chapter 4).

187
H E T E RO G E N E I T Y I N R E S P O N S E S O F S E C TO R S A N D F I R M S
technological progress or to the expansion of services when public spend-
ing was curtailed. Most countries undertook privatization and established
new rules of the game. These rules were directed at markets both for priva-
tized services and for new products, particularly in telecommunications.
Actions in these areas determined the level and structure of sectoral invest-
ment. New actors were incorporated through privatization and the open-
ing to domestic and foreign investors of markets previously restricted to
the state. The manner and context in which privatization occurred deter-
mined the kinds of actors that entered the market in each instance.
Chile began to privatize in the early 1980s and essentially had com-
pleted the process by the end of that decade. Privatization took place dur-
ing a period of economic crisis. As Moguillanksy argues, it was accompanied
by specific policies to stimulate the participation of new actors, who would
be crucial to the success of the process.
43
Examples of these policies include
the modernization and financial restructuring of firms prior to privatization,
the enactment of new legislation regulating the service tariffs charged by
firms that would be privatized, and measures to stimulate reluctant private
actors to take part in the privatization process.
This policy package brought both benefits and costs. Among the most
important benefits was the learning opportunity it created for local actors,
who were able to develop management skills that they later used to partici-
pate effectively in similar privatizations elsewhere in the region. The costs
included the low revenue obtained by the state in exchange for valuable
assets and the lack of transparency that characterized the process. Partici-
pants in the privatizations were mainly domestic businesses and institu-
tional investors, although foreign investors participated in the privatization
of local telephone services. In the second half of the 1990s, foreign inves-
tors began to acquire a significant stake in electricity generation, which had
been privatized in the previous decade.
Privatization spread throughout the region in the 1990s, although there
were exceptions in both electricity and telecommunications. For example,
the generation of electricity for public consumption remains a state mo-
nopoly in Mexico,
44
as does basic telephone service in Costa Rica. The
manner in which the privatizations were carried out varied according to
the circumstances of each country. “Enterprise capitalization” in Bolivia
43. For a more detailed analysis of the Chilean experience, see Moguillansky (1999).
44. This is not to imply that the participation of the private sector did not increase within the
electricity sector. Besides generating electricity for their own use, private actors participated in the
expansion of the sector through build-lease-transfer (BLT) contracts with the state, as well as through
the construction of complementary works.

188
H E T E RO G E N E I T Y I N R E S P O N S E S O F S E C TO R S A N D F I R M S
implied both privatization and the commitment of buyers to invest in the
privatized firms.
45
Some countries attempted to introduce systems of “popu-
lar capitalism,” for example by encouraging unions to acquire shares of the
privatized companies. Most of the offers, however, were put out for con-
trolling shares, which were largely acquired by international enterprises,
acting alone or in partnership with local business groups. This approach
avoided the fragmentation of control, and it eased the financing of the new
firms by enabling them to avoid high dividends and thus to retain a greater
portion of the profits, which could be reinvested. It also contributed to
increased concentration.
Privatizations changed the market structure, as competition was intro-
duced in electricity generation, long-distance telephone service, mobile tele-
phones, and other telecommunications services. Increased competitive
pressures derived not only from the introduction of more players into ex-
isting markets, but also from the creation of new markets whose products
competed with those of existing markets, as in the case of satellite or mo-
bile telephones with respect to basic telephone services. Sectoral regula-
tions tended to prevent vertical integration of different segments of activities,
as in the electrical sector in Argentina, Bolivia, and Peru. At the same time,
the conditions under which privatizations were carried out and the regula-
tory frameworks governing privatized markets established market reserves
and created entry barriers to new competitors in potentially contestable
segments in the telecommunications sector. Thus, for example, long-distance
telephone services were opened to competition in Chile only in 1994 and
in Mexico in 1997.
In this context of heightened competition in certain segments, together
with the maintenance of highly concentrated monopolistic or oligopolistic
conditions in others, the regulatory systems that determined service tariffs
had a powerful impact on investment performance. The regulatory agen-
cies responsible for these sectors went through a learning process in this
regard.
46
They discovered that markets with weaker regulation and higher
entry barriers tended to charge higher tariffs for service and to persist in
cross-subsidies.
47
In contrast, tariffs were reduced significantly in countries
45. Capitalization meant that the state kept half of the shares of the privatized company, while the
remaining half was sold to investors, who acquired the controlling rights and promised to invest
significant sums to capitalize the business.
46. The regulatory failures evidenced by the serious problems in the supply of electricity in Argen-
tina and Chile in early 1999 prove that these learning processes are far from complete, even in those
countries with the longest experience with privatization.
47. These subsidies occur, for example, between local and long-distance telephone or between
mobile and basic service.

189
H E T E RO G E N E I T Y I N R E S P O N S E S O F S E C TO R S A N D F I R M S
that established more transparent mechanisms and formulas for setting tar-
iffs, and in sectors more open to competition. In addition to awarding
periods of limited competition, countries in the region offered strong in-
centives for investors to participate in the electricity sector. These included
the state purchase of energy in Colombia and Mexico and tariff legislation
that assured levels of profitability in Bolivia, Chile, and Peru.
Evaluating the impact of the privatization processes on investment and
the incorporation of technological progress in both telecommunications
and electricity is difficult because of a lack of comparable information among
countries, the heterogeneous paths through which the processes unfolded
in the various countries, and the short time elapsed since the privatizations.
The situation is more homogeneous in the telecommunications sector.
All project countries except Costa Rica had completed or were far along in
the privatization process. A few TNCs, which compete with one another
for global market shares, controlled or participated decisively alongside
domestic groups in the privatized firms. In this context, the investment
coefficient for the sector increased in most countries considered in table 6-
15. These investments were also reflected in an expansion of service, as
measured on the basis of total lines installed.
48
Privatizations played a cru-
cial role in the evolution of investment, but they were not the only deter-
minant of sectoral dynamics. Other factors that were also important include
the technological dynamism of the sector at the international level, rivalry
among large TNCs for new markets, the strengthening of competition pres-
sures on firms already established in the market, and the backward initial
conditions of service in the region. Companies actually exceeded their goals
for the expansion of networks and services, which were negotiated during
the privatization process, and investment and productivity also grew in
countries that privatized late, such as Brazil, or that did not privatize at all,
such as Costa Rica.
The dynamics were more uneven in the electricity sector. Costa Rica,
Jamaica, and Mexico did not privatize their public enterprises, although
Mexico stimulated private sector participation in financing. Argentina,
Bolivia, Colombia, and Peru made significant progress toward privatization,
although the state maintained an important role in investment. Chile un-
derwent a total privatization since the 1980s. The data on the evolution of
investment do not show a dynamic performance for the sector as a whole
(see table 6-15), but it is important to bear in mind two relevant factors.
First, in some countries, such as Argentina, the state made important in-
48. Katz (2000, chapter 4); Walter and Senén (1998).

190
H E T E RO G E N E I T Y I N R E S P O N S E S O F S E C TO R S A N D F I R M S
vestments before privatization, which diminished pressures on the private
sector to expand immediately upon its entry into the market. Second, for
those countries for which data enable us to evaluate trends in private in-
vestment (namely, Chile, Colombia, and Peru), the growth rate equaled or
surpassed the corresponding levels for public investment.
49
In both the electricity and telecommunications sectors, crucial tech-
nological advances occurred in the aftermath of privatization. Advances in
the production of electricity reflected the incorporation of new processes,
such as the use of combined cycle gas turbines and the adoption of new
forms of strategic management. The telecommunications sector benefited
from the revolution in information technologies.
Table 6-15. Investment in Telecommunications and Electricity, 1980–97
Percent of GDP
Sector and country
1980–1988
1989
1990–1995
1997
Telecommunications
Argentina
n.a.
n.a.
0.7
n.a.
Bolivia
n.a.
n.a.
0.7
2.3
Brazil
0.4
0.6
0.6
0.8
Colombia
0.4
0.5
0.7
1.4
Chile
0.6
0.6
1.3
1.9
Mexico
n.a.
0.4
0.5
0.2
Peru
0.1
0.1
1.1
0.8
Electricity
Argentina
1.3
0.5
0.4
0.3
Bolivia
n.a.
0.8
1.5
2.3
Brazil
1.6
1.7
1.1
0.6
Colombia
2.4
1.7
2.2
2.6
Costa Rica
a
1.9
n.a.
1.8
2.6
Chile
1.7
2.0
1.3
2.1
Mexico
n.a.
0.6
0.6
n.a.
Peru
1.4
0.4
1.1
1.2
Source: Moguillansky and Bielschowsky (2000), on the basis of project data.
a. Includes telecommunications.
49. Moguillansky and Bielschowsky (2000, chapter 4). In Chile, the private sector undertook im-
portant investments in 1989–96 that are not reflected in investment as a percentage of total GDP,
owing to the decline in state investment and strong GDP growth in the period.

191
H E T E RO G E N E I T Y I N R E S P O N S E S O F S E C TO R S A N D F I R M S
Privatizations were accompanied not only by the expansion of tele-
phone networks, but also by the incorporation of new areas of activity and
improved quality of service. The degree of digitalization provides an indi-
cator of the latter; it reveals a strong absolute increase as well as a surpris-
ingly rapid convergence toward the international frontier, as represented
by levels in the United States (see table 6-16). A similar convergence is
evident in the number of lines in service per employee, which is a good
indicator of average labor productivity in the sector. Katz reports consider-
able advances in other indicators of performance, such as reductions in the
number of customers lacking service and in the average daily number of
service breakdowns awaiting repair. Indicators of the use of human resources
in privatized companies also show substantial modernization and improve-
ments in labor relations, including an increase in the number of profes-
sionals, a reduction in the average age and seniority of employees, decreased
absenteeism, and an improvement in labor relations.
50
The reforms involving privatization strongly affected the electricity
and telecommunications sectors, even more than was the case in mining.
Investment picked up, and quality and productivity quickly converged to-
ward international levels, although the performance of telecommunica-
tions was far superior to that of electricity. Currently, their principal problem
is the insufficiency of sectoral regulatory frameworks, which, together with
the weakness of the regulatory agencies overseeing individual firms, often
led to the establishment of barriers to entry in various segments of the
market. Electricity faces an additional challenge: maintaining trends in in-
vestment and technological progress under conditions of decreased state
support and tariffs established under less favorable conditions.
Increasing Heterogeneity in Sectoral Employment
At the aggregate level, as we saw in chapter 5, the reforms had a nega-
tive impact on employment creation. At the sectoral level, the impact of
the reforms varied considerably, in part because they interacted with trends
long underway. The long-term trend of falling employment in agriculture
and expanding employment in services accelerated in the 1990s.
51
At the
same time, the strong expansion of employment in the manufacturing sec-
50. Katz (2000, chapter 4).
51. Unless otherwise indicated, information in this section comes from Weller (2000, chapter 5).

192
H E T E RO G E N E I T Y I N R E S P O N S E S O F S E C TO R S A N D F I R M S
T
able
6-16.
Indicators
of
Quality
and
P
roductivity
in
T
elecommunications,
1986–96
Indicator
1986
1987
1988
1989
19901991
1992
1993
1994
1995
1996
Digitalization
(per
cent)
Latin
America
a
1.4
5.3
15.0
16.6
23.6
27.8
39.6
49.8
60.7
69.0
74.5
U
nited
States
26.0
32.0
36.0
41.0
47.0
52.7
58.7
66.0
74.1
78.4
80.5
L
ines
in
ser
vice
per
emplo
yee
(number)
Argentina
7
0
5
0
5
5
5
9
6
2
7
0
9
0
1
1
0
1
5
0
1
7
0
2
9
6
B
razil
7
0
7
5
8
0
8
0
8
5
9
0
1
0
0
1
1
0
1
3
0
1
6
0
1
7
0
Chile
6
5
n.a.
n.a.
7
0
8
4
1
2
5
1
5
2
1
7
7
2
0
8
2
3
5
2
9
1
M
exico
9
5
9
0
9
5
1
0
0
1
1
0
1
2
0
1
3
0
1
5
0
1
6
0
1
7
0
1
6
0
U
ruguay
7
2
7
7
7
0
5
9
6
0
6
5
6
5
7
0
1
0
0
1
1
0
1
5
0
Latin
America
a
72
70
73
78
86
98
110
123
139
158
185
U
nited
States
1
4
0
1
3
8
1
4
4
1
5
0
1
4
9
1
5
4
1
6
3
1
7
0
1
7
4
1
8
3
1
9
0
Source:
W
alter
and
Senén
(1998);
M
oguillansky
and
B
ielscho
wsky
(2000),
on
the
basis
of
project
data.
a.
Includes
Argentina,
B
razil,
Chile,
Colombia,
M
exico,
Pe
ru,
P
uer
to
Rico,
U
ruguay
,
and
V
ene
zuela.

193
H E T E RO G E N E I T Y I N R E S P O N S E S O F S E C TO R S A N D F I R M S
tor, which came to a halt in the early 1980s and then resumed at the end of
that decade, appears to have come to an end.
52
Between 1990 and 1997, agricultural employment fell by an annual
average of 0.9 percent in the nine project countries (see table 6-17). In
three countries where total employment in the sector decreased (Brazil,
Chile, and Costa Rica), both family and commercial agriculture performed
poorly (see table 6-18). Demand for labor in the more dynamic activities
was not strong enough to offset the loss of employment in the less dynamic
ones.
53
The family-based rural economy, for its part, did not even generate
enough jobs to cover its natural population growth. In countries where
total employment in the sector increased (Mexico and Peru), it expanded
in all the main categories, namely, wage earners, self-employed workers,
Table 6-17. Employment Growth by Sector, 1990–97
a
Percent
Sector
Employment growth
Contribution to total
Agriculture
–0.9
–13.2
Manufacturing industry
1.1
8.5
Construction
2.7
8.8
Commerce, restaurants, and hotels
3.6
32.7
Electricity, gas and water, transportation,
storage, and communications
4.9
12.0
Financial services, insurance, real estate, and
business services
6.9
13.4
Social, communal, and personal services
2.7
41.7
Other
–3.1
–4.0
Total
2.0
100.0
Source: Weller (2000), on the basis of official country statistics.
a. Annual weighted averages for the nine project countries.
52. Reinhardt and Peres (2000) show that agriculture reduced its share in total employment from
41 percent in 1970 to 24 percent in 1995–97, while total industry, which includes manufacturing
and construction, reduced its share from 23 percent to 21 percent. The share of services increased
from 36 percent to 55 percent in the same period.
53. This was not the situation in the 1980s. In Chile and Costa Rica, for example, nontraditional
agricultural exports contributed to the strong growth in employment in the middle of that decade
(Gómez and Echeñique, 1998; Weller, 1996).

194
H E T E RO G E N E I T Y I N R E S P O N S E S O F S E C TO R S A N D F I R M S
and nonwage workers. In Peru, the exceptional growth of the rural work
force is explained by increased security in rural areas.
54
These situations were influenced by the demographics of each country
and by job opportunities in agriculture and in the rest of the economy,
both urban and rural. In fact, by the mid-1990s more than 20 percent of
the total agricultural labor force lived in urban areas.
55
At the same time,
rural residents were increasingly employed in nonagricultural jobs, which
currently represent more than 30 percent of rural residents’ principal em-
ployment and more than 40 percent of their incomes.
Employment dynamics across agricultural activities varied according
to their labor intensity. The reduction of import tariffs, the elimination of
production or import monopolies, and the overvaluation of national cur-
rencies resulted in a greater supply of more diversified and less expensive
agricultural equipment. Counteracting lower prices, the cost of credit to
the agricultural sector increased (previously it was heavily subsidized in
most countries), and its availability decreased when targeted credit lines
were eliminated. Producers with access to credit were therefore the main
beneficiaries of the fall in machinery prices. They substituted equipment
for unskilled (sometimes temporary) labor, thereby keeping a substantially
54. The data on Mexico are of doubtful quality owing to measurement problems. Consequently,
caution should be used in drawing conclusions from them.
55. As defined by the population census in each country (see Dirven, 1999).
Table 6-18. Change in Agricultural Employment by Occupational Category,
1988–97
Percent
Total
Nonwage
agricultural
Country (period)
Wage earners
Self-employed
workers
employment
a
Brazil (1992–97)
–2.6
–0.8
–2.8
–1.9
Chile (1990–96)
–0.8
1.3
–8.5
–0.8
Colombia (1988–95)
n.a.
n.a.
n.a.
–1.3
Costa Rica (1990–96)
b
0.1
–1.1
–7.4
–1.1
Mexico (1991–97)
5.7
2.7
3.0
1.6
Peru (1994–97)
b
8.5
8.2
10.5
9.4
Source: Weller (2000), on the basis of project data.
a. Includes other non-specified employment.
b. Self-employed workers include employers.

195
H E T E RO G E N E I T Y I N R E S P O N S E S O F S E C TO R S A N D F I R M S
smaller, but more stable and highly skilled, work force. The reduction of
labor demand is reflected in the evolution of wages. For the three project
countries for which information is available (Chile, Costa Rica, and Mexico),
agricultural wages fell in relation to the average wage in the economy.
Manufacturing employment increased in Latin America as a whole in
the 1990s, with an annual growth rate of 1.1 percent (see table 6-17). The
project countries demonstrate a sharp contrast between situations in which
manufacturing employment was stagnant or falling (Argentina, Brazil,
Colombia, and Peru) and those in which it increased substantially (Mexico
and Bolivia) (see table 6-19). Weller shows that in countries where employ-
ment grew slowly or fell, average labor productivity increased; the converse
was the case for countries where employment grew.
56
This evolution was
the result of the interaction of forces related to dynamics of manufacturing
employment in large versus smaller firms and to changes in the subsectoral
structure of manufacturing.
Microenterprises and small firms provided strong employment growth.
For the six project countries included in table 6-20, their job creation record
was much better than that of large enterprises and better than the manufac-
56. Weller (2000, chapter 5).
Table 6-19. Change in Manufacturing Employment, 1990–97
Percent
Country
Annual growth rate
Argentina (urban total)
–2.2
Bolivia (provincial capitals)
8.8
Brazil
a
0.3
Chile
2.2
Colombia
b
–0.9
Costa Rica
0.6
Jamaica
b
1.1
Mexico
b
4.3
Peru (Lima)
–0.1
Total
c
1.2
Source: Weller (2000), on the basis of household surveys.
a. Data for 1992–97.
b. Data for 1991–97.
c. Weighted average.

196
H E T E RO G E N E I T Y I N R E S P O N S E S O F S E C TO R S A N D F I R M S
turing total in most countries.
57
Indeed, they created enough jobs to offset
the decline in larger firms. Argentina, Brazil, and Chile experienced a large
decline in manufacturing employment in medium-size and large firms,
while only in Bolivia and Mexico did employment in larger firms grow. In
the case of Mexico, larger firms accounted for 42 percent of net new job
creation.
The characteristics of job creation in Mexico differed from those of
other project countries, except Costa Rica.
58
Labor-intensive sectors rap-
57. Periodization in table 6-20 differs slightly from that in table 6-19 because of different availabil-
ity of disaggregated data..
58. Similar processes are taking place in other Central American and Caribbean countries as well
(Buitelaar, Padilla, and Urrutia, 1999).
Table 6-20. Change in Manufacturing Employment by Size of Firm, 1990s
Percent
Wage earners
Medium-
size and
Micro-
Small
large
enter-
enter-
enter-
Un-
Country (period)
prises
prises
prises
specified
Other
Total
Change in employment
Argentina (1991–97)
0.2
0.6
–1.0
–13.6
–2.6
–2.1
Bolivia (1989–96)
14.3
16.8
5.9
n.a.
16.8
13.3
Brazil (1993–96)
8.8
4.5
–2.5
–11.1
1.1
–0.7
Chile (1990–96)
3.0
3.7
–1.9
0.3
2.4
3.1
Costa Rica (1990–96)
7.4
7.3
–0.3
23.4
–1.3
0.5
Mexico (1991–97)
12.2
1.7
4.3
–16.3
4.9
4.3
Contribution to total employment change
Argentina (1991–97)
1.1
8.1
–11.6
–71.4
–26.2
–100.0
Bolivia (1989–96)
11.6
13.8
9.6
n.a.
65.0
100.0
Brazil (1993–96)
106.1
53.6
–265.0
–17.7
23.1
–100.0
Chile (1990–96)
27.6
122.8
–67.8
1.1
16.3
100.0
Costa Rica (1990–96)
118.0
42.8
–34.4
34.9
–61.3
100.0
Mexico (1991–97)
26.4
6.7
42.2
–3.7
28.4
100.0
Source: Weller (2000), on the basis of household surveys.
Note: The definition of groups of enterprises varies by country. Microenterprises always contain up
to 5 workers. Small enterprises contain 6 to 9 in Costa Rica, 10 or under in Brazil, 49 or under in
Chile, and 50 or under in Argentina, Mexico, and Peru.

197
H E T E RO G E N E I T Y I N R E S P O N S E S O F S E C TO R S A N D F I R M S
idly increased their share of total manufacturing employment, which grew
substantially. Jobs also grew strongly in metal products, automobiles, and
the maquila plants. Employment in maquila plants, whose output consists
mainly of car parts, electrical and electronic products, and garments came
to account for more than one million jobs and about one-fourth of all
manufacturing employment in the country. Integration into the North
American economic space began before the reforms, but the reforms accel-
erated the process. As a result, Mexico’s employment pattern approximated
the expectations described at the beginning of this chapter.
At the subsectoral level, data for employment in medium-size and large
firms show that two simultaneous processes were at work. First, labor-
intensive subsectors lost share relative to more capital-intensive ones. Highly
labor-intensive sectors such as textiles, garments, leather products, and foot-
wear continued to lose ground within manufacturing in the 1990s (see
table 6-8), while the capital-intensive production of natural resource–based
commodities kept the important share it won in the 1970s and 1980s.
59
Although some relatively labor-intensive subsectors were dynamic (for ex-
ample, metal products), the changes in the production structure of the
sector had a negative impact on job creation. Thus, if the sectoral compo-
sition of manufacturing output had not changed between 1990 and 1996,
employment in the medium-size and large firms would have fallen by only
0.4 percent instead of 0.8 percent, as a simple average for the six projects
countries shown in table 6-8. Second, within subsectors, incorporation of
technical progress resulted in layoffs or less employment creation than usual,
even in sectors with strong increases in output (such as automobiles).
Wages in manufacturing increased in relation to the average wages in
the total economy in only three project countries (Chile, Costa Rica, and
Mexico), while they fell in four (Bolivia, Brazil, Colombia, and Jamaica).
As discussed in chapter 5 for the economies as a whole, this pattern sug-
gests that there was no trade-off between the evolution of wages and the
dynamics of sectoral employment. Nor was there always a direct relation
between wages and labor productivity. In Brazil, sharp sectoral employ-
ment reduction implied increased productivity; this was accompanied by a
fall in relative wages. Labor productivity growth thus resulted more from
layoffs rather than from an upgrading of the labor force.
Finally, in almost all project countries, the wage gap between formal
and informal firms increased in favor of the former throughout the 1990s.
This is consistent with the concentration of productivity gains in the larger
59. Katz (2000, chapter 2).

198
H E T E RO G E N E I T Y I N R E S P O N S E S O F S E C TO R S A N D F I R M S
firms, and it shows that segmentation between firms of different sizes in-
cluded all variables: investment, productivity, and wages. Microenterprises
were the main providers of jobs, but they could only offer low-productivity,
relatively low-paid employment. Even the fast-growing maquila plants in
Mexico paid wages 30 percent below the average for manufacturing in the
mid-1990s.
60
Growth of labor demand in countries with important maquila
operations could not offset their large supply of unskilled labor.
The most dynamic employers were in the services, which explain more
than 95 percent of new net job creation (see table 6-17). The services sector
is highly heterogeneous, but two general situations can be identified. First,
commerce, restaurants and hotels, together with social, communal, and
personal services, accounted for 74 percent of all jobs created in the region.
Second, financial services, insurance, real estate, and business services ex-
perienced even faster growth, as did electricity, natural gas and water, in
addition to transportation, storage, and communications. Their small share
in total employment, however, meant that these categories contributed only
26 percent of new jobs.
Each of these branches of the services sector is internally diverse in
terms of the qualifications of those working there. In commerce, restau-
rant, and hotel activities, the informal nature of much retail trade con-
trasts sharply with the expansion of large modern supermarkets. Similar
diversity is found in communal, social, and personal services and in fi-
nancial services, insurance, real estate, and business services. The former
manifests a clear polarization between the demand for more highly quali-
fied labor in health and education, on the one hand, and employment in
domestic service, on the other. In the latter, financial activities and insur-
ance contrast with business services, which include security, maintenance,
and cleaning.
The economic reforms played an important role in the growth of em-
ployment in services, as well as in the polarization that took place within
the sector. Although the privatization of electricity and telecommunica-
tions was immediately followed by significant layoffs in most countries, it
led to the modernization and expansion of those services, which account
for their job creation. Similarly, trade liberalization led to the expansion of
services related to export-import processes, while financial liberalization
led to the introduction of new financial services and to new employment.
Finally, pressures to reduce costs led to the outsourcing of service activities
60. Buitelaar and Padilla (2000).

199
H E T E RO G E N E I T Y I N R E S P O N S E S O F S E C TO R S A N D F I R M S
previously undertaken within manufacturing firms, which account for the
strong development of business services.
These sectoral and microeconomic impacts of the reforms ran parallel
to macroeconomic impacts. Moderate economic growth, in the context of
a growing economically active population, implied a supply push for job
creation that resulted in the strong expansion of employment in the infor-
mal sector. As was the case in manufacturing, some very dynamic job cre-
ators in the services offered low-paid jobs. In particular, wages in commerce,
restaurants, and hotels, which accounted for 33 percent of net job creation,
fell in relation to the average wage in the economy in five out of seven
project countries.
Conclusions
The sectoral and microeconomic analyses complement the results on
growth and employment presented in the previous two chapters. Behind
aggregate figures showing moderate growth of GDP, investment, and em-
ployment, we found substantial heterogeneity with respect to patterns across
sectors and types of firms. Capital formation was concentrated in a rela-
tively small number of subsectors, giving rise to processes of specialization
that coincided with a strong export orientation in many, but not all, cases.
Nonetheless, production for the domestic market was not neglected: the
poor performance of sectors such as clothing and footwear was offset by
the excellent performance in foodstuffs.
Large firms were the most important investors, although smaller com-
panies had a minor presence in some activities where investment grew rap-
idly. Among big firms, TNC subsidiaries gained ground vis-à-vis large
domestic conglomerates. These subsidiaries were responsible for much of
the investment growth, not only in the most dynamic areas of manufactur-
ing, but also in mining and telecommunications. Privatizations, liberaliza-
tion of regulations that prevented foreign firms from investing in many
sectors, and the globalization of important industries combined to
strengthen the position of foreign corporations.
As with investment, technological progress was not distributed homo-
geneously among sectors and firms. Manufacturing subsectors in which
investment grew most rapidly generally showed a sharp increase in produc-
tivity and, in many cases, closed the productivity gap with respect to the
United States. This was partly a continuation of adjustment processes be-
gun during or even before the crisis of the 1980s. Although the gap be-

200
H E T E RO G E N E I T Y I N R E S P O N S E S O F S E C TO R S A N D F I R M S
tween the productivity of large firms and that of small and medium-size
enterprises narrowed in some countries, performance continued to be ex-
tremely dissimilar. Modernization processes, like investment, occurred
mainly among larger firms.
The importance of external factors in the incorporation of new tech-
nologies increased in tandem with the investment process. The growing
significance of imported capital goods, the substitution of foreign for do-
mestic inputs, and the construction of technologically advanced plants by
foreign firms all resulted in a greater presence of foreign components in the
region’s national innovation systems. At the same time, the state reduced its
involvement in technological efforts, but private actors have not always
stepped in to fill the void.
61
Trade liberalization and privatization were the reforms that had the
greatest impact at the sectoral and microeconomic levels. Trade liberaliza-
tion put pressure on firms to increase competitiveness by substituting im-
ported for national inputs. It also facilitated subregional integration processes
that opened markets for manufacturing subsectors in which investment
and the incorporation of technical progress were most dynamic.
Privatization, meanwhile, was instrumental in stimulating the mining, elec-
tricity, and telecommunications sectors, especially when it coincided with
a favorable international environment or took place in sectors experiencing
accelerated technological change.
Despite many positive developments, important problems remain, in-
cluding growing manufacturing trade deficits; the enclave nature of large
mining firms; uncertainty about future investments in the electricity sector
once the currently installed capacity is fully utilized and service tariffs are
set under market conditions; and poor regulation plus high barriers to en-
try for new competition in both electricity and telecommunications.
At a more general level, the reforms did not solve, and quite probably
increased, two problems: investment continued to be concentrated among
large enterprises that have not shown the capacity to develop backward and
forward linkages with smaller firms, and supplier chains were destroyed by
the quest for competitiveness through increasing imported inputs. Both pro-
cesses led to specialization and higher efficiency, but they also led to polariza-
tion among actors and the persistence of the external constraint on growth.
Moreover, the reforms did not deliver the expected employment growth
in the tradables sectors. Commercial agriculture and formal sector manu-
61. Katz (2000, chapter 6).

201
H E T E RO G E N E I T Y I N R E S P O N S E S O F S E C TO R S A N D F I R M S
facturing firms underwent an important process of modernization, which
implied a more intensive use of capital. This negatively affected job cre-
ation in those sectors where output grew most strongly, such as natural
resource–based commodities and the automobile industry. Changes also
occurred across sectors, as well as within sectors. Specifically, activities that
have traditionally produced the largest volume of employment, such as
textiles and garments, declined across the board. Only the maquila assem-
bly plants, operating under conditions that differ from those of the rest of
the economy, provided the strong growth in highly labor-intensive activi-
ties that the reforms were expected to produce.
Slow growth in labor-intensive tradables had a number of causes. First,
the contradiction between the reforms, which sought to move toward an
export-led growth model, and macroeconomic policies, which led to over-
valued exchange rates, sent producers ambiguous signals that hindered in-
vestment in tradables sectors. This contradiction led to crises that produced
a high degree of instability in GDP growth and thereby had a negative
effect on investment. Second, assumptions made about the region’s com-
parative advantage were wrong, at least for the level of generalization to
which they applied. The regional experience and international compari-
sons have shown that the main advantage of Latin America in general, and
of the South American countries in particular, lies in natural resources rather
than in unskilled labor. This factor was compounded by changes in the
relative prices of factors of production, which occurred when trade liberal-
ization sharply reduced the relative cost of capital goods.
The services absorbed much of the residual labor not employed by
manufacturing and agriculture. In the process, polarization increased be-
tween activities that had been rapidly modernized and traditional ones that
employed a low-skill work force. The residual labor tended to be employed
by the latter, leading to slow growth in the overall productivity of the sec-
tor. Microenterprises offered the greatest number of jobs, with most of
them operating on an informal basis. The low rate of job creation by large,
modern firms that offered higher wages led to a wider wage gap. Poor em-
ployment performance in the tradables sectors has thus been accompanied
by increasing heterogeneity and polarization in the labor market.

202
P O L I C Y A G E N D A F O R T H E N E X T D E C A D E
202
7
A Policy Agenda
for the Next Decade
T
his final chapter of the book first summarizes what
the empirical research says about the recent trajec-
tories of the nine economies we have studied, focusing on how the reforms
have changed these economies at the aggregate, sectoral, and microeconomic
levels. We also attempt to determine the direction in which they seem to be
heading in order to explain the reasons for undertaking the second task of
the chapter: to propose a set of policy recommendations on how to im-
prove the performance of the nine economies as they move into the new
century. While we agree with many of the basic orientations that have
emerged in the last ten to fifteen years, the reforms and the policies that
have accompanied them can work much better. This is particularly the case
with respect to employment and equity, but growth also needs to be more
dynamic.
The Reforms and Their Impact
All nine project countries effected major changes in development strat-
egy and public policies. A set of “first generation” reforms—import liberal-
ization, domestic financial liberalization, capital account opening,
privatization, and tax reform—was adopted to open the economies and to

203
P O L I C Y A G E N D A F O R T H E N E X T D E C A D E
increase the role of market forces. In addition, macroeconomic policies
became more equilibrated, and social expenditure increased substantially.
Despite the generally similar policy trends, however, countries differed con-
siderably in the extent to which they implemented the reforms and the
style in which they were introduced. The reforms were instituted to vary-
ing degrees in the nine countries because of differences in initial condi-
tions, especially inflation rates, past growth performance, and economic
distortions. Countries with especially negative initial conditions—namely,
Argentina, Bolivia, Chile, and Peru—turned out to be aggressive reform-
ers. Presumably thinking they had little to lose and much to gain, they
implemented many reforms in rapid order. Other countries, which had
done well in previous periods and wanted to preserve certain elements in
their societies and economies, became cautious reformers. This group—
including Brazil, Colombia, Costa Rica, Jamaica, and Mexico—adopted a
more gradual, selective approach to the reforms.
The reform results were neither as positive as supporters predicted nor
as negative as opponents feared. Indeed, the reforms per se seem to have
had a surprisingly small impact at the aggregate level, based on calculations
using regional averages. It is only when we move to the country, sectoral,
and microeconomic levels that the magnitude of the changes begins to
become apparent. The principal aggregate level results can be summarized
in five points.
—Growth recovered with respect to the 1980s, but there was no gen-
eralized surge (or decline) in output; many countries grew below their rates
in the 1950–80 base period. Econometric evidence suggests that the im-
pact of the reforms was positive, but small.
—Exports increased substantially, but imports grew even faster, lead-
ing to enlarged trade deficits.
—Investment and productivity recovered the ground that was lost in
the 1980s, but no big gains occurred. As with growth, the reforms played a
positive, but minor, role.
—Employment lagged behind the modest growth rates, and the qual-
ity of new jobs presented serious problems. The reforms appear to have
played a negative role with respect to the quantitative aspects of job cre-
ation, but once again it was small.
—Inequality increased slightly, although serious measurement prob-
lems prevent a precise analysis of distribution trends. The reforms played a
small, negative role, as with employment.
The biggest policy changes in a generation thus resulted in fairly mod-

204
P O L I C Y A G E N D A F O R T H E N E X T D E C A D E
est changes in performance at the aggregate level. The propositions set out
in chapter 1 provide elements for solving this puzzle. First, the reforms
worked slowly, especially with respect to investment, because of the great
uncertainty they generated; this was frequently exacerbated by macroeco-
nomic instability. Uncertainty gave rise to three phases in the post-reform
investment process: an initial decline, a recovery, and—only after the tran-
sitory factors that produced the first two phases had dissipated—a consoli-
dation to normal levels. Second, the reforms and policies were frequently
inconsistent, which increased the uncertainty that investors had to face.
Third, international variables, especially volatile capital flows, contributed
to both inconsistency and uncertainty. Fourth, different actors (that is,
countries and firms) had different capacities to respond to the reforms;
only a few could move quickly to take advantage of new opportunities,
which contributed to slow change and inequality. Fifth, the reforms were
incomplete and need complementary policies to make them function prop-
erly. Only now are most countries beginning to implement a “second gen-
eration” of reforms that involve improvement of regulation, public
administration, the judiciary, and particularly education.
Proponents of the reforms expected that growth, employment, and
equity outcomes would demonstrate a consistent, positive relation as a re-
sult of the policy changes. The reforms were expected to increase the effi-
ciency of the economies and provide incentives for more investment.
Investment and increased productivity would raise growth rates. In turn,
higher growth would lead to more employment, especially for unskilled
labor, and ultimately result in increased equity. Table 7-1 provides a very
rough set of qualitative indicators that summarize performance results in
comparison to these expectations.
Of the nine countries in the project, only Chile has come near to ful-
filling the broad expectations held out for the reforms. It is essential to
point out, however, that the Chilean economy went through multiple cri-
ses in the first decade after the initiation of the reforms. Significant policy
adjustments were made starting in the mid-1980s, and these were deep-
ened after the resumption of democratic rule in 1990, leading to the per-
formance described in the table. What has Chile achieved? In quantitative
terms, it has greatly increased investment and productivity with respect to
its own past and to the rest of the region in the present. It has also kept its
external accounts in order through an emphasis on exports and high do-
mestic savings. These factors led to rapid and stable growth (until the crisis

205
P O L I C Y A G E N D A F O R T H E N E X T D E C A D E
of the late 1990s revealed some previously ignored weaknesses on the exter-
nal front and with respect to macroeconomic consistency). With GDP
growth averaging about 7 percent per year for nearly fifteen years, employ-
ment creation was strong and poverty alleviation was notable. Household
income concentration remained stubbornly high, but primary distribution
became somewhat more equal and social services expanded. In qualitative
terms, innovative macroeconomic policies were geared to maintaining sta-
bility and restraining volatility. Equally important, incentives were pro-
vided to the private sector to stimulate the investments that were needed to
continue the economic expansion.
The experiences of the other eight project countries are a mix of partial
successes and pending challenges. They can be divided into three groups,
based on the nature of their achievements and the problems they still face.
First, Argentina, Bolivia, and Peru also improved their growth records in
Table 7-1. Relation between Reforms and Outcomes in the 1990s
Invest-
Produc-
Employ-
Country
Reforms
a
ment
b
tivity
c
Growth
d
ment
e
Equity
f
Argentina
Aggressive
=
+
+
–
–
Bolivia
Aggressive
+
–
+
+
–
Brazil
Cautious
–
–
–
–
=
Chile
Aggressive
+
+
+
+
+
Colombia
Cautious
+
–
–
–
–
Costa Rica
Cautious
+
–
–
+
+
Jamaica
Cautious
n.a.
n.a.
–
=
n.a.
Mexico
Cautious
=
–
–
+
–
Peru
Aggressive
=
+
+
–
+
a.
Reforms: for definition, see chapter 3.
b. Investment: + means that a country had a higher investment coefficient in the 1990s than in the
base period (1950–80); – means that it had a lower coefficient; = means there was little change (see
chapter 4).
c. Productivity: + means that growth of total factor productivity was higher in the 1990s than in the
base period (1950–80); – means that it was lower; = means there was little change (see chapter 4).
d. Growth: + means that a country grew faster in the 1990s than in the base period (1950–80);
– means that it grew more slowly (see chapter 4).
e. Employment: + means that the country ranked high on the labor market index; – means than it
ranked low; = means that there was little change (see chapter 5, first three elements of the index only).
f. Equity: + means that primary income distribution in the latest available year was more equal than
the pre-reform period; – means that it was less equal; = means that there was little change (see
chapter 5).

206
P O L I C Y A G E N D A F O R T H E N E X T D E C A D E
the 1990s in comparison with their past performance. Like Chile, they
were all aggressive reformers that initially faced overwhelming problems
including hyperinflation, poor economic performance, highly distorted
economies, and serious problems of governability. All this represented enor-
mous opportunities for improvement once new policies—both reforms
and macroeconomic stabilization—were implemented and gained cred-
ibility. High GDP growth was achieved through a combination of factor
accumulation or strong productivity growth. Nonetheless, all three econo-
mies are still fragile, and the societies have serious social problems, espe-
cially unemployment in Argentina and poverty in Bolivia and Peru.
A second group had less success in matching its past growth perfor-
mance, but was nonetheless highly successful regarding exports and em-
ployment. The primary example is Mexico, closely followed by Costa Rica.
Both countries were able to break into the markets of the industrialized
countries, particularly the United States. Their higher participation in those
markets was achieved mainly through labor-intensive exports from the
maquila (in-bond) plants, which are part of the production chains that
integrate the northern part of the hemisphere. Costa Rica and Mexico gen-
erated a substantial amount of employment through these exports. Real
wages rose rapidly in Mexico until the peso crisis in 1994–95, but they
have been stagnant since them. In Costa Rica, wages are among the most
dynamic found in the project countries. Both countries turned in surpris-
ingly strong performances in the face of the international financial crisis
that buffeted the region in the late 1990s, based largely on the strength of
the U.S. economy. On the social front, the improvement of basic services,
together with relatively better initial conditions, allowed Costa Rica to deal
with issues of equity more successfully than Mexico.
The remaining countries are mainly characterized by the multifaceted
challenges they face. Brazil, Colombia, and Jamaica make up this group,
although the lack of information on Jamaica makes it very difficult to judge
what is happening there. Brazil and Colombia were strong performers in
an earlier period; they have undertaken significant reforms without yet
consolidating a new model to replace the one that served them well in the
past. Serious ongoing macroeconomic problems, including fiscal deficits,
external deficits, and high interest rates, have made the private sector very
reluctant to participate in moving the economies forward. Low growth
rates have begun to increase unemployment and other social problems,
which undermine the governments’ ability to find solutions to the chal-
lenges they face.

207
P O L I C Y A G E N D A F O R T H E N E X T D E C A D E
The type of aggregate analysis that is possible at the regional and coun-
try levels leaves many unanswerable questions. Moving to the sectoral and
microeconomic levels provides additional insights and offers leverage to
draw conclusions about probable future trends. It also offers a contrast to
the aggregate analysis, since here we find evidence of stronger impact of the
reforms. Beginning with the sectoral level, two reforms—namely, trade lib-
eralization and privatization—had an important impact on investment,
productivity, and employment.
—Investment was concentrated in a relatively small number of sectors.
Only one sector (telecommunications) saw dynamic investment in all coun-
tries, and only one country (Chile) increased investment in all major sec-
tors. Manufacturing investment was particularly dynamic in some
capital-intensive subsectors (for example, cement, steel, petrochemicals, and
chemicals). Nonetheless, investment coefficients in manufacturing as a whole
were, at best, slightly higher than in the pre-reform period.
—Productivity gains were more evenly spread across broad sectors,
but heterogeneity increased within sectors, for example, between commer-
cial and family agriculture. Likewise, within manufacturing, some subsectors
performed very well but others lagged behind. Despite productivity growth
in manufacturing as a whole, the productivity gap vis-à-vis the United States
did not narrow in the 1990s.
—Trade liberalization led to two different patterns of export growth in
the 1990s: integration into the North American market through manufac-
tured exports in Mexico, Central America, and the Caribbean versus a strong
concentration in natural resource–based commodities in South America.
The difference was due to trade arrangements such as the North American
Free Trade Agreement (NAFTA) and the Caribbean Basin Initiative. To a
lesser extent, subregional trade agreements in South America have also been
instrumental in fostering manufactured exports. Strong local supplier link-
ages have not accompanied export growth in either of the two patterns: the
maquila plants use few domestic inputs, and modernization of commodity
production led to higher imports of capital goods.
—Privatization was instrumental to investment recovery and to mod-
ernization when other necessary conditions were also present. It fostered
investment in certain tradables (for example, mining and natural gas), al-
though linkages with the rest of the economy continued to be weak. In
nontradables, the biggest increases in investment were in telecommunica-
tions; results were mixed in electricity. Privatization alone did not guaran-
tee efficient performance. Strengthening property rights proved to be an

208
P O L I C Y A G E N D A F O R T H E N E X T D E C A D E
important factor for attracting foreign investment in mining, while in-
creasing competitive pressures were necessary to ensure efficient market
outcomes in the services sectors, like telecommunications.
—When the concentration of growth in capital-intensive activities cre-
ated few jobs, services became the residual source of employment. Services
had a heterogeneous performance: high-quality jobs were created in tele-
communications, banking, and finance, but the bulk was in low-skill ser-
vices. Overall, employment generation was jointly determined by secular
trends and the impact of the reforms. Agriculture continued its long-term
decline in total employment, and manufacturing generally lost share, ex-
cept for the maquila.
The old-style “triple alliance” among transnational corporations (TNCs),
large domestic firms, and the state has broken down.
1
The state privatized
most of its firms, and local capital lost out to TNCs in the late 1990s.
TNCs are less exposed to strategic uncertainty about opening new markets
and using new technologies than are large domestic firms. They also have
access to international finance under better conditions than even the larg-
est domestic firms. The reforms that had the most important impact at the
microeconomic level were privatization and the greater welcome for for-
eign direct investment.
—Large corporations led the investment process, and TNCs gained
share in sales among the larger firms. Restructuring of corporate owner-
ship was increasingly important in the second half of the 1990s. Nonethe-
less, the large firms contributed relatively little to the generation of
employment since they tended to be highly capital-intensive.
—Despite the common perception that small and medium-size enter-
prises (SMEs) have done extremely poorly, they maintained their share in
total production and employment. The fact that they did not grow rapidly,
however, had negative implications for job creation.
—In the manufacturing sector, most new jobs were created by small
firms and microenterprises. These were the only firms that increased em-
ployment in countries like Argentina, Brazil, Chile, and Costa Rica, where
they accounted for more that 100 percent of the net job creation, because
larger firms posted a net job loss as a result of the downsizing that accom-
panied modernization. Only in Mexico were large manufacturing firms
more dynamic than smaller ones; the maquila played a very positive role in
this outcome.
1. Evans (1979).

209
P O L I C Y A G E N D A F O R T H E N E X T D E C A D E
—Although the labor productivity of larger companies is three or four
times higher than that of SMEs, the latter increased their efficiency and in
some countries even narrowed the gap. Nonetheless, the productivity gap
widened between large and medium-size firms, on the one hand, and small
firms and microenterprises, on the other. Thus a large share of job creation
took place in firms whose efficiency declined or at best stagnated.
—Wage differentials between larger firms and microenterprises in-
creased, particularly in the second half of the 1990s. This is consistent with
a widening productivity gap between the two groups of firms. All else equal,
this wage differential contributed to increased inequality.
By the end of the 1990s, regional economies had more or less recov-
ered what they had lost during the 1980s in terms of investment and pro-
ductivity levels.
2
The new investments were more efficient than the ones
they replaced, but they were highly concentrated in a few sectors, namely,
natural resources, resource-based manufactured products, automobiles, and
the maquila. Many subsectors in these industries are growing slowly in the
world market, face falling terms of trade, or are technologically mature.
Moreover, the expected rates of return on these investments are likely to be
lower than before the reforms were introduced, due to greater competition
and less state support. Labor productivity also returned to its pre-crisis
levels, but this implies that the gap in Latin America and the Caribbean
with respect to the member countries of the Organization for Economic
Cooperation and Development (OECD) and the newly industrializing
economies of East Asia increased. While a number of individual sectors did
very well, their dynamism was not transmitted to the economies as a whole.
This was partly due to weak or nonexistent supplier relations.
These weak domestic supplier networks have both advantages and dis-
advantages. Weaker links may be an advantage for exporting firms because
their competitiveness increases when they are able to select the most effi-
cient source of inputs, irrespective of domestic or foreign origin. When
imported inputs grow as fast as total exports, however, trade surpluses in
exporting activities are not sufficient to compensate for deficits in other
sectors. The opportunity for technological progress is lost since it tends to
concentrate in the user-supplier interface, and employment creation is weak-
ened because of the destruction or non-creation of domestic suppliers.
2. It is important to recall that we are using simple averages to prevent Brazil and Mexico from
overwhelming our results. Weighted averages would show that investment has yet to return to the
1980 peak.

210
P O L I C Y A G E N D A F O R T H E N E X T D E C A D E
Given this constellation of factors, a significant increase in growth rates
in the next decade cannot be taken for granted. Lacking strong growth,
unemployment rates are likely to remain high, which will exacerbate social
problems and hinder attempts to lower the very high rates of inequality
that characterize the region. External vulnerability, which has probably risen
because of increased globalization together with trade and financial liberal-
ization, makes solutions more complex. This outlook surely justifies the
consideration of policy changes to improve expected outcomes. Or, as one
ECLAC economist has put it, there is a need “to reform the reforms.”
3
Recommendations to Improve the Outlook for the Region
A first principle in establishing a policy agenda for the future—one
that was frequently violated during the first round of reforms—is to avoid
across-the-board policy recommendations. Latin American and Carib-
bean countries are currently in very diverse situations with respect to the
reforms themselves and to other structural and policy variables. What
will work for one is not necessarily appropriate for another. Nonetheless,
the experiences of the nine project countries provide both positive and
negative lessons. A good source of lessons for the future is what has and
has not worked in the past.
Another principle—also frequently violated in the first round—is to
obtain the necessary information and to engage in the appropriate analysis
before making irreversible policy decisions. Many of the theoretical propo-
sitions underlying the first round of reforms were based on different types
of economies than existed in Latin America, and the necessary precondi-
tions, including those pertaining to the international economy, did not
hold. It was not surprising that many of the predictions turned out to be
erroneous, especially those for employment, but also for investment and
growth. The analysis must include the individual country, sectoral, and
microeconomic levels rather than vague generalities about the region as a
whole. One of the most important examples of the need for information
on which to base rational decisionmaking is in the area of labor reform.
Beyond general considerations about the advantages of more efficient la-
bor markets, we do not know what to expect from that reform in terms of
growth and employment.
3. Ffrench-Davis (1999).

211
P O L I C Y A G E N D A F O R T H E N E X T D E C A D E
Policymakers must be specific about what they hope to achieve from a
new round of reforms or policy changes. It is very difficult to judge the
success or failure of the reforms or other policies without a benchmark of
the results they are expected to produce. This has been a problem in writ-
ing this book, but much more important, it is also a problem for govern-
ments themselves and for the policy debate within the political system and
with civil society. Of course, we are not advocating comprehensive, de-
tailed forecasting and planning, but without identifying specific targets for
new reforms, it is very difficult to monitor their performance.
The ten to fifteen years of reforms in the region have led to significant
accomplishments, but much remains to be done and many problems still
exist. One influential set of proposals recommends further reforms; it calls
for a deepening of first generation reforms complemented by a second
generation of reforms, particularly in the field of education.
4
Our view is
that the vast majority of benefits that can be obtained from first generation
reforms have already materialized. Decreasing returns would quickly set in
from deepening those same reforms, although some individual countries,
particularly the late reformers, may indeed require more first generation
reforms. Furthermore, in the case of large, federal countries, first genera-
tion reforms may still have a role to play at the state or local levels. Finally,
some “hot issues” (for example, the possible privatization of firms like
Petrobras, Pemex, and Codelco) involve political decisions that go beyond
the scope of this book.
We agree with the growing consensus that another generation of re-
forms is needed.
5
Our agenda, however, is broader than that of most oth-
ers. Our policy discussion is organized around three central issues: the need
to engage in competitiveness policies and investment promotion to in-
crease growth, to undertake a major offensive in the social area, and to
maintain and improve macroeconomic stability. We also discuss two issues
that cross the three topic areas: the need for closer relations between the
public and private sectors and for policies to deal with external vulnerabil-
ity. We focus the recommendations at an intermediate level: more than a
list of topics, but less than detailed programmatic prescriptions.
6
4. IDB (1997).
5. See, for example, IDB (1997); Burki and Perry (1998); Birdsall, Graham, and Sabot (1998).
6. A more detailed, and much broader, set of policy recommendations, which is consistent with
those proposed here, is found in ECLAC (2000a). An earlier version of the main arguments was
presented in Ocampo (1998).

212
P O L I C Y A G E N D A F O R T H E N E X T D E C A D E
Policies to Increase Growth
The Latin American and Caribbean economies need to grow faster
and increase their competitiveness to improve their integration into the
world market through higher value added exports. The two tasks are closely
related: the core of a policy to achieve faster growth is to create better con-
ditions for increasing productivity and investment. Higher productivity
leads to cost reductions and higher profitability rates, which attracts more
investment. At the same time, increases in investment are usually accompa-
nied by the incorporation of new machinery and equipment, which em-
body technological advances and lead to higher productivity and more
competitiveness.
While most analysts agree with these objectives, they differ on the means
to achieve them. Many would say that markets can handle these issues by
themselves. In particular, they would argue that the reforms have strength-
ened competition in the countries of the region, having thus already gener-
ated the necessary incentive for higher productivity and more investment.
We disagree because we do not believe that markets operate perfectly, al-
ways producing the most efficient outcome.
More investment is needed in all countries, but this alone is insuffi-
cient; the region also needs more efficient allocation of investment. The
reforms have corrected the major distortions that led to inefficient invest-
ment, but they did not generate the incentives necessary to achieve faster
capital accumulation. Investment depends on expected rates of return, which
can be affected through prices, costs, and the management of uncertainty.
Since little can be done regarding prices, we focus on the other two ele-
ments. Progress in correcting market failures to increase competitiveness
will benefit the investment process through lower costs for technology, more
skilled human resources, better access to and lower cost of credit, and more
modern infrastructure. Further reduction of costs could be obtained through
generalized tax reductions. Such an alternative, however, would run counter
to the need for greater social spending as we will discuss in the following
section. Although it is impossible to eliminate the uncertainty inherent in
market economies, it is possible to reduce the uncertainty caused by pendular
swings in policy and unexpected policy shifts. We return to this issue when
we present our proposals regarding macroeconomic policies, which have to
be consistent with the policy package to increase growth.
Reduction of costs and uncertainty will benefit investment irrespective
of its origin, but a particular way of stimulating investment is to design

213
P O L I C Y A G E N D A F O R T H E N E X T D E C A D E
policies to attract foreign direct investment (FDI). This was a major com-
ponent of the first generation reforms, and one of the successes of those
reforms was the dramatic increase of FDI in total capital inflows in the
1990s. The majority of that investment, however, went to purchase exist-
ing assets, either through privatization of public firms or takeovers of pri-
vate corporations. What is needed in the coming years is to design policies
to attract more greenfield investment, for which several international expe-
riences (for example, Ireland, Scotland, or Singapore) provide useful les-
sons regarding both business facilitation measures and FDI targeting.
Given the increasingly important role of TNCs in the region and in
the world market, we also need to foster strategic joint ventures between
local business and leading global players. Changes in corporate gover-
nance regimes, particularly strengthening minority shareholders’ rights,
have elsewhere proved to be an efficient means to prevent TNCs from
insisting on majority or total ownership in joint ventures. This would
open space for local business in modern sectors, because foreign partners
are likely to participate as minority shareholders only if their rights are
adequately protected.
Since TNCs also play a crucial role in world exports, policies to attract
foreign direct investment would simultaneously have a positive impact on
the region’s export performance, both in volume and composition. To make
sure that domestic producers also benefit from increasing access to world
markets, it is necessary to reduce transaction costs of foreign trade opera-
tions, ensure their access to credit under competitive conditions, and re-
duce the cost of information. All of this, of course, must be done within
the framework of the new international trading system.
These suggestions for increasing investment would have a positive
impact on competitiveness, but direct measures are also needed. Correc-
tion of market failures and reduction of transaction costs are the key com-
ponents of our proposals to foster competitiveness.
Concentrated markets do not necessarily lead to inefficient outcomes,
when businesses operate under the pressure of strong rivalry among do-
mestic firms or external competition. Competition, however, cannot be
taken for granted. Even in tradables, unfair practices may arise. Competi-
tion policies should be aimed at preventing or eliminating such practices.
In sectors where competition cannot work (for example, natural monopo-
lies), regulation is the answer.
Privatization of public services (utilities) has made it imperative to
introduce or modernize regulatory regimes in the region, because com-

214
P O L I C Y A G E N D A F O R T H E N E X T D E C A D E
petition cannot always produce efficient market outcomes in this sector.
Although conditions vary across sectors and countries, the region should
work on establishing sectorwide regulatory frameworks. As is the case
with competition policy, regulation should aim at preventing unfair busi-
ness practices (for example, abuse of market power), although the only
efficient alternative in some cases may involve actions that affect the market
structure (for example, preventing or eliminating inefficient vertical
integration).
Major factor markets (namely, technology, skilled labor, and capital)
usually operate quite inefficiently. Policy proposals in these areas have long
formed part of the academic and policymaking debate in the region. A
detailed consideration of each proposal is beyond the scope of our analysis,
but we want to highlight a few issues we consider particularly important.
With respect to technology, Latin America should focus its limited resources
on diffusion and adaptation of technology rather than on innovation per
se. Stronger linkages between users and suppliers are particularly impor-
tant, since this is the area where adaptation is most central. In human re-
source development, improving the educational stock will take at least a
generation, so we need to focus simultaneously on short-term measures.
Training should receive a special emphasis; the most useful training pro-
grams are those that combine school with apprenticeship. Finally, reducing
capital market failures implies at least two different strategies according to
potential beneficiaries. For larger firms, the main element is the develop-
ment of domestic sources of long-term finance, while for smaller firms, the
most important step would be improvement of access through second-tier
development banks.
Smaller firms need special support to be able to access factor markets.
While the costs of using the market (for example, those of applying for a
loan) are relevant for all kinds of firms, they are particularly burdensome in
relative terms for the smallest companies. The reduction of costs for small
firms is most efficient when these firms are clustered in particular regions
or sectors. Interaction, either through subcontracting between large and
small firms or horizontal linkages among small firms themselves, can pro-
vide the basis not only for accessing factor markets but also for jointly
developing new activities and markets. The problems that the absorption
of these transaction costs puts on microenterprises—as opposed to small
and medium-size firms—go beyond credit market failures and are consid-
ered in the next section.

215
P O L I C Y A G E N D A F O R T H E N E X T D E C A D E
A Social Offensive
Important problems remain with respect to growth, investment, and
productivity, but progress has been made in these areas. Problems involv-
ing employment and equity, in contrast, have been exacerbated. Employ-
ment creation has been slow, and job quality has deteriorated. Inequality
has probably increased. The proposals for increasing growth are likely to
have a positive impact on employment and equity. Indeed, achieving high,
stable growth rates is a necessary prerequisite for lowering unemployment
and inequality, but growth alone is not enough. We recommend that gov-
ernments assign the highest priority to these issues.
Employment is the place to start. Even if investment grows rapidly in
the region, our research has shown that the likely investors would be large
firms. With the exception of the maquila, these are not in labor-intensive
activities. At the same time, the public sector, which has traditionally pro-
vided a large number of high quality jobs in the region, is actually reducing
its work force. We must therefore look elsewhere for job creation. At this
point in time in Latin America, most jobs in both urban and rural areas are
in small firms and especially in microenterprises, so this group of firms
merits special attention. Experiences with the maquila plants provide one
source of lessons, but this would not be enough, particularly for the South
American countries. Labor-intensive activities, such as housing and infra-
structure construction, should be encouraged by public policy.
Transaction costs are especially burdensome for small firms, as men-
tioned above. Moreover, an inefficient and costly supply of public goods
and services has a particularly negative impact on small production units.
Consideration should therefore be given to widespread deregulation for
this type of firm. Experiences in export processing zones in Latin America
and Asia suggest that the reduction of regulation and controls can lead to
rapid creation of new firms and employment opportunities, without a de-
terioration of work conditions. Indeed, since these are formal sector jobs,
workers moving from the informal sector are likely to experience an im-
provement in well-being. Policymakers should consider extending such
arrangements to the domestic economies, perhaps combined with tax in-
centives as in the enterprise zones in the major cities in the United States.
In any case, it is necessary to find ways to provide services and public
goods to small production units. Cluster solutions may reduce costs and
open alternatives for microenterprises as well as for small firms. Credit

216
P O L I C Y A G E N D A F O R T H E N E X T D E C A D E
operations are particularly costly when negotiations must be carried out
with a great many small units; various international examples show that a
collective approach to credit for microenterprises has produced very posi-
tive results (for example, the Banco del Sol in Bolivia). This approach has
also proved useful for small agricultural producers.
An alternative suggestion on how to increase job opportunities is
through flexibilization of the labor market more generally. Our view is that
labor markets are already much more flexible than usually perceived. We
are also concerned about jumping into drastic reform without adequate
information on the likely consequences, with respect to both new jobs and
the quality of existing jobs. A generic solution is particularly inappropriate
given the extreme differences among labor markets in the region.
Policymakers would be better advised to think about ways to improve
the functioning of labor markets rather than to concentrate exclusively on
flexibilization. However, if a particular government decides that it wants to
move forward on flexibilization per se, it would be essential to simultaneously
guarantee access to unemployment insurance and to make benefits portable
to smooth the transition between jobs. An additional policy that would make
labor markets function better is to increase information available to workers
and firms in order to reduce search periods and frictional unemployment.
Clearly these measures will not eliminate structural unemployment, so they
need to be combined with job creation policies as mentioned earlier.
The second main element of the social offensive has to do with greater,
more efficient social expenditure. After the contraction of social spending
during the crisis years of the 1980s, all countries in the region increased
such outlays in the 1990s and some did so dramatically. The funds for
increased social spending come from one or more of three sources: faster
GDP growth, an increase in public expenditure as a percentage of GDP,
and an increase in the share of social spending in total public expenditure.
For countries with a low share of public expenditure in GDP, it would be
desirable to raise the share to increase social services further. Others will
likely need to rely on one of the other two mechanisms. With respect to the
share of social spending in total public expenditure, however, a number of
countries are close to the maximum that is politically viable. This leaves
three alternatives: more efficient use of existing resources, an increase in
total public expenditure, which would require an increase in revenues, or
greater participation by the private sector. All three have their problems;
which alternative is more attractive would vary from country to country,
depending on local circumstances and public preferences.

217
P O L I C Y A G E N D A F O R T H E N E X T D E C A D E
Improving and expanding access to education must receive priority
among social services. Education expenditure has the double advantage of
simultaneously contributing to competitiveness and greater equality, al-
though this is a relatively long-run process. A large share of Latin America’s
distribution problems, as well as of its productivity problems, comes from
its large stock of unskilled labor, which in turn derives from many years of
inadequate education. High priority must be assigned to overcoming the
legacy of this education gap. This subject has been widely studied, but
many controversies and implementation issues remain. How to improve
quality is the main issue for primary education. At the secondary level, the
issue is expansion of coverage and access, while at the university level, ac-
cess and relevance of areas of specialization are paramount. Dramatically
increasing the share of entrants to the labor market who have secondary
education would simultaneously contribute to the solution of both eco-
nomic and social problems in the region.
Increasing and improving social expenditure will not do much good if
it is then cut when a crisis arises. This was the prevalent pattern in the
1980s, and since social expenditure is strongly procyclical, the threat of
future cuts remains. Governments should make sure that social spending is
protected when hard times come. The long-term social losses through cri-
ses are often never recovered. Children who leave school may never return;
workers who lose their jobs may lose invaluable experience if they have
trouble returning to work later; families who lose their homes may have
difficulties for many years. Those who benefit from the later economic
recovery are unlikely to be the same ones who lost as a result of the crisis.
Macroeconomic Policy
It is essential to achieve greater competitiveness and social progress
without undermining the macroeconomic stability that has been achieved
at great cost over the last decade. This is not just because macroeconomic
stability has proved valuable for other reasons; without stability it is impos-
sible to advance either in competitiveness or on social issues. Thus there
can be no trade-off between stability and the other two goals. The question
is how to finance those elements of the two agendas that depend on the
public sector. This requires a reassignment of resources in government bud-
gets if no new resources are forthcoming.
The macroeconomic agenda can be divided into traditional and new
topics. Traditional issues include fiscal, monetary, and exchange rate poli-

218
P O L I C Y A G E N D A F O R T H E N E X T D E C A D E
cies aimed primarily at stabilizing inflation. These have been remarkably
successful over the last decade, although with variations across the region.
In all nine project countries, inflation has been brought down significantly;
average inflation rates are now in the single digits. The main variation in
policies has had to do with the role assigned to the exchange rate. In several
cases it has been the main instrument for stabilization, displacing fiscal and
monetary policy.
The main trouble spot in the traditional macroeconomic area has to
do with a resurgence of fiscal deficits. To some extent, this is the result of
the cyclical downturn at the end of the decade, but the reforms themselves
also contributed. One of the inconsistency syndromes identified in chapter
3 suggested that the reforms conflicted with attempts at fiscal consolida-
tion by cutting tax rates, lowering tariffs, and earmarking revenues for states
and municipalities. Given the variations across countries in terms of the
share of GDP controlled by the state, individual governments must decide
whether deficit reduction should be accomplished by increasing revenues
or cutting expenditure.
Two new topics are also on the agenda in the macroeconomic sphere.
One has to do with growth and its finance; the other relates to the issue of
volatility. Although the public sector has generally abandoned the role of
producing goods (with the important exception of some key natural re-
source firms), it retains the function of providing an adequate context for
growth. This involves not only stabilization, but also the promotion of
savings and finance for growth. We have already discussed the need to de-
velop capital markets as an intermediary between savings and investment;
here the topic is savings.
Clearly, the government must make its own contribution to savings;
hence the emphasis on fiscal consolidation. It must also seek policies to
promote savings in the private sector. One policy that has become promi-
nent among the project countries is the introduction of private pension
schemes to complement or replace the old public social security systems.
While these policies may promote savings in the long run, experience shows
that they mainly substitute private for public savings in the short run. Thus
other savings promotion policies are required; other ECLAC publications
have suggested the usefulness of prior savings for home purchase and some
kinds of tax incentives. Nonetheless, higher growth rates themselves will
continue to be the main determinant of higher savings.
The volatility issue has several components. First, fiscal and regulatory
policies should seek to avoid boom-bust cycles. Governments have much

219
P O L I C Y A G E N D A F O R T H E N E X T D E C A D E
more policy space during booms. It is then that they must act to mitigate
downswings, since they have fewer options during a crisis. Macroeconomic
policy should be strongly counter-cyclical. Two important instruments are
stabilization funds for public sector income (that is, putting aside revenues
during boom periods to be drawn on when revenues fall) and social spend-
ing. Another innovative proposal consists of the use of counter-cyclical
financial regulation (for example, flexible capital adequacy requirements
for banks). But the increasing integration of Latin American and Carib-
bean economies into the world market makes macroeconomic policy much
more complex, since a substantial part of volatility is imported via terms-
of-trade fluctuations and especially financial flows. Additional instruments
are needed to deal with the new situation.
A particular variant concerns another of the inconsistency syndromes
identified in chapter 3. Trade liberalization combined with capital account
opening, in the presence of international liquidity, leads to capital surges
that inflate the value of the local currency. This can occur with any type of
exchange rate regime, but it is especially associated with attempts to halt
inflation via an exchange rate anchor. Overvaluation of the local currency,
in turn, leads to large trade and current account deficits, which can result
in foreign exchange and banking crises. Such crises have proved to be very
expensive (fiscal costs up to 20 percent of GDP in some of the project
countries), and they undermine progress in growth and the social area as well.
Governments must seek ways to dampen imported volatility as well as
that originating in the domestic economy. Policies that have proved helpful
in some countries could be studied for possible use elsewhere. These in-
clude commodity stabilization funds to mitigate cycles caused by terms-of-
trade fluctuations and controls on short-term capital flows to limit the
impact of swings in international finance. Adequate prudential regulation
for the banking system is a complementary requirement to avoid the trans-
mission of external volatility to the domestic financial system and thus to
the rest of the domestic economy.
Cross-Cutting Issues: Public-Private Relations and
International Economic Management
The three areas discussed above should constitute the main focus of
government policy in the coming years. Two additional topics condition
regional governments’ ability to make progress on competitiveness and
growth, the social offensive, and macroeconomic stability. These are the

220
P O L I C Y A G E N D A F O R T H E N E X T D E C A D E
need to foster cooperation between the public and private sectors and to
encourage more efficient management of international economic relations.
The new economic model in Latin America and the Caribbean fea-
tures a substantially stronger role for the private sector than was the case in
the earlier postwar period. It is therefore essential for the government and
private actors to work together more closely. The risky environment cre-
ated by globalization, combined with the opening of regional economies,
requires such collaboration to strengthen the competitive position of Latin
American countries. At the same time, the lower volume of resources at the
disposal of the public sector means that more activities must be carried out
in collaboration. What is still being worked out is the nature of the rela-
tionship. There will clearly be variation among countries, given their dif-
ferent histories and capacities, but some elements are common to all cases.
First, the new relationship does not imply the elimination of the eco-
nomic role of the state; rather the state will be smaller and more efficient
but will still play a very important role. Second, some aspects of the rela-
tionship will be conflictual insofar as the state must regulate private sector
activities when the absence of competition prevents markets from produc-
ing efficient outcomes (for example, natural monopolies) or which could
endanger the rest of the economy if not managed properly (for example,
the financial sector). Third, other activities will be shared under mutually
supportive arrangements, such as the provision of infrastructure or some
aspects of social services. New institutions that bring together the govern-
ment, entrepreneurs, and labor may be useful for implementing policy co-
operation. Fourth, the term private sector does not refer exclusively to
for-profit institutions. Nongovernmental organizations (NGOs) may also
play an important role, especially in the social sectors or in the promotion
of microenterprises. Fifth, exactly where the boundaries between public
and private sector responsibilities will be drawn will largely depend on the
willingness of each society to pay for state services. If the fiscal compromise
provides for a low resource base, fewer services can be offered. Finally, what-
ever the nature of the relationship that is ultimately chosen, it is essential
that it be transparent and open to all. This is necessary for avoiding an
increase in corruption that could destroy the legitimacy of the entire sys-
tem, as has happened in some other regions and in some instances in Latin
America itself.
The other set of issues that affects all policy areas involves the inter-
national economy into which the region is increasingly integrated. Glo-
balization provides both challenges and opportunities. While the terms

221
P O L I C Y A G E N D A F O R T H E N E X T D E C A D E
of trade continue to pose problems for Latin American economies, and
shifts in international demand can also play havoc at times, financial
flows have been the most problematic aspect of the international envi-
ronment in the last two decades. After abandoning the region during
much of the 1980s, external finance returned with a vengeance in the early
1990s, only to partially withdraw again. Short-term flows were particu-
larly volatile; they destabilized macroeconomic balances on various occa-
sions through their impact on different variables, especially the exchange
rate. This would imply lower growth rates in the future because uncer-
tainty may hamper investment.
Since Latin America is not the only region where such volatility has
caused problems, the topic has been put on the international agenda, but
few concrete results have emerged thus far. The so-called new financial
architecture remains to be created, and industrialized countries continue
to manage their economies in ways that serve their own interests but that
can undermine growth and cause other problems in developing countries.
An important aspect of the problem is that the developing countries have
very little voice in decisions about international economic management.
Several policy recommendations flow from this situation. First, Latin
American governments have to put policies in place that will protect them
from international volatility without returning to the closed economies of
the past. The controls on capital inflows and commodity reserve funds
mentioned above are examples of such policies. Second, the new regional
integration schemes may provide a partial buffer against international vola-
tility. As with domestic policies, the new type of regional integration (namely,
the so-called open regionalism) is concerned with retaining its links with
the rest of the world economy, rather than being an extension of closed
economies as was the case in the first round of integration in the 1960s.
Finally, Latin American countries, whether individually or as members of
subregional groupings, should seek increased negotiating power in interna-
tional decisionmaking. A combination of the three approaches is probably
necessary to facilitate the objectives—specifically, increased economic growth
with greater equity—that most governments of the region have espoused.
Concluding Comments
The agenda set out in the previous section is not a new one. On the
contrary, our aim was to combine into a coherent package a number of
policy recommendations that have been under discussion for some time

222
P O L I C Y A G E N D A F O R T H E N E X T D E C A D E
now. Many analysts who agree with the basic thrust of the reforms also
believe that markets alone cannot resolve the problems that remain, not to
mention the new ones that have emerged. While faster growth is needed,
growth alone cannot provide a better quality of life for the population of
the region. Additional measures must be taken, both to foster growth itself
and to promote employment and equity.
We realize that this policy package is expensive and that all policies
suggested probably cannot be implemented simultaneously, especially given
the priority that governments today assign to macroeconomic stability. The
relative weight each government gives to individual measures will depend
on individual country conditions, which differ considerably. Countries with
acute social problems would probably pay special attention to proposals in
that area, while others, where those problems are less severe, could assign
more resources to improve competitiveness. Although we recognize this
dilemma, it cannot be resolved at the abstract level.
A consensus is currently building around these issues in most of the
governments of the region. Implementation has thus become the new pri-
ority. Policymakers have gone through a learning process with respect to
the reforms. Implementation and monitoring have improved, and of course
they have been easier for latecomers, but implementation failures are still
widespread in all countries. With the partial exception of the macroeco-
nomic area, the institutions responsible for implementing the policies dis-
cussed above are weak with respect to both human and financial resources.
Fragmented decisionmaking compounds the difficulties.
Institution building through private-public partnerships is central to
future progress. Latin America has made headway in this field, but achiev-
ing better results requires resources and consistency. Although policy de-
sign can always be improved, we think that the marginal benefits of looking
for new policy instruments are smaller than those that can be reaped from
better implementation of certain well-known, and even well-tested, instru-
ments. Macroeconomic stabilization and the first generation of reforms
were timely and critical in the late 1980s and early 1990s; now is the time
for action on growth, competitiveness, employment, and equity. More ef-
fort is also needed in the macroeconomic area itself. Almost two decades of
reforms and macroeconomic achievements have provided important les-
sons that, if heeded, would allow Latin American and Caribbean countries
to avoid mistakes and, above all, to benefit from past experience to get
better results.

223
P O L I C Y A G E N D A F O R T H E N E X T D E C A D E
Latin America is clearly a different place than it was fifteen or twenty
years ago. One way of characterizing the change is that the region is now
an integral part of a single global economy. The reforms have been an
important element in the transformation, although far from the only one.
At the most general level, the reforms have had three results. They have
solved some longstanding problems, such as cases of excessive protec-
tionism and inefficient public utilities. They have opened up unexpected
possibilities, of which the most dramatic is perhaps the export potential
demonstrated by Mexico and some Central American and Caribbean
countries. But they have also created new problems and exacerbated cer-
tain old ones. Employment is probably the most serious, especially given
the implications for equity. The urgency of this agenda means that the
region cannot afford further delay in responding to the new challenges or
tackling the new problems.


225
R E F E R E N C E S
225
References
Aghion, Philippe and Peter Howitt. 1998. Endogenous Growth Theory. MIT Press.
Altimir, Oscar. 1996. “Economic Development and Social Equity: A Latin American Per-
spective.” Journal of Interamerican Studies and World Affairs 38(2-3): 47–73.
Altimir, Oscar and Luis Beccaria. 1999. “El mercado de trabajo bajo el nuevo régimen
económico en Argentina.” Serie Reformas Económicas 28. Santiago: ECLAC.
América Economía. 1999. Latin America’s 500 Largest Companies. (July).
Balassa, Bela and others. 1986. Toward Renewed Economic Growth in Latin America. Wash-
ington: Institute for International Economics.
Barro, Robert and Xavier Sala-i-Martin. 1995. Economic Growth. Macmillan.
Berry, Albert, ed. 1998. Poverty, Economic Reform, and Income Distribution in Latin America.
Boulder, CO: Lynne Rienner.
Bhagwati, Jagdish N. 1978. Foreign Trade Regimes and Economic Development: Anatomy and
Consequences of Exchange Control Regimes. Cambridge, MA: Ballinger.
———. 1998. “The Capital Myth.” Foreign Affairs 77(3): 7–12.
Birdsall, Nancy, Carol Graham, and Richard H. Sabot, eds. 1998. Beyond Tradeoffs: Market
Reform and Equitable Growth in Latin America. Washington: Inter-American Develop-
ment Bank and Brookings.
Birdsall, Nancy and Richard H. Sabot, eds. 1996. Opportunity Foregone: Education in Bra-
zil. Johns Hopkins University Press.
BIS (Bank for International Settlements). 1999. Annual Report, 1998–99. Basle.
Borensztein, Eduardo, José de Gregorio, and Jong-Wha Lee. 1995. “How Does Foreign
Direct Investment Affect Economic Growth?” Working Paper 5057. Cambridge, MA:
National Bureau of Economic Research.
Buitelaar, Rudolf M. and Ramón Padilla. 2000. “Maquila, Economic Reforms, and Corpo-
rate Strategy.” World Development 28(9) (forthcoming).

226
R E F E R E N C E S
Buitelaar, Rudolf M., Ramon Padilla, and Ruth Urrutia. 1999. “The In-Bond Assembly
Industry and Technical Change.” CEPAL Review 67 (April):137–56.
Bulmer-Thomas, Victor, ed. 1996. The New Economic Model in Latin America and its Im-
pact on Income Distribution and Poverty. New York: St. Martins Press.
Burki, Shahid Javed and Guillermo E. Perry. 1997. The Long March: A Reform Agenda for
Latin America and the Caribbean in the Next Decade. Washington: World Bank Latin
American and Caribbean Studies.
———. 1998. Beyond the Washington Consensus: Institutions Matter. Washington: World
Bank Latin American and Caribbean Studies.
Calvo, Guillermo. 1986. “Incredible Reforms.” University of Pennsylvania, Department of
Economics.
Cárdenas, Enrique, José Antonio Ocampo, and Rosemary Thorp, eds. Forthcoming. Indus-
trialization and the State in Latin America: The Black Legend and the Post-War Years.
Macmillan.
Corbo, Vittorio and Stanley Fischer. 1994. “Lessons from the Chilean Stabilization and
Recovery.” In The Chilean Economy: Policy Lessons and Challenges, edited by Barry P.
Bosworth, Rudiger Dornbusch, and Raúl Labán, 29–80. Brookings.
Cominetti, Rossella and Emanuela di Gropello. 1995. El gasto social en América Latina: un
examen cuantitativo y cualitativo. Cuadernos de la CEPAL 73. Santiago: ECLAC.
Cominetti, Rossella and Gonzalo Ruiz. 1998. Evolución del gasto público social en América
Latina, 1980-1995. Cuadernos de la CEPAL 80. Santiago: ECLAC.
David, Beatriz and César Morales, eds. Forthcoming. ¿Desarrollo rural en América Latina y el
Caribe: la construcción de un nuevo modelo? Santiago: ECLAC.
De Gregorio, José and Jong-Wha Lee. 1999. “Economic Growth in Latin America: Sources
and Prospects.” Paper presented at annual meeting of Latin America and Caribbean Eco-
nomics Association (LACEA), Santiago, Chile.
Di Gropello, Emanuela and Rossella Cominetti, eds. 1998. La decentralización de la educación
y la salud. Santiago: ECLAC.
Dirven, Martine. 1999. “El papel de los agentes en las políticas agrícolas: intenciones y
realidad.” Revista de la CEPAL 68 (August): 171–86.
Drazen, Allan. 1997. “Policy Signaling in the Open Economy: A Re-examination.” Work-
ing Paper 5892. Cambridge, MA: National Bureau of Economic Research.
Duryea, Suzanne and Miguel Székely. 1998. “Labor Markets in Latin America: A Supply-
Side Story.” Working Paper 374. Washington: Inter-American Development Bank, Of-
fice of the Chief Economist.
Easterly, William, Norman Loayza, and Peter Montiel. 1997. “Has Latin America’s Post-Re-
form Growth Been Disappointing?” Journal of International Economics 43(3/4): 287–311.
ECLAC (Economic Commission for Latin America and the Caribbean). 1996. Strengthen-
ing Development: The Interplay of Macro and Microeconomics. Santiago.
———. 1997. The Equity Gap: Latin America, the Caribbean, and the Social Summit. Santiago.
———. 1998a. América Latina y el Caribe: políticas para mejorar la inserción en la economía
mundial. Santiago: ECLAC/Fondo de Cultura Económica (originally published in 1995).
———. 1998b. The Fiscal Covenant: Strengths, Weaknesses, Challenges. Santiago.
———. 1998c. Foreign Direct Investment in Latin America and the Caribbean, 1998. Santiago.
———. 1999a. Economic Survey of Latin America and the Caribbean, 1998–99. Santiago.
———. 1999b. Latin America and the Caribbean in the World Economy, 1998. Santiago.

227
R E F E R E N C E S
———. 1999c. Social Panorama of Latin America, 1998. Santiago.
———. 1999d. Statistical Yearbook for Latin America and the Caribbean, 1998. Santiago.
———. 2000a. Equity, Development, and Citizenship. Santiago.
———. 2000b. Foreign Direct Investment in Latin America and the Caribbean, 2000. Santiago.
ECLAC/UNESCO. 1992. Education and Knowledge: Basic Pillars of Changing Production
Patterns with Social Equity. Santiago.
ECLAC/World Bank. 1999. TradeCAN: Database and Software for a Competitiveness Analy-
sis of Nations. User Guide, 1999 ed. Washington: World Bank.
Edwards, Sebastian. 1995. Crisis and Reform in Latin America: From Despair to Hope. Ox-
ford University Press.
Edwards, Sebastian and Nora Claudia Lustig, eds. 1997. Labor Markets in Latin America:
Combining Social Protection with Market Flexibility. Brookings.
Escaith, Hubert and Samuel Morley. Forthcoming. “The Impact of Reforms on Growth in
Latin America and the Caribbean: An Econometric Estimation.” Santiago: ECLAC.
Evans, Peters. 1979. Dependent Development: The Alliance of Multinational, State, and Local
Capital. Princeton University Press.
Fernández Arias, Eduardo and Peter Montiel. 1997. “Reform and Growth in Latin America:
All Pain, No Gain?” Working Paper 351. Washington: Inter-American Development
Bank, Office of the Chief Economist.
Ffrench-Davis, Ricardo. 1999. Reforming the Reforms in Latin America: Macroeconomics,
Trade, Finance. Macmillan.
Ffrench-Davis, Ricardo and Helmut Reisen, eds. 1998. Capital Flows and Investment Perfor-
mance: Lessons from Latin America. Paris: OECD Development Centre/ECLAC.
Ganuza, Enrique, Arturo León, and Pablo Sauma, eds. 1999. Gasto público en servicios sociales
básicos en América Latina y el Caribe. Santiago: UNDP/ECLAC/UNICEF.
García, Pablo, Patricio Meller, and Andrea Repetto. 1996. “Las exportaciones como motor
de crecimiento: la evidencia chilena.” In El modelo exportador chileno: crecimiento y equidad,
edited by Patricio Meller, 19–42. Santiago: CIEPLAN.
García-Huidobro, Guillermo. 1999. “La capacidad generadora de empleo productivo de la
economía chilena.” Serie Reformas Económicas 31. Santiago: ECLAC.
Garrido, Celso and Wilson Peres. 1998. “Big Latin American Industrial Companies and
Groups.” CEPAL Review 66 (December): 129–50.
Gibney, Frank and others. 1995. “Letters to the Editor. Asia’s Growth: Miracle or Myth?”
Foreign Affairs 72(2): 170–77.
Goldsmith, Raymond W. 1951. “A Perpetual Inventory of National Wealth.” Studies in
Income and Wealth 14: 5–61.
Gómez, Sergio and Sergio Echeñique. 1998. La agricultura chilena: las dos caras de la
modernización. Santiago: Latin American Faculty of Social Sciences (FLACSO) and Agraria.
Government of Argentina. 1999. El impacto redistributivo del gasto público en los sectores
sociales. Documento de Trabajo GP/08. Buenos Aires: Dirección Nacional de Programación
del Gasto Social, Ministerio de Economía y Obras y Servicios Públicos.
Government of Chile. 1996. Balance de 6 años de las políticas sociales 1990–96. Santiago:
Ministerio de Planificación y Coordinación.
Government of Chile. 1998. Distribución e impacto distributivo del gasto social en los hogares
1996. Santiago: Ministerio de Planificación y Coordinación.
Griffith-Jones, Stephany. 1998. Global Capital Flows. Macmillan.

228
R E F E R E N C E S
———. 2000. “International Capital Flows to Latin America.” Serie Reformas Económicas
55. Santiago: ECLAC.
Griliches, Zvi. 1998. “Productivity: Measurement Problems.” In The New Palgrave: A Dic-
tionary of Economics, 4 vols., edited by John Eatwell, Murray Milgate, and Peter Newman,
1010–13. Macmillan.
Hofman, André. 2000. “Economic Growth and Performance in Latin America.” Serie
Reformas Económicas 53. Santiago: ECLAC.
IDB (Inter-American Development Bank). 1993. Economic and Social Progress in Latin
America, 1993 Report. Johns Hopkins University Press.
———. 1996. Economic and Social Progress in Latin America, 1996 Report. Johns Hopkins
University Press.
———. 1997. Economic and Social Progress in Latin America, 1997 Report: Latin America
after a Decade of Reforms. Johns Hopkins University Press.
———. 1998a. Economic and Social Progress in Latin America, 1998–1999 Report: Facing
Up to Inequality in Latin America. Johns Hopkins University Press.
———. 1998b. “Employment in Latin America: What Is the Problem and How to Address
It?” Document prepared for IDB meeting in Cartagena de las Indias.
ILO (International Labour Organization). 1999. Panorama Laboral de América Latina y el
Caribe, 1999. Lima: ILO Regional Office.
IMF (International Monetary Fund). 2000. International Financial Statistics Yearbook, 2000.
Washington.
IPEA. 1999. “A mensuração do impacto redistributivo do gasto social: un estudo para região
metropolitana de São Paulo.” Gasto Social. IPEA debate 1(1). Brasilia.
Katz, Jorge. 2000. Reformas estructurales, productividad y conducta tecnológica en América
Latina. Santiago: ECLAC/Fondo de Cultura Económica (forthcoming).
King, Damien. 2000. “The Evolution of Structural Adjustment and Stabilization in Ja-
maica.” Serie Reformas Económicas 65. Santiago: ECLAC (forthcoming).
King, Damien and Sudhanshu Handa. 2000. “Changes in the Distribution of Income and
the New Economic Model in Jamaica.” Serie Reformas Económicas 57. Santiago: ECLAC.
Krueger, Anne O. 1978. Foreign Trade Regimes and Economic Development: Liberalization
Attempts and Consequences. Cambridge, MA: Ballinger.
———. 1981–83. Trade and Employment in Developing Countries. 3 vols. University of
Chicago Press.
Krugman, Paul. 1994. “The Myth of Asia’s Miracle.” Foreign Affairs 73(6): 62–78.
Kuwayama, Mikio, ed. 1999. Nuevas políticas comerciales en América Latina y Asia: algunos
casos nacionales. Santiago: ECLAC.
Kuznets, Simon. 1955. “Economic Growth and Income Inequality.” American Economic
Review 45(1): 1–28.
Larrañaga, Osvaldo. 1999. “Distribución de ingresos y crecimiento económico en Chile.”
Serie Reformas Económicas 35. Santiago: ECLAC.
Londoño, Juan Luis and Miguel Székely. 1997. “Persistent Poverty and Excess Inequality:
Latin America, 1970–1995.” Working Paper 357. Washington: Inter-American Devel-
opment Bank, Office of the Chief Economist.
López, Julio. 1999. “Evolución reciente del empleo en México.” Serie Reformas Económicas
29. Santiago: ECLAC.

229
R E F E R E N C E S
Lora, Eduardo. 1997. “A Decade of Structural Reforms in Latin America: What Has Been
Reformed and How to Measure It.” Document presented to the Annual Meeting of the
Board of Governors of the Inter-American Development Bank, Barcelona, Spain.
Lora, Eduardo and Felipe Barrera. 1997. “A Decade of Structural Reform in Latin America:
Growth, Productivity and Investment Are Not What They Used to Be.” Working Paper
350. Washington: Inter-American Development Bank, Office of the Chief Economist.
Lora, Eduardo and Mauricio Olivera. 1998. “Macro Policy and Employment Problems in
Latin America.” Working Paper 372. Washington: Inter-American Development Bank,
Office of the Chief Economist.
Márquez, Gustavo and Carmen Pagés. 1998. “Trade and Employment Evidence from Latin
America and the Caribbean.” Working Paper 366. Washington: Inter-American Devel-
opment Bank, Office of the Chief Economist.
Moguillansky, Graciela. 1999. La inversión en Chile: ¿el fin de un ciclo en expansión? Santiago:
ECLAC/Fondo de Cultura Económica.
Moguillansky, Graciela and Ricardo Bielschowsky. 2000. La inversión en un proceso de cambio
estructural: América Latina en los noventa. Santiago: ECLAC/Fondo de Cultura Económica
(forthcoming).
Montiel, Nancy. 1999. “Costa Rica: Reformas económicas, sectores dinámicos y calidad de
los empleos.” Serie Reformas Económicas 26. Santiago: ECLAC.
Morley, Samuel. 1995. Poverty and Inequality in Latin America: The Impact of Adjustment
and Recovery in the 1980s. Johns Hopkins University Press.
———. 2000. El problema de la distribución del ingreso en América Latina. Santiago: ECLAC/
Fondo de Cultura Económica (forthcoming).
Morley, Samuel A., Roberto Machado, and Stefano Pettinato. 1999. “Indexes of Structural
Reform in Latin America.” Serie Reformas Económicas 12. Santiago: ECLAC.
Mostajo, Rossana. 2000. “Gasto social y distribución del ingreso: caracterización e impacto
redistributivo en países seleccionados de América Latina y el Caribe.” Serie Reformas
Económicas 69. Santiago: ECLAC (forthcoming).
Ocampo, José Antonio. 1998. “Beyond the Washington Consensus: An ECLAC Perspec-
tive.” CEPAL Review 66 (December): 7–28.
Oman, Charles. 1994. Globalisation and Regionalisation: The Challenge for Developing Coun-
tries. Paris: OECD, Development Centre.
Paunovic, Igor. 2000. “Growth and Reforms in Latin America and the Caribbean in the
1990s.” Serie Reformas Económicas 70. Santiago: ECLAC (forthcoming).
Peres, Wilson, ed. 1998. Grandes empresas y grupos industriales latinoamericanos. Expansión y
desafíos en la era de la apertura y la globalización. Mexico: Siglo XXI.
Peres, Wilson and Giovanni Stumpo. 2000. “Small and Medium-sized Manufacturing En-
terprises in Latin America and the Caribbean under the New Economic Model.” World
Development 28(9) (forthcoming).
Persson, Torsten. 1988. “Credibility of Macroeconomic Policy: An Introduction and Broad
Survey.” European Economic Review 32: 519–32.
Persson, Torsten and Guido Tabellini. 1989. Macroeconomic Policy, Credibility and Politics.
London: Harwood.
Radelet, Steven and Jeffrey Sachs. 1998. “The Onset of the East Asian Crisis.” Working
Paper 6680. Cambridge, MA: National Bureau of Economic Research.

230
R E F E R E N C E S
Ramírez, Juan Mauricio and Liliana Núñez. 1999. “Reformas estructurales, inversión y
crecimiento: Colombia durante los años noventa.” Serie Reformas Económicas 45.
Santiago: ECLAC.
Reinhardt, Nola and Wilson Peres. 2000. “Latin America’s New Economic Model: Micro
Responses and Economic Restructuring.” World Development 28(9) (forthcoming).
Robbins, Donald. 1996. “HOS Hits Facts: Facts Win: Evidence on Trade and Wages in the
Developing World.” Harvard Institute for International Development.
Rodrik, Dani. 1989. “Promises, Promises: Credible Policy Reform via Signaling.” The Eco-
nomic Journal 99: 756–72.
———. 1996. “Understanding Economic Policy Reform.” Journal of Economic Literature
34 (March): 9–41.
———. 1998. “Who Needs Capital Account Convertibility?” In Should the IMF Pursue
Capital-Account Convertibility?, Stanley Fischer and others, 55–65. Essays in Interna-
tional Finance 207. Princeton University.
———. 1999. The New Global Economy and Developing Countries: Making Openness Work.
Policy Essay 24. Washington: Overseas Development Council.
Rogoff, Kenneth. 1987. “Reputational Constraints on Monetary Policy.” Carnegie-Roches-
ter Conference Series on Public Policy 26: 141–81.
Rostow, Walt W. 1995. “Letters to the Editor.” Foreign Affairs 74(1): 183–84.
Saavedra Chanduví, Jaime and Juan José Díaz. 1999. “Desigualdad del ingreso y del gasto
en el Perú antes y después de las reformas estructurales.” Serie Reformas Económicas 34.
Santiago: ECLAC.
Servén, Luis and Andrés Solimano. 1993. “ Economic Adjustment and Investment Perfor-
mance in Developing Countries: The Experience of the 1980s.” In Striving for Growth
after Adjustment. The Role of Capital Formation, edited by Luis Servén and Andrés Solimano,
149–79. Washington: World Bank.
Spilimbergo, Antonio, Juan Luis Londoño, and Miguel Székely. 1997. “Income Distribu-
tion, Factor Endowments, and Trade Openness.” Working Paper 356. Washington: In-
ter-American Development Bank, Office of the Chief Economist.
Stallings, Barbara. 1992. “International Influence on Economic Policy: Debt, Stabilization,
and Structural Reform.” In The Politics of Economic Adjustment, edited by Stephan Hag-
gard and Robert R. Kaufman, 41–88. Princeton University Press.
———, ed. 1995. Global Change, Regional Response: The New International Context of De-
velopment. Cambridge University Press.
Stallings, Barbara, Nancy Birdsall, and Julie Clugage. 2000. “Growth and Inequality: Do
Regional Patterns Redeem Kuznets?” In Distributive Justice and Economic Development:
The Experience of Chile and Developing Countries, edited by Andrés Solimano, Eduardo
Aninat, and Nancy Birdsall, 48–111. University of Michigan Press.
Tejo, Pedro. 1999. El modelo agrícola de América Latina en las últimas décadas: una síntesis.
Santiago: ECLAC, Agricultural Development Unit.
Tokman, Victor E. 1994. Generación de empleo en un nuevo contexto estructural. Lima: ILO
Regional Office.
Turner, Louis and Michael Hodges. 1992. Global Shakeout: World Market Competition—the
Challenge for Business and Government. London: Century Business.
Tussie, Diana. 1997. “Trade Policy within the Context of the World Trade Organization.”
CEPAL Review 62 (August): 121–37.

231
R E F E R E N C E S
United Nations. 1999. World Economic and Social Survey, 1999. New York: Department of
Economic and Social Affairs.
Vélez, Carlos E. 1996. Gasto social y desigualdad: logros y extravíos. Estudio de la incidencia del
gasto público social en Colombia. Santafé de Bogotá: Departamento Nacional de Planeación.
Villasuso, Juan Manuel. 2000. “Reformas estructurales y política económica en Costa Rica.”
Serie Reformas Económicas 64. Santiago: ECLAC (forthcoming).
Vos, Rob and others, eds. Forthcoming. Balance of Payments Liberalization in Latin America
and the Caribbean: Effects on Employment, Inequality, and Poverty.
Walter, Jorge and Cecilia Senén G. 1998. “La privatización de las telecomunicaciones en
latinoamérica y el caso argentino: balance de un período de transición.” Santiago: ECLAC.
Weller, Jürgen. 1996. “Efectos del ajuste estructural en el empleo y los ingresos agropecuarios,
con énfasis en las exportaciones no tradicionales: los casos de Costa Rica y Honduras.” In
Apertura comercial en Centroamérica: nuevos retos para la agricultura, edited by Helmut
Nuhn and Andreas Stamm, 195–224. San José, Costa Rica: Departamento Ecuménico
de Investigaciones.
———. 2000. Reformas económicas, crecimiento y empleo: los mercados de trabajo en América
Latina durante los años noventa. Santiago: ECLAC/Fondo de Cultura Económica (forth-
coming).
Williamson, John, ed. 1990. Latin American Adjustment: How Much Has Happened? Wash-
ington: Institute for International Economics.
———. 1993. “Democracy and the Washington Consensus.” World Development 21(8):
1329–36.
World Bank. 1991. World Development Report, 1991. Oxford University Press.
———. 1993. The East Asian Miracle: Economic Growth and Public Policy. Oxford Univer-
sity Press.
———. 1995a. Bureaucrats in Business. Oxford University Press.
———. 1995b. Labor and Economic Reforms in Latin America and the Caribbean: Regional
Perspectives on World Development Report 1995. Washington: World Bank.
———. 1995c. World Development Report, 1995. Oxford University Press.
———. 2000. World Development Report, 2000. Oxford University Press.
WTO (World Trade Organization). 1998. Annual Report, 1998. 2 vols. Geneva.


233
A D D I T I O N A L P U B L I C AT I O N S
233
Additional Project
Publications
T
his book synthesizes the main results of the project,
“Growth, Employment, and Equity,” which was
conducted by the Economic Commission for Latin America and the Car-
ibbean (ECLAC). The project also produced a large number of more spe-
cific studies listed below.
The first five titles analyze the impact of the reforms with respect to
the topics of investment, technical change, employment, equity, and the
agricultural sector, drawing on material from some or all of the nine project
countries. Nine edited volumes present papers on various topics related to
the reforms and their impact in the individual project countries. And last,
there are two series of working papers, both of which can be found on the
ECLAC website (www.eclac.cl): the ECLAC Working Paper Series on Eco-
nomic Reforms, which examines the major components of the reforms in
each individual country, and the ECLAC Working Paper Series on Envi-
ronment and Development, a special set of studies on the relation between
the reforms and the environment.
Comparative Topic Volumes
Beatriz David and César Morales, eds. Forthcoming. Desarrollo rural en América Latina y el
Caribe. ¿La construcción de un nuevo modelo? Santiago: ECLAC.

234
A D D I T I O N A L P U B L I C AT I O N S
Jorge Katz. 2000. Reformas estructurales, productividad y conducta tecnológica en América
Latina. Santiago: ECLAC/Fondo de Cultura Económica. An English version will be pub-
lished by ECLAC.
Graciela Moguillansky and Ricardo Bielschowsky. 2000. La inversión en un proceso de cambio
estructural: América Latina en los noventa. Santiago: ECLAC/Fondo de Cultura Económica.
An English version will be published by ECLAC.
Samuel Morley. 2000. El problema de la distribución del ingreso en América Latina. Santiago:
ECLAC/Fondo de Cultura Económica. An English version will be published by ECLAC.
Jürgen Weller. 2000. Reformas económicas, crecimiento y empleo: los mercados de trabajo en
América Latina durante los años noventa. Santiago: ECLAC/Fondo de Cultura Económica.
An English version will be published by ECLAC.
Country Volumes
Eduardo Antelo and Luis Carlos Jemio, eds. 2000. Quince años de reformas estructurales en
Bolivia: sus impactos sobre inversión, crecimiento, empleo y equidad. La Paz: CEPAL/
Universidad Católica Boliviana.
Renato Baumann, ed. 1999. Brasil: uma década em transição. Rio de Janeiro: CEPAL/
Editora Campus.
Fernando Clavijo, ed. 2000. Las reformas económicas en México en los últimos veinte años.
México: CEPAL/Fondo de Cultura Económica.
Juan José Echavarría, ed. 2000. La crisis y la industrialización. Santafé de Bogotá: CEPAL/
Ediciones Tercer Mundo.
Ricardo Ffrench-Davis and Osvaldo Rosales, eds. 2000. Reformas, crecimiento y equidad:
Chile desde 1973. Santiago: CEPAL.
Daniel Heymann and Bernardo Kosakoff, eds. 2000. Desempeño económico en un contexto de
reformas: la Argentina en los noventa. Buenos Aires: CEPAL/EUDEBA.
Damien King, ed. 2000. Reform and Crisis in Jamaica. Kingston: Ian Randle Publishers.
Alberto Pasco-Font and Jaime Saavedra, eds. 2000. Perú: balance de una década de reformas
estructurales. Lima: CEPAL/GRADE.
Anabelle Ulate, ed. 2000. Crecimiento, empleo y equidad: los desafíos de las reformas económicas
de finales del siglo XX en Costa Rica. San José: CEPAL/Editorial de la Universidad de
Costa Rica.
Working Papers (ECLAC, Serie Reformas Económicas)
1. Graciela Moguillansky. “La gestión privada y la inversión en el sector eléctrico chileno.”
September 1997.
2. Graciela Moguillansky. “Chile: las reformas estructurales y la inversión privada en áreas
de infraestructura.” November 1997.
3. Graciela Moguillansky. “Chile: las inversiones en el sector minero 1980-2000.” July
1998.
4. Graciela Moguillansky. “Las reformas del sector de telecomunicaciones en Chile y el
comportamiento de la inversión.” August 1998.
5. Carlos Adrián Romero. “Regulación e inversiones en el sector eléctrico argentino.”
September 1998.

235
A D D I T I O N A L P U B L I C AT I O N S
6. Ricardo Delgado. “Inversiones en infraestructura vial: la experiencia argentina.” Oc-
tober 1998.
7. Nicolás Gadano. “Determinantes de la inversión en el sector petróleo y gas de la
Argentina.” October 1998.
8. Omar Chisari y Martín Rodríguez. “Algunos determinantes de la inversión en sectores
de infraestructura en la Argentina.” November 1998.
9. Marcelo Celani. “Determinantes de la inversión en telecomunicaciones en Argen-
tina.” November 1998.
10. Jurgen Weller. “Los retos de la institucionalidad laboral en el marco de la transformación
de la modalidad de desarrollo en América Latina.” November 1998.
11. Jurgen Weller. “Los mercados laborales en América Latina: su evolución en el largo
plazo y sus tendencias recientes.” December 1998.
12. Samuel Morley, Roberto Machado, and Stefano Pettinato. “Indexes of Structural Re-
form in Latin America.” January 1999.
13. Jorge Katz. “Reformas estructurales y comportamiento tecnológico: reflexiones en
torno a las fuentes y naturaleza del cambio tecnológico en América Latina en los años noventa.”
February 1999.
14. Jorge Katz. “Cambios estructurales y evolución de la productividad laboral en la
industria latinoamericana en el período 1970–1996.” February 1999.
15. Gover Barja. “Inversión y productividad en la industria boliviana de la electricidad.”
February 1999.
16. Gover Barja. “Inversión y productividad en la industria boliviana de telecomuni-
caciones.” February 1999.
17. Rebeca Escobar de Medécigo. “El cambio estructural de las telecomunicaciones y la
inversión: el caso de México.” February 1999.
18. Víctor Rodríguez Padilla. “Impacto de la reforma económica sobre las inversiones de
la industria eléctrica en México: el regreso del capital privado como palanca de desarrollo.”
February 1999.
19. Ramón Carlos Torres Flores. “México: Impacto de las reformas estructurales en la
formación de capital del sector petrolero.” April 1999.
20. Isaac Scheinvar. “Las carreteras y el sistema portuario frente a las reformas económicas
en México.” April 1999.
21. Daniel Bitrán B. “México: Inversiones en el sector agua, alcantarillado y saneamiento.”
April 1999.
22. Humberto Campodónico. “La inversión en el sector telecomunicaciones del Perú en
el período 1994–2000.” May 1999.
23. Humberto Campodónico. “La inversión en el sector petrolero peruano en el período
1993–2000.” May 1999.
24. Humberto Campodónico. “Las reformas estructurales en el sector minero peruano y
las características de la inversión 1992–2008.” May 1999.
25. Humberto Campodónico. “Las reformas estructurales del sector eléctrico peruano y
las características de la inversión 1992–2000.” May 1999.
26. Nancy Montiel. “Costa Rica: Reformas económicas, sectores dinámicos y calidad de
los empleos.” May 1999.
27. Jaime Saavedra. “La dinámica del mercado de trabajo en el Perú antes y después de las
reformas estructurales.” May 1999.

236
A D D I T I O N A L P U B L I C AT I O N S
28. Oscar Altimir y Luis Beccaria. “El mercado de trabajo bajo el nuevo régimen económico
en Argentina.” July 1999.
29. Julio López. “Evolución reciente del empleo en México.” July 1999.
30. José Marcio Camargo y Marcelo Neri. “Emprego e productividade no Brasil na década
de noventa.” July 1999.
31. Guillermo García-Huidobro. “La capacidad generadora de empleo productivo de la
economía chilena.” July 1999.
32. Emilio Morgado. “Las reformas laborales y su impacto en el funcionamiento del
mercado de trabajo en Chile.” July 1999.
33. Luis Carlos Jemio. “Reformas, crecimiento, progreso técnico y empleo en Bolivia.”
July 1999.
34. Jaime Saavedra y Juan José Díaz. “Desigualdad del ingreso y del gasto en el Perú antes
y después de las reformas estructurales.” July 1999.
35. Osvaldo Larrañaga. “Distribución de ingresos y crecimiento económico en Chile.”
July 1999.
36. Mauricio Cárdenas and Raquel Bernal. “Changes in the Distribution of Income and
the New Economic Model in Colombia.” November 1999.
37. Juan Diego Trejos. “Reformas económicas y distribución del ingreso en Costa Rica.”
November 1999.
38. Luis Carlos Jemio. “Reformas, políticas sociales y equidad en Bolivia.” November
1999.
39. Marcelo Neri and José Marcio Camargo. “Structural reforms, macroeconomic fluc-
tuations and income distribution in Brazil.” November 1999.
40. Oscar Altimir and Luis Beccaria. “Distribución del ingreso en la Argentina.” Novem-
ber 1999.
41. Roberto Bisang and Georgina Gómez. “Las inversiones en la industria argentina en la
década de los noventa.” November 1999.
42. Gover Barja Daza. “Las reformas estructurales bolivianas y su impacto sobre
inversiones.” November 1999.
43. Diego Montenegro Ernst and Alvaro Guzmán Bowles. “Inversión y productividad en
el sector agrícola-agroindustrial boliviano: caso de la agricultura comercial período 1985–
1998.” November 1999.
44. Ricardo Bielschowsky. “Investimentos na indústria brasileira depois da abertura e do
real: o mini-ciclo de modernizações, 1995–1997.” November 1999.
45. Juan Mauricio Ramírez and Liliana Núñez. “Reformas estructurales, inversión y
crecimiento: Colombia durante los años noventa.” November 1999.
46. Francisco Silva Torrealba. “La inversión en el sector agroindustrial chileno.” Novem-
ber 1999.
47. Juan Carlos Moreno-Brid. “Reformas macroeconómicas e inversión manufacturera
en México.” December 1999.
48. Luis Abugattás. “Estabilización macroeconómica, reforma estructural y
comportamiento industrial: la experiencia peruana.” December 1999.
49. Gerardo Mendiola. “México: Empresas maquiladoras de exportación en los noventa.”
December 1999.
50. Virginia Moori-Koening. “Reformas económicas y la inversión en el sector minero
argentino.” December 1999.

237
A D D I T I O N A L P U B L I C AT I O N S
51. Israel Fainboim and Carlos Jorge Rodríguez. “El desarrollo de la infraestructura en
Colombia en la década de los noventa.” March 2000.
52. José Antonio Cordero P. “El crecimiento económico y la inversión: el caso de Costa
Rica.” March 2000.
53. Jorge Katz, Jaime Cáceres and Kattia Cárdenas. “Instituciones y tecnología en el
desarrollo evolutivo de la industria minera chilena.” March 2000.
54. André Hofman. “Economic Growth and Performance in Latin America.” March 2000.
55. Stephany Griffith-Jones. “International Capital Flows to Latin America.” March 2000.
56. Max Spoor. “Two Decades of Adjustment and Agricultural Development in Latin
America and the Caribbean.” March 2000.
57. Damien King and Sudhanshu Handa. “Changes in the Distribution of Income and
the New Economic Model in Jamaica.” March 2000.
58. Rodolfo de la Torre. “La distribución factorial del ingreso en el nuevo modelo económico
en México.” March 2000.
59. Juan Mauricio Ramírez and Liliana Núñez. “Reformas, crecimiento, progreso técnico
y empleo en Colombia.” March 2000.
60. Dillon Alleyne. “Employment, Growth, and Reforms in Jamaica.” 2000.
61. Daniel Heymann. “Políticas de reforma y comportamiento macroeconómico: la Ar-
gentina en los noventa.” 2000.
62. Eduardo Antelo. “Políticas de estabilización y de reformas estructurales en Bolivia a
partir de 1985.” 2000.
63. Rubens Penha Cysne. “Aspectos macro e microeconômico das reformas brasileiras.”
2000.
64. Juan Manuel Villasuso. “Reformas estructurales y política económica en Costa Rica.”
2000.
65. Damien King. “The Evolution of Structural Adjustment and Stabilization Policy in
Jamaica.” 2000.
66. Alberto Pasco-Font. “Políticas de estabilización y reformas estructurales: Perú.” 2000.
67. Fernando Clavijo. “Reformas estructurales y política macroeconómica: el caso de
México 1982–1998.” 2000.
68. Juan José Echavarría. “Reformas estructurales y política económica: Colombia du-
rante los años noventa.” 2000.
69. Rossana Mostajo. “Gasto social y distribución del ingreso: caracterización e impacto
redistributivo en países seleccionados de América Latina y el Caribe.” 2000.
70. Igor Paunovic. “Growth and Reforms in Latin America and the Caribbean in the
1990s.” 2000.
Working Papers (ECLAC, Serie Medio Ambiente y
Desarrollo)
19. Marianne Schaper. “Impactos ambientales de los cambios en la estructura exportadora
de los países de América Latina y el Caribe: 1980-1995.” December 1999.
20. Guillermo Acuña. “Reformas macroeconómicas en América Latina y el Caribe: Su
impacto en los marcos regulatorios e institucionales ambientales de nueve estudios de caso.”
2000.

238
A D D I T I O N A L P U B L I C AT I O N S
21. Claudia Schatán. “Contaminación industrial en los países latinoamericanos pre y post
reforma económica.” 2000.
22. Claudio Ferraz and Carlos E.F. Young. “Trade Liberalization and Industrial Pollution
in Brazil.” 2000.
23. Fidel Aroche Reyes. “Reformas estructurales y composición de las emisiones
contaminantes industriales. Resultados para México.” 2000.
24. Alberto Pasco-Font. “El impacto del Programa de Estabilización y las reformas
estructurales sobre el desempeño ambiental de la minería de cobre en el Perú: 1990–1997.”
2000.
25. Hernán Durán. “El impacto de las reformas económicas y ambientales sobre el
desempeño de la minería del cobre en Chile: 1970–1998.” 2000.

239
I N D E X
239
Index
Aggressive reformers, 36, 47–49;
employment rates, 126; growth rates,
99; initial conditions, 47–48, 99, 203;
macroeconomic policies, 61, 99; results
of reforms, 204–06
Agriculture, 178–82; effects of trade
liberalization, 142, 178–79, 181–82;
employment, 191, 193–95; exports,
179, 181–82; impact of reforms, 178–
79, 181–82, 194; imports, 181, 182;
productivity, 165, 181; wages, 195
Andean Community, 22, 172
Argentina: as aggressive reformer, 47–48,
49, 203; agriculture, 179, 180, 181,
182; bank lending, 37; capital controls,
45–46; capital-labor ratios, 128;
current account deficits, 55; electrical
sector, 188, 189–90; employment,
119, 120, 123, 126, 150; employment
elasticities, 117; exchange rates, 61, 86;
exports, 37, 103; financial liberaliza-
tion, 45; fiscal deficits, 55; foreign
direct investment, 173, 186; growth
rates, 90–91, 108, 205–06; imports,
182; income distribution changes,
131–32, 136; inflation, 38, 47, 53;
interest rates, 58; investment coeffi-
cients, 75, 108; labor input growth,
92; labor supply, 113; macroeconomic
policies, 53, 55, 58, 61; manufacturing
sector, 166, 195, 196; mining, 184,
186; natural resources, 172; productiv-
ity levels, 78, 97, 108, 176, 177, 178;
reform results, 150, 205–06; regional
trade groups, 22; services sector, 156;
social expenditure, 67, 144; tax reform,
45; timing of reforms, 14, 45, 48, 83,
85; trade liberalization, 45; trade
restrictions, 46; transition period of
reforms, 85, 86; transnational
corporations in, 172; wages, 120,
121, 127
Asia: exporters, 23–25, 37; growth, 38;
trade with Latin America, 23

240
I N D E X
Asset distribution, 139–40, 180–81
Automobile industry, 166, 172, 173, 197
Bank for International Settlements (BIS),
32
Bank lending, 29–30, 32, 37, 213
Banks: central, 41, 53; credit for
microenterprises, 215–16; crises, 64;
development, 214; effects of reforms,
64; foreign currency debts, 64; foreign
investment in, 172; government-
owned, 40, 41; regulation, 13, 219. See
also Financial services
Barrera, Felipe, 74
Barro, Robert, 5
Berry, Albert, 3, 112, 140
Bielschowsky, Ricardo, 176
BIS. See Bank for International Settlements
Bolivia: as aggressive reformer, 47–48, 49,
99, 203; agriculture, 179, 182; capital
controls, 46; capital-labor ratios, 128;
electrical sector, 188, 189; employ-
ment, 119, 123, 126, 151; employ-
ment elasticities, 117; exchange rates,
61; fiscal deficits, 55; foreign direct
investment, 85; growth rates, 90–91,
92, 108, 205–06; income distribution
changes, 131–32; inflation, 47, 53;
interest rates, 58; investment coeffi-
cients, 75, 83, 85, 108, 160, 161;
labor supply, 113; macroeconomic
policies, 53, 58, 61; manufacturing
employment, 195, 196; privatization,
42, 82, 85, 187–88; productivity
levels, 78, 96, 108; reform results, 151,
205–06; regional trade groups, 22;
services sector, 156; social expenditure,
68, 144, 148; timing of reforms, 14–
15, 83; wages, 121, 197
Bonds, 29–30, 31
Brazil: agriculture, 179, 180, 181, 182,
193; capital controls, 41; capital-labor
ratios, 128; as cautious reformer, 49–
50, 203; currency crisis, 27; current
account deficits, 55, 58; education
levels, 115; employment, 119, 120,
123, 150; employment elasticities,
117; exchange rates, 61, 62, 86, 99,
108; exports, 103; fiscal deficits, 55,
58; foreign direct investment, 30, 173;
growth rates, 37, 54, 91, 107, 108,
206; income distribution changes, 131;
industrialization, 37; inflation, 38, 50,
53, 99, 108; interest rates, 58, 61;
investment coefficients, 75, 80, 107,
108, 160, 161; investment in
manufacturing, 170; labor input
growth, 92; labor supply, 113;
macroeconomic policies, 51, 53, 54,
55, 58, 61, 62, 99; manufactured
exports, 37; manufacturing sector, 156,
161, 166, 195, 196; mining, 183, 184,
185; privatization, 185; productivity
levels, 80, 107, 108, 176, 177, 178;
reform results, 150, 206; regional trade
groups, 22; social expenditure, 67, 144;
timing of reforms, 14, 83, 85–86; trade
restrictions, 46; transition period of
reforms, 85–86; wages, 121, 127, 197
Buenos Aires, 136
Bulmer-Thomas, Victor, 3, 112, 140
Burki, Shahid Javed, 4
Capital account opening, 41; impact on
capital flows, 18; impact on equity,
140–41, 142; impact on exchange
rates, 63; impact on growth, 102;
impact on trade deficits, 105; index,
44, 45–46; objectives, 154; reimposi-
tion of capital controls, 41, 45–46
Capital flows: controls on, 41, 45–46,
219, 221; declines and reversals, 18,
29; external factors, 26, 31; impact on
imports, 28–29; increases due to
reforms, 18, 25–26, 63, 219; influence
of macroeconomic policies, 26;

241
I N D E X
influence on reform results, 12–13; in
1980s, 29; in 1990s, 25–27, 33–34;
relationship to growth, 9, 18, 27–29,
33–34; relationship to investment, 28;
relationship to trade, 33; term
structure, 29–32, 106; volatility, 13,
25, 26–27, 29, 33–34, 221. See also
Foreign direct investment
Capitalization, 42, 187–88
Capital-labor ratios, 128
Capital markets: improving operation of,
213; international bond issues, 29–30,
31; international stock issues, 29–30,
32; weaknesses, 13
Capital stock, 95; accumulation, 92–93,
94–95, 97; perpetual inventory model,
94
Caribbean Basin Initiative, 207
Caribbean Community (Caricom), 23
Caribbean countries: regional trade groups,
22–23. See also Jamaica
Cautious reformers, 36, 47, 49–50;
growth rates, 99; initial conditions, 49,
99, 203; macroeconomic policies, 61–
62; results of reforms, 206; with stable
macroeconomic conditions, 50, 62,
99–100; with unstable macroeconomic
conditions, 50, 61–62
Central America: regional trade groups,
22–23
Central American Common Market, 23
Central banks, 41, 53
Chile: as aggressive reformer, 47–49, 99,
203; agriculture, 179, 180, 181, 182,
193, 195; bank lending, 37; capital
controls, 41, 46; capital-labor ratios,
128; consolidation of reforms, 84–85;
current account deficits, 55; demo-
cratic government, 84; electrical sector,
189, 190; employment, 119, 122–23,
150–51; employment elasticities, 117;
exchange rates, 61; exports, 23, 37,
103–05, 159, 175; financial liberaliza-
tion, 45; fiscal surplus, 55; foreign
direct investment, 88, 173, 184–85,
186; growth rates, 88, 90–91, 107,
204–05; imports, 182; income
distribution changes, 130–31;
inflation, 47, 48–49, 53; interest rates,
58; investment coefficients, 75, 80, 84,
107–08, 160, 161; investment in
manufacturing, 167, 170; labor supply,
113; macroeconomic policies, 53, 55,
58, 61, 84, 107–08; manufacturing
sector, 156, 160, 166, 167, 175;
mining, 161, 183, 184–85, 186;
natural resources, 172; private pension
funds, 69; privatization, 46, 187, 189;
productivity levels, 78, 80, 97, 107,
176, 178; recession, 88; reform results,
150–51, 204–05; regional trade
groups, 22; services sector, 156; social
expenditure, 67, 144, 145, 148; tax
reform, 45; telecommunications, 188;
timing of reforms, 14–15, 38, 45, 47,
83; trade liberalization, 45; trade
restrictions, 46; transnational corpora-
tions in, 172; wages, 121, 127–28, 197
Codelco (Corporación Nacional del
Cobre), 185
Colombia: agriculture, 179; bank lending,
37; capital controls, 41; capital-labor
ratios, 128; as cautious reformer, 49–
50, 203; current account deficit, 62;
electrical sector, 189, 190; employ-
ment, 119, 120, 123, 150; employ-
ment elasticities, 117; exchange rates,
61, 62, 100; exports, 37; financial
liberalization, 45; fiscal deficits, 55, 62;
growth rates, 37, 91, 92, 108, 206;
income distribution changes, 131;
inflation, 50, 53, 62; interest rates, 58;
investment coefficients, 75, 108, 160,
161; investment in manufacturing,
170; labor input growth, 92; labor
supply, 113; macroeconomic policies,

242
I N D E X
53, 55, 58, 61, 62, 99–100; manufac-
turing sector, 156, 166, 195; mining,
161; natural resources, 172; productiv-
ity levels, 78, 108, 176, 177, 178;
reform results, 150, 206; regional trade
groups, 22; social expenditure, 67, 68,
100, 144, 148; tax reform, 45; timing
of reforms, 14, 45, 83, 85; trade
liberalization, 45; trade restrictions, 46;
transition period of reforms, 85, 86;
transnational corporations in, 172;
wages, 121, 128, 197
Commodities, 19–20, 37, 172
Communications, 156, 198. See also
Telecommunications
Companhia do Vale do Rio Doce
(CVRD), 185
Comparative advantages, 154, 161, 173, 201
Competition policies, 213, 220
Competitiveness, 23–25, 155, 176, 200,
209, 211, 212, 213–14, 217, 219,
220, 222
Corporación Nacional del Cobre
(Codelco), 185
Costa Rica: agriculture, 179, 180, 193,
195; capital-labor ratios, 128; as
cautious reformer, 49–50, 203; current
account deficits, 58; electrical sector,
189; employment, 119, 123, 150–51;
employment elasticities, 117; exchange
rates, 61; exports, 37, 103, 157, 159,
206; fiscal deficits, 55, 58; growth
rates, 37, 54, 91, 108; income
distribution changes, 130–31, 206;
inflation, 50, 53; interest rates, 58;
investment coefficients, 83, 85, 108,
160, 161; labor supply, 113; macroeco-
nomic policies, 53, 55, 58, 61, 62, 99–
100; manufacturing sector, 160;
productivity, 108, 178; recessions, 54;
reform results, 150–51, 206; services
sector, 156; social expenditure, 67,
144, 148; telephone system, 187;
timing of reforms, 14, 83;
transnational corporations in, 85;
wages, 121, 127, 128, 197, 206
Credit: in agriculture, 194; effects of
capital inflows, 64; for small firms and
microenterprises, 215–16. See also
Bank lending
Crises, 18; banking, 64; currency, 27, 63,
99; debt (1980s), 19, 37–38, 46, 51,
75; effects on capital flows, 27; inter-
national financial (1997–99), 27, 31;
Mexican peso, 27, 31, 32, 61, 85; pro-
tecting social expenditure during, 217
Currencies: exchange controls, 41. See also
Exchange rates
Current account deficits, 51, 54–58, 106;
effects of exchange rates, 61; in 1990s,
77; relationship to growth, 105–06
CVRD (Companhia do Vale do Rio
Doce), 185
Debt: effects on investment, 88. See also
Bank lending
Debt crises: effects on trade, 19; of 1980s,
37–38, 46, 51, 75
Decentralization of government, 43, 64, 68
Demographic trends: immigration, 113;
labor supply, 113; population growth,
91–92
EAP. See Economically active population
ECLAC. See Economic Commission for
Latin America and the Caribbean
Economically active population (EAP),
113–14
Economic Commission for Latin America
and the Caribbean (ECLAC), 2–3, 4,
73, 77, 112, 210, 218
Ecuador, 22
Education: changes in levels of, 115–16;
effect of improvements on equity, 115–

243
I N D E X
16, 217; employment in, 198;
expanding access to, 94, 217; expendi-
tures, 65, 142, 144, 148; influence on
labor quality, 94; as priority, 65, 142;
privatization, 68–69; quality problems,
68, 94, 217; relationship to income
distribution, 133–35, 136–39;
relationship to productivity, 79, 94;
relationship to wages, 127–28; short-
term improvements, 214
Edwards, Sebastian, 4
Electricity: employment, 198; foreign
investment, 172; impact of reforms,
186–91; privatization, 187–88, 189–90,
198; public enterprises, 186–87, 189;
regulatory frameworks, 188–89, 191;
technological innovation, 189, 190
Employment: in agriculture, 191, 193–95;
analysis framework, 7–11; elasticities,
116, 117; export-related job creation,
39, 111; impact of reforms, 3, 4, 110–
12, 116–26, 150–51, 203; impact of
reforms at sectoral level, 191–99; in
informal sector, 3, 119; job creation, 3,
39, 111, 117–19, 121–22, 123–25,
215–16; labor demand, 116, 142;
labor input to growth, 92, 93–94, 97;
labor-intensive exports, 39, 154, 157;
labor supply, 113–15, 126; low-skill
jobs, 3, 111; in manufacturing sector,
125, 191–93, 195–98, 208; predicted
effects of reforms, 110–11; in public
sector, 119, 215; relationship to trade,
39, 111, 126; in services sector, 165,
191, 198–99, 208; total participation
rate (TPR), 113–15; in tradables
sector, 165; unemployment, 119–20,
122, 210; unskilled workers, 111,
128–29. See also Labor markets; Wages
Equity: analysis framework, 7–11; effects
of educational improvements, 115–16,
217; factors in, 133–37; in future, 210,
215; goals of reforms, 39; impact of
reforms, 3, 4, 110, 112, 137–42, 150–
52, 203; impact of social expenditure,
65, 142–49; increasing with job
creation, 111; land distribution, 139–
40. See also Income distribution; Wage
differentials
Equity investments, 29–30, 32
Europe: trade with Latin America, 23, 24
European Union: agricultural subsidies,
181; trade with Latin America, 23
Exchange controls, 41
Exchange rates: appreciation, 58, 61, 63;
crises, 27, 31, 32, 61, 63, 85, 99;
floating, 53; impact on employment,
126; impact on investment, 88, 108;
impact on trade, 20, 126, 219; interest
rates supporting, 58; overvalued, 12,
18, 29, 61, 99, 108; promoting exports
with, 25, 73; relationship of instability
to growth, 101
Export-led growth, 73, 82, 102–06,
153–54
Exports, 19, 20–21; agricultural, 179,
181–82; capital-intensive sectors, 157;
commodities, 19–20, 37; competitive-
ness, 23–25; demand, 9, 13; impact of
integrated markets, 207; impact of
trade liberalization, 156–59, 207;
increases in 1990s, 103; to industrial-
ized countries, 21–23, 24–25, 101,
207; job creation related to, 39, 111;
labor-intensive sectors, 39, 154, 157;
manufactured, 20–21, 23, 25, 37, 157,
167–69, 172, 175; minerals, 182,
183–84; natural resources, 37, 42, 157,
201, 207; prices, 13, 19–20, 37;
product composition, 20–21;
promotion of, 25, 37, 73, 213;
relationship to growth, 33, 101, 102–
06; sectoral structure, 157, 165–66; as
share of output, 19

244
I N D E X
Factor markets, 13, 212–14. See also
Capital markets; Labor markets
FDI. See Foreign direct investment
Fernández Arias, Eduardo, 73–74
Financial liberalization, 40–41, 63–64;
impact on equity, 140–41; impact on
services sector, 198; index, 44, 45,
46–47, 102. See also Interest rates
Financial repression, 40–41, 64
Financial services, 156, 172, 198. See also
Banks
Firms. See Large domestic firms;
Microeconomic level; Small firms;
Transnational corporations
Fiscal deficits, 51, 54–58; effects of high
interest rates, 58; effects of reforms, 64;
reducing, 53, 63, 67, 69, 218
Fiscal policy, 53; linked to monetary
policy, 58; reforms inconsistent with,
64; spending cuts, 55, 67, 69; stability
as goal, 218–19. See also Tax reform
Foreign direct investment (FDI):
attracting, 154, 213; greenfield, 213;
macroeconomic stability and, 62–63;
in mining, 182, 184–86; in 1990s, 29–
31; as percentage of total investment,
88, 106; in privatized firms, 30, 85,
187; relationship to growth, 34;
restrictions on, 41; takeovers of large
domestic firms, 30–31, 173. See also
Transnational corporations
Garcia, Alan, 38
GATT. See General Agreement on Tariffs
and Trade
GDP growth. See Growth
Gender: as factor in income distribution,
136; women in labor force, 113, 136
General Agreement on Tariffs and Trade
(GATT): Uruguay Round, 25. See also
World Trade Organization (WTO)
Gini coefficient, 131, 132, 133, 140
Globalization of economy, 17, 220–21
Gross domestic product (GDP) growth.
See Growth
Growth: accounting for differences, 92–
97; analysis framework, 7–11; capital
accumulation, 92–93, 94–95, 97;
effects of macroeconomic instability,
101; effects of stabilization policies,
53–54, 101; employment and, 123–
24; export-led, 73, 82, 102–06, 153–
54; factor inputs, 92–94; future, 210,
212–14; high-growth countries, 90–
91, 92–93, 95, 96; impact of reforms,
2–3, 72–74, 88–92, 99–102, 107–08,
203; labor input, 92, 93–94, 97; low-
growth countries, 91, 93, 95, 96;
macroeconomic policies to promote,
218; measuring impact of reforms, 4,
5; in 1970s, 27; in 1980s, 27, 29; in
1990s, 27, 29, 54, 73, 89–92; as
objective of reforms, 39, 72–73; per
capita rates, 91–92; periodization, 89–
91; rates needed, 77–78; recessions,
54, 88, 106; relationship to capital
flows, 9, 18, 27–29, 33–34; relation-
ship to exports, 33, 101, 102–06;
relationship to investment, 74, 101;
relationship to productivity, 94, 95–97,
107–08
Growth-accounting framework, 92, 101
Health care: employment, 198; expendi-
tures, 65, 142, 144, 148; as priority,
65, 142; privatization, 68–69; quality
of services, 68
Household surveys, 129–30
Housing: construction, 174; poor quality,
68; subsidies, 65
Human capital. See Education; Health care
IDB. See Inter-American Development Bank
ILO. See International Labour Organization

245
I N D E X
IMF. See International Monetary Fund
Immigration, 113
Import liberalization, 39–40; effects on
fiscal deficits, 64; impact on growth,
102; index, 44, 45. See also Trade
liberalization
Imports: agricultural, 181, 182; demand,
20; effects of capital flows, 28–29; fall
in 1980s, 29, 103; increases, 18, 20,
103, 175; manufactured, 173; quotas,
40; substituted for domestic inputs,
103, 175–76, 209; tariffs, 40, 46;
trends, 20
Import-substitution industrialization (ISI),
19, 36–37, 40, 42, 110–11, 153–54
Income distribution: comparison of
occupational groups, 136; effects of
inflation, 131, 139; factors in, 133–37;
gender as factor, 136; household, 129,
131, 137; impact of reforms, 3, 137–
42; impact of social expenditure, 65,
147, 148–49; Kuznets curve, 137;
measurements, 130, 131, 132–33;
primary, 129–32; relationship to
education levels, 133–35, 136–39;
relationship to wage differentials, 131–
32; trends, 3, 129–37. See also Equity;
Wage differentials
Incomes: effects of social expenditure,
146–47
Inequality. See Equity; Income distribution
Inflation: in cautious reformer countries,
49, 50; declines, 53, 218; effects on
income distribution, 131, 139; effects
on investment, 88; effects on pensions,
68; efforts to control, 51–53, 54, 63,
108; hyper-, 38, 47, 99, 108, 139;
relationship to growth, 101
Informal sector: employment, 3, 119;
income distribution, 136; productivity,
209; retail and services, 198; wages,
197–98
Innovation. See Technology
Institutions, 13, 18, 220, 222
Integrated regional markets. See Regional
markets
Inter-American Development Bank (IDB),
3, 4, 5, 73, 111–12
Interest rates: deregulation of domestic,
40, 41, 46–47; effects of reforms, 64;
impact on fiscal deficits, 58; impact on
income distribution, 3; impact on
investment, 58; independent central
banks and, 41; raising, 53, 58, 61. See
also Monetary policy
International context of reforms, 6, 8, 9;
contradictory effects, 18; external
vulnerability, 106, 108–09; globaliza-
tion of economy, 17, 220–21; impact
on growth, 101. See also Capital flows;
Foreign direct investment; Trade
International economy: financial crisis
(1997–99), 27, 31; influence on
company decisions, 154; managing
relations with, 220–21; new financial
architecture, 221
International institutions, 38, 49
International Labour Organization (ILO),
3, 111–12, 119
International Monetary Fund (IMF), 38, 49
Investment: agricultural, 181; amounts
needed, 77–78; decisions at
microeconomic level, 7, 9, 12, 204;
determining factors, 81, 159; effects of
capital flows, 28; effects of exchange
rates, 88, 108; effects of interest rate
levels, 58; efficient allocation, 212;
impact of reforms, 86–88, 107–08,
203; impact of reforms at sectoral level,
159–61, 166, 207; impact of trade
liberalization, 159–60; increased, 80,
82, 209, 212; information needed for
decisions, 9; joint ventures, 172, 213;
long-term trends, 75–78, 209; in

246
I N D E X
machinery and equipment, 86–88;
macroeconomic stability and, 62–63;
in manufacturing sector, 160, 167,
169–72, 173–76; in mining, 183, 185;
as percentage of GDP, 75, 83–85, 86;
phases of change after reforms, 80–86,
167, 204; related to privatization, 82,
85, 88, 159–60, 207; relationship to
growth, 74, 101; relationship to
productivity, 78–79, 82, 161, 165;
relationship to saving, 76–77; sectoral
structure, 160–61, 166; short-term
effects of reforms, 81–82, 83–85;
sustainability, 75–77; in tradables
sector, 160–61; by transnational
corporations, 82, 85, 154, 172. See also
Foreign direct investment
ISI. See Import-substitution industrialization
Jamaica: capital-labor ratios, 128; as
cautious reformer, 49–50, 203;
electrical sector, 189; employment,
119, 123, 151; employment elastici-
ties, 117; exchange rates, 61, 62, 100;
fiscal deficits, 55, 62; growth rates, 54,
62, 90, 91, 206; income distribution
changes, 131, 151–52; inflation, 50,
53, 100; interest rates, 58, 62; labor
supply, 113; macroeconomic policies,
53, 55, 58, 61, 62, 99–100; manufac-
turing sector, 156; recessions, 54;
reform results, 151–52, 206; services
sector, 156; social expenditure, 67, 68,
148; timing of reforms, 15; wages,
121, 197
Japan: trade with Latin America, 23
Jobs. See Employment
Joint ventures, 172, 213
Katz, Jorge, 79–80, 176, 177, 191
Kuznets, Simon, 137
Kuznets curve, 137
Labor input, 92, 93–94, 97
Labor markets: flexibilization, 216;
improving functioning of, 216;
indicators, 122–23; reforms, 43;
supply, 113–16, 126; weaknesses, 13;
women in, 113, 136. See also Employ-
ment
Labor productivity. See Productivity
Labor unions, 129, 188
LAIA. See Latin American Integration
Association
Land distribution, 139–40, 180–81
Large domestic firms: employment, 197;
foreign investment in, 30–31, 173;
investment by, 170, 172, 208;
productivity, 177–78, 209; technology,
13; wages, 209
Latin American Integration Association
(LAIA), 21–22
Legal frameworks: changes affecting
mining, 182, 184, 186; corporate
governance, 213
Livestock, 179, 180
Loans. See Bank lending; Credit
Londoño, Juan Luis, 141
Lora, Eduardo, 44, 74
Machado, Roberto, 45
Machinery and equipment: in agriculture,
194–95; capital stock, 95; investment
in, 86–88
Macroeconomic policies: of aggressive
reformers, 61, 99; of cautious
reformers, 61–62; changes since 1970s,
51; current account deficits, 51, 54–
58, 61, 77, 105–06; effects on growth,
53–54; effects on investment, 62;
effects on social policies, 67, 69; fiscal
policy, 53, 58, 64, 218–19; influence
at sectoral level, 154; influence on
capital flows, 26; influence on
outcomes of reforms, 51; managing

247
I N D E X
international economic relations, 220–
21; monetary policy, 53, 58; objectives,
35, 218; recommendations for future,
212, 217–19; reforms consistent with,
62–63; reforms inconsistent with, 12,
63–64, 108, 126, 218, 219; stability as
goal, 217, 218–19; stabilization
policies, 51–53, 54, 58, 62–63. See also
Fiscal deficits; Inflation
Manufacturing sector: competition from
imports, 173; effects of reforms on
exports, 156, 167–69; effects of
reforms on investment, 173–76; effects
of reforms on output, 156; employ-
ment, 125, 191–93, 195–98, 208;
exports, 20–21, 23, 25, 37, 157, 167–
69, 172, 175; impact of reforms, 166–
78; impact of trade liberalization, 142,
156, 173–76; import-substitution
industrialization (ISI), 19, 36–37, 40,
42, 110–11, 153–54; industrialization,
37; investment, 160, 167, 169–72,
173–76; output, 170; productivity,
165, 176–78, 195; small firms, 172,
177–78, 208; specialization after
reforms, 166, 172; subsectors, 169–72;
supplier chains, 33, 175–76, 207, 209;
technology intensive subsectors, 172;
transnational corporation subsidiaries,
170, 172–73; wages, 197–98
Maquila (in-bond) industry: advantages,
173–74; employment, 197, 208;
exports, 157, 166, 172; investors, 171;
output, 156; suppliers, 175–76, 207;
value added, 103; wages, 198
Mercosur (Southern Common Market),
22, 172
Mexico: agriculture, 179, 180, 182, 193,
195; capital-labor ratios, 128; as
cautious reformer, 49–50, 203; current
account deficit, 61; debt crisis, 37;
electrical sector, 187, 189; employ-
ment, 119, 120, 123, 151; employ-
ment elasticities, 117; exchange rates,
61, 99, 108; exports, 103, 157–59,
206; fiscal deficits, 55; foreign direct
investment, 30, 173; growth rates, 37,
54, 91, 107, 108; income distribution
changes, 131; industrialization, 37;
inflation, 50, 53, 99; interest rates, 58;
investment coefficients, 75, 80, 85,
107, 108; investment in manufactur-
ing, 170, 172; labor supply, 113;
macroeconomic policies, 53, 55, 58,
61–62, 99, 108; manufactured exports,
20–21, 23, 37, 157, 165–66, 172,
175; manufacturing sector, 156, 195,
196–97; oil, 37; peso crisis, 27, 31, 32,
61, 85; productivity levels, 80, 107,
108, 176, 177, 178; reform results,
151, 206; services sector, 156; social
expenditure, 68; telecommunications,
188; timing of reforms, 14, 83; trade
restrictions, 46; trade with United
States, 21–22, 23; transnational
corporations in, 172; wages, 120, 121,
128, 197, 198, 206. See also Maquila
(in-bond) industry; North American
Free Trade Agreement (NAFTA)
Microeconomic level, 7; expectations for
reforms, 154; firm restructuring, 128–
29; impact of reforms, 12, 200, 208–
09; influence of international context,
17–18, 154; investment decisions, 7, 9,
12, 204; lack of analysis of reform
impact, 6; responses to reforms, 7–8
Microenterprises. See Small firms and
microenterprises
Mining: countries with comparative
advantage, 161; foreign direct
investment, 182, 184–86; global
market, 182, 183–84; impact of
reforms, 182–86; investment, 183,
185; legal changes, 182, 184, 186;

248
I N D E X
privatization, 182, 185; publicly owned
firms, 185; technological innovation,
184, 186
Moguillansky, Graciela, 176, 187
Monetary policy: linked to fiscal policy,
58; stabilization as goal, 53, 58. See also
Interest rates
Montiel, Peter, 73–74
Morley, Samuel, 44–45, 127, 128, 129,
135–36, 137, 141
NAFTA. See North American Free Trade
Agreement
Natural resources, 37, 42, 157, 172, 201
North American Free Trade Agreement
(NAFTA), 21, 85, 157–59, 166, 197,
207
Oil, 37, 172
Organization for Economic Cooperation
and Development (OECD), 101, 209
Paraguay, 22
Pension systems. See Social security
systems
Peres, Wilson, 172
Perpetual inventory model, 94
Perry, Guillermo E., 4
Peru: as aggressive reformer, 47–48, 49,
99, 203; agriculture, 179, 193–94;
capital controls, 46; capital-labor ratios,
128; electrical sector, 188, 189, 190;
employment, 119, 123, 126, 151;
employment elasticities, 117; exchange
rates, 61; exports, 23; fiscal deficits, 55;
foreign direct investment, 186; growth
rates, 54, 90–91, 92, 108, 205–06;
import-substitution policy, 37; income
distribution changes, 130–32, 151;
inflation, 38, 47, 53; interest rates, 58;
investment coefficients, 75, 83, 108,
160, 161; investment in manufactur-
ing, 170; labor supply, 113; macroeco-
nomic policies, 38, 53, 55, 58, 61;
manufacturing employment, 195;
mining, 183, 184, 185, 186; natural
resources, 172; privatization, 82;
productivity levels, 78, 97, 108, 176,
177, 178; recessions, 54; reform
results, 151–52, 205–06; regional trade
groups, 22; services sector, 156; social
expenditure, 67, 68; timing of reforms,
14, 83, 85; trade restrictions, 46;
transition period of reforms, 85, 86;
transnational corporations in, 172;
wages, 120, 121, 128
Pettinato, Stefano, 45
Population: growth rates, 91–92; working-
age, 113
Poverty: efforts to reduce, 39; impact of
social expenditures, 144–47; increase
in, 3; in rural areas, 180. See also
Income distribution
Private sector: cooperation with public
sector, 220; deregulation, 39; employ-
ment, 119
Privatization, 42, 207–08; in agriculture,
178–79; capital inflows, 18, 31; effects
on trade deficits, 105; fiscal deficits
reduced by, 63; foreign direct invest-
ment, 30, 85, 187; of government-
owned banks, 41; impact on
employment, 198; impact on equity,
140–41; impact on growth, 102;
index, 44; investment related to, 82,
85, 88, 159–60, 207; methods, 42,
187–88; in mining sector, 182, 185;
objectives, 154; of social services, 68–
69; technological progress and, 80,
189, 190–91; of utilities, 187–88, 189,
190–91, 198
Productivity: agricultural, 165, 181; of
capital stock, 95; differences among
countries, 95; effects of labor quality,

249
I N D E X
94; factors in, 78–80; gap vis-à-vis
United States, 176–77, 207; impact of
reforms, 107–08, 203; improving, 82,
212; increases in 1980s, 74; long-term
trends, 78–80, 209; in manufacturing,
165, 176–78, 195; relationship to
education, 79, 94; relationship to
growth, 94, 95–97, 107–08; relation-
ship to investment, 78–79, 82, 161,
165; relationship to wages, 122, 197;
sectoral differences, 161, 165, 176,
207; in services, 165, 191; of small and
medium-size enterprises, 177–78, 209;
total factor, 74, 95–96
Public sector: bank borrowing by, 37;
banks, 40, 41; cooperation with private
sector, 220; employment, 119, 215;
impact of reforms on output, 156;
management of, 42; mining, 185;
natural resource firms, 42; utilities, 42,
186–87, 189. See also Privatization
Reform: measuring results, 4–5
Reform indexes, 43–47; impact on
growth, 101–02; impact on invest-
ment, 88; of Inter-American Develop-
ment Bank, 4, 5
Reform phases, 80–86; consolidation
period, 81, 83; positive transitory
factors, 81, 82–83, 84, 85; transitional
period, 80, 81–82, 85–86
Reforms, 1–2; advocated by international
institutions, 38, 49; aggressive
reformers, 36, 47–49, 61, 99, 126,
203, 204–06; analysis methodology,
13–16; cautious reformers, 36, 47, 49–
50, 61–62, 99–100, 203, 206;
conceptual framework, 7–11;
consistent with macroeconomic
policies, 62–63; convergence over time,
47; credibility, 8–9, 11–12; decentrali-
zation of government, 43, 64, 68;
domestic opposition, 50; expectations,
39, 110–11, 153–54, 204; factors in
decisions, 10, 38–39; factors in results,
11–13, 51; goals, 35; implementation,
4, 43, 202–03; inconsistencies among
policies, 6, 8, 9; inconsistent with
macroeconomic policies, 12, 63–64,
108, 126, 218, 219; initial domestic
conditions, 10, 11–12, 36, 47–48, 49,
83; labor market, 43; literature on, 2–
6, 72–74, 110–12, 140; recommenda-
tions for future, 210–11, 221–23;
results at aggregate level, 10–11, 35,
203–04, 223; results by country, 150–
52, 204–06; results at microeconomic
level, 12, 200, 208–09; results at
sectoral level, 11, 155–56, 207–08;
second generation, 204, 211; timing,
14–15, 45–47, 83, 85–86; uncertainty
created by, 12, 204. See also Capital
account opening; Financial liberaliza-
tion; Privatization; Tax reform; Trade
liberalization
Regional markets, 19, 22–23, 220, 221;
gaining access, 172; impact on exports,
207; trade liberalization associated
with, 40
Regulatory frameworks: banking, 13, 219;
deregulation, 39; insufficient, 13; need
for, 220; reducing regulation of small
firms, 215; stability as goal, 218–19;
for utilities, 188–89, 191, 213
Rodrik, Dani, 74
Rural residents: effects of reforms, 141;
employment, 193–94; income
distribution, 136, 141, 180; poverty,
180. See also Agriculture
Savings, 76–77, 218
Sectoral level: employment changes, 125,
165; export shares, 157, 165–66; goals
of reforms, 153–54; impact of eco-

250
I N D E X
nomic globalization, 17–18; impact of
reforms, 11, 155–56, 207–08; impact
of reforms on investment, 159–61,
166, 207; impact of reforms on trade,
156–59; lack of analysis of reform im-
pact, 5–6; productivity, 161, 165, 176,
207. See also Agriculture; Manufactur-
ing; Mining; Services; Tradables sector
Self-employment, 117–19, 136
Services sector: communications, 156, 198;
employment, 165, 191, 198–99, 208;
financial services, 156, 172, 198; impact
of reforms, 156, 198; informal enter-
prises, 198; productivity, 165, 191;
transportation, 156; wages, 199. See
also Electricity; Telecommunications
Small and medium-size enterprises
(SMEs): lack of growth, 208; produc-
tivity, 177–78, 209; wages, 209
Small firms and microenterprises:
competition from imports, 175; credit,
215–16; employment, 119, 195–97,
198, 215–16; expected growth after
trade liberalization, 154; investment in
manufacturing, 172; reducing costs in
factor markets, 214; reducing
regulations, 215
SMEs. See Small and medium-size
enterprises
Social expenditure: categories, 65;
concentration index, 145–46; declines,
67; distribution, 144–48; education,
65, 142, 144, 148; efficiency, 216;
health care, 65, 142, 144, 148;
housing subsidies, 65; impact on
equity, 65, 142–49; impact on
incomes, 146–47; increases in 1990s,
67–68, 144; increasing, 69–70, 111,
212, 216–17; priorities, 142–44;
protecting in crises, 217; relationship
to growth, 67; relationship to reforms,
148–49; social security, 65, 142–44;
targeting index, 144–45; variations
between countries, 147–48
Social policies: effects of macroeconomic
policies, 67, 69; future, 69–70; links to
reforms, 64–65; objectives, 35, 64–65;
privatization of services, 68–69;
programs included in, 65; quality of
services, 68; reforms, 68; reforms
inconsistent with, 12; variations
between countries, 36. See also
Education; Health care
Social security systems: expenditures, 65,
142–44; privatization, 43, 68–69, 218;
small number of participants, 68
Southern Common Market (Mercosur),
22, 172
Stabilization policies, 51–53, 54, 58, 62–
63, 217
State-owned enterprises. See Public sector
Stock issues, 29–30, 32
Structural reforms. See Reforms
Stumpo, Giovanni, 172
Supplier networks: competition from
imports, 175–76, 209; creation of, 33;
for maquila plants, 175–76, 207
Székely, Miguel, 141
Taxes: value-added (VAT), 43, 45
Tax reform, 42–43; impact on equity,
140–41; impact on mining sector, 184;
incentives for exporters, 215; index, 44,
45, 102; results of lower rates, 64, 212
Technology: determinants of progress, 80;
effects on employment, 197; innova-
tion by transnational corporations, 80,
184, 186, 189; innovation in mining,
184, 186; investment in, 82, 86–88; in
manufacturing, 172; market, 13, 214;
national innovation systems, 80; phases
of change after reforms, 80–86;
progress related to privatization, 80,
189, 190–91; promoting innovation,

251
I N D E X
214; rapid change, 18; relationship to
productivity, 95, 177
Telecommunications: employment, 198;
impact of reforms, 186–91; investment
in, 161, 166, 172, 189; privatization,
187–88, 189, 190–91, 198; productiv-
ity, 191; public enterprises, 186–87;
regulatory frameworks, 188–89, 191;
technological innovation, 189, 190–91
Theil index, 130, 132–33, 136
TNCs. See Transnational corporations
Tokman, Victor E., 3
Total factor productivity, 74, 95–96
Total participation rate (TPR), 113–15
Tradables sector: employment, 165;
impact of reforms, 155–56, 159;
investment, 160–61
Trade: agricultural, 179; comparative
advantages, 154, 161, 173, 201;
external vulnerability, 108–09, 219;
geographic focus, 21–23; protectionist
policies, 39–40, 46, 173; relationship
to capital flows, 33; specialization, 154,
159; surpluses, 105; taxes, 42; Uruguay
Round, 25; volume of, 19. See also
Exports; Imports; Regional markets;
Trade liberalization
Trade deficits: effects of exchange rates, 61,
63, 175; effects of reforms, 105, 203;
increased after liberalization, 18, 20,
105, 106, 175; increased in 1980s, 37;
long-term trends, 105. See also Exports;
Imports
Trade liberalization: elimination of import
protection, 39–40; expectations, 154;
goals, 39; impact on agriculture, 142,
178–79, 181–82; impact on capital
flows, 18; impact on equity, 140–42;
impact on exports, 156–59, 207;
impact on inflation, 63; impact on
investment, 88, 159–60; impact on
manufacturing sector, 142, 156, 173–
76; impact on services sector, 198;
impact on trade deficits, 18, 20, 105,
175. See also Import liberalization
Training, 13, 214. See also Education
Transnational corporations (TNCs):
advantages over domestic firms, 173,
208; agribusiness, 181; increased
investments, 82, 85, 154; investment
strategies, 172; joint ventures, 213;
manufacturing investments, 170, 172–
73; in mining sector, 184, 185, 186;
nationalization of subsidiaries, 42, 185;
purchases of companies in Latin
America, 30–31; role in technological
progress, 80, 184, 186, 189; sales by
subsidiaries, 31, 172–73, 208; taxation
of, 42; in telecommunications, 189
Uncertainty: created by reforms, 11, 12,
81, 82, 83, 86, 88, 125, 167, 173,
204, 208, 212; reducing, 212
Unemployment, 119–20, 122, 210
Unions, 129, 188
United Nations Economic Commission
for Latin America and the Caribbean.
See Economic Commission for Latin
America and the Caribbean
United States: agricultural subsidies, 181;
Caribbean Basin Initiative, 207;
enterprise zones, 215; manufacturing
productivity, 176–77; telecommunica-
tions, 191; trade with Latin America,
21–22; trade with Mexico, 21–22, 23.
See also North American Free Trade
Agreement (NAFTA)
Urban residents: agricultural workers, 194;
effects of reforms, 140, 141; income
distribution, 136, 140, 141
Uruguay, 22, 45
Uruguay Round, 25
Utilities: public ownership, 42, 186–87, 189.
See also Electricity; Telecommunications

252
I N D E X
Value-added tax (VAT), 43, 45
Venezuela, 22, 172
Volatility: of capital flows, 18, 25–30, 33,
106, 221; of GDP growth, 53–54,
123, 218–29
Wage differentials, 126–29; formal and in-
formal firms, 197–98; large and small
firms, 209; relationship to education
levels, 127–28; relationship to income
distribution, 131–32; skilled and un-
skilled workers, 111, 128–29; white-
collar and blue-collar workers, 128
Wage employment, 116, 117–19
Wages: agricultural, 195; average real,
120–21; declines in 1980s, 3;
improvements in 1990s, 120, 121,
126, 206; in manufacturing, 197–98;
minimum, 129; relationship to
productivity, 122, 197; relationship to
volume of employment created, 121–
22; in services sector, 199
WAP. See Working-age population
Washington Consensus, 6, 65
Weller, Jürgen, 123, 125, 127, 128, 195
Women: in labor force, 113, 136. See also
Gender
Workers. See Employment; Labor market;
Wages
Working-age population (WAP), 113
World Bank, 4, 38, 49, 50, 65
World Trade Organization (WTO), 19, 25

253
I N D E X
economic commission for latin america and the caribbean
ECLAC is one of five United Nations regional commissions. All Latin
American and Caribbean countries are members, as are a number of devel-
oped nations in America and Europe with strong historical, cultural, and
economic ties to the region. Since its founding in 1948, ECLAC has pro-
moted economic and social development and cooperation between nations
through training courses, technical assistance, and policy-oriented research
projects. As well as providing general economic analysis, these projects also
address the particular problems of individual Latin American and Carib-
bean countries. In recent years, ECLAC has focused its efforts on the chal-
lenges faced by the region in achieving sustained (and environmentally
sustainable) growth among pluralist democracies. These democracies face
very real demands as they find ways to develop their economies in order to
benefit the majority of the population. As a result, ECLAC’s main focus
has been on helping countries improve economic growth and social equity
simultaneously. ECLAC, with headquarters in Santiago, Chile, has two
subregional offices in Mexico and in Trinidad and Tobago, together with
national offices in Argentina, Brazil, Colombia, Uruguay, and the United
States.


Wyszukiwarka
Podobne podstrony:
Fishea And Robeb The Impact Of Illegal Insider Trading In Dealer And Specialist Markets Evidence Fr
Tourism Human resource development, employment and globalization in the hotel, catering and tourism
Peres, A Karl Popper and the Copenhagen Interpretation (1999)
Eleswarapu And Venkataraman The Impact Of Legal And Political Institutions On Equity Trading Costs A
the effect of water deficit stress on the growth yield and composition of essential oils of parsley
Asian Americans Growth, Change, and Diversity
Wilson Clay, Gift giving and books in the letters
Composition and Distribution of Extracellular Polymeric Substances in Aerobic Flocs and Granular Slu
Economides Wilson The Economic Factor in International Relations
Variations in Risk and Treatment Factors Among Adolescents Engaging in Different Types of Deliberate
The energy consumption and economic costs of different vehicles used in transporting woodchips Włoch
0415165083 Routledge Ancient History Key Themes and Approaches Jan 2000
[Mises org]Murphy,Robert Study Guide of Man, Economy, And State
Kałuska, Angelika The role of non verbal communication in second language learner and native speake
0262201313 The MIT Press Coherence in Thought and Action Nov 2000
Bradstreet and Tylor poetry in colonial America
2000 Evaluation of oligosaccharide addition to dog diets influences on nutrient digestion and microb
Beyond Sun And Sand Caribbean Environmentalisms
więcej podobnych podstron