
Risks and Portfolio Decisions involving Hedge Funds
Vikas Agarwal
Georgia State University
Narayan Y. Naik
London Business School
Current Version: October 16, 2002
JEL Classification: G10, G19
____________________________________________
Vikas Agarwal is from Georgia State University, Robinson College of Business, 35, Broad Street, Suite 1221,
Atlanta GA 30303, USA: e-mail:
vagarwal@gsu.edu
Tel: +1-404-651-2699 Fax: +1-404-651-2630. Narayan Y.
Naik is from London Business School, Sussex Place, Regent's Park, London NW1 4SA, United Kingdom: e-
mail:
nnaik@london.edu
Tel: +44-207-262-5050, extension 3579 Fax: +44-207-724-3317. We would like to
thank Ravi Bansal, Richard Brealey, Michael Brennan, Stephen Brown, Ian Cooper, Elroy Dimson, Fauchier
Partners, Stephen Figlewski, William Fung, Rajna Gibson, Lawrence Glosten, William Goetzmann, Oliver
Hansch, Campbell Harvey (the editor), David Hsieh, Jon Ingersoll, Dusan Isakov, Ravi Jagannathan, Jayant
Kale, Robert Kosowski, Pete Kyle, Bing Liang, Lionel Martellini, Andrew Metrick, Todd Pulvino, Robert
Rice, Stephen Schaefer, Jay Shanken, Allan Timmermann, Pradeep Yadav, an anonymous referee and
participants at the donor semin ar at the London Business School, SIRIF conference in Scotland, EFA 2000
Meetings, Berkeley conference on hedge funds, Q-Group seminar in Tampa, CEPR/JFI symposium at
INSEAD, FMA European conference 2001 in Paris, Workshop on Empirical Methods in Finance at the
London School of Economics, FMA 2001 Meetings in Toronto and BSI Gamma Foundation conference in
Zurich for many helpful comments and constructive suggestions. We are very grateful to BSI Gamma
Foundation, Switzerland, for their generous financial support. Vikas is grateful for the research support in
form of a research grant from the Robinson College of Business of Georgia State University. Naik is grateful
for research support from the Center for Hedge Fund Research and Education at the London Business
School. We are thankful to Hedge Fund Research Inc., Chicago and TASS Investment Research Ltd.
London for selling the data on individual hedge funds. We are very grateful to Purnendu Nath and Subhra
Tripathy for excellent research assistance. We are responsible for all errors.

Risks and Portfolio Decisions involving Hedge Funds
Abstract
This paper characterizes the systematic risk exposures of hedge funds using buy-and-hold and
option-based strategies. Our results show that a large number of equity-oriented hedge fund
strategies exhibit payoffs resembling a short position in a put option on the market index, and
therefore bear significant left-tail risk, risk that is ignored by the commonly used mean-variance
framework. Using a mean-conditional Value-at-Risk framework, we demonstrate the extent to
which the mean-variance framework underestimates the tail risk. Finally, working with the
systematic risk exposures of hedge funds, we show that their recent performance appears
significantly better than their long-run performance.

1
Risks and Portfolio Decisions involving Hedge Funds
It is well accepted that the world of financial securities is a multi-factor world consisting of
different risk-factors, each associated with its own factor-risk-premium, and that no single
investment strategy can span the entire “risk-factor space”. Therefore, investors wishing to earn
risk premia associated with different risk-factors need to employ different kinds of investment
strategies. Sophisticated investors, like endowments and pension funds, seem to have recognized
this fact as their portfolios consist of mutual funds as well as hedge funds.
1
Mutual funds typically
employ long only buy-and-hold type strategy on standard asset classes, and help capture risk-
premia associated with equity-risk, interest-rate risk, default-risk etc. However, they are not very
helpful in capturing risk-premia associated with dynamic trading strategies or spread-based
strategies. This is where hedge funds come into the picture. Unlike mutual funds, hedge funds are
not evaluated against a passive benchmark and therefore can follow more dynamic trading
strategies. Moreover, they can take long as well as short positions in securities, and therefore can
bet on Capitalization spreads or Value-Growth spreads. As a result, hedge funds can offer
exposure to risk-factors that traditional long-only strategies cannot.
2
As there is no “free-lunch” in financial markets, question arises regarding the kinds and nature
of risks associated with different hedge fund strategies. This is a challenging task given the
complex nature of the strategies and limited disclosure requirements faced by hedge funds. Out of
a wide range of hedge fund strategies available in the marketplace, our knowledge to-date is
limited to the risks of two strategies: “trend-following” analyzed by Fung and Hsieh (2001) and
“risk-arbitrage” studied by and Mitchell and Pulvino (2001). Both studies find the risk-return
characteristics of the hedge fund strategies to be nonlinear, and stress the importance of taking
into account option-like features inherent while analyzing hedge funds.

2
We start with these insights and contribute to this emerging literature in several important
ways. First, we extend our understanding of hedge fund risks to a wide range of equity-oriented
hedge fund strategies. Instead of imposing a specific functional form, we allow for a flexible
piecewise linear function of the market return to approximate the nonlinear payoffs of different
hedge fund strategies. Our approach has the advantage that it is an operationally convenient
method that can empirically characterize the risk of any generic hedge fund strategy. Second, we
examine the implications of nonlinear option-like payoffs of hedge funds for portfolio decisions.
We show how the Conditional Value-at-Risk (CVaR) framework, which explicitly accounts for
the negative tail risk, can be applied to construct portfolios involving hedge funds.
3
We contrast our
results with those obtained using the traditional mean-variance framework. Finally, we show how
the limitation of short history of hedge fund returns can be overcome by working with the
underlying risk factors estimated through a multi-factor model.
4
Since the underlying risk factors
have longer return history, this approach can provide insights into the long-term risk-return
tradeoffs of hedge funds. On the whole, it provides important insights into the different hedge fund
strategies, insights that are very helpful while taking investment decisions like portfolio
construction, risk management, benchmark design, manager compensation etc. involving hedge
funds.
It is well known that payoffs of managed portfolio will show option-like features (see Merton
(1981) and Dybvig and Ross (1985)). The importance of taking into account such option-like
features, even when the fund manager does not have superior information and does not trade in
derivatives, was first demonstrated by Jagannathan and Korajczyk (1986). The focus of this
earlier stream of research was on assigning a value to the superior information that a skilled
portfolio manager may possess by separating the skill into two dichotomous categories: market
timing and security selection. Glosten and Jagannathan (1994) were the first to point out that even
though it is rather difficult to separate a manager's ability clearly into two such categories, it is still

3
possible to characterize the nature of the risk in managed portfolios and assign an overall value to
the manager's skills by using derivative pricing methods. They suggested the inclusion of "..
excess returns on certain selected options on stock index portfolios as additional ‘factor excess
returns’." Our paper builds on this established theoretical framework supported by recent
empirical evidence of option-like features in hedge fund payoffs.
5
Our use of exchange-traded
options offers several advantages. First, they help capture the hedge fund risks in an intuitive
manner. Second, being based on market prices, they embed investor preferences, information and
market conditions. Finally, being highly liquid and exchange-traded, they enable replication of
hedge fund payoffs.
We propose a two-step approach to characterize hedge fund risks. In the first step, we
estimate the risk exposures of hedge funds using a multi-factor model consisting of excess returns
on standard assets and options on these assets as risk factors. In the second step, we examine the
ability of these risk factors to replicate the out-of-sample performance of hedge funds. Our out-of-
sample analysis confirms that the risk factors estimated in the first step are not statistical artifacts
of the data, but represent underlying economic risk exposures of hedge funds. Application of our
approach at the hedge fund index level captures the “popular bets” taken (i.e., common risks
borne) by a large number of hedge funds that were operating during the sample period, while
application at the individual hedge fund level provides information about the systematic risks borne
by that specific hedge fund.
Hedge funds may exhibit non-normal payoffs for various reasons such as their use of options,
or option-like dynamic trading strategies or strategies that lose money during market downturns.
For example, during the Russian debt crisis in August 1998 a wide range of hedge funds reported
large losses. This suggests that hedge funds may be bearing significant left-tail risk. Regulatory
bodies such as the Basle committee have recognized this feature and have emphasized the
importance of tail risk and use of risk management frameworks such as the Value-at-Risk (VaR).

4
Keeping this in mind, we employ a mean-conditional value at risk (M-CVaR) framework for
portfolio construction involving hedge funds. Using this framework, we examine the extent to
which traditional mean-varia nce framework underestimates the tail risk of hedge funds.
We address the common problem of short history of hedge fund returns one encounters while
conducting empirical research on hedge funds. Since most hedge fund databases report their
returns from early nineties, a natural question arises as to how the hedge funds would have
performed during extreme events in the past, such as the Great Depression of the 1930’s, the oil
shock of the early 1970’s, or the stock market crash of 1987. We shed light on this issue by
working with the underlying risk factors that have longer return history. Assuming that the hedge
funds were bearing the same systematic risk exposures as those during the nineties, we estimate
their returns prior to our sample period and compare their long-term performance with their
performance during the nineties. We show how this approach can help investors get a long-term
perspective on the risk-return tradeoffs of hedge funds.
Our analysis provides three main findings. First, we find that the non-linear option-like payoffs
are not restricted only to “trend-followers” and “risk-arbitrageurs”, but are an integral feature of
the payoffs on a wide range of hedge fund strategies. In particular, we observe that the payoffs
on a large number of equity-oriented hedge fund strategies resemble those from writing a put
option on the equity index. Second, we find that the expected tail losses of mean-variance optimal
portfolios can be underestimated by as high as 54% compared to mean-CVaR optimal portfolios.
This suggests that ignoring the tail risk of hedge funds can result in significantly higher losses
during large market downturns. Finally, our analysis using extrapolated hedge fund returns during
1927-1989 period suggests that their performance during the last decade is not representative of
their long-term performance. In particular, we find that the expected losses beyond VaR during
the 1927-1989 period can be about twice of those during the nineties. We also find that their mean
returns during the 1927-1989 period are significantly lower and their standard deviations are

5
significantly higher compared to those of their recent performance. These findings have important
implications for risk management and portfolio decisions involving hedge funds. They also provide
support to the theoretical modeling of hedge funds in Kyle and Xiong (2001) framework.
Rest of the paper is organized as follows. Section 1 provides the theoretical framework.
Section 2 contains the description of data and the risk factors (buy-and-hold and option-based)
used in our multi-factor model. Section 3 presents the model, the in-sample analysis and various
robustness checks while Section 4 conducts the out-of-sample analysis. Section 5 develops the
Mean-Conditional VaR framework and contrasts the findings with the traditional mean-variance
framework. Section 6 examines the long-term performance of hedge funds and compares it with
their recent performance. Section 7 offers concluding remarks and suggestions for future
research.
1. Theoretical Framework
Linear factor models such as the CAPM and the APT have been the foundation of most of
the theoretical and empirical asset pricing literature. Unfortunately, these theories constrain the
relation between risk factors and returns to be linear. Therefore, they cannot price securities
whose payoffs are non-linear functions of the risk factors. Researchers have addressed this
problem using a non-linear asset pricing framework (see, e.g., Rubinstein (1973), Kraus and
Litzenberger (1976), Dybvig and Ingersoll (1982), Bansal and Viswanathan (1993) and Bansal,
Hsieh and Viswanathan (1993)). More recently, while investigating the importance of
nonlinearities arising from conditional skewness, Harvey and Siddique (2000a,b) specify the
marginal rate of substitution to be quadratic in the market return, namely,
2
1
,
1
, 1
,
t
t
t
M t
t
M t
m
a
b R
c R
+
+
+
= +
+
(1)
and derive an asset pricing model of the following form

6
( )
(
)
( )
2
,
1
,
1
,
1
.
t
i t
t
t
M t
t
t
M t
E r
A E r
B E r
+
+
+
=
+
(2)
The aim of these studies is to price securities with asymmetric nonlinear payoffs.
However, there exists another strand of literature that is related to the nonlinear payoffs, but
which focuses on the use of options to characterize the nonlinearities (Breeden and Litzenberger
(1978)) and assign a value to the nonlinearities. In particular, Glosten and Jagannathan (1994)
show how a value can be assigned to the skill of the manager generating a nonlinear payoff.
More importantly, they show that for valuation purposes it is not necessary to replicate the
nonlinear payoff by a collection of options, but it is only necessary to replicate that part of the
payoff that has nonzero value. For this purpose, it is only necessary to approximate the nonlinear
payoff by a collection of options on a selected number of benchmark index returns. There will be
some residual risk but that residual risk will not be priced.
Glosten and Jagannathan (1994) use the contingent-claim based specification of the form
1
2
1
3
2
4
3
max(
,0)
max(
,0)
max(
,0)
.
p
m
m
m
m
R
R
R
k
R
k
R
k
= α + β
+ β
−
+ β
−
+ β
−
+ ε
(3)
In this paper, we build on Glosten and Jagannathan’s (1994) framework and specify a
flexible piecewise linear form involving call and put options on the market index, namely,
1
2
1
3
2
4
1
5
3
max(
,0)
max(
,0)
max(
,0)
max(
,0)
.
p
m
m
m
m
m
R
R
R
k
R
k
k
R
k
R
= α + β
+ β
−
+ β
−
+ β
−
+β
−
+ ε
(4)
Since the payoffs on options can be expressed as a polynomial function of the market return,
our option-based specification is related to the earlier stream of literature expressing the pricing
kernel as a polynomial function of market return.
6
In terms of implementation, our augmentation of
the linear beta model with nonlinear option-based factors (which have skewed payoffs) is similar
in spirit to Harvey and Siddique’s (2000a) augmentation of Fama-French’s (1993) three-factor
model by a nonlinear factor derived from skewness (i.e., the mimicking return on high-minus-low
co-skewness portfolio). The main motivation behind our use of options is to have a liquid and

7
frequently traded asset whose payoff relates in a nonlinear way with the market return and whose
market prices can be used to compute returns to such payoffs.
Having described the theoretical framework and how our model relates to other nonlinear
models used in the literature to price securities with nonlinear payoffs, and to assign a value to the
skill of manager generating a nonlinear payoff, we proceed to the description of data and risk
factors used in our multi-factor model.
2. Description of Data and Risk Factors
In this paper, we analyze equity-oriented hedge fund strategies. The reason for focusing on
these strategies is the availability of high quality data on exchange-traded options on broad-based
equity indexes such as Standard and Poors’ (S&P) 500 Composite index. We analyze six hedge
fund strategies whose payoff arises primarily from relative mispricings of securities rather than the
movement of the market as a whole, namely, Event Arbitrage, Restructuring, Event Driven,
Relative Value Arbitrage, Convertible Arbitrage and Equity Hedge (Long/Short Equity). We also
investigate two hedge fund strategies whose payoff arises primarily from taking directional bets,
namely, Equity Non-Hedge, and Short Selling (Dedicated Short-Bias). It is well known that hedge
fund indexes differ from each other in the way they are constructed.
7
Further, they may be
subject to different levels of survivorship and backfilling biases (Fung and Hsieh (2002a)).
Survivorship bias arises due to exclusion of funds that die during the sample period from the
database, while backfilling or “instant history” bias arises when the database backfills the historical
return data of a fund before its entry into the database. The former is around 3% per annum while
the latter is around 1.4% per annum (see Brown et al (1999) and Fung and Hsieh (2000a, 2002a)).
Therefore, for the sake of robustness, we conduct our analysis using both Hedge Fund Research
(HFR) and CSFB/Tremont indexes.

8
From the HFR indexes, we select Event Arbitrage, Restructuring, Event Driven, Relative
Value Arbitrage, Convertible Arbitrage, Equity Hedge, Equity Non-Hedge and Short Selling
indexes. We also select four CSFB/Tremont indexes, namely Event Driven, Convertible Arbitrage,
Long/Short Equity and Dedicated Short-Bias that correspond to Event Driven, Convertible
Arbitrage, Equity Hedge and Short Selling HFR indexes. Our sample consists of monthly returns
on the HFR indexes from January 1990 to June 2000 and on the CSFB/Tremont indexes from
January 1994 to June 2000. We validate our findings of economic risk exposures of hedge funds
using out-of-sample data from July 2000 to December 2001.
8
Our multi-factor model uses a set of buy-and-hold and option-based risk factors. The buy-
and-hold risk factors consist of indexes representing equities (Russell 3000 index, lagged Russell
3000 index
9
, MSCI World excluding USA index and MSCI Emerging Markets index), bonds
(Salomon Brothers Government and Corporate Bond index, Salomon Brothers World Government
Bond index and Lehman High Yield index), Federal Reserve Bank Competitiveness-Weighted
Dollar index and the Goldman Sachs Commodity index. We also include three zero-investment
strategies representing Fama-French’s (1993) “Size” factor (Small-minus-Big or SMB), “Book-to-
Market” factor (High-minus-Low or HML) and Carhart’s (1997) “Momentum” factor (Winners-
minus-Losers). Finally, to capture credit risk, we include the change in the default-spread (the
difference between the yield on the BAA-rated corporate bonds and the ten-year Treasury bonds)
as an additional factor.
Our option-based risk factors consist of highly liquid at-the-money (ATM) and out-of-the-
money (OTM) European call and put options on the S&P 500 Composite index trading on the
Chicago Mercantile Exchange. Our use of options with different degrees of moneyness allows a
flexible piecewise linear risk-return relation. The process of buying an ATM call option on the
S&P 500 index works as follows. On the first trading day in January, buy an ATM call option on

9
the S&P 500 index that expires in February. On the first trading day in February, sell the option
bought a month ago (i.e. at the beginning of January) and buy another ATM call option on the
S&P 500 index that expires in March. Repeating this trading pattern every month provides the
time-series of returns on buying an ATM call option. A similar procedure provides time-series of
returns on buying OTM call options.
10
We select the ATM option as the one whose present value
of strike price is closest to the current index value. We select the OTM call (put) option to be the
one with next higher (lower) strike price.
11
We denote ATM call (put) option on the S&P 500
Index by SPC
a
(SPP
a
) and OTM call (put) option by SPC
o
(SPP
o
). Using price data from The
Institute for Financial Markets, we compute monthly returns to these option-based risk factors.
Our approach has the flexibility to combine long and/or short positions in calls and/or puts with
differing strike prices without having to pre-specify whether it is a long or a short position, the
number of units of each option, and the strike price of each option. It is this flexibility that enables
our option-based risk factors to effectively capture the non-linear payoffs of hedge funds.
We report the summary statistics for the HFR indexes and our buy-and-hold and option-based
risk factors during January 1990 to June 2000 period in Panels A and B of Table 1. We also
provide the summary statistics of the CSFB/Tremont indexes during January 1994 to June 2000
period in Panel C of Table 1. We show the correlations between the different hedge fund indexes
and the risk factors in Table 2. As can be seen, all HFR indexes and three out of four
CSFB/Tremont indexes show significant correlation with the Russell 3000 index. A large number
of hedge fund indexes also show significant correlation with Fama-French’s Size factor. Mitchell
and Pulvino (2001) find that the risk arbitrage strategy shows zero correlation with the market
during up-market conditions but large positive correlation during down-market conditions. In order
to examine whether this is true for a wide range of hedge fund indexes, we use a regression
specification that allows for separate intercept and slope coefficients when the market index is

10
above and below its median return. We report our findings in Table 3. We find that a large number
of hedge fund indexes show no correlation in up-market conditions, but a positive correlation in
down-market conditions. This asymmetry of betas or factor loadings in up-market versus down-
market conditions confirms the nonlinear nature of hedge fund payoffs. It also suggests that the
extent of diversification benefits offered by hedge funds would be smaller during down-market
conditions.
3. Multi-factor Model and Results
As discussed in the introduction, we employ a two-step procedure to characterize the
systematic risk exposures of hedge funds. The first step involves identifying statistically significant
factors that ex-post capture in-sample variation in hedge fund returns. Towards that end, we
regress the net-of-fee monthly excess return (in excess of the risk free rate of interest) on a
hedge fund index on the excess return on buy-and-hold and option-based risk factors in a multi-
factor framework.
12
In particular, we estimate the following regression
1
K
i
i
i
i
t
k
kt
t
k
R
c
F
u
λ
=
= +
+
∑
(5)
where,
i
t
R
is the net-of-fees excess returns (in excess of risk free rate) on hedge fund index i during
month t,
i
c
is the intercept for hedge fund index i over the regression period,
i
k
λ
is the average
factor loading of hedge fund index i on
th
k
factor during the regression period,
kt
F
is the excess
return on
th
k
factor during month t, (k=1,.......,K) where the factor could be a buy-and-hold or an
option-based risk factor, and
i
t
u
is error term.
Given the lack of transparency and the large number of possible market and trading strategy

11
combinations the hedge funds can follow, it is a challenging task to identify the dominant risk
factors using limited data on their returns. This problem has been well recognized in the hedge
fund literature. Researchers have addressed this problem by using a stepwise regression
procedure either explicitly (Liang (1999), Fung and Hsieh (2000b)) or implicitly (Fung and Hsieh
(2001, Table 5)) while identifying significant risk factors. The stepwise regression involves adding
and/or deleting variables sequentially depending on the F-value. One of the benefits of this
procedure lies in its parsimonious selection of factors, while one of its shortcomings lies in the
breakdown of standard statistical inference. The latter is a potential concern; however, it should
only worsen the ability of the parsimoniously extracted factors to explain out-of-sample variation in
hedge fund returns. Given that we obtain within-the-sample results that are consistent with other
researchers and that we are able to replicate the out-of-sample performance of hedge funds, we
believe that the benefits of using stepwise regression procedure outweigh its limitations.
3.1 Common Risk Exposures of Hedge Funds belonging to the HFR indexes
We describe in Table 4 the factors that exhibit statistically significant relation in our step-wise
regression procedure when the dependent variable is the returns on HFR’s Event Driven, Event
Arbitrage, Restructuring, Relative Value Arbitrage, Convertible Arbitrage, Equity Hedge, Equity
Non-Hedge and Short Selling indexes.
13
3.1.1
Significant Risk Exposures of HFR Event Arbitrage Index
We find a non-linear risk-return tradeoff with the Event Arbitrage index showing significant
factor loading on risk factor corresponding to writing at OTM put option on S&P 500 index
(SPP
o
). This result is intuitive as Event Arbitrage strategy involves the risk of deal failure. A
larger fraction of deals fail when markets are down and the Event Arbitrage strategy incurs
losses. In contrast, when markets are up a larger proportion of deals go through and the strategy
makes profits. But the profits are unrelated to the extent by which the market goes up. Thus, the

12
payoff to Event Arbitrage strategy resembles that obtained by writing a naked put option on the
market.
Fama-French’s Size (SMB) factor shows significant relation suggesting that returns to Event
Arbitrage strategies resemble those achieved by going long small stocks and short large stocks.
This is intuitive as well, since the size of target firm is generally smaller than that of the acquiring
firm. Going long the target’s stock and short the acquirer’s stock naturally results in a long
exposure on Fama-French’s Size factor. Fama-French’s Value (HML) factor also shows
significant relation suggesting a tilt towards value stocks. This would happen if the hedge funds
were following Event Arbitrage strategy and the growth firms were trying to acquire value firms.
It is interesting to compare and contrast our analysis of the risks of Event Arbitrage strategy
with Mitchell and Pulvino’s (2001) findings of the risks of the same strategy. They select 4750
merger events from 1963 to 1998 and examine the risks in a stock merger (by going long target’s
stock and going short the acquirer’s stock) and those in a cash merger (by going long the target’s
stock). They find that the risk of Merger or Event Arbitrage strategy resembles that of writing a
naked put option on the market and having a long exposure to Fama-French’s Size (SMB) factor.
Interestingly, our multi-factor model also selects writing a put option on S&P 500 index and going
long Fama-French’s Size factor as dominant risk factors. These striking similarities suggest that
our approach is able to capture dominant risk exposures of hedge funds following Event Arbitrage
strategy.
3.1.2
Significant Risk Exposures of HFR Restructuring Index
Restructuring strategy involves investing in the securities of firms in financial distress (i.e.,
firms that have filed for Chapter 11 or are undergoing some form of reorganization). For this
strategy, similar to the Event Arbitrage index, we find a non-linear risk-return tradeoff. In
particular, it shows a significant factor loading on risk factor corresponding to writing at OTM put
option on S&P 500 index (SPP
o
). This result is intuitive as the probability of firms emerging from

13
financial distress is lower when the markets are down due to firms losing business during market
downturns. Thus, the payoff to this strategy resembles that obtained by writing a put option on the
market.
In addition, we find Fama-French’s Size (SMB) factor showing a significant relation with the
Restructuring index. This is not surprising because smaller firms are more likely to be in distress.
Further, we find that the Fama-French’s Value (HML) factor also shows a significant relation.
This is again consistent with the high book-to-market ratio firms being more likely to be in distress.
Typically, these securities are illiquid and infrequently traded. Our finding of a significant
factor loading on lagged Russell 3000 index and Lehman High Yield index is consistent with this
notion. Restructuring index also shows a significant factor loading on FRB Competitiveness-
Weighted Dollar index and MSCI Emerging Market index. This may be due to the managers
investing in distressed firms from emerging markets or those exposed to emerging markets.
3.1.3 Significant Risk Exposures of HFR Event Driven Index
Similar to the Event Arbitrage and Restructuring indexes, we find a non-linear risk-return
tradeoff in case of Event Driven index. This is manifested through a short position in an OTM put
option on S&P 500 index (SPP
o
). Event Driven strategy involves taking bets on events such as
mergers, takeovers and reorganizations. The risk in this strategy pertains to the non-realization of
such events. This is more likely to happen during market downturns. The short position in put
option is consistent with this economic interpretation.
We also find a positive loading on Fama-French’s Size (SMB) and Value (HML) factor,
Russell 3000 and lagged Russell 3000 indexes. As Event Driven strategy is similar to Event
Arbitrage and Restructuring strategies, we find the risk factors to be similar and existing for
similar reasons as mentioned before.
3.1.4
Significant Risk Exposures of HFR Relative Value Arbitrage Index

14
Relative Value Arbitrage strategy attempts to take advantage of relative pricing discrepancies
between instruments like equities, debt, and derivative securities. As in the previous cases, we find
that it also exhibits non-linear risk-return relation with the equity market index. The Relative
Value Arbitrage index payoff resembles that from a short position in an OTM put option on the
S&P 500 index (SPP
o
) suggesting that these strategies lose money during large down moves in
equity market. Carhart’s momentum factor also comes out significant with a negative factor
loading suggesting that Relative Value Arbitrage funds follow a “contrarian” strategy. This finding
is intuitive. Hedge funds employing such strategies follow securities with similar fundamental
value and, when their prices diverge, then they buy under-valued securities (losers) and sell the
over-valued securities (winners). This is opposite of what the momentum traders do, namely, buy
winners and sell losers. As before, we also find Fama-French’s Size (SMB) and Value (HML)
factors coming out significant. This finding is consistent with the results of Gatev et al. (1999),
who replicate returns of Pairs Trading strategy, which is one of the strategies followed by Relative
Value Arbitrage funds.
3.1.5
Significant Risk Exposures of HFR Convertible Arbitrage Index
Convertible Arbitrage strategy attempts to take advantage of relative pricing discrepancies
between the theoretical and market price of convertible bonds. If a convertible bond appears to be
undervalued, then the manager may purchase the bond and hedge out some of the risk
components such as equity risk, credit risk and interest rate risk. As in the previous cases, we find
that it also exhibits non-linear risk-return relation with the equity market index. The Convertible
Arbitrage index payoff resembles that from a short position in an ATM put option on the S&P 500
index (SPP
a
) suggesting that these strategies lose money during large down moves in equity
market. Lagged Russell index also comes out significant suggesting illiquid and infrequent trading
nature of the bonds. Similar to Restructuring and Event Driven Indexes, we find that Convertible
Arbitrage index also shows significant loading on Fama-French’s Size (SMB) index and MSCI

15
Emerging Market index.
3.1.6
Significant Risk Exposures of HFR Equity Hedge, Equity Non-Hedge
indexes
The HFR Equity Hedge index covers the original Long-Short strategy followed by Albert
Winslow Jones in 1949. HFR include funds that follow long-short strategies into Equity Hedge and
Equity Non-Hedge categories. Hedge funds that aim to have relatively low net long exposure are
included in HFR Equity Hedge index, while those with relatively high net long exposure are
included in HFR Equity Non-Hedge index. This is confirmed by their betas with respect to Russell
3000 index with Equity Hedge (Equity Non-Hedge) index showing a beta of 0.41 (0.75). Both the
indexes show long exposure to Fama-French’s Size (SMB) factor. This finding is intuitive, as one
would expect the small stock universe to be less researched and therefore one has higher
probability of finding mispriced stocks. A long exposure to SMB factor suggests that these
managers buy undervalued small stocks and offset the market risk by going short on the large
stocks. This can be achieved either through direct shorting of large stocks or through a short
position in futures contract such as S&P 500 index that consists of large stocks. Interestingly,
Equity Hedge index shows negative factor loading on Fama-French’s Value (HML) factor
suggesting that the managers were long growth stocks during our sample period. This is not
surprising as growth stocks outperformed value stocks during this period. Finally, Equity Hedge
index also shows some exposure to commodities while the Equity Non-Hedge index shows some
exposure to MSCI Emerging Markets.
3.1.7
Significant Risk Exposures of HFR Short Selling index
Short Selling strategy involves selling short overvalued securities with the hope of
repurchasing them at lower prices in the future. Therefore, one expects their factor loadings to be
opposite in sign to those for managers using long positions, such as Equity Hedge and Equity Non-

16
Hedge. Our findings of negative betas on the market (Russell 3000 index), Fama-French’s Size
(SMB) factors and positive beta on Fama-French’s Value (HML) factor are in line with this
expectation. Finally, Short Selling Index shows a payoff that resembles a short position in an OTM
call option on Russell 3000 index. This is again opposite to the short position in an OTM put option
that we find in the other strategie s, which are long the market. Negative beta on Russell 3000
index along with this short position in OTM call option suggests that Short Selling managers lose a
lot during extremely bullish equity markets.
3.1.8
Summary of Significant Risk Exposures of HFR Hedge Fund indexes
Overall, the evidence indicates that most hedge fund strategies exhibit non-linear risk-return
relation as manifested through significant betas on option-based risk factors. In particular, the
payoffs of Event Arbitrage, Restructuring, Event Driven, Relative Value Arbitrage and
Convertible Arbitrage strategies resemble that from writing a put option on the market index. This
may be because these strategies relate to economic activity and lose money during large down
moves in the equity market, or it may be because the managers, in order to improve their Sharpe
ratio or to respond to their incentive contract, create (either directly or indirectly through dynamic
trading) a payoff similar to that from writing a put option (see, e.g., Goetzmann et al. (2001), Lo
(2001) and Siegmann and Lucas (2002)). The risk exposures of Event Arbitrage and Relative
Value Arbitrage estimated using our approach are consistent with the findings of Mitchell and
Pulvino (2001) and Gatev et al (1999) who use detailed replication methodology to estimate the
risk of these strategies.
3.2 Robustness checks
Before proceeding further, we examine the robustness of our results in terms of the choice of
database used and the choice of alternative strike prices for the construction of option-based
factors.

17
3.2.1 Choice of database
HFR and CSFB/Tremont are two major hedge fund databases that have taken steps to
account for the different biases such as survivorship bias in hedge funds (Fung and Hsieh (2000a,
2002a)). One obvious question is how sensitive are the findings to the choice of database. To
answer this question, we repeat our analysis using CSFB/Tremont indexes. The choice of index
can potentially affect the results due to reasons such as extent of coverage, the method of index
construction (e.g. equal weighting by HFR vis-à-vis value weighting by CSFB/Tremont), etc. We
select four CSFB/Tremont strategies that are common with HFR, namely, Event Driven,
Convertible Arbitrage, Long/Short Equity (Equity Hedge in case of HFR) and Dedicated Short-
Bias (Short Selling in case of HFR). We report the results from regression in equation (10) in
Table 4.
Similar to HFR’s Event Driven Index, CSFB/Tremont’s Event Driven index shows
significant non-linearity. In particular, its payoff resembles that from writing an OTM put option on
S&P 500 index. It also shows positive loading on Fama-French’s Size (SMB) and MSCI
Emerging Market factors. For CSFB/Tremont’s Convertible Arbitrage strategy, we find
exposures to lagged Russell 3000 index and the Lehman High Yield index suggesting the illiquid
nature of the bonds and the credit risk involved in the strategy. For CSFB/Tremont’s Long/Short
Equity strategy, we find exposures that are very similar to those of HFR’s Equity Hedge and
Equity Non-Hedge indexes. In particular, we find long exposure on Russell 3000 index and Fama-
French’s Size (SMB) and a short exposure to Fama-French’s Value (HML) factor. As expected,
CSFB/Tremont’s Dedicated Short-Bias strategy shows negative loading on Russell 3000 index
and Fama-French’s Size (SMB) and a positive loading on and Fama-French’s Value (HML)
factor. These exposures are similar to those of HFR’s Short Selling index. Overall, both HFR and
CSFB/Tremont indexes exhibit similar risk exposures that are consistent with the types of trading
strategies the hedge fund claim to follow.

18
3.2.2 Choice of Option Strike Prices
As we find that a large number of hedge funds exhibit exposure similar to writing a put
option on the market, it suggests that they bear significant tail risk. Hence, we examine the
robustness of our results by capturing even higher tail risk by specifying option-based strategies
using deeper out-of-the-money options. In particular, we specify four different degrees of
moneyness ranging from half a standard deviation to two standard deviations, where the standard
deviation is computed using daily returns from the month immediately preceding the one for which
option returns are calculated. We observe that when one moves too far away from the at-the-
money options, the contracts become illiquid and the prices become less reliable. We exercise
caution by removing the outliers corresponding to the deeper out-of-the money options and find
results that are qualitatively similar.
The fact that the Size factor turns out to be significant for a number of hedge fund
strategies indicates that they invest in small stocks. It is possible that due to dynamic trading, the
risk-return relationship with respect to small stocks may be nonlinear; in which case, options on
S&P 500 Composite index may not be able to capture this effect. Therefore, we examine the
robustness of our findings using options on Russell 2000 index traded on the Chicago Mercantile
Exchange. Unfortunately, these contracts are highly illiquid and at times, we are unable to find
reasonable prices. However, for the period during which we observe reliable prices, we find
results similar to those obtained with options on the S&P 500 Composite index.
Finally, instead of using European-style options, we repeat our analysis with American-
style three-month-to-maturity options on S&P 500 futures contracts and, once again, find
qualitatively similar results. This suggests that our findings are robust to the inclusion of deeper
out-of-the money options, to the choice of a broader equity index and to the consideration of
American-style options.

19
This concludes our discussion of the in-sample analysis of risk exposures of hedge funds.
We now proceed to examine how well the in-sample risk exposures capture the out-of-sample
performance of hedge funds.
4. Out-of-Sample Analysis of Hedge fund Risk Exposures
If the risk exposures reported in Tables 4 and 5 are mere statistical artifacts of data, then
these are unlikely to track hedge fund returns in an out-of-sample analysis. However, if they
represent the true economic risks of different hedge fund strategies, then the replicating portfolios
based on these factor loadings should do a good job of mimicking the out-of-sample performance
of hedge funds. We examine this issue by constructing a replicating portfolio for each of the HFR
and CSFB/Tremont indexes using the factor loadings obtained from our multi-factor model. We
compute the difference between the monthly return on hedge fund index and that on the
respective replicating portfolio. We conduct standard t-test and Wilcoxon sign-test to examine if
the differences in the mean and median returns on the index and its respective replicating portfolio
are statistically significant. We report the results in Table 6. We find the mean and median
differences between the HFR and CSFB/Tremont indexes, and their replicating portfolios are
statistically insignificant using both the t-test and the Wilcoxon sign-test, the only exception being
CSFB/Tremont’s convertible arbitrage index.
In general, the difference in the mean returns between the hedge fund indexes and the
replicating portfolios from model is about 24 basis points for the HFR indexes and about 94 basis
points for the CSFB/Tremont indexes. Although this difference is not statistically significant in all
except one case, it is nevertheless economically significant. A part of this difference can be
attributed to survivorship and other biases (Fung and Hsieh (2000a, 2002a)). The rest may be a
compensation for bearing risks not captured by our model. Figure 1 graphically illustrates the

20
returns on HFR indexes and those on the replicating portfolios during July 2000 to December 2001
period. It shows that the portfolios based on significant risk exposures estimated through our
model closely track the hedge fund returns during out-of-sample period. This suggests that our
approach is able to capture the dominant economic risk exposures of hedge funds. Since investors
invest in individual hedge funds, we repeat the out-of-sample analysis with individual hedge fund
returns and report the findings in Appendix A.
A wide range of hedge fund strategies exhibiting nonlinear payoffs has important implications
for portfolio decisions involving hedge funds. We investigate this issue in the following section.
5. Portfolio Decisions with Hedge Funds
Our results from Section 3 show that the payoffs on a wide range of hedge fund indexes
resemble those from selling out-of-the-money put options on the market index. This suggests that
these hedge funds may be selling portfolio insurance, a strategy providing positive returns when
the market does not lose much and experiencing large losses in extreme down market conditions.
Hedge funds market themselves as absolute return vehicles, which aim to deliver positive returns
irrespective of the market conditions. Arguably, hedge fund investors care about absolute value of
losses (and not losses relative to a benchmark index). Therefore, a portfolio construction
framework involving hedge funds must explicitly account for large losses (i.e., the tail risk of
hedge funds) in down market conditions. Fung and Hsieh (1999b) argue that asset allocation
involving hedge funds should not be based on the mean-variance (M-V) framework as it is
appropriate only for normally distributed returns or for quadratic preferences of the investors.
They show that although the rankings based on the mean-variance criterion are approximately
correct, risk assessment and management based on such a criterion will not be correct as it does
not take into account the probability of large negative returns. Our results from Section 3 show

21
that hedge fund payoffs are nonlinear and asymmetric with significant negative tail risk.
Therefore, any portfolio constructed involving hedge funds needs to explicitly account for their tail
risk, an important issue that we address in this section of our paper.
The Basle Committee on Banking Supervision has recommended use of risk management
framework such as VaR to better understand and manage the downside risk. Hull (2000, page
342) reports a number of financial institutions, corporate treasurers and fund managers use VaR.
However, researchers such as Artzner et al (1999) have shown that VaR has problematic
properties (non-sub-additive, non-convex, non-differentiable etc.) and have proposed the use of
Conditional Value-at-Risk (CVaR) which equals the statistical mean of the losses exceeding the
VaR and which is closely related to Basak and Shapiro’s (2001) Limited Expected Loss measure.
While the VaR focuses only on the frequency of extreme events, CVaR focuses on both
frequency and size of losses in case of extreme events.
5.1 Theoretical Framework for VaR and CVaR
In this section, we define the concepts of VaR and CVaR by evaluating the risk beyond
the VaR using simple statistics. Let the return on a portfolio over a given period of time is denoted
by R. Let the probability density function (PDF) of R be denoted by f
R
and the cumulative
distribution function (CDF) denoted by F
R
. We denote the VaR of the portfolio for a probability
level p as VaR (F
R
, p) in order to indicate its dependence on the CDF and the specified probability
level. When expressed as a percentage of initial value of the portfolio and as a positive number,
the VaR of the portfolio can be expressed as
(
)
(
)
1
,
1
R
R
VaR F p
F
p
−
= −
−
(6)
The CVaR measures the expectation of the losses greater than or equal to the VaR and is
given by the ratio of the size of the losses beyond the VaR to the frequency of losses greater than
or equal to the VaR. It can be expressed as

22
(
)
( )
(
)
,
(
)
VaR
R
R
R
zf
z dz
CVaR F
p
E R R
VaR
F
VaR
−
−∞
= −
≤ −
= −
−
∫
(7)
Considering the various advantages of CVaR over VaR, we use CVaR as a risk
management tool to control the tail risk of a portfolio involving hedge funds. While optimizing, one
can either impose a distributional assumption on the security returns or use the empirical
distribution of security returns. Since CVaR focuses on the tail risk, considering parameterized
distributions may not be able to fully capture this risk due to their potentially poor tail properties.
Therefore, we use the empirical distribution of hedge fund returns for Mean-CVaR optimization.
14
5.2 Mean-Variance and Mean-CVaR optimization results
As the M-V framework implicitly assumes normality of asset returns, it is likely to
underestimate the tail risk for assets with negatively skewed payoffs. In this section, we test this
conjecture by using the M-CVaR framework theorized above. Specifically, we compare the tail
losses on M-V optimal portfolios with those on the M-CVaR optimal portfolios for different
confidence levels. In particular, we construct a M-V efficient frontier and a M-CVaR efficient
frontier using the eight HFR hedge fund strategies. We compute the CVaRs of the M-V efficient
portfolios of different volatilities and compare them with those of M-CVaR efficient portfolios
with volatilities. We also measure the differences in their mean returns, which indicate how much
of the return one has to give up for reducing the tail-risk.
Table 9 reports the CVaRs of M-V and M-CVaR efficient portfolios at 90%, 95% and
99% confidence levels. It also reports ratios of the CVaRs and differences in mean returns of the
two portfolios. As expected, CVaR increases with the portfolio volatility and confidence level (due
to going out further in the left tail at higher confidence level). The average ratio of CVaR of M-V
and M-CVaR portfolio ranges from 1.12 at 90% confidence level to 1.54 at 99% confidence level.
This suggests that tail risk is significantly underestimated using the M-V approach, the range of

23
underestimation being 12% to 54% for confidence level ranging from 90% to 99%. This is
economically significant number considering that if a hedge fund is managing $1 billion, if the
CVaR of M-CVaR efficient portfolio is 1% at 99% confidence level, the average loss can exceed
$10 million in 1 out of 100 cases while using a M-V approach the average loss can exceed $15.4
million at the same confidence level.
Figure 3 illustrates how the ratio of CVaR of M-V efficient portfolio to the CVaR of a M-
CVaR efficient portfolio of hedge funds varies with the portfolio volatility. As mentioned earlier, it
is clear from the figure that the ratio is higher for higher confidence level. However, the ratio
decreases with increasing portfolio volatility, suggesting that for efficient portfolios of high
volatility, the underestimation of loss due to use of M-V approach is less.
15
In general, the M-V
approach underestimates the loss compared to the M-CVaR approach, and this underestimation is
substantial for portfolios with low volatility. The differences in mean returns reported in Table 9,
which can be thought of as the price investors pay to reduce tail-risk, are consistent with this, they
are higher for portfolios with low volatility. For 90% and 95% confidence levels, the difference in
mean returns is up to 7 basis points while at 99% confidence level it is up to 17 basis points.
16
Having compared and contrasted the differences between efficient portfolios constructed
using M-V and M-CVaR approach, we now proceed with the examination of long-run risk return
tradeoffs of hedge funds.
6. Long-run Performance of Hedge funds
One of the limitations investors face while dealing with hedge funds is that the return history
of hedge fund indexes goes back at most to January 1990. One way to circumvent this limitation is
to work with the underlying risk factors for which longer return history is available. For example,
data on market, size, value and momentum factors is available from 1927. For the option-based

24
factors, although returns data is available only from 1982, it is possible to construct a theoretical
return series going back to 1927 using Black and Scholes’ (1973) formula.
17
This provides us with
the return history of key risk factors going back to 1927. In order to shed light on the long-run
performance, we regress the hedge fund index returns on market, size, value, momentum and
option-based risk factors and re-estimate the factor loadings. Using these factor loadings, we re-
compute the returns of the hedge fund index replicating portfolios from January 1927 to December
1989. We call these the long-run systematic returns of different hedge fund strategies. In order to
compare returns on a like to like basis, we also re-compute systematic returns to the indexes
during the recent period (January 1990 to June 2000) using the simplified model. We report the
summary statistics of these returns for the HFR indexes in Table 10.
We find interesting differences between the recent returns and long-run systematic returns.
For the HFR indexes, the mean long-run (recent) monthly return varies from 0.0 (0.15) percent
for Short Selling strategy to 0.97 (1.26) percent for Restructuring strategy. The corresponding
volatility ranges from 1.45 (0.88) percent for Event Arbitrage strategy to 6.27 (5.81) percent for
Short Selling strategy. The magnitude of long-run CVaRs at 90%, 95% and 99% levels across the
eight HFR indexes are higher on average by 100%, 60% and 40% respectively than the
corresponding recent period CVaRs. The findings with the CSFB/Tremont indexes are similar as
well (see Table 11). For the CSFB/Tremont indexes, the mean long-run (recent) monthly return
varies from -0.18 (-0.55) percent for Short Selling strategy to 0.83 (1.26) percent for Event Driven
strategy. The corresponding volatility ranges from 1.00 (0.68) percent for Convertible Arbitrage
strategy to 6.65 (4.88) percent for Short Selling strategy. The magnitude of long-run CVaRs at
90%, 95% and 99% levels are higher on average by 90%, 70% and 100% respectively than the
corresponding recent period CVaRs. Overall, across all the indexes, we find that the long-run
returns are smaller, the long-run volatilities are larger and the magnitude of long-run CVaRs are
larger compared to the recent period.

25
In order to examine whether the differences in the long-run returns and volatilities are
statistically significant from those in the recent period, we conduct the standard t-test (for the
means), Wilcoxon sign test (for the median) and variance ratio test (for standard deviations). We
report the findings in Table 12. For all the HFR indexes, we find that the mean long-run returns
are smaller than those for the recent period by about 23 basis points per month (or 2.76 percent
per annum) and this difference is statistically significant in three cases.
18
The long-run median
returns are also smaller than those during the recent period by about 25 basis points (or 3.00
percent per annum) and the difference is statistically significant for three indexes. The long-run
volatilities are also significantly larger than those in the recent period in seven out of eight cases.
The results for the CSFB/Tremont indexes are qualitatively similar. For all strategies except short-
selling, the long-run mean and median returns are smaller than those during the recent period, and
the difference is statistically significant in case of two indexes for mean returns and one index for
median returns. The long-run volatilities are also significantly larger than those in the recent period
in three out of the four cases.
19
Overall, these findings suggest that the performance of hedge
funds during the recent period appears significantly better compared with their long-run
performance.
7. Concluding Remarks
In this paper, we characterize the linear and non-linear risks of a wide range of hedge fund
strategies using buy-and-hold and option-based risk factors. For this purpose, we employ a two-
step approach. In the first step, we estimate the factor loadings of hedge funds using the returns
on standard asset classes and options on them as factors. We construct replicating portfolios that
best explain the in-sample variation in hedge fund index returns. In the second step, we examine

26
how well these replicating portfolios capture the out-of-sample performance of hedge funds. We
conduct the analysis both at the index level as well as at an individual level.
We have four main results. First, we find that it is important to allow for non-linear risk-return
relation while analyzing hedge funds. Along with the non-linear exposure to equity market index,
we find that hedge funds also exhibit significant risk exposures to Fama-French’s (1993) size and
value factors and Carhart’s (1997) momentum factor. Second, we observe that a wide range of
hedge fund strategies exhibit returns similar to those from writing a put option on the equity index.
The observed non-linearities across multiple strategies suggest that these events are not statistical
outliers, but represent important risks borne by hedge fund investors. Third, since hedge funds
exhibit significant left-tail risk, we compare and contrast the tail losses of portfolios constructed
using mean-variance framework and mean-conditional value-at-risk framework. We find that
using the traditional mean-variance framework, substantially underestimates the tail losses and this
underestimation is most severe for portfolios with low volatility. Finally, we compare and contrast
the long-run systematic returns of hedge funds with those observed during recent period. Almost
across all hedge fund indexes, we find that the long-run returns are lower, the long-run volatilities
are higher and the long-run tail losses are larger compared to those during the recent period.
Understanding the risk exposures of hedge funds is an important area of research. We need a
better understanding of this issue while making investment management decisions involving hedge
funds. Unfortunately, this is a tricky issue as hedge funds provide limited disclosure. In this
context, our approach provides useful information to investors dealing with portfolio construction
and risk management related issues. At a more general level, it indicates whether a fund has been
classified correctly or not and, when applied on an ongoing basis, it enables investors to address
issues like hedge fund style drift. Estimation of hedge fund risks is also important as a large
number of hedge funds propose risk-free rate as a benchmark for claiming incentive fees. This
would be appropriate only if they carried no systematic risks. However, we find that a large

27
majority of hedge funds carry significant amount of systematic risk. We believe our findings raise
important concerns relating to issues like benchmark design and manager compensation.
20
In
addition, our analysis provides a tool to measure the net and gross risk exposures of hedge funds.
This can help address regulators’ concern regarding the potential risk hedge funds can pose to
stability of financial markets.
Popular press classifies some hedge fund strategies as short-volatility strategies. The short
positions in put options that we find are consistent with this notion. If one can locate or construct
an instrument whose payoff is directly related to volatility of financial markets, then it would be
interesting to include it as an additional asset class factor. Similarly, it would also be interesting to
create proxies that capture returns from arbitrage opportunities. For example, one could use a
statistical arbitrage model and compute returns to arbitraging mispriced securities. Returns to such
strategies can also be used as additional factors in our model to capture some of the active (i.e.
non-systematic) risk of hedge funds. These issues are a part of our ongoing research agenda.
*****************

28
References
Agarwal, Vikas, and Narayan Y. Naik, 2000, “Multi-Period Performance Persistence Analysis of
Hedge Funds,” Journal of Financial and Quantitative Analysis, 35(3), 327-342.
Alexander, Gordon J., and Alexandre M. Baptista, 2002, “Conditional Expected Loss as a
Measure of Risk: Implications for Portfolio Selection,” Working Paper, University of Arizona.
Almazan, Andres, Keith C. Brown, Murray Carlson, and David A. Chapman, 2001, “Why
Constrain Your Mutual Fund Manager?,” Working Paper, University of Texas and University
of British Columbia .
Artzner, P., F. Delbaen, J. Eber, and D. Heath, 1999, “Coherent Measures of Risk,”
Mathematical Finance 9, 203-228.
Asness, Cliff, Robert Krail, and John Liew, 2001, “Do Hedge Funds Hedge?,” Journal of
Portfolio Management, 28(1), 6-19.
Bansal, Ravi, and S. Viswanathan, 1993, “No Arbitrage and Arbitrage Pricing,” Journal of
Finance, 48(4), 1231-1262.
Bansal, Ravi, D. A. Hsieh, and S. Viswanathan, 1993, “A New Approach to International
Arbitrage Pricing,” Journal of Finance, 48(5), 1719-1747.
Basak, S., and A. Shapiro, 2001, “Value-at-Risk Management: Optimal Policies and Asset
Prices,” Review of Financial Studies, 14(2), 371-405.
Black, Fisher, and Myron Scholes, 1973, “Pricing of Options and Corporate Liabilities,” Journal
of Political Economy, 81, 637-654.
Breeden, Douglas T., and Robert H. Litzenberger, 1978, “Prices of State-Contingent Claims
implicit in Option Prices,” Journal of Business, 51(4), 621-651.
Brown, Stephen J., William N. Goetzmann, and Roger G. Ibbotson, 1999, “Offshore hedge funds:
Survival & performance 1989-95,” Journal of Business, 72, 91-117.

29
Carhart, M., 1997, “On persistence in mutual fund performance,” Journal of Finance, 52, 57-82.
Dybvig, P. H., and J.E. Ingersoll, 1982, “Mean variance theory in complete markets,” Journal of
Business, 55, 233-251.
Dybvig, P. H., and S. A. Ross, 1985, “Differential Information and Performance Measurement
Using a Security Market Line,” Journal of Finance, 40 (2), 383-399.
Edwards, F.R., and J. Liew, 1999, “Hedge Funds and Managed Futures As Asset Classes,”
Journal of Derivatives, 45-64.
Fama, Eugene F., and Kenneth R. French, 1993, “Common risk factors in the returns on stocks
and bonds” Journal of Financial Economics, 33, 3-56.
Fung, W., and D. A. Hsieh, 1997, “Empirical characteristics of dynamic trading strategies: The
case of hedge funds,” Review of Financial Studies, 10, 275-302.
Fung, W., and D. A. Hsieh, 1999a, “A Primer on Hedge Funds,” Journal of Empirical Finance,
6, 309-331.
Fung, William, and D. A. Hsieh, 1999b, “Is Mean-Variance Analysis Applicable to Hedge
Funds?,” Economic Letters, 62, 53-58.
Fung, W., and D. A. Hsieh, 2000a, “Performance Characteristics of Hedge Funds and CTA
Funds: Natural Versus Spurious Biases,” Journal of Financial and Quantitative Analysis,
35(3), 291-307.
Fung, W., and D. A. Hsieh, 2000b, “Measuring the market impact of hedge funds,” Journal of
Empirical Finance, 7(1), 1-36.
Fung, W., and D. A. Hsieh, 2001, “The Risk in Hedge Fund Strategies: Theory and Evidence from
Trend Followers,” Review of Financial Studies, 14(2), 313-341.
Fung, W., and D. A. Hsieh, 2002a, “Hedge-Fund Benchmarks: Information Content and Biases,”
Financial Analysts Journal, 58(1), 22-34.

30
Fung, W., and D. A. Hsieh, 2002b, “Asset-Based Hedge-Fund Styles and Portfolio
Diversification,” Financial Analysts Journal, 58(5), 16-27.
Gatev, E.G., W.N. Goetzmann and K.G. Rouwenhorst, 1999, “Pairs Trading: performance of a
relative value arbitrage rule,” Working Paper, Yale School of Management.
Glosten, L.R., and R. Jagannathan, 1994, “A contingent claim approach to performance
evaluation,” Journal of Empirical Finance, 1(2), 133-160.
Goetzmann William, Jonathan Ingersoll, Matthew Spiegel and Ivo Welch, 2001, “Sharpening
Sharpe Ratios,” Working paper, Yale School of Management.
Harvey, Campbell, and Akhtar Siddique, 2000a, “Conditional Skewness in Asset Pricing Tests,”
Journal of Finance, 55, 1263-1295.
Harvey, Campbell, and Akhtar Siddique, 2000b, “Time-Varying Conditional Skewness and the
Market Risk Premium,” Research in Banking and Finance, 1, 27-60.
Hull, J.C., 2000, “Options, Futures & Other Derivatives,” Prentice-Hall, NJ.
Jagannathan, Ravi, and Robert Korajczyk, 1986, “Assessing the market timing performance of
managed portfolios,” Journal of Business, 59, 217-235.
Koski, Jennifer Lynch, and Jeffrey Pontiff, 1999, “How Are Derivatives Used? Evidence from the
Mutual Fund Industry,” Journal of Finance, 54(2), 791-816.
Kraus, Alan, and Robert Litzenberger, 1976, “Skewness preference and the valuation of risk
assets,” Journal of Finance, 31(4), 1085-1100.
Kyle, Albert S., and Wei Xiong, 2001, “Contagion as a Wealth Effect,” Journal of Finance, 56,
1401-1440.
Liang, Bing, 1999, “On the Performance of Hedge Funds,” Financial Analysts Journal, 55(4),
72-85.
Lintner, John, 1965, “Security Pric es, Risk, and Maximal Gains from Diversification,” Journal of
Finance, 20(4), 587-615.

31
Lo, Andrew W., 2001, “Risk Management for Hedge Funds: Introduction and Overview,”
Financial Analysts Journal, 57(6), 16-33.
Merton, R.C., 1981, “On Market Timing and Investment Performance I: An Equilibrium Theory of
Value for Market Forecasts,” Journal of Business, 54(3), 363-406.
Mitchell, M., and T. Pulvino, 2001, “Characteristics of Risk in Risk Arbitrage,” Journal of
Finance, 56(6), 2135-2175.
Palmquist, J., S. Uryasev and P. Krokhmal, 1999, “Portfolio Optimization with conditional Value-
at-Risk objective and constraint,” Research Report # 99-14, Dept. of Industrial and Systems
Engineering, University of Florida, Gainsville .
Rockafellar, R. T. and S. Uryasev, 2001, “Optimization of Conditional Value-at-Risk solution,”
The Journal of Risk, 2(3), 21-41.
Ross, Stephen A., 1976, “The Arbitrage Theory of Capital Asset Pricing,” Journal of Economic
Theory, 13, 341-360.
Rubinstein, Mark E., 1973, “The Fundamental Theorem of Parameter-Preference Security
Valuation,” Journal of Financial and Quantitative Analysis, 8 (1), 61-69.
Sharpe, William, 1964, “Capital Asset Prices: A Theory of Market Equilibrium under Conditions of
Risk,” Journal of Finance, 19(3), 425-442.
Siegmann, Arjen, and Andre Lucas, 2002, “Explaining Hedge Fund Investment Styles by Loss
Aversion: A Rational Alternative,” Working Paper, Vrije Univesiteit, Amsterdam, The
Netherlands.

32
Appendix A: Out-of-Sample Analysis with Individual Hedge Funds
Our analysis in Section 4 is at the hedge fund index level. Since investors invest in individual
hedge funds, we also examine how well our replicating portfolios are able to explain the out-of-
sample variation in individual hedge funds compared to the hedge fund indexes themselves.
Towards that end, we regress the returns of individual hedge funds belonging to the different
indexes on our replicating portfolios for those indexes during July 2000 to August 2001 period.
21
We report in Table 7 the distribution of adjusted R-squares obtained with our HFR and
CSFB/Tremont index replicating portfolios. In order to compare how well our index replicating
portfolios are able to explain the out-of-sample variation in individual hedge fund returns, we need
to know how well the hedge fund indexes to which they belong explain their returns in the first
place. For this purpose, we also regress the returns of individual hedge funds on the respective
HFR and CSFB/Tremont indexes. We report in Table 8 the distribution of adjusted R-squares of
these regressions. In Figure 2, we plot the histogram of adjusted R-squares from the regressions
using HFR and CSFB/Tremont replicating portfolios and indexes.
As can be seen from Table 7, our replicating portfolios exhibit mean (median) adjusted R-
squares ranging from 0.3% to 60.9% (-5.0% to 61.0%) for HFR and 23.8% to 67.9% (18.1% to
81.1%) for CSFB/Tremont funds. This range of mean and median adjusted R-squares is similar to
those obtained using the respective HFR and CSFB/Tremont hedge fund indexes. As shown in
Table 8, indexes exhibit mean (median) adjusted R-squares ranging from 16.1% to 68.6% (8.4%
to 66.4%) for HFR and 21.4% to 59.8% (11.2% to 75.4%) for CSFB/Tremont funds. Overall, the
replicating portfolios explain an average of 26.7% (median of 22.5%) variation in out-of-sample
returns of individual HFR funds and an average of 27.2% (median of 22.6%) variation in the out-
of-sample returns of individual CSFB/Tremont funds. The corresponding figures for the indexes
are mean (median) adjusted R-squares of 30.9% (27.4%) for HFR and 23.0% (13.8%) for
CSFB/Tremont. These figures are very much comparable to those we obtain using replicating

33
portfolios. In fact, for CSFB/Tremont, overall, our replicating portfolios do a slightly better job than
the indexes in explaining the variation in out-of-sample returns of individual funds. There can be
two reasons why our replicating portfolios better explain the out-of-sample variation in individual
CSFB/Tremont funds. First, CSFB/Tremont indexes are constructed using a subset of funds and
are weighted by assets under management. As a result, they give higher weight to larger funds. In
contrast, our analysis of individual funds includes all funds and the mean adjusted R-square is
based on an equally weighted average of all funds. Second, the composition of the CSFB/Tremont
indexes may change during the out-of-sample (i.e. post June 2000) period while the composition of
the index replicating portfolios remains the same. These two reasons may lead to the
CSFB/Tremont indexes explaining a smaller proportion of out-of-sample variation in individual
hedge funds.

34
Table 1: Summary Statistics
This table shows the means, standard deviations (SD), medians, skewness (Skew), kurtosis, minimum and maximum
of returns for eight HFR hedge fund indexes (Panel A), twelve buy-and-hold and four option-based risk factors
(Panel B) during Jan 90 to June 00 and four CSFB/Tremont hedge fund indexes (Panel C) during Jan 94 to June 00.
Panel A: HFR Hedge Fund Indexes
Hedge fund strategy
Mean
SD Median Skew Kurtosis Min. Max.
Non-Directional
Event Arbitrage
1.03
1.32
1.33
-3.24
17.18
-6.46 2.90
Restructuring
1.29
1.90
1.35
-0.81
8.88
-8.50 7.06
Event Driven
1.33
1.94
1.53
-1.62
9.42
-8.90 5.13
Relative Value Arbitrage
1.15
1.16
1.29
-1.26
13.31
-5.80 5.72
Convertible Arbitrage
0.95
1.01
1.16
-1.48
6.30
-3.19 3.33
Equity Hedge
1.82
2.65
1.82
0.10
4.57
-7.65 10.88
Directional
Equity Non-Hedge
1.71
4.06
2.28
-0.59
4.17
-13.34 10.74
Short Selling
0.07
6.40
-0.16
0.13
4.64
-21.21 22.84
Panel B: Risk Factors
Risk Factor
Mean
SD Median Skew Kurtosis Min. Max.
Buy-and-Hold Risk Factors
Equity
Russell 3000
1.39
3.94
1.69
-0.67
4.75
-15.32 11.22
MSCI World Excluding US
0.66
4.83
0.71
-0.18
3.49
-13.47 14.67
MSCI Emerging Markets
1.01
6.80
1.41
-0.64
5.49
-28.91 16.53
Fama-French SMB factor
-0.03
3.46
-0.08
0.54
6.15
-11.66 15.40
Fama-French HML factor
-0.31
4.16
-0.43
-1.14
9.73
-21.51 14.23
Momentum factor
0.94
4.18
1.17
-0.27
4.75
-11.47 13.77
Bond
SB Government and Corporate Bond
0.63
1.25
0.77
-0.06
3.25
-2.37
4.65
SB World Government Bond
0.63
1.81
0.75
0.16
3.39
-3.63
6.11
Lehman High Yield
-0.10
3.16
0.05
-4.16
35.60
-25.47 10.16
Default Spread
-0.09
1.65
-0.21
0.06
3.36
-5.50
3.67
Currency
FRB Competitiveness-Weighted Dollar 0.45
1.20
0.30
0.42
3.68
-2.78
3.96
Commodity
Goldman Sachs Commodity
0.65
5.04
0.79
0.54
4.36
-12.28 18.52
Option-based Risk Factors
S&P 500 At-the -Money Call
4.77
84.09 -17.01
0.76
2.80
-98.57 236.24
S&P 500 Out-of-the -Money Call
3.36
93.80 -23.69
1.04
3.53
-99.35 300.60
S&P 500 At-the -Money Put
-24.38 84.72 -57.04
2.20
8.77
-95.30 386.02
S&P 500 Out-of-the -Money Put
-27.30 91.49 -62.76
2.69
11.67
-95.80 422.34
Panel C: CSFB/Tremont Hedge Fund Indexes
Hedge fund strategy
Mean
SD Median Skew Kurtosis Min. Max.
Non-Directional
Event Driven
1.00
1.97
1.26
-3.59
24.01
-11.77 3.68
Convertible Arbitrage
0.83
1.50
1.15
-1.59
6.62
-4.68 3.57
Long/Short Equity
1.41
3.68
1.36
-0.04
5.16
-11.43 13.01
Directional
Dedicated Short-Bias
-0.26
5.26
-0.39
1.11
6.18
-8.69 22.71

35
Table 2: Correlation between the Hedge Fund Indexes and Asset Class Factors
This table shows the correlations between the eight HFR hedge fund indexes and the twelve buy-and-hold
risk factors during our sample period (Jan 90 to June 00). The table also shows the correlation between the
four CSFB/Tremont hedge fund indexes and the twelve risk factors during the entire sample period from Jan
94 and June 00. The buy-and-hold risk factors are Russell 3000 index (RUS), MSCI excluding the US index
(MXUS), MSCI Emerging Markets index (MEM), Fama-French Size and Book-to-Market factors (SMB &
HML), Momentum factor (MOM), Salomon Brothers Government and Corporate Bond index (SBG), Salomon
Brothers World Government Bond index (SBW), Lehman High Yield Composite index (LHY), Federal Reserve
Bank Competitiveness-Weighted Dollar index (FRBI), Goldman Sachs Commodity index (GSCI) and the
change in the default spread in basis points (DEFSPR). The abbreviations for different hedge fund strategies
are Event Arbitrage (EA), Restructuring (REST), Event Driven (ED), Relative Value Arbitrage (RVAL),
Convertible Arbitrage (CA), Equity Hedge or Long/Short Equity (EH), Equity Non-Hedge (ENH) and Short
Selling or Dedicated Short-Bias (SHORT). Correlations significant at the bonferroni-adjusted significance
level of 5% are shown in bold face.
HFR
CFSB/TREMONT
EA
REST
ED
RVAL
CA
EH
ENH SHORT ED
CA
EH SHORT
RUS
0.49
0.42
0.66
0.39
0.39
0.67
0.81
-0.71
0.61 0.18 0.68
-0.67
MXUS
0.29
0.29
0.43
0.30
0.27
0.45
0.52
-0.49
0.61 0.13 0.66
-0.64
MEM
0.36
0.54
0.58
0.41
0.39
0.54
0.63
-0.53
0.63 0.23 0.65
-0.61
SMB
0.29
0.48
0.49
0.38
0.30
0.56
0.57
-0.57
0.45 0.20 0.54
-0.49
HML
-0.13
-0.12
-0.29
-0.05
-0.16
-0.59 -0.57
0.68
-0.53 -0.06 -0.72
0.72
MOM
-0.04
-0.22
-0.03
-0.35
-0.18
0.16
0.07
-0.14
0.12 -0.14 0.28
-0.18
SBG
0.14
0.05
0.15
0.04
0.20
0.15
0.17
-0.11
0.05 0.12
0.13
-0.06
SBW
-0.03
-0.20
-0.10
-0.15
-0.05
0.00
0.01
-0.05
-0.11 -0.27 0.00
0.04
LHY
0.28
0.49
0.39
0.32
0.32
0.28
0.42
-0.30
0.48 0.45 0.46
-0.40
DEFSPR -0.18
-0.21
-0.26
-0.15
-0.25
-0.21 -0.26
0.18
-0.15 -0.17 -0.21
0.10
FRBI
0.01
0.19
0.06
-0.01
-0.12
-0.06 -0.05
0.10
-0.12 -0.01 -0.24
0.27
GSCI
-0.08
0.04
0.03
0.07
0.05
0.13
-0.05
0.03
0.18 0.12
0.19
-0.12

36
Table 3: Correlation between the Hedge Fund Indexes and Risk Factors during
different market conditions
This table shows the results of the following regressions for eight HFR and four CSFB/Tremont hedge fund
indexes during January 1990 to June 2000 for HFR and January 1994 to June 2000 for CSFB/Tremont:
0
0
1
i
i
i
i
i
i
t
t
t
t
R
RUS
D
D RUS
α
β
β
γ
ε
=
+
+
+
×
+
where
i
t
R
are the returns on hedge fund index i during month t,
0
i
α
are the intercepts for hedge fund index i,
0
i
β
are the slope coefficients on Russell 3000 index,
1
i
β
are the slope coefficients on the dummy variable
D
(
1
D
=
if return for Russell 3000 index is less than its median return and
0
D
=
if return for Russell 3000
index is equal to or more than the median return),
i
γ
are the slope coefficients on the interaction terms
t
D RUS
×
and
i
t
ε
are the error terms. Various hedge fund strategies are Event Arbitrage (EA),
Restructuring (REST), Event Driven (ED), Relative Value Arbitrage (RVAL), Convertible Arbitrage (CA),
Equity Hedge or Long/Short Equity (EH), Equity Non-Hedge (ENH) and Short Selling or Dedicated Short-
Bias (SHORT). Parameters significantly different from zero at the 5% level are shown in bold face.
HFR
CFSB/TREMONT
EA
REST
ED
RVAL
CA
EH
ENH SHORT ED
CA
EH SHORT
0
α
1.24
2.51
2.40
1.88
1.22
2.27
1.94
0.50
1.88 1.89 1.92
0.12
0
β
0.03
-0.18
-0.04
-0.10
0.00
0.21
0.51
-0.90
-0.02 -0.18 0.31
-0.76
1
β
0.01
-0.88
-1.08
-0.63
-0.28
-0.98 -1.04
1.10
-0.89 -1.07 -1.45
1.05
γ
0.31
0.67
0.58
0.35
0.16
0.32
0.52
-0.34
0.55 0.31
0.42
-0.46
Adj. R
2
33.45
34.93 55.15
26.53
17.17
45.33 67.16
49.75
51.48 4.10 48.84
65.89

37
Table 4: Results with HFR Equally-Weighted Indexes
This table shows the results of the regression
,
1
K
i
i
i
i
t
k
k t
t
k
R
c
F
u
λ
=
= +
+
∑
for the eight HFR indexes during the full sample period from January 1990 to June 2000
period. The table shows the intercept (C), statistically significant (at five percent level) slope coefficients on the various buy-and-hold and option-based risk factors
and adjusted R
2
(Adj-R
2
). The buy-and-hold risk factors are Russell 3000 index (RUS), lagged Russell 3000 index (LRUS)), MSCI excluding the US index (MXUS),
MSCI Emerging Markets index (MEM), Fama-French Size and Book-to-Market factors (SMB & HML), Momentum factor (MOM), Salomon Brothers Government and
Corporate Bond index (SBG), Salomon Brothers World Government Bond index (SBW), Lehman High Yield Composite index (LHY), Federal Reserve Bank
Competitiveness-Weighted Dollar index (FRBI), Goldman Sachs Commodity index (GSCI) and the change in the default spread in basis points (DEFSPR). The option-
based risk factors include the at-the-money and out-of-money call and put options on the S&P 500 Composite index (SPC
a/o
and SPP
a/o
). For the two call and put
option-based strategies, subscripts a and o refer to at-the-money and out-of-the-money respectively.
Event Arbitrage Restructuring
Event Driven
Relative Value
Arbitrage
Convertible
Arbitrage
Equity Hedge
Equity Non-
Hedge
Short Selling
Factors
λ
Factors
λ
Factors
λ
Factors
λ
Factors
λ
Factors
λ
Factors
λ
Factors
λ
C
0.04
C
0.43
C
0.20
C
0.38
C
0.24
C
0.99
C
0.56
C
-0.07
SPP
o
-0.92
SPP
o
-0.63
SPP
o
-0.94
SPP
o
-0.64
SPP
a
-0.27
RUS
0.41
RUS
0.75
SPC
o
-1.38
SMB
0.15
SMB
0.24
SMB
0.31
MOM
-0.08
LRUS
0.10
SMB
0.33
SMB
0.58
RUS
-0.69
HML
0.08
HML
0.12
HML
0.12
SMB
0.17
SMB
0.05
HML
-0.08
MEM
0.05
SMB
-0.77
LRUS
0.06
RUS
0.17
HML
0.08
MEM
0.03
GSCI
0.08
HML
0.40
LHY
0.13
MEM
0.06
MXUS
0.04
SBG
0.16
FRBI
0.27
MEM
0.09
Adj-R
2
44.04
Adj-R
2
65.57
Adj-R
2
73.38
Adj-R
2
52.17
Adj-R
2
40.51
Adj-R
2
72.53
Adj-R
2
91.63
Adj-R
2
82.02

38
Table 5: Results with CSFB/Tremont Value -Weighted Indexes
This table shows the results of the regression
,
1
K
i
i
i
i
t
k
k t
t
k
R
c
F
u
λ
=
= +
+
∑
for the four CSFB/Tremont indexes during the full sample period from January 1994 to
June 2000. The table shows the intercept (C), statistically significant (at five percent level) slope coefficients on the various buy-and-hold and option-based risk
factors and adjusted R
2
(Adj-R
2
). The buy-and-hold risk factors are Russell 3000 index (RUS), lagged Russell 3000 index (LRUS), MSCI excluding the US index
(MXUS), MSCI Emerging Markets index (MEM), Fama-French Size and Book-to-Market factors (SMB & HML), Momentum factor (MOM), Salomon Brothers
Government and Corporate Bond index (SBG), Salomon Brothers World Government Bond index (SBW), Lehman High Yield Composite index (LHY), Federal Reserve
Bank Competitiveness-Weighted Dollar index (FRBI), Goldman Sachs Commodity index (GSCI) and the change in the default spread in basis points (DEFSPR). The
option-based risk factors include the at-the-money and out-of-money call and put options on the S&P 500 Composite index (SPC
a/o
and SPP
a/o
). For the two call and
put option-based strategies, subscripts a and o refer to at-the-money and out-of-the-money respectively.
Event Driven
Convertible
Arbitrage
Long/Short
Equity
Short Selling
Factors
λ
Factors
λ
Factors
λ
Factors
λ
C
0.59
C
0.59
C
0.26
C
0.40
SPP
o
-0.66
LRUS
0.09
HML
-0.25
RUS
-1.03
SMB
0.08
SBW
-0.20
RUS
0.53
SMB
-0.42
MEM
0.08
LHY
0.41
SMB
0.31
DEFSPR -0.32
LHY
0.50
MOM
0.22
SBG
-0.94
HML
0.19
DEFSPR
-0.46
Adj-R
2
73.55
Adj-R
2
33.35
Adj-R
2
83.50
Adj-R
2
84.97

39
Table 6: T-test and Wilcoxon sign test results for difference in mean and median
returns of HFR and CSFB/Tremont Hedge Fund Indexes and their Replicating
Portfolios during the out-of-sample period (July 2000 to Dec 2001)
This table shows the results of two -sided heteroskedastic t-test and Wilcoxon sign test for difference in the mean
and median returns of eight HFR and four CSFB/Tremont indexes and those of their corresponding replicating
portfolios using our model (i.e. using both buy-and-hold and option-based risk factors) during the out-of-sample
period from July 2000 to Dec 2001.
∆
r is mean (median) return of the index minus that of its replicating portfolio for
the t-test and Wilcoxon sign test respectively. # indicates
∆
r is significantly different from zero at 5% level.
HFR
CSFB/Tremont
Hedge Fund Strategy
t-test Sign test t-test Sign test
∆
r
-0.082
0.050
Event Arbitrage
p-value
0.935
1.000
∆
r
-0.215
0.023
Restructuring
p-value
0.831
0.815
∆
r
0.246
0.840
1.216
1.010
Event Driven
p-value
0.808
1.000
0.238
0.096
∆
r
-0.066
0.494
Relative Value Arbitrage
p-value
0.948
1.000
∆
r
1.988
0.516
2.265
#
1.132
#
Convertible Arbitrage
p-value
0.115
0.238
0.033
0.031
∆
r
0.186
-0.161
0.450
0.377
Equity Hedge (Long/Short
Equity)
p-value
0.854
0.481
0.657
0.481
∆
r
-0.220
-0.516
Equity Non-Hedge
p-value
0.827
0.815
∆
r
0.035
-0.469
-0.168
-1.918
Short Selling (Dedicated
Short-Bias)
p-value
0.973
0.815
0.868
0.815

40
Table 7: Out-of-sample Regression re sults with Individual Hedge Funds using
Replicating Portfolios
The following table shows the distribution of the adjusted-R
2
(in terms of the number of funds falling in
different ranges of R
2
values, mean and median R
2
values) from the following out-of-the-sample regressions:
,
,
i
i
i
i
j t
j t
t
R
RP
e
α
β
= +
+
where
,
i
j t
R
= net-of-fees excess return (in excess of the risk-free rate of interest) on an individual hedge fund i
belonging to hedge fund strategy j during month t, and
,
j t
RP
= excess return on the replicating portfolio to
strategy j during month t. We consider individual hedge funds following eight different strategies (Event
Arbitrage (EA), Restructuring (REST), Event Driven (ED), Relative Value Arbitrage (RVAL), Convertible
Arbitrage (CA), Equity Hedge (EH), Equity Non-Hedge (ENH) and Short Selling (SS)) from HFR database on
the excess returns of the HFR hedge fund index replicating portfolios during July 2000-Aug 2001 period and
individual hedge funds following four different strategies (Event Driven (ED), Convertible Arbitrage (CA),
Long/Short Equity (L-S E) and Dedicated Short-Bias (DSB)) from TASS+ database on the CSFB/Tremont
hedge fund index replicating portfolios during Jul 2000-Aug 2001 period.
HFR
TASS+
Number of funds
Number of funds
Range
of R
2
EA REST
ED
RVAL
CA
EH
ENH
SS
ED
CA
L-S E DSB
Less than -20%
0
0
1
0
0
0
0
0
0
0
1
0
-20 - -10%
5
0
3
0
1
8
1
0
7
5
30
0
-10 – 0%
7
6
48
7
29
99
9
0
12
5
34
1
0 - 10%
5
3
14
0
10
28
3
0
11
2
30
0
10 - 20%
1
4
11
2
8
29
4
1
9
6
23
0
20 - 30%
3
3
8
0
5
39
4
1
5
2
17
0
30 - 40%
0
1
7
1
0
37
7
1
9
0
21
0
40 - 50%
0
1
13
1
2
35
2
0
6
3
27
0
50 - 60%
0
0
12
0
2
40
7
2
6
2
17
0
60 - 70%
0
0
2
1
1
44
7
4
4
3
13
1
70 - 80%
0
1
2
0
0
35
7
4
3
3
20
1
80 - 90%
0
0
1
0
0
21
5
2
2
1
14
1
90 - 100%
0
0
0
0
0
1
2
0
0
0
2
2
Mean
0.3
13.9
15.4
9.6
6.0
32.1
41.7
60.9 23.8
24.8
27.5
67.9
Median
-5.0
11.0
5.6
-5.8
-2.8
31.8
43.1
61.0 19.2
18.1
24.1
81.1

41
Table 8: Out-of-sample Regression results with Individual Hedge Funds using Indexes
The following table shows the distribution of the adjusted-R
2
(in terms of the number of funds falling in
different ranges of R
2
values, mean and median R
2
values) from the following out-of-the-sample regressions:
,
,
i
i
i
i
j t
j t
t
R
I
e
α
β
=
+
+
where
,
i
j t
R
= net-of-fees excess return (in excess of the risk-free rate of interest) on an individual hedge fund i
belonging to hedge fund strategy j during month t, and
,
j t
I
= excess return on the index for strategy j
during month t. We consider individual hedge funds following eight different strategies (Event Driven (ED),
Relative Value Arbitrage (RVA), Equity Hedge (EH), Equity Non-Hedge (ENH), Short Selling (SS), Event
Arbitrage (EA) and Restructuring (REST)) from HFR database on the excess returns of the HFR hedge fund
index replicating portfolios during Jul00-Aug01 period and individual hedge funds following four different
strategies (Event Driven (ED), Convertible Arbitrage (CA), Long/Short Equity (L-S E) and Dedicated Short-
Bias (DSB)) from TASS+ database on the CSFB/Tremont hedge fund index replicating portfolios during
Jul00-Aug01 period.
HFR
TASS+
Number of funds
Number of funds
Range
of R
2
EA
REST
ED
RVAL
CA
EH
ENH
SS
ED
CA
L-S E DSB
Less than -20%
0
0
0
0
0
0
0
0
0
0
1
0
-20 - -10%
0
0
4
0
1
9
1
0
10
3
43
0
-10 – 0%
2
5
39
4
7
77
10
0
11
5
48
0
0 - 10%
3
2
18
2
6
52
1
0
12
3
31
1
10 - 20%
6
3
11
2
10
30
5
1
4
3
20
0
20 - 30%
1
3
12
1
4
36
4
0
6
2
17
0
30 - 40%
3
4
7
1
5
23
4
1
9
5
14
1
40 - 50%
1
0
15
1
3
47
7
0
6
1
14
0
50 - 60%
1
1
6
0
6
45
5
3
8
1
14
0
60 - 70%
1
1
8
0
9
43
5
3
6
3
19
0
70 - 80%
0
0
1
1
4
41
6
1
0
5
17
2
80 - 90%
2
0
1
0
3
12
9
3
1
1
10
1
90 - 100%
1
0
0
0
0
1
1
3
1
0
1
1
Mean
31.0
18.9
17.9
16.1
35.0
32.2
41.8
68.6 22.1
31.1
21.4
59.8
Median
18.9
17.8
9.5
8.4
30.9
32.3
45.1
66.4 17.7
28.9
11.2
75.4

42
Table 9: Conditional Value -at-Risk for Mean-Variance and Mean-Conditional Value -at-Risk Efficient Portfolios
This table shows the conditional Value-at-Risk (CVaR) figures (reported as the magnitude of losses) at different confidence levels for Mean Variance (M-V) and
Mean-CVaR (M-CVaR) efficient portfolios constructed using monthly returns of the eight HFR hedge fund strategies from January 1990 to June 2000. s indicates the
volatility of portfolio returns and Ratio is the ratio of CVaR of M-V efficient portfolio to that of M-CVaR efficient portfolio for the same portfolio volatility. ?m is the
difference in the mean returns (in basis points) of the M-CVaR and M-V efficient portfolios for the same portfolio volatility, s.
90%
95%
99%
s
CVaR
(M-V)
CVaR
(M-CVaR)
Ratio
? m
CVaR
(M-V)
CVaR
(M-CVaR)
Ratio
? m
CVaR
(M-V)
CVaR
(M-CVaR)
Ratio
? m
0.73
0.42
0.33
1.25
-7.04
0.88
0.51
1.75
-7.24
2.41
0.88
2.73
-17.15
0.74
0.35
0.29
1.23
-5.51
0.85
0.51
1.67
-5.73
2.52
0.97
2.60
-14.73
0.76
0.33
0.27
1.22
-4.10
0.82
0.53
1.55
-4.30
2.63
1.07
2.45
-12.47
0.80
0.33
0.27
1.21
-2.65
0.81
0.55
1.48
-2.90
2.74
1.29
2.12
-10.85
0.85
0.33
0.28
1.17
-1.30
0.84
0.60
1.40
-1.55
2.84
1.49
1.91
-9.26
0.92
0.36
0.31
1.15
-1.16
0.90
0.69
1.30
-1.36
2.88
1.70
1.70
-7.72
1.00
0.43
0.38
1.14
-1.04
0.97
0.77
1.25
-1.14
2.86
1.90
1.50
-6.40
1.10
0.51
0.45
1.12
-0.93
1.05
0.88
1.20
-0.96
2.83
2.10
1.35
-5.10
1.21
0.61
0.55
1.11
-0.81
1.20
1.04
1.15
-0.85
2.83
2.36
1.20
-4.90
1.33
0.75
0.68
1.10
-0.68
1.39
1.25
1.11
-0.72
2.86
2.51
1.14
-2.30
1.47
0.91
0.84
1.08
-0.54
1.59
1.48
1.08
-0.58
3.18
2.94
1.08
-1.34
1.61
1.11
1.05
1.06
-0.40
1.87
1.76
1.06
-0.44
3.54
3.31
1.07
-1.01
1.78
1.38
1.31
1.05
-0.26
2.16
2.04
1.06
-0.30
4.31
4.07
1.06
-0.74
1.97
1.68
1.59
1.05
-0.14
2.49
2.35
1.06
-0.21
5.09
4.85
1.05
-0.51
2.17
1.98
1.89
1.05
-0.08
2.88
2.73
1.06
-0.12
5.86
5.58
1.05
-0.23
2.37
2.30
2.20
1.04
-0.03
3.28
3.12
1.05
-0.08
6.64
6.38
1.04
-0.12
2.59
2.61
2.51
1.04
-0.01
3.67
3.51
1.05
-0.04
7.41
7.13
1.04
-0.07
AVG.
1.12
1.25
1.54

43
Table 10: Summary Statistics of Systematic Returns of HFR Hedge Fund Indexes
This table shows the mean returns, standard deviations (SD), medians, minimum realizations, maximum
realizations and Conditional Value-at-Risk (reported as the magnitude of losses) at 90%, 95% and 99%
confidence levels for the systematic returns of eight HFR hedge fund indexes during our sample period from
January 1990 to June 2000 (Panel A) and before our sample period from January 1927 to December 1989
(Panel B).
Panel A: Recent Returns – January 1990 to June 2000
Hedge fund strategy
Mean
SD Median Min. Max. CVaR
(90%)
CVaR
(95%)
CVaR
(99%)
Non-Directional
Event Arbitrage
1.00
0.88
1.18
-3.31 2.40
1.00
1.86
3.31
Restructuring
1.26
1.49
1.53
-5.30 4.88
1.83
3.10
5.30
Event Driven
1.08
1.61
1.50
-6.66 4.40
2.25
3.54
6.66
Relative Value Arbitrage
0.82
0.89
0.94
-3.22 3.03
0.91
1.62
3.22
Convertible Arbitrage
0.83
0.65
0.91
-1.90 1.99
0.46
0.95
1.90
Equity Hedge
0.81
2.24
0.89
-8.54 7.82
3.16
4.46
8.54
Directional
Equity Non-Hedge
1.17
3.90
1.61
-16.11 10.08
6.22
8.37
16.11
Short Selling
0.15
5.81
0.10
-18.54 20.95
9.95
12.78
18.54
Panel B: Long-run returns – January 1927 to December 1989
Hedge fund strategy
Mean
SD Median Min. Max. CVaR
(90%)
CVaR
(95%)
CVaR
(99%)
Non-Directional
Event Arbitrage
0.72
1.45
0.95
-7.76
7.81
2.45
3.47
5.71
Restructuring
0.97
2.40
1.25
-11.11 18.78
3.99
5.56
8.53
Event Driven
0.85
2.64
1.16
-11.73 19.94
4.38
5.96
9.18
Relative Value Arbitrage
0.61
1.46
0.70
-6.37 10.16
2.23
3.12
5.12
Convertible Arbitrage
0.57
0.97
0.66
-3.97
6.57
1.41
1.97
3.05
Equity Hedge
0.60
2.69
0.66
-11.70 19.32
4.26
5.71
9.30
Directional
Equity Non-Hedge
0.96
5.53
1.20
-23.43 39.87
8.95
11.77
18.82
Short Selling
0.00
6.27
0.05
-39.72 26.94 11.08
14.76
25.94

44
Table 11: Summary Statistics of Systematic Returns of CSFB/Tremont Hedge Fund
Indexes
This table shows the mean returns, standard deviations (SD), medians, minimum realizations, maximum
realizations and Conditional Value-at-Risk (reported as the magnitude of losses) at 90%, 95% and 99%
confidence levels for the systematic returns of four CSFB/Tremont hedge fund indexes during the sample
period (January 1994 to June 2000) (Panel A) and before the sample period from January 1927 to December
1993 (Panel B).
Panel A: Recent Returns – January 1994 to June 2000
Hedge fund strategy
Mean
SD Median Min. Max. CVaR
(90%)
CVaR
(95%)
CVaR
(99%)
Non-Directional
Event Driven
1.26
1.56
1.56
-6.29 4.16
1.85
2.98
6.29
Convertible Arbitrage
0.91
0.68
1.04
-1.57 1.84
0.49
0.97
1.57
Long/Short Equity
1.16
3.38
1.01
-11.61 10.86
5.05
7.00
11.61
Directional
Dedicated Short-Bias
-0.55
4.88
-0.83
-9.73 21.60
7.28
8.26
9.73
Panel B: Long-run returns – January 1927 to December 1993
Hedge fund strategy
Mean
SD Median Min. Max. CVaR
(90%)
CVaR
(95%)
CVaR
(99%)
Non-Directional
Event Driven
0.83
2.27
1.17
-10.83 15.60
3.92
5.44
8.65
Convertible Arbitrage
0.59
1.00
0.70
-4.31
5.50
1.45
2.13
3.36
Long/Short Equity
0.62
3.23
0.77
-15.35 18.52
5.38
7.12
12.02
Directional
Dedicated Short-Bias
-0.18
6.65
-0.41
-55.01 29.85 11.64
16.08
33.86

45
Table 12: T-test, Wilcoxon sign test and Variance Ratio test results for difference in
mean, median and standard deviation of systematic returns of HFR and
CSFB/Tremont Hedge Fund Indexes
This table shows the results of two -sided heteroskedastic t -test, Wilcoxon sign test and Variance Ratio (VR) test for
difference in the mean, median and standard deviation of systematic returns of eight HFR and four CSFB/Tremont
indexes during the pre-sample period (Jan 27 to Dec 89 for HFR and Jan 27 to Dec 93 for CSFB/Tremont) and those
during the sample period (Jan 90 to Jun 00 for HFR and Jan 94 to Jun 00 for CSFB/Tremont).
∆
is the difference in the
mean (t-test), median (sign test) and standard deviation (VR test) of the systematic returns during the pre -sample
and sample period. # indicates that the difference
∆
is significantly different from zero at 10% level.
HFR
CSFB/Tremont
Hedge Fund Strategy
t-test Sign test VR test
t-test Sign test VR test
∆
-0.278
#
-0.231
#
0.559
#
Event Arbitrage
p-value
0.004
0.000
0.000
∆
-0.288
-0.274
0.904
#
Restructuring
p-value
0.071
0.247
0.000
∆
-0.229
-0.342
1.029
#
-0.433
#
-0.397
0.714
#
Event Driven
p-value
0.186
0.247
0.000
0.028
0.428
0.000
∆
-0.211
#
-0.243
#
0.578
#
Relative Value Arbitrage
p-value
0.026
0.002
0.000
∆
-0.252
#
-0.242
#
0.322
#
-0.318
#
-0.339
#
0.321
#
Convertible Arbitrage
p-value
0.000
0.001
0.000
0.000
0.004
0.000
∆
-0.210
-0.237
0.448
#
-0.538
-0.235
-0.152
Equity Hedge (Long/Short
Equity)
p-value
0.347
0.789
0.008
0.162
0.428
0.588
∆
-0.207
-0.409
1.636
#
Equity Non-Hedge
p-value
0.607
0.789
0.000
∆
-0.146
-0.043
0.457
0.374
0.421
1.779
#
Short Selling (Dedicated
Short-Bias)
p-value
0.808
0.247
0.269
0.534
0.428
0.000
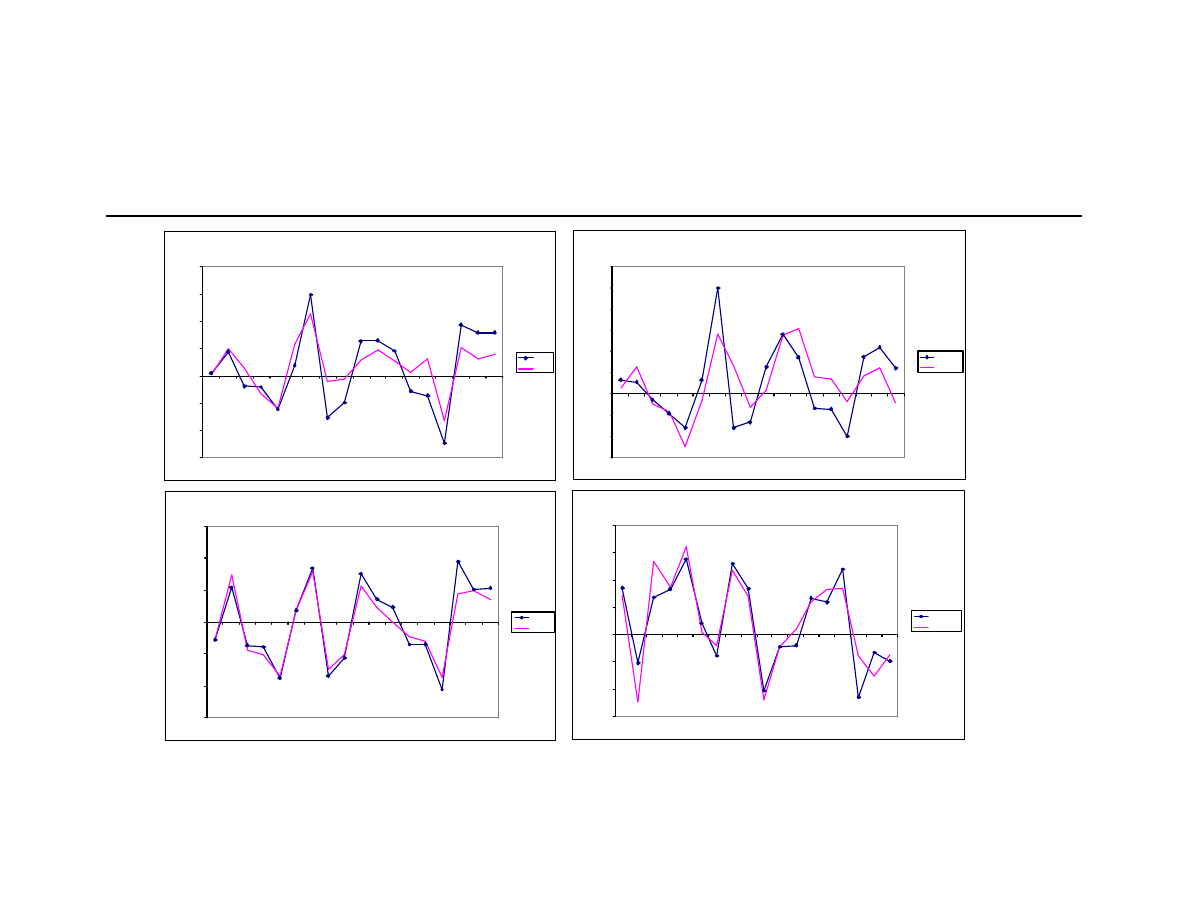
46
Figure 1: Out-of-Sample Results for HFR strategies
This figure plots the returns for the replicating portfolios and the actual HFR index returns during the out-of-sample period from July 2000 to December 2001.
EDRP, RESTRP, HLBRP and SHORTRP are the replicating portfolios for HFR’s Event Driven (ED), Restructuring (REST), Equity Non-Hedge (ENH) and Short
Selling (SHORT) hedge fund strategies constructed using buy-and-hold and option-based risk factors estimated during our sample period from January 1990 to
June 2000.
HFR Event Driven Index
-6.00
-4.00
-2.00
0.00
2.00
4.00
6.00
8.00
Jul-
0 0
Aug-
00
Sep-
00
Oct-
00
Nov-
00
Dec-
00
Jan-
01
Feb-
01
Mar-
01
Apr-
01
M
ay-
01
Jun-
01
Jul-
01
Aug-
0 1
Sep-
0 1
Oct-
01
Nov-
01
Dec-
01
Month
Return
EDRP
ED
HFR Equity Non-Hedge Index
-15.00
-10.00
-5.00
0.00
5.00
10.00
15.00
Jul-
00
Aug-
00
Sep-
00
Oct-
00
Nov-
00
Dec-
00
Jan-
01
Feb-
01
Mar-
01
Apr-
01
M
a y -
01
Jun-
01
Jul-
01
Aug-
01
Sep-
01
Oct-
01
Nov-
01
Dec-
01
Month
Return
ENHRP
ENH
HFR Short Selling Index
-15.00
-10.00
-5.00
0.00
5.00
10.00
15.00
20.00
Jul-
00
A
ug-
00
S
ep-
0 0
Oct-
00
Nov-
00
D
ec-
0 0
Jan-
01
Feb-
01
Mar-
01
Apr-
01
M
ay-
01
Jun-
0 1
Jul-
01
A
ug-
01
S
ep-
01
Oct-
01
Nov-
01
D
e c -
01
Month
Return
SHORTRP
SHORT
HFR Restructuring Index
-3.00
-2.00
-1.00
0.00
1.00
2.00
3.00
4.00
5.00
6.00
Jul-
0 0
Aug-
0 0
Sep-
0 0
Oct-
00
Nov-
0 0
Dec-
00
Jan-
01
Feb-
01
Mar-
01
Apr-
01
M
ay-
01
Jun-
01
Jul-
01
Aug-
01
Sep-
01
Oct-
01
Nov-
01
Dec-
01
Month
Return
RESTRP
REST
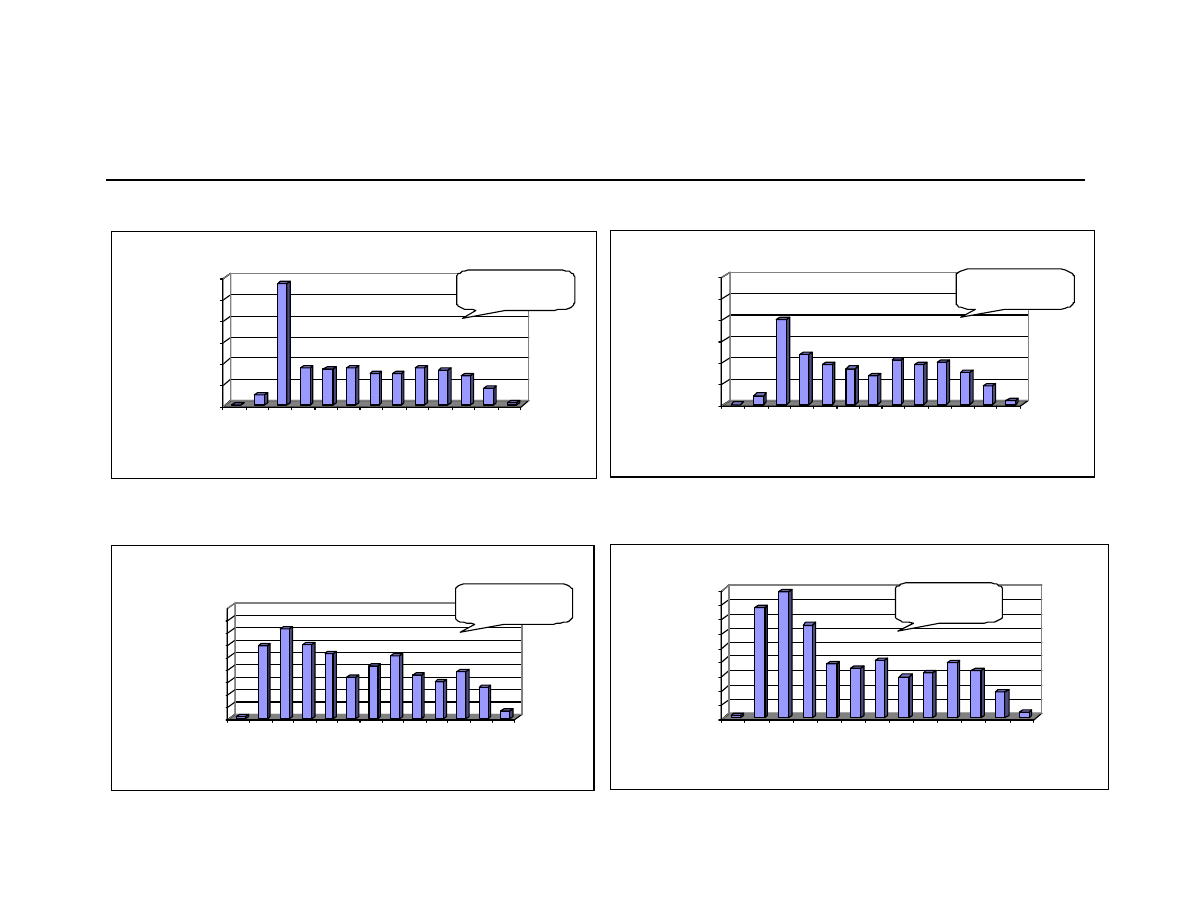
47
Figure 2: Distribution of Out-of-Sample R-Squares for Individual HFR and CSFB/Tremont Hedge Funds
The following figures show the distribution of out-of-sample R-squares from regressions of the excess returns on individual hedge funds in HFR and
CSFB/Tremont databases on the excess returns of their corresponding index replicating portfolios and on the excess returns of their corresponding indexes.
Panel A: Results for individual HFR hedge funds
Panel B: Results for individual CSFB/Tremont hedge funds
0%
5%
10%
15%
20%
25%
30%
Percentage of funds
Less
than -
20%
-10-
0%
10-
20%
30-
40%
50-
60%
70-
80%
90-
100%
Range of R-squares
HFR: Out-of-sample R-squares using Indexes
Mean R
2
= 30.87%
Median R
2
=27.44%
0%
5%
10%
15%
20%
25%
30%
Percentage of funds
Less
than -
20%
-10-
0%
10-
20%
30-
40%
50-
60%
70-
80%
90-
100%
Range of R-squares
HFR: Out-of-sample R-squares using Replicating Portfolios
Mean R
2
= 26.71%
Median R
2
=22.50%
0%
2%
4%
6%
8%
10%
12%
14%
16%
18%
Percentage of funds
Less
than -
20%
-10-
0%
10-
20%
30-
40%
50-
60%
70-
80%
90-
100%
Range of R-squares
CSFB/Tremont: Out-of-sample R-squares using Indexes
Mean R
2
= 23.01%
Median R
2
= 13.76%
0%
2%
4%
6%
8%
10%
12%
14%
16%
18%
Percentage of funds
Less
than -
20%
-10-
0%
10-
20%
30-
40%
50-
60%
70-
80%
90-
100%
Range of R-squares
CSFB/Tremont: Out-of-sample R-squares using Replicating
Portfolios
Mean R
2
= 27.17%
Median R
2
=22.64%
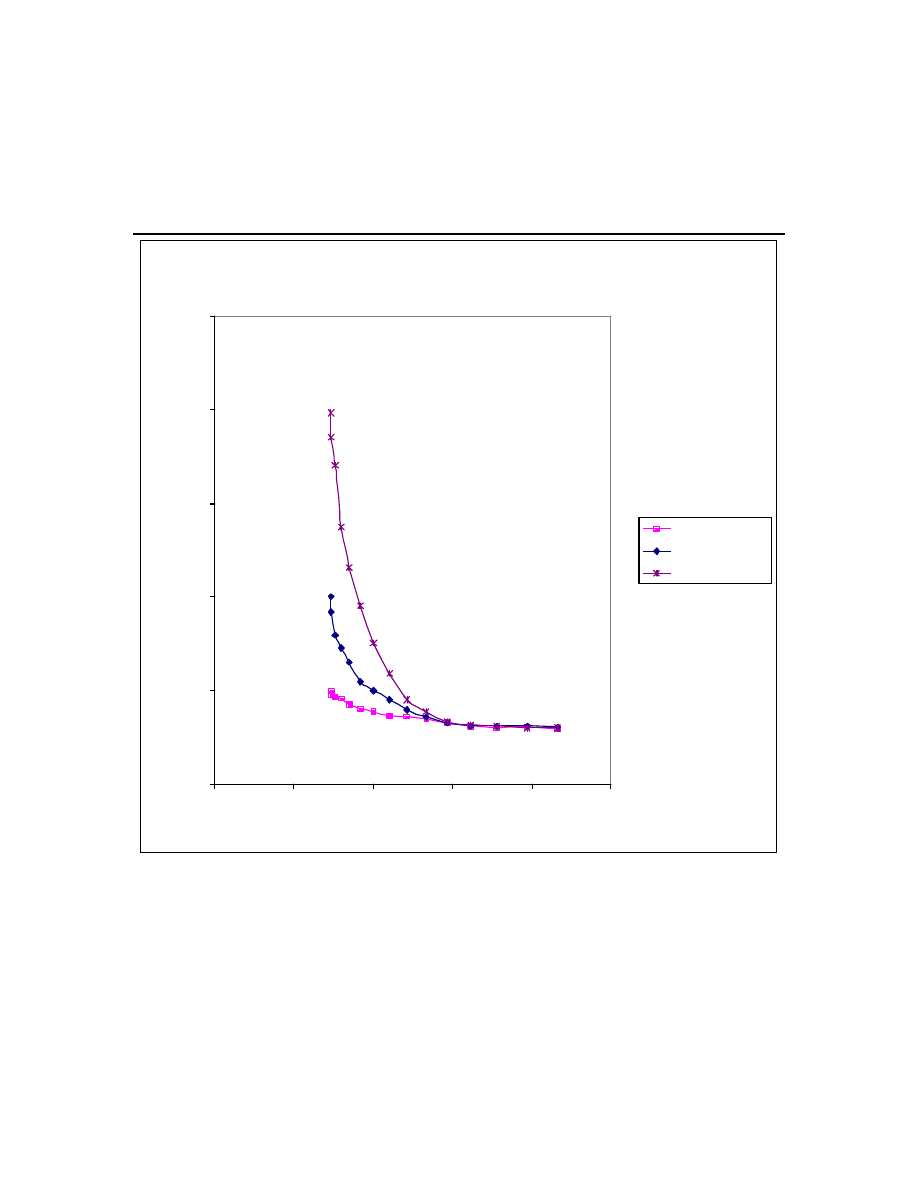
48
Figure 3: Ratio of Conditional Value -at-Risk for Mean-Variance and Mean-
Conditional Value -at-Risk Efficient Portfolios
This figure plots the ratio of the Conditional Value-at-Risk (CVaR) for Mean-Variance and Mean-CVaR
efficient portfolios at different confidence levels for different levels of portfolio volatility. The efficient
portfolios are constructed using monthly returns of eight HFR hedge fund strategies during our sample
period from January 1990 to June 2000.
Ratio of CVaR(MV) and CVaR(M-CVaR)
0.75
1.25
1.75
2.25
2.75
3.25
0.00
0.50
1.00
1.50
2.00
2.50
Sigma
Ratio of CVaRs
Ratio at 90.0%
Ratio at 95.0%
Ratio at 99.0%

49
1
For example, consider the investment strategies of large endowments like Harvard and Yale, or large
pension funds like CALPERS and Ontario Teachers. We know from Fung and Hsieh (1997, 2001) that mutual
funds predominantly employ relatively static trading strategies while hedge funds and CTAs employ
relatively dynamic trading strategies. Although they trade in similar asset classes as mutual funds, they
show relatively low correlation with long-only type strategies.
2
Although, in principle, investors can create exposure like hedge funds by trading on their own account, in
practice they encounter many frictions due to incompleteness of markets like the publicly traded derivatives
market and the financing market. Although derivatives market for standardized contracts has grown a great
deal in recent years, it is still very costly for an investor to create a customized payoff on individual
securities. The same is true of the financing market as well where investors encounter difficulties shorting
securities and obtaining leverage. These frictions make it difficult for investors to create hedge-fund-like
payoffs by trading on their own accounts.
3
CVaR corresponds to the statistical mean of losses exceeding the VaR. While the VaR focuses only on the
frequency of extreme events, CVaR focuses on both frequency and size of losses in case of extreme events.
4
This is in the spirit of asset-based style factors proposed by Fung and Hsieh (2002b).
5
Hedge funds provide an ideal testing ground for the application of Glosten and Jagannathan’s (1994)
approach due to several reasons, some of which do not arise in case of mutual funds analyzed by them. This
is because, unlike most mutual funds (see Koski and Pontiff (1999) and Almazan et al (2001)), hedge funds
frequently trade in derivatives. Second, hedge funds are known for their ‘opportunistic’ nature of trading
and a significant part of their returns arise from taking state-contingent bets.
6
However, it is important to note that specifying the marginal rate of substitution to be quadratic in market
return, as in equation (1), is different from it being related to the payoffs on put and call options on the
market.
7
The HFR indexes are equally-weighted and therefore give relatively more weight to the performance of
smaller hedge funds while the CSFB/Tremont indexes are value-weighted (i.e. weighted by assets under
management) and hence give relatively more weight to the performance of larger hedge funds. See

50
www.hfr.com
and
www.hedgeindex.com
for the index construction details.
8
We thank the referee for suggesting this approach.
9
The use of lagged Russell 3000 index accounts for the effect of non-synchronous trading and is suggested
by Asness, Krail and Liew (2001).
10
We do not consider in -the-money (ITM) options as their payoffs can be replicated by a combination of
underlying asset and risk-free asset along with an OTM option. For example, the maturity payoff on an ITM
call option can be replicated by a long position in the underlying asset, a long position in the risk-free asset
and a long position in an OTM put with the same strike price.
11
Options are available in strike-price increments of five index points. On average, the ratio of index price to
present value of strike price for our at-the-money options is 1.00 while that for our out-of-the-money call
(put) options is 0.99 (1.01). We discuss the robustness of our results to specifying higher degrees of out-of-
the-moneyness in Section 3.2.
12
As returns on option-based strategies have a larger order of magnitude compared to the buy-and-hold
strategies, we scale them by a factor of hundred and use the scaled returns in our multi-factor model.
13
We specify a five percent significance level for including an additional variable in our stepwise regression
procedure. Tables 4 and 5 report the significant factors and the adjusted R-squares. We determine the
significance using heteroskedasticity and autocorrelation consistent standard errors.
14
We follow Palmquist et al (1999) and Alexander and Baptista (2002) to construct the Mean-CVaR frontier.
It turns out to be a linear programming problem which we solve using MATLAB’s linprog function. For
more details of formulating the mean-CVaR optimization problem as a linear programming problem see
Rockafellar and Uryasev (2000) and links provided at www.ise.ufl.edu/uryasev.
15
This result seems to be consistent with Alexander and Baptista (2002) who find that the mean-variance
efficient portfolios with smaller standard deviations may not be efficient in the mean-conditional expected
loss (CEL) space. As mentioned earlier, their CEL measure is equivalent to our CVaR measure.
16
There are two ways in which investors can buy insurance to reduce the left-tail risk. One involves buying
deep out-of-the- money put options on the equity market, while the other involves including trend following
strategies in a portfolio of hedge funds. In case of a downturn in equity markets, the put option will deliver

51
positive returns. However, the writer of the put option will have to short the equities in order to dynamically
hedge the exposure, which can further drive down the equity prices. This is not the case with trend
followers who deliver positive returns when equity markets are down but do so by trading in markets other
than equity, like currencies and interest rate markets (see Fung and Hsieh (2001))
17
We use historical volatility (based on five-year rolling window) to compute the option prices. For the first
five years, we use average volatility during the five-year period. We compute returns based on theoretical
prices for 1927-1982 and based on market prices for the remaining period.
18
Even in cases where the difference is not statistically significant, a figure ranging from 2.5% to 3.00% per
annum is economically significant.
19
In order to make the HFR results comparable with those from CSFB/Tremont, we divide the HFR sample
period (Jan 90 - June 00) into two sub-periods, Jan 90 - Dec 93 and Jan 94 - June 00, for the second sub-
period to coincide with that of CSFB/Tremont. We find that the difference in the mean and median returns
over the long-run and those during the second sub-period to be 20 and 21 basis points, figures comparable
to the 23 and 25 basis points we find using Jan 90 - Jun 00 period. Also, the magnitude of CVaRs during the
second sub-period compared to that during the long-run are 100%, 70% and 40% lower, figures comparable
to 100%, 60% and 40%, we find using the Jan 90 - Jun 00 period.
20
Previous researchers including Brown et al (1999) and Agarwal and Naik (2000) examining persistence in
hedge fund managers’ performance have used peer group average as a benchmark to adjust for systematic
risk. It would be interesting to examine persistence in performance after adjusting for systematic risk using
our model.
21
We only consider those individual hedge funds that have at least 6 monthly returns during July 2000 to
June 2001 period. For the CSFB/Tremont database, individual funds following “Long/Short Equity” strategy
are classified under “Long/Short Equity Hedge” category.
Wyszukiwarka
Podobne podstrony:
Case Book LBS London Business School 2006
Marketer s Toolkit (07) The Right Customers Acquisition, Retention, and Development(Harvard Busine
(Ebook Hbr) Harvard Business School Game Theory
Marketer s Toolkit (09) Pricing It Right Strategies, Applications, And Pitfalls(Harvard Business S
The Business School and the Bottom Line
Phase of the Business Cycle and Portfolio Management good
The Wharton School Of Business Efficiency, Profitability And Quality Of Banking Services
Harvard Business School Press Marketing Essentials
116286 PET for Schools Reading and Writing Overviewid 13000
ebook Martial Arts The History and Philosophy of Wing Chun Kung Fu
business group affiliiation and firm performance in a transition economy a focus on ownership voids
HTTPS Traffic Analysis Risks and Defenses
więcej podobnych podstron