
S
IZE AND
M
EASUREMENT OF THE
I
NFORMAL
E
CONOMY IN
110
C
OUNTRIES
AROUND THE
W
ORLD
*
Friedrich Schneider**
July 2002
Abstract:
Estimates of the size of the informal economy in 110 developing, transition and OECD
countries are presented. The average size of the informal economy, as a percent of official
GNI in the year 2000, in developing countries is 41%, in transition countries 38% and in
OECD countries 18%. A large burden of taxation and social security contributions
combined with government regula tions are the main determinants of the size of the
informal economy.
JEL-class.:
O17, O5, D78, H2, H26.
* The paper was presented at an Workshop of Australian National Tax Centre, ANU, Canberra, Australia,
July 17, 2002. Financing from the Doing Business project of the World Bank is gratefully acknowledged.
**) Professor of Economics, Department of Economics, Johannes Kepler University of Linz, A -4040 Linz -
Auhof, Austria.
Phone: 0043-732-2468-8210, Fax: 0043-732-2468-8209.
E-mail:
friedrich.schneider@jku.at
, http://www.economics.uni-linz.ac.at.

2
Introduction
As crime and other underground economic activities (including informal economic ones) are a
fact of life around the world, most societies attempt to control these activities through various
measures like punishment, prosecution, economic growth or education. Gathering statistics
about who is engaged in underground (or crime) activities, the frequencies with which these
activities are occurring and the magnitude of them, is crucial for making effective and
efficient decisions regarding the allocations of a country’s resources in this area.
Unfortunately, it is very difficult to get accurate information about these underground (or as a
subset informal economy) activities on the goods and labor market, because all individuals
engaged in these activities wish not to be identified. Hence, the estimation of the informal
economy activities can be considered as a scientific passion for know ing the unknown.
Although quite a large literature
1)
on single aspects of the hidden economy exists a
comprehensive survey has just been written by Schneider (the author of this paper) and Enste
concentrating on the size of the informal economy in terms of value added. Moreover, the
subject is still quite controversial
2)
and there are disagreements about the definition of
informal economy activities, the estimation procedures and the use of their estimates in
economic analysis and policy aspects.
3)
Nevertheless around the world, there are strong
indications for an increase of the informal economy and little is known about the size of the
informal economies in transition, development and developed countries for the year 2000.
The size, the causes and the consequences are different for different types of countries, but
there are some comparisons that can be made and that might be interesting for social
scientists, the public in general, and helpful for politicians, who need to deal with this
phenomenon sooner or later. These attempts of measurement are obviously very difficult,
since the informal economy activities are performed exactly to avoid official registration.
Moreover, if you ask an academician, a public sector specialist, a policy or economy analyst,
or a politician, what the informal economy is all about, or even how big it is, you will get a
wide range of answers.
1
)
The literature about the „informal“, „underground“, „informal“, „second“, “cash-“ or „parallel“, economy is
increasing. Various topics, on how to measure it, its causes, its effect on the official economy are analyzed. See
for example, survey type publications by Frey and Pommerehne (1984); Thomas (1992); Loayza (1996); Pozo
(1996); Lippert and Walker (1997); Schneider (1994a, 1994b, 1997, 1998a); Johnson, Kaufmann, and Shleifer
(1997), and Johnson, Kaufmann and Zoido-Lobatón (1998a); and for an overall survey of the global evidence of
its size in terms of value added Schneider and Enste (2000).
2)
Compare e.g. in the Economic Journal, vol. 109, no. 456, June 1999 the feature “controversy: on the hidden
economy”.

3
The scientific fascination of the underground economy has inspired me to tackle this difficult
question and undertake the challenging task of collecting all available data on the informal
economy for 110 countries, and finally provide some insights about the main causes of the
informal economy and its effect on the official economy. In section 2 an attempt is made to
define the informal economy. Section 3 presents the empirical results of the size of the
informal economy over 110 countries all over the world. Section 4 examines the main causes
of the informal economy. In section 5 the various methods to estimate the size of the informal
economy are shortly presented, and in section 6 a summary is given and some conclusions are
drawn.
1 Definition of the Informal Economy: An Attempt
Most authors trying to measure the informal economy face the difficulty of how to define it.
One commonly used working definition is: all currently unregistered economic activities
which contribute to the officially calculated (or observed) Gross National Product.
4)
Smith
(1994, p. 18) defines it as „market-based production of goods and services, whether legal or
illegal that escapes detection in the official estimates of GDP.“ As these definitions still leave
open a lot of questions, table 1 may be helpful for developing a better feeling for what could
be a reasonable consensus definition of the legal and illegal underground or informal
economy.
From table 1 it becomes clear that the informal economy includes unreported income from the
production of legal goods and services, either from monetary or barter transactions - hence all
economic activities which would gene rally be taxable were they reported to the state (tax)
authorities. In general, a precise definition seems quite difficult, if not impossible as „the
informal economy develops all the time according to the 'principle of running water': it adjusts
to change s in taxes, to sanctions from the tax authorities and to general moral attitudes, etc.“
(Mogensen, et. al. 1995 p. 5). This paper does not focus on tax evasion or tax compliance,
because it would get to long, and moreover tax evasion is a different subject, where already a
lot of research has been underway.
5)
3)
Compare the different opinions of Tanzi (1999), Thomas (1999) and Giles (1999).
4)
This definition is used for example, by Feige (1989, 1994), Schneider (1994a), Frey and Pommerehne (1984),
and Lubell (1991).
5)
Compare, e.g. the recent survey of Andreoni, Erard and Feinstein (1998).

4
Table 1: A Taxonomy of Types of Underground Economic Activities
1)
Type of Activity
Monetary Transactions
Non Monetary Transactions
Illegal
Activ ities
Trade with stolen goods; drug dealing
and manufacturing; prostitution;
gambling; smuggling and fraud
Barter of drugs, stolen goods,
smuggling etc. Produce or growing
drugs for own use. Theft for own
use.
Tax Evasion
Tax
Avoidance
Tax Evasion
Tax Avoidance
Legal
Activ ities
Unreported income
from self-
employment; Wages,
salaries and assets
from unreported work
related to legal
services and goods
Employee
discounts,
fringe benefits
Barter of legal
services and
goods
All do-it-yourself
work and
neig hbor help
1)
Structure of the table is taken from Lippert and Walker (1997, p. 5) with additional remarks.
2 The Size of Informal Economies around the World
For single countries and sometimes for a group of countries (like the OECD or transition
countries) research has been undertaken to estimate the size of the informal economy using
various methods and different time periods. In tables 2 to 8, an attempt is made to undertake a
consistent comparison of estimates of the size of the informal economies of various countries,
for a fixed period, generated by using similar methods which will be discussed in chapter 6,
by reporting the results for the informal economy for 110 countries all over the world for the
periods 1999/2000.
6)
2.1 Developing Countries
The physical input (electricity) method, the currency demand and the model (DYMIMIC)
approach are used for the developing countries. The results are grouped from Africa, Asia,
South America. They are shown in tables 2, 3, 4 and figures 1, 2, 3.
The results for 22 South African countries are shown in table 2 and figure 1.
6)
One should be aware that such country comparisons give only a very rough picture of the ranking of the size of
the informal economy over the countries, because each method has shortcomings, which are discussed in chapter
6. See, e.g., Thomas (1992, 1999) and Tanzi (1999). A least in this comparison the same time period
(1999/2000) is used for all countries. If possible, the values were calculated as averages over the period
1999/2000, respectively.

5
Table 2 – Figure 1
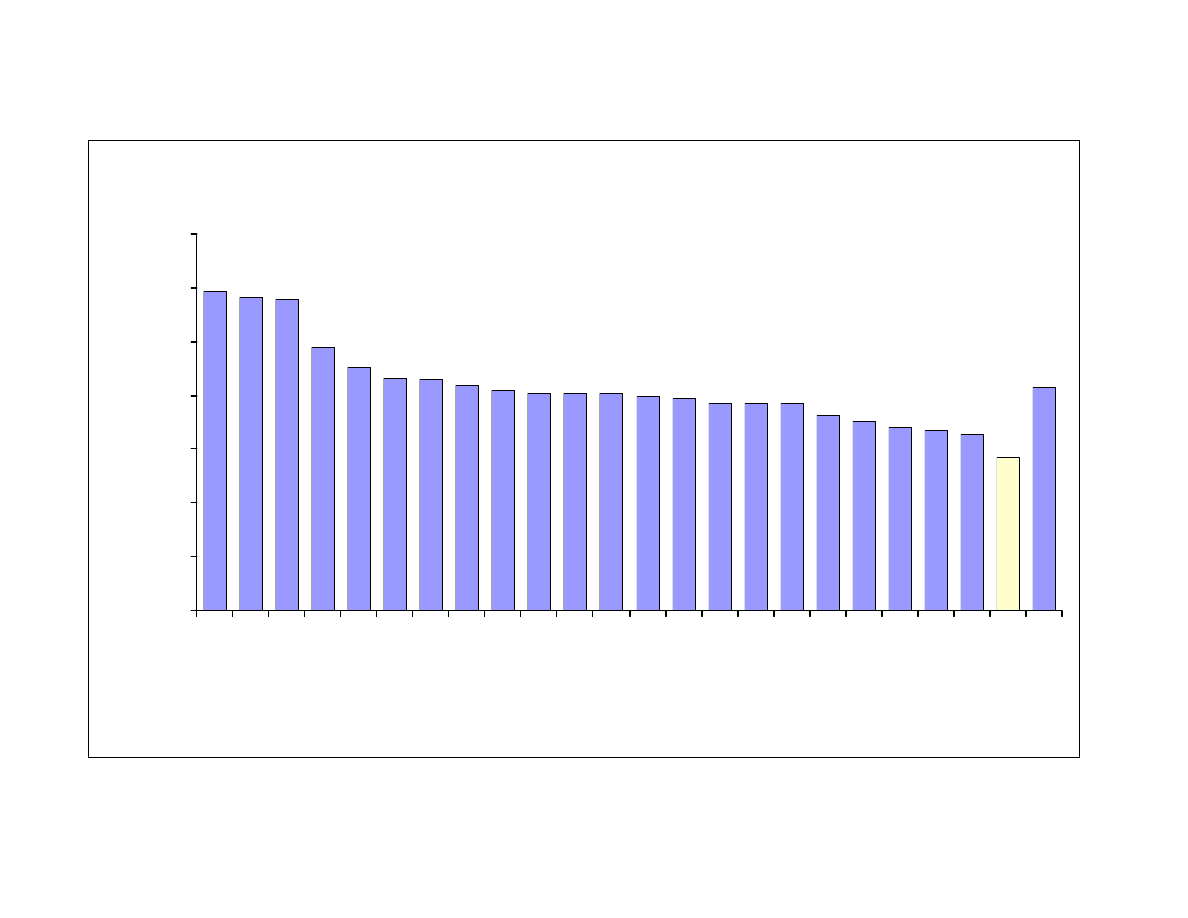
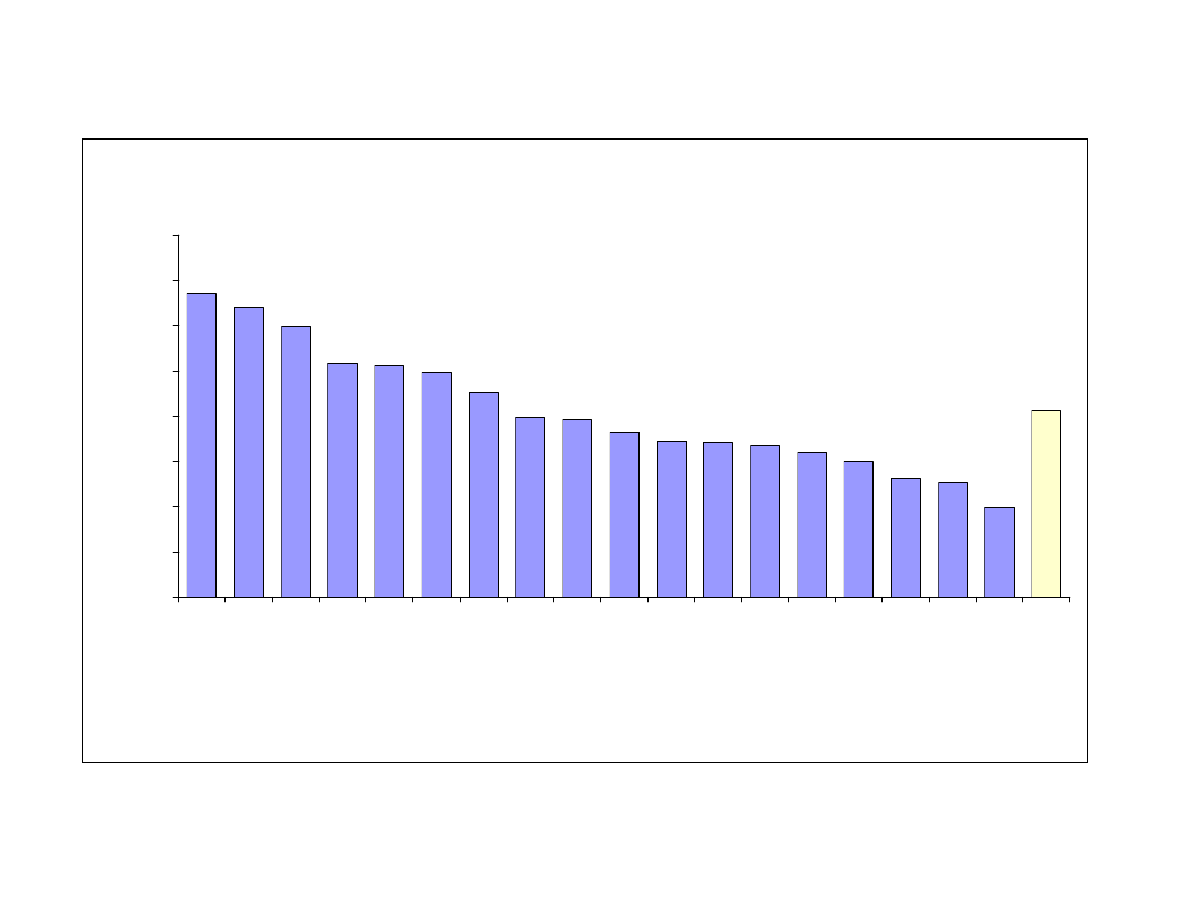
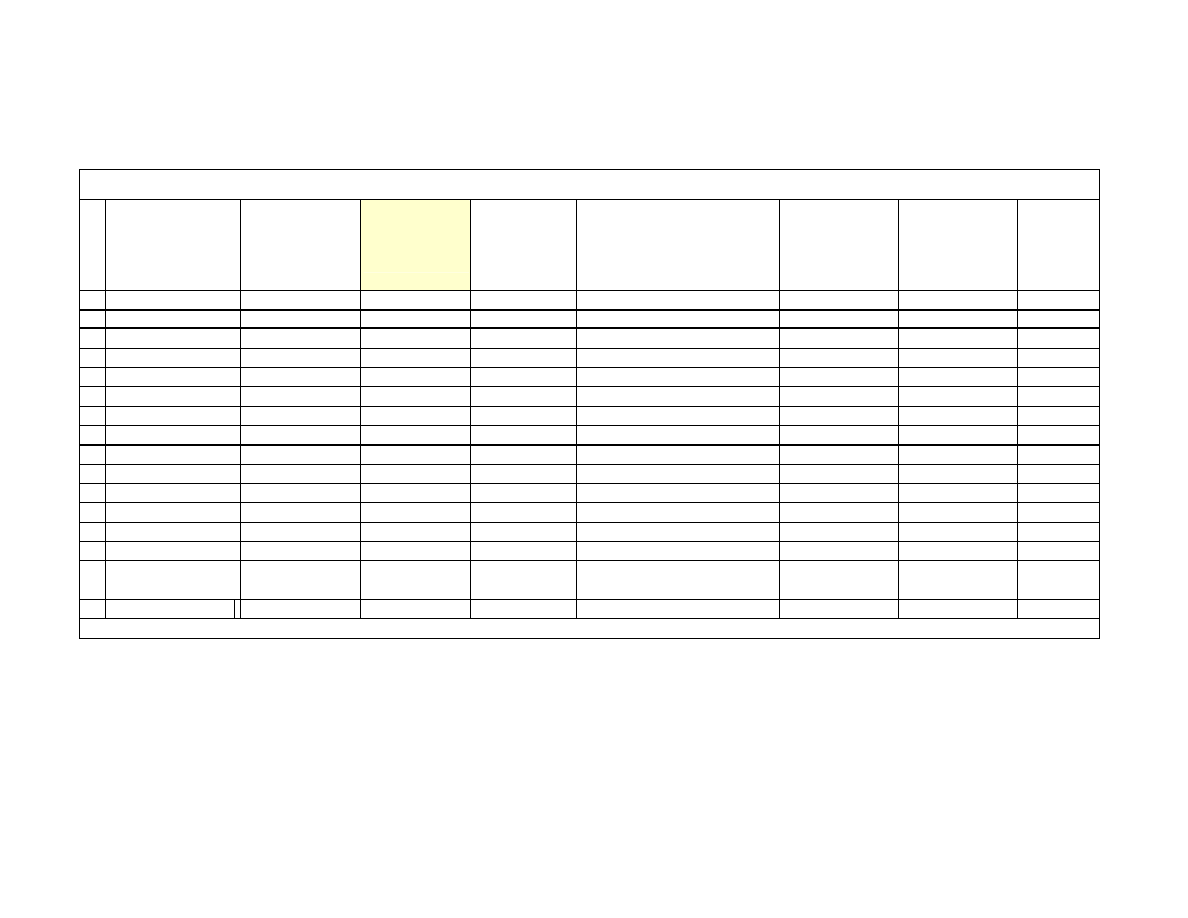
On average the size of the informal economy in Africa (in percent of GDP) was 42% for the
years 1999/2000. Zimbabwe, Tanzania and Nigeria have with 59.4, 58.3 and 57.9% by far the
largest informal economy. In the middle field are Mozambique, Cote d’Ivoire and
Madagascar with 40.3, 39.9 and 39.6%. At the lower end are Botswana with 33.4, Cameroon
with 32.8 and South Africa with 28.4%. In sum one realizes that the size of the informal
economy which is more like a parallel economy in Africa is quite large.
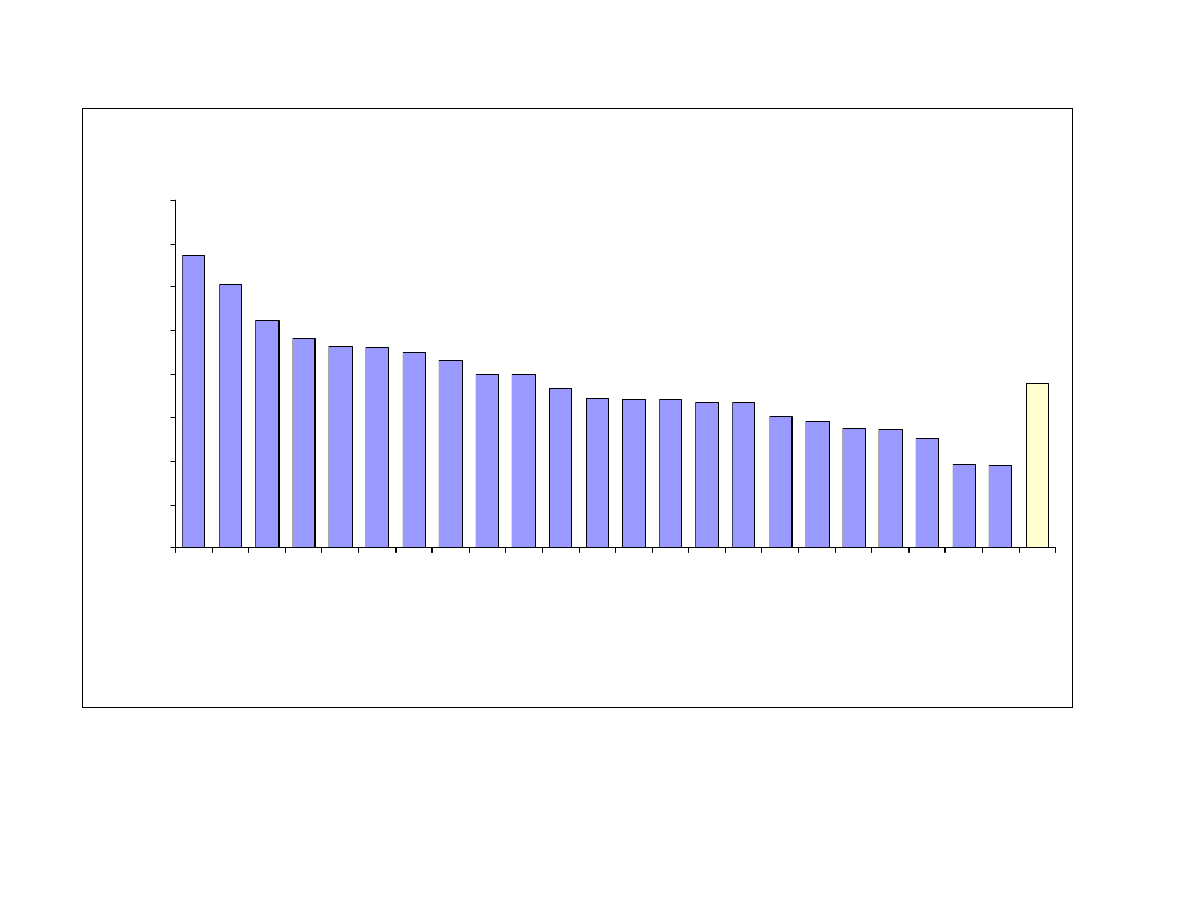
In table 3 and figure 2the results for Asia are shown and here it is somewhat difficult to treat
all Asian countries equally because Japan, Singapore and Hongkong are highly developed
states and the others more or less developing countries. But as I decided to group according to
continents so I leave these countries series as it stands now, realizing that not all are
developing countries.
Table 3 – Figure 2
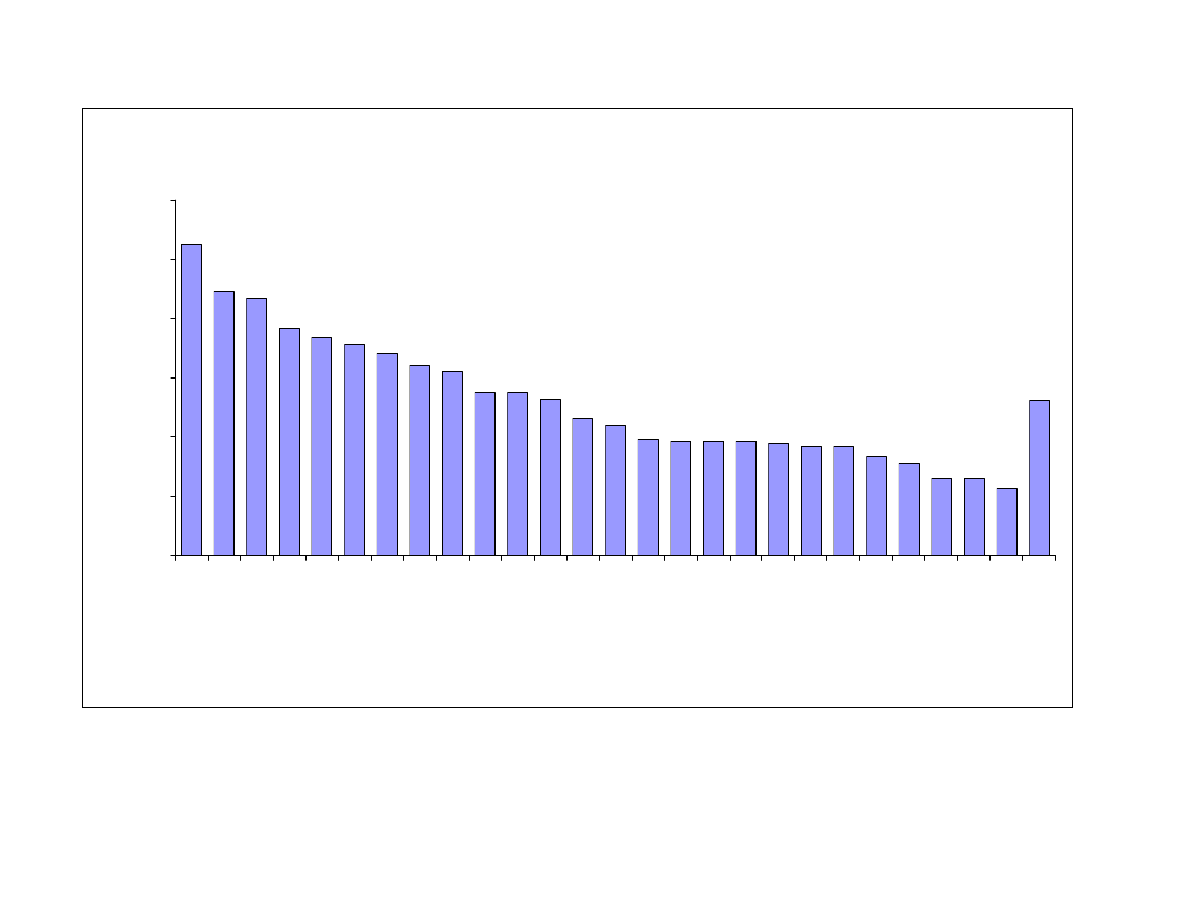
If we consider the 26 Asian countries, where the results are s hown in table 3, Thailand has by
far the largest informal economy in the year 1999/2000 with the size of 52.6% of official
GDP. Followed by Sri Lanka with 44.6% and Philippines with 43.4%. In the middle are India
with 23.1%, Israel with 21.9% and Taiwan and China with 19.6%. At the lower end are
Singapore with 13.1% and Japan with 11.3%. On average the Asian developing countries
have a size of the informal economy of 26% of official GDP for the years 1999/2000. One
realizes that the average size of the informal economy is considerably lower compared with
African and South and Latin American States.
6
Table 2: The size of the informal economy of 23 African nations
AFRICA
GNP at
market prices
(current US$,
billion) 2000
Informal
Economy in
% of GNP
1999/2000
Informal
Economy
(current USD
in billion)
2000
Informal
Economy
GNP per
capita
GNP per
capita 2000,
Atlas method
(current US$)
Private
consumption
per capita 2000
(current US$)
Population
aged 15-64,
total
(thousand)
2000
Population,
total
(thousand)
2000
1 Algeria
506,1
34,1
172,6
538,8
1580
731
18555
30399
2 Benin
21,5
45,2
9,7
167,2
370
283
3192
6272
3 Botswana
52,8
33,4
17,6
1102,2
3300
1835
882
1602
4 Burkina Faso
21,7
38,4
8,3
80,6
210
148
5418
11274
5 Cameroon
82,8
32,8
27,2
190,2
580
415
7921
14876
6 Cote d'Ivoire
86,1
39,9
34,4
239,4
600
418
8773
16013
7 Egypt, Arab Rep.
996,6
35,1
349,8
523,0
1490
1126
38708
63976
8 Ethiopia
63,3
40,3
25,5
40,3
100
77
33356
64298
9 Ghana
48,3
38,4
18,5
126,7
330
210
10778
19306
10 Madagascar
38,0
39,6
15,1
99,0
250
216
8112
15523
11 Malawi
16,6
40,3
6,7
68,5
170
135
5232
10311
12 Mali
22,6
41,0
9,3
98,4
240
168
5407
10840
13 Morocco
324,6
36,4
118,1
429,5
1180
728
17567
28705
14 Mozambique
1)
35,8
40,3
14,4
84,6
210
170
9346
17691
15 Niger
18,1
41,9
7,6
75,4
180
142
5213
10832
16 Nigeria
367,3
57,9
212,6
150,5
260
147
65863
126910
17 Senegal
42,9
43,2
18,5
211,7
490
361
5067
9530
18 South Africa
1226,4
28,4
348,3
857,7
3020
1871
26713
42801
19 Tanzania
89,8
58,3
52,4
157,4
270
226
17714
33696
20 Tunisia
185,7
38,4
71,3
806,4
2100
1231
6163
9564
21 Uganda
61,6
43,1
26,5
129,3
300
243
10722
22210
22 Zambia
27,9
48,9
13,6
146,7
300
274
5097
10089
23 Zimbabwe
1)
71,4
59,4
42,4
273,2
460
357
6515
12627
AVERAGE
192
42
70
287
782
500
14014
25624
1) Due to civil war and political unrest unreliable figures.
Source: own calculations based on Worldbank Data, Washington D.C., 2002.
7
Figure 1: Africa: Shadow Economy in % of GNP 1999/2000
59,4
58,3
57,9
48,9
45,2
43,2
43,1
41,9
41,0
40,3
40,3
40,3
39,9
39,6
38,4
38,4
38,4
36,4
35,1
34,1
33,4
32,8
28,4
42
0,0
10,0
20,0
30,0
40,0
50,0
60,0
70,0
Zimbabwe
Tanzania
NigeriaZambia BeninSenegalUganda
Niger
Mali
Ethiopia
Malawi
Mozambique
Cote d'Ivoire
Madagascar
Burkina Faso
GhanaTunisia
Morocco
Egypt, Arab Rep.
Algeria
Botswana
Cameroon
South Africa
AV
ER
AG
E
in % of GNP
8
Table 3: The size of the informal (and official) economy of 26 Asian countries
ASIA
GNP at market
prices (current
US$, billion)
2000
Informal
Economy in
% of GNP
1999/2000
Informal
Economy
(current USD
in bill.) 2000
Informal
Economy
GNP per
capita
GNP per
capita 2000,
Atlas method
(current US$)
Private
consumption
per capita 2000
(current US$)
Population aged
15-64, total
(thousand) 2000
Population,
total
(thousand)
2000
1 Bangladesh
468,9
35,6
166,9
131,7
370
279
76241
131050
2 China
1)
10652,8
13,1
1395,5
110,0
840
413
862212
1262460
3 Hongkong, China
1654,7
16,6
274,7
4302,7
25920
13902
4966
6797
4 India
4531,8
23,1
1046,8
104,0
450
294
625220
1015923
5 Indonesia
2)
1426,6
19,4
276,8
110,6
570
490
135563
210421
6 Iran
937,7
18,9
177,2
304,3
1610
760
37715
63664
7 Israel
1060,1
21,9
232,2
3659,5
16710
10458
3857
6233
8 Japan
49011,6
11,3
5538,3
4025,1
35620
19966
86423
126870
9 Jordan
83,1
19,4
16,1
331,7
1710
1377
2794
4887
10 Korea, Rep.
4550,2
27,5
1251,3
2450,3
8910
5540
34081
47275
11 Lebanon
2)
174,2
34,1
59,4
1367,4
4010
3346
2718
4328
12 Malaysia
823,9
31,1
256,2
1051,2
3380
1642
14375
23270
13 Mongolia
1)
9,5
18,4
1,8
71,8
390
268
1463
2398
14 Nepal
56,9
38,4
21,8
92,2
240
178
12729
23043
15 Pakistan
596,0
36,8
219,3
161,9
440
343
75308
138080
16 Philippines
793,2
43,4
344,2
451,4
1040
648
44545
75580
17 Saudi Arabia
1736,6
18,4
319,5
1330,3
7230
2747
11214
20723
18 Singapore
983,7
13,1
128,9
3240,9
24740
9176
2849
4018
19 Sri Lanka
160,0
44,6
71,4
379,1
850
610
13055
19359
20 Syria
159,6
19,3
30,8
181,4
940
718
9070
16189
21 Taiwan, China
3144,0
19,6
616,2
2720,5
13880
8695
15521
22173
22 Thailand
1205,4
52,6
634,1
1052,0
2000
1179
41367
60728
23 Turkey
2009,2
32,1
644,9
995,1
3100
2183
41917
65293
24 Unit. Arab Emir.
0,0
26,4
0,0
7191,4
27240
N.A.
2070
2905
25 Vietnam
1)
313,5
15,6
48,9
60,8
390
266
48125
78523
26 Yemen
73,9
27,4
20,2
101,4
370
282
8337
17507
AVERAGE
3331
26
531
1384
7037
3298
85144
132681
1) Still a mostly communist dominated country. 2) Due to civil war and political unrest unreliable figures.
Source: own calculations based on Worldbank data, Washington D.C., 2002.
9
Figure 2: Asia - Shadow Economy in % of GNP 1999/2000
52,6
44,6
43,4
38,4
36,8
35,6
34,1
32,1
31,1
27,5
27,4
26,4
23,1
21,9
19,6
19,4
19,4
19,3
18,9
18,4
18,4
16,6
15,6
13,1
13,1
11,3
26
0,0
10,0
20,0
30,0
40,0
50,0
60,0
Thailand
Sri Lanka
Philippines
Nepal
Pakistan
Bangladesh
Lebanon
Turkey
Malaysia
Korea, Rep.
Yemen
United Arab Emirates
India Israel
Taiwan, China
Indonesia
Jordan
Syria
Iran
Mongolia
Saudi Arabia
Hong Kong, China
Vietnam
China
Singapore
Japan
AVERAGE
in % of GNP

10
In table 4 and figure 3 the size of the informal economy for the year 1999/2000 for 18 South
and Latin American states is shown. The average size of informal economy of these 18 states
is 41%.
Table 4 – Figure 3
The largest informal economy has Bolivia with 67.1%, followed by Panama with 64.1% and
Peru with 59.9%. The lowest informal economy has Chile with 19.8% and before is Argentina
with 25.4%. If one compares the results of tables 2-4 one see that the size of the informal
economy of South America and Africa is somewhat similar and the size of the informal
economy in Asia is somewhat lower.
2.2 Transition Countries
The sizes of the informal economies of the transition countries which have been again estimated
using the currency demand, the physical input and DYMIMIC approach are presented in table 5
and figure 4.
Table 5 – F igure 4
23 transition countries have been investigated and the average size of the informal economy in
percent of official GDP is 38% for the year 1999/2000. The by far largest informal economy has
Georgia with 67.3%, followed by Azerbaijan with 60.6% and Ukraine with 52.2%. In the middle
field are Bulgaria and Romania with 36.9 and 34.4% and at the lower end are Hungary with 25.1,
the Czech Republic with 19.1 and the Slovak. Republic with 18.9%.
11
Table 4: The size of the informal (and official) economy of 18 Latin and South American Countries
SOUTH AMERICA
GNP at
market
prices
(current
US$, billion)
2000
Informal
Economy
in % of
GNP
1999/2000
Informal
Economy
(current USD
in billion)
2000
Informal
Economy
GNP per
capita
GNP per
capita 2000,
Atlas meth od
(current US$)
Private
consumption per
capita 2000
(current US$)
Population
aged 15-64,
total
(thousand)
2000
Populatio
n, total
(thousand
) 2000
1 Argentina
2774,4
25,4
704,7
1894,8
7460
5457
23175
37032
2 Bolivia
80,6
67,1
54,1
664,3
990
732
4695
8329
3 Brazil
5697,7
39,8
2267,7
1424,8
3580
2186
112569
170406
4 Chile
681,4
19,8
134,9
908,8
4590
2937
9793
15211
5 Colombia
788,5
39,1
308,3
789,8
2020
1294
26427
42299
6 Costa Rica
146,2
26,2
38,3
998,2
3810
2802
2383
3811
7 Dominican Republic
186,3
32,1
59,8
683,7
2130
1824
5208
8373
8 Ecuador
123,8
34,4
42,6
416,2
1210
668
7774
12646
9 Guatemala
187,4
51,5
96,5
865,2
1680
1409
6016
11385
10 Honduras
57,9
49,6
28,7
426,6
860
612
3519
6417
11 Jamaica
69,9
36,4
25,5
950,0
2610
1910
1615
2633
12 Kenya
102,2
34,3
35,1
120,1
350
272
16160
30092
13 Mexico
5597,7
30,1
1684,9
1526,1
5070
3961
60868
97966
14 Nicaragua
21,1
45,2
9,5
180,8
400
415
2755
5071
15 Panama
93,7
64,1
60,1
2089,7
3260
2107
1804
2856
16 Peru
519,2
59,9
311,0
1245,9
2080
1471
15856
25661
17 Uruguay
193,8
51,1
99,0
3066,0
6000
4403
2079
3337
18 Venezuela, RB
1193,2
33,6
400,9
1448,2
4310
3144
14868
24170
AVERAGE
1029
41
353
1094
2912
2089
17642
28205
Source: own calculations based on Worldbank data, Washington D.C., 2002.
12
Figure 3: South America: Shadow Economy in % of GNP 1999/2000
67,1
64,1
59,9
51,5
51,1
49,6
45,2
39,8
39,1
36,4
34,4
34,3
33,6
32,1
30,1
26,2
25,4
19,8
41
0,0
10,0
20,0
30,0
40,0
50,0
60,0
70,0
80,0
Bolivia Panama
Peru
Guatemala
UruguayHondurasNicaragua
Brazil
Colombia Jamaica Ecuador
Kenya
Venezuela, RB
Dominican Republic
Mexico
Costa RicaArgentina
Chile
AV
ER
AG
E
in % of GNP
13
Table 5: The size of the informal (and official) economy of 23 European Transformation Countries
EUROPE -
TRANSFORMATION
COUNTRIES
GNP at
market
prices
(current
US$, billion)
2000
Informal
Economy
in % of
GNP
1999/2000
Informal
Economy
(current USD
in billion)
2000
Informal
Econom
y GNP
per
capita
GNP per
capita 2000,
Atlas
method
(current
US$)
Private
consumption
per capita 2000
(current US$)
Population aged
15-64, total
(thousand) 2000
Population,
total
(thousand)
2000
1 Albania
2)
38,6
33,4
12,9
374,1
1120
1012
2188
3411
2 Armenia
19,3
46,3
8,9
240,8
520
479
2572
3803
3 Azerbaijan
1) 2)
49,2
60,6
29,8
363,6
600
389
5170
8049
4 Belarus
1)
299,6
48,1
144,1
1380,5
2870
1707
6803
10005
5 Bosnia-Herzegovina
2)
46,2
34,1
15,8
419,4
1230
N.A.
2830
3977
6 Bulgaria
116,7
36,9
43,1
560,9
1520
1060
5563
8167
7 Croatia
187,2
33,4
62,5
1543,1
4620
2483
2970
4380
8 Czech Republic
500,1
19,1
95,5
1002,8
5250
2690
7165
10273
9 Georgia
30,5
67,3
20,5
424,0
630
514
3347
5024
10 Hungary
440,6
25,1
110,6
1182,2
4710
2903
6856
10022
11 Kazakhstan
1)
170,5
43,2
73,7
544,3
1260
785
9838
14869
12 Kyrgyz Republic
12,2
39,8
4,9
107,5
270
207
2950
4915
13 Latvia
71,8
39,9
28,6
1165,1
2920
1885
1609
2372
14 Lithuania
111,2
30,3
33,7
887,8
2930
1970
2482
3695
15 Moldova
1) 2)
13,6
45,1
6,1
180,4
400
323
2893
3550
16 Poland
1568,2
27,6
432,8
1156,4
4190
2614
26555
38650
17 Romania
363,8
34,4
125,2
574,5
1670
1209
15355
22435
18 Russian Federation
1)
2484,4
46,1
1145,3
779,1
1690
825
101243
145555
19 Slovak Republic
187,7
18,9
35,5
699,3
3700
1890
3732
5402
20 Slovenia
180,7
27,1
49,0
2723,6
10050
5008
1396
1988
21 Ukraine
308,5
52,2
161,0
365,4
700
374
33833
49501
22 Uzbekistan
1)
74,2
34,1
25,3
122,8
360
197
14620
24752
23 Yugoslavia
2)
84,5
29,1
24,6
273,5
940
629
7115
10637
AVERAGE
320
38
117
742
2354
1354
11699
17193
1) Still a mostly communist dominated country. 2) Due to civil war and political unrest unreliable figures.
Source: own calculations based on Worldbank data, Washington D.C., 2002.
14
Figure 4: Europe - Transformation Countries: Shadow Economy in % of GNP 1999/2000
67,3
60,6
52,2
48,1
46,3
46,1
45,1
43,2
39,9
39,8
36,9
34,4
34,1
34,1
33,4
33,4
30,3
29,1
27,6
27,1
25,1
19,1
18,9
38
0,0
10,0
20,0
30,0
40,0
50,0
60,0
70,0
80,0
Georgia
Azerbaijan
Ukraine Belarus Armenia
Russian Federation
Moldova
Kazakhstan
Latvia
Kyrgyz Republic
BulgariaRomania
Bosnia-Herzegovina
Uzbekistan
Albania Croatia
Lithuania
Yugoslavia
Poland
SloveniaHungary
Czech Republic
Slovak Republic
AVERAGE
in % of GNP

15
2.3 OECD-Countries
2.3.1 West-European OECD-Countries
For 16 West-European-OECD-Countries the size of the informal economy in percent of official
GDP for the year 1999/2000 has been calculated. The results are presented in table 6 and in figure
5.
Table 6 – Figure 5
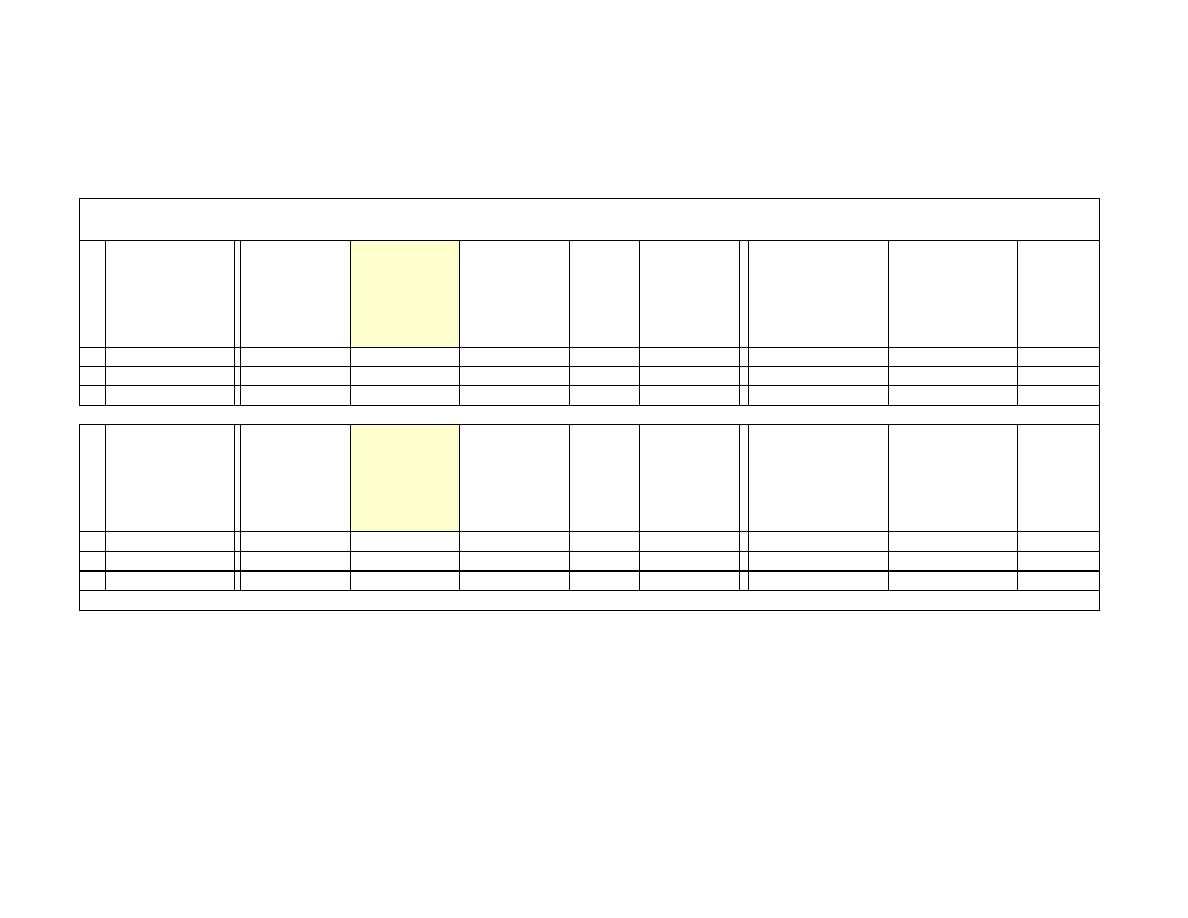
Greece and Italy have by far the largest informal economy with 28.6 and 27.0%. In the middle
field are Denmark with 18.2 and Germany with 16.3% and at the lower end are Austria with 10.2
and Switzerland with 8.8%. The average size of these 16 OECD-Countries of the informal
economy is 18% for the year 1999/2000.
2.3.2 North-American and Pacific OECD-Countries
In table 7 and figure 6 the size of the informal economy in % of official GDP for the year
1999/2000 for four OECD-Countries (Australia, Canada, New Zealand and United States,) is
shown.
Table 7 – Figure 6
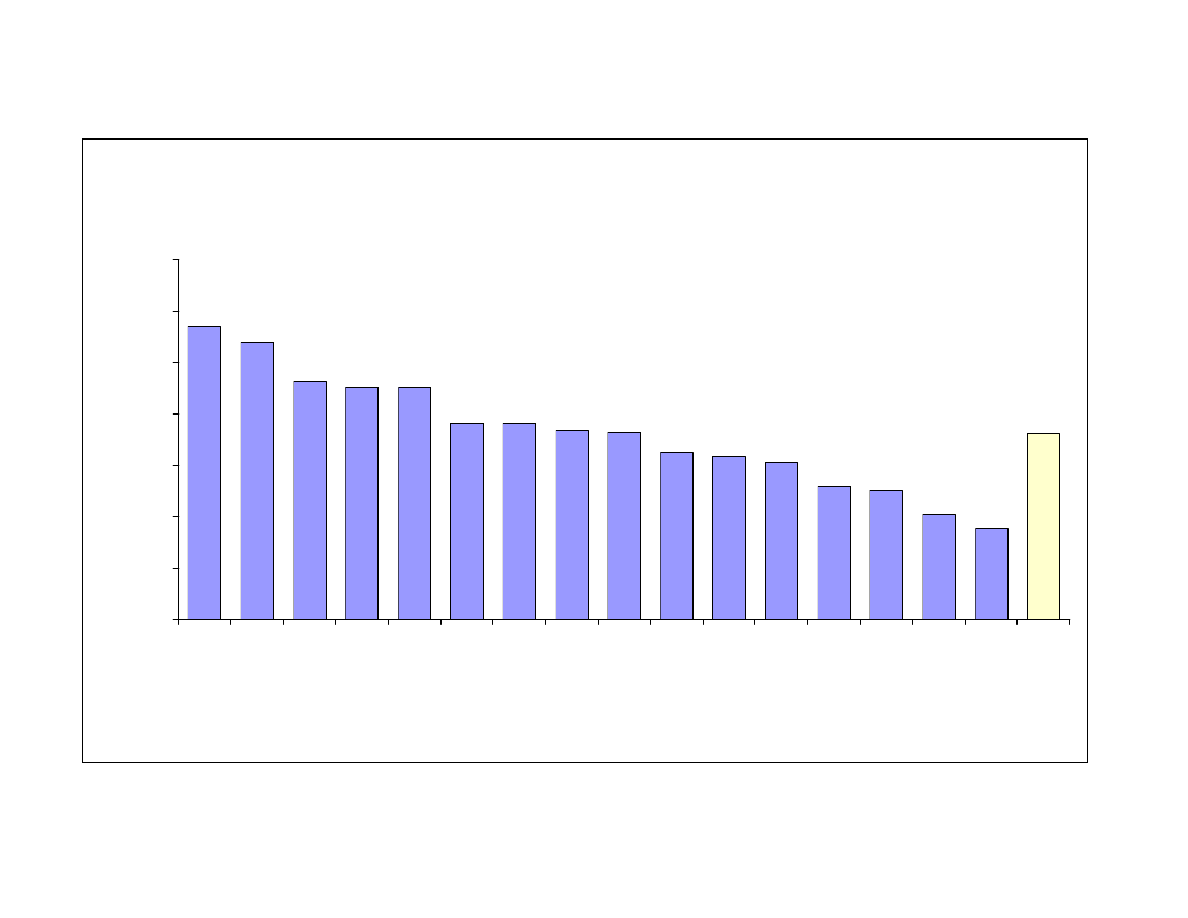
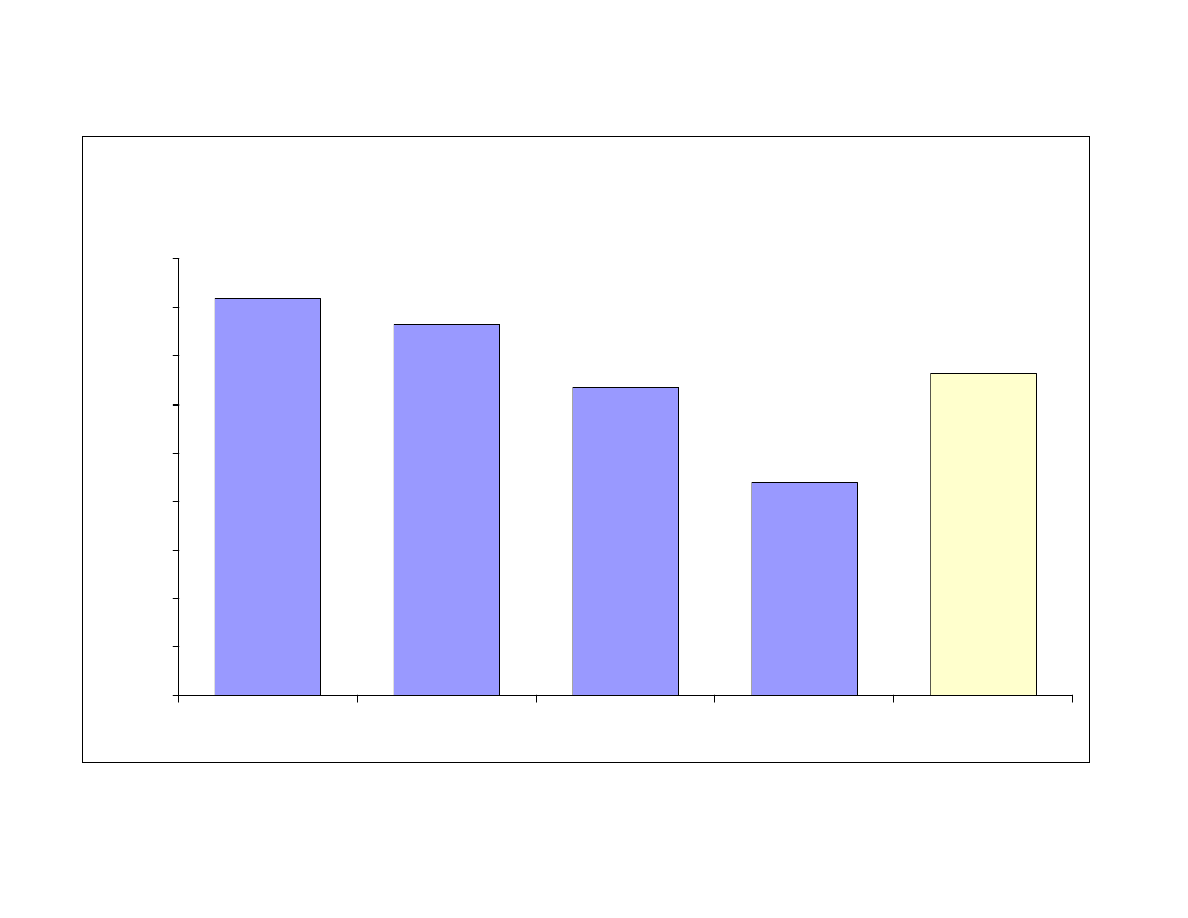
Among these countries Canada has the largest informal economy with 16.3%, followed by
Australia with 15.3%, the New Zealand with 12.7% and finally the United States with 8.8%. On
average the size of the informal economy of these four countries is 13.5%.
2.3.3 Informal economy and informal economy labor force of 21 OECD countries
Finally some additional results of the informal economy over an extended time period, i.e. from
1989 to 2002; and informal economy labor force of 21 OECD countries are shown. The size and
development of the informal economy of 21 OECD countries over the time period 1989/90-
2001/02 is presented in table 8.
Table 8
16
Table 6: The size of the informal (and official) economy of 16 OECD – West European Countries
EUROPE -
OECD -WEST
EUROPEAN
COUNTRIES
GNP at market
prices (current
US$, billion)
2000
Informal
Economy in
% of GNP
1999/2000
Informal
Economy
(current USD
in billion)
2000
Informal
Economy
GNP per
capita
GNP per
capita 2000,
Atlas method
(current US$)
Private
consumption
per capita 2000
(current US$)
Population
aged 15-64,
total
(thousand)
2000
Populatio
n, total
(thousand
) 2000
1 Austria
1859,8
10,2
189,7
2572,4
25220
14659
5501
8110
2 Belgium
2290,6
23,2
531,4
5693,3
24540
11899
6736
10252
3 Denmark
1601,1
18,2
291,4
5875,0
32280
14546
3562
5336
4 Finland
1194,0
18,3
218,5
4598,8
25130
11542
3469
5177
5 France
13046,5
15,3
1996,1
3736,3
24420
12033
38453
58892
6 Germany
18592,5
16,3
3030,6
4094,6
25120
13241
55915
82150
7 Greece
1151,1
28,6
329,2
3420,6
11960
8404
7116
10560
8 Ireland
802,1
15,8
126,7
3580,3
22660
12073
2546
3794
9 Italy
10667,2
27,0
2880,1
5443,2
20160
11253
39026
57690
10 Netherlands
3675,4
13,0
477,8
3246,1
24970
12395
10835
15919
11 Norway
1602,3
19,1
306,0
6595,2
34530
15382
2913
4491
12 Portugal
1032,4
22,6
233,3
2513,1
11120
6643
6776
10008
13 Spain
5524,0
22,6
1248,4
3408,1
15080
8403
26965
39465
14 Sweden
2244,8
19,1
428,7
5183,7
27140
12931
5710
8869
15 Switzerland
2537,7
8,8
223,3
3356,3
38140
22057
4836
7180
16 United Kingdom
14170,7
12,6
1785,5
3078,2
24430
15492
38996
59739
AVERAGE
5125
18
894
4150
24181
12685
16210
24227
Source: own calculations based on Worldbank data, Washington D.C., 2002.
17
Figure 5: Europe - OECD-West European Countries: Shadow Economy in % of GNP
1999/2000
28,6
27,0
23,2
22,6
22,6
19,1
19,1
18,3
18,2
16,3
15,8
15,3
13,0
12,6
10,2
8,8
18
0,0
5,0
10,0
15,0
20,0
25,0
30,0
35,0
Greece
Italy
Belgium Portugal
Spain
Norway Sweden Finland Denmark Germany
Ireland
France
Netherlands
United Kingdom
Austria
Switzerland AVERAGE
in % of GNP
18
Table 7: The size of the informal (and official) economy of 4 OECD Countries
GNP at
market prices
(current US$,
billion) 2000
Informal
Economy in
% of GNP
1999/2000
Informal
Economy
(current USD
in billion)
2000
Informal
Econom
y GNP
per
capita
GNP per
capita 2000,
Atlas
method
(current
US$)
Private
consumption per
capita 2000
(current US$)
Population aged
15-64, total
(thousand) 2000
Populatio
n, total
(thousand
) 2000
1 Canada
6713,5
16,4
1101,0
3465,3
21130
11933
20995
30750
2 United States
98253,0
8,8
8646,3
3000,8
34100
22265
185783
281550
AVERAGE
52483
13
4874
3233
27615
17099
103389
156150
GNP at
market prices
(current US$,
billion) 2000
Informal
Economy in
% of GNP
1999/2000
Informal
Economy
(current USD
in billion)
2000
Informal
Econom
y GNP
per
capita
GNP per
capita 2000,
Atlas
method
(current
US$)
Private
consumption per
capita 2000
(current US$)
Population aged
15-64, total
(thousand) 2000
Populatio
n, total
(thousand
) 2000
1 Australia
3791,5
15,3
580,1
3096,7
20240
12556
12895
19182
2 New Zealand
460,7
12,7
58,5
1649,7
12990
9204
2504
3831
AVERAGE
2126
14
319
2373
16615
10880
7700
11506
Source: own calculations based on Worldbank data, Washington D.C., 2002.
19
Figure 6: Shadow Economy in % of GNP 1999/2000 - Canada, Australia, New Zealand
and United States
16,4
15,3
12,7
8,8
13
0,0
2,0
4,0
6,0
8,0
10,0
12,0
14,0
16,0
18,0
Canada
Australia
New Zealand
United States
AVERAGE
in % of GNP

20
Table 8: The Size of the Informal Economy in OECD Countries
Size of the Informal Economy (in % of GDP) using the Currency Demand Method
OECD-Countries
Average
1989/90
Average
1991/92
Average
1994/95
Average
1997/98
Average
1999/2000
Average
2001/2002
1)
1. Australia
10.1
13.0
13.5
14.0
14.3
14.1
2. Belgium
19.3
20.8
21.5
22.5
22.2
22.0
3. Canada
12.8
13.5
14.8
16.2
16.0
15.8
4. Denmark
10.8
15.0
17.8
18.3
18.0
17.9
5. Germany
11.8
12.5
13.5
14.9
16.0
16.3
6. Finland
13.4
16.1
18.2
18.9
18.1
18.0
7. France
9.0
13.8
14.5
14.9
15.2
15.0
8. Greece
22.6
24.9
28.6
29.0
28.7
28.5
9. Great Britain
9.6
11.2
12.5
13.0
12.7
12.5
10. Ireland
11.0
14.2
15.4
16.2
15.9
15.7
11. Italy
22.8
24.0
26.0
27.3
27.1
27.0
12. Japan
8.8
9.5
10.6
11.1
11.2
11.1
13. Netherlands
11.9
12.7
13.7
13.5
13.1
13.0
14. New Zealand
2)
9.2
9.0
11.3
11.9
12.8
12.6
15. Norweay
14.8
16.7
18.2
19.6
19.1
19.0
16. Austria
6.9
7.1
8.6
9.0
9.8
10.6
17. Portugal
15.9
17.2
22.1
23.1
22.7
22.5
18. Sweden
15.8
17.0
19.5
19.9
19.2
19.1
19. Switzerland
6.7
6.9
7.8
8.1
8.6
9.4
20. Spain
3)
16.1
17.3
22.4
23.1
22.7
22.5
21. US A
6.7
8.2
8.8
8.9
8.7
8.7
Unweighted Average
over 21 OECD
countries
13.2
14.3
15.7
16.7
16.8
16.7
Sources: Currency demand approach, own calculations
1) Preliminary values.
2) The figures are calculated using the MIMIC-method and Currency demand approach. Source: Giles
(1999b).
3) The figures have been calculated for 1989/90, 1990/93 and 1994/95 from Mauleon (1998) and for
1997/98 and 1999 own calculations.

21
For the 21 OECD countries either the currency demand method or the DYMIMIC method are
used. The results for these countries are shown in table 8 over the period 1989/90 to
2001/2002. Considering again the latest period 2001/2002, Greece has with 28.5% of official
GDP the largest informal economy, followed by Italy with 27.0% and Portugal with 22.5%.
In the middle-field are Germany with a informal economy of 16.3% of official GDP,
followed by Ireland with 15.7% and France with 15.0% of official GDP. At the lower end are
Austria with 10.6% of GDP and the United States with 8.7% of official GDP. In OECD
countries one realizes over time quite an increase of the informal economies during the 90s.
On average the informal economy was 13.2% in these 21 OECD states in the year 1989/90
and it rose to 16.7% in the year 2001/2002. If we consider the second half of the 90s, we
realize that for some countries the informal economy is not further increasing, even slightly
decreasing, like for Belgium from 22.5% (1997/98) to 22.0% (2001/2002), for Denmark from
18.3% (1997/98) to 17.9% (2001/2002) or for Finland from 18.9% (1997/98) to 18.0%
(2001/2002). For others, like New Zealand, it is still increasing from 11.9% (1997/98) to
12.6% (2001/2002), or Germany from 14.9% (1997/98) to 16.3 (2001/2002). Hence, one
can’t draw a general conclusion whether the informal economy is further increasing or
decreasing at the end of the 90s. It differs from country to country but in some countries some
efforts have been made to stabilize the size of the informal economy and in other countries
(like Germany) these efforts were not successfully.
Having examined the size and rise of the informal economy in terms of value added over
time, the analysis now focuses on the „informal“ labor market, as within the official labor
market there is a particularly tight relationship and “social network” between people who are
active in the informal economy.
7)
Moreover, by definition every activity in the informal
economy involves a “informal” labor market to some extent: Hence, the “informal labor
market” includes all cases, where the employees or the employers, or both, occupy a
„informal economy position“. Why do people work in the informal economy? In the official
labor market, the costs firms (and individuals) have to pay when “officially” hiring someone
are increased tremendously by the burden of tax and social contributions on wages, as well as
by the legal administrative regulation to control economic activity.
8)
In various OECD
countries, these costs are greater than the wage effectively earned by the worker – providing a
7)
Pioneering work in this area has been done by L. Frey (1972, 1975, 1978, 1980), Cappiello (1986), Lubell
(1991), Pozo (1996), Bartlett (1998) and Tanzi (1999).
8)
This is especially true in Europe (e.g. in Germany and Austria), where the total tax and social security burden

22
strong incentive to work in the informal economy. More detailed theoretical information on
the labor supply decision in the underground economy is given by Lemieux, Fortin, and
Fréchette (1994) who use micro data from a survey conducted in Quebec City (Canada). In
particular, their study provides some economic insight into the size of the distortion caused by
income taxation and the welfare system. The results of this study suggest that hours worked
in the informal economy are quite responsive to changes in the net wage in the regular
(official) sector. Their empirical results attribute this to a (miss-)allocation of work from the
official to the informal sector, where it is not taxed. In this case, the substitution between
labor-market activities in the two sectors is quite high. These empirical findings clearly
indicate, that “participation rates and hours worked in the underground sector also tend to be
inversely related to the number of hours worked in the regular sector“ (Lemieux, Fortin, and
Fréchette 1994 p. 235). These findings demonstrate a large negative elasticity of hours
worked in the informal economy with respect both to the wage rate in the regular sector as
well as to a high mobility between the sectors.
Illicit work can take many shapes. The underground use of labor may consist of a second job
after (or even during) regular working hours. A second form is informal economy work by
individuals who do not participate in the official labor market. A third component is the
employment of people (e.g. clandestine or illegal immigrants), who are not allowed to work
in the official economy. Empirical research on the informal economy labor market is even
more difficult than of the informal economy on the value added, since one has very little
knowledge about how many hours an average “informal economy worker” is actually
working (from full time to a few hours, only); hence, it is not easy to provide empirical
facts.
9)
Table 9
In table 9 the estimates for the informal economy labor force in 7 OECD-countries (Austria,
Denmark, France, Germany, Italy, Spain and Sweden) are shown. In Austria the informal
economy labor force has reached in the years 1997-1998 500.000 to 750.000 or 16% of the
official labor force (mean value). In Denmark the development of the 80s and 90s shows that
the part of the Danish population engaged in the informal economy ranged from 8.3% of the
total labor force (in 1980) to 15.4% in 1994 – quite a remarkable increase of the informal
adds up to 100% on top of the wage effectively earned; see also section 5.1.
9)
For developing countries some literature about the informal labour market exists, e.g. the latest works by
Dallago (1990), Pozo (1996), Loayza (1996), especially Chickering and Salahdine (1991).

23
economy labor force; it almost doubled over 15 years. In France (in the years 1997/98) the
informal economy labor force reached a size of between 6 and 12% of the official labor force
or in absolute figures between 1.4 and 3.2 million. In Germany this figure rose from 8 to 12%
in 1974 to 1982 and to 22% (18 millions) in the year 1997/98. For France and Germany this is
again a very strong increase in the informal economy labor force. In other countries the
amount of the informal economy labor force is quite large, too: in Italy 30-48% (1997-1998),
Spain 11.5-32% (1997-1998) and Sweden 19.8 % (1997-1998). In the European Union about
30 million people are engaged in informal economy activities in the year 1997-1998 and in all
European OECD-countries 48 million work illicitly.
These figures demonstrate that the informal economy labor market is lively and may provide
an explanation, why for example in Germany, one can observe such a high and persistent
unemployment. In table 9 a first and preliminary calculation is done of the official GNP per
capita and the informal economy GDP per capita, shown in US-$. Here one realizes
immediately that in all countries investigated, the informal economy GDP per capita is much
higher - on average in all countries around 40%.
10)
This clearly shows, that the productivity in
the informal economy quite likely is considerably higher then the official economy - a clear
indication, that the work effort; i.e. the incentive to work effectively is stronger in the
informal economy. In general these very preliminary results clearly demonstrate that the
informal economy labor force has reached a remarkable size in the developed OECD-
countries, too, even when the calculation still might have many errors, but again the picture
shows, that the informal economy labor market has reached a sizeable figure in most
countries.
10)
This is an astonishing result, which has to be further checked, because in the official per capita GDP figures
the whole economy is included with quite productive sectors (like electronics, steel, machinery, etc.) and the
informal economy figures traditionally contain mostly the service sectors (and the construction sector). Hence
one could also expect exactly the opposite result, as the productivity in the service sector is usually much lower
than in the above mentioned ones. Sources of error may be either an underestimation of the informal economy
labor force or an overestimation of the informal economy in terms of value added.

24
Table 9: Estimates of the Size of the “Informal Economy Labor Force” and of the Official and Informal Economy Productivity in Some
OECD Countries 1974 -1998
Countries
Year
Official GDP
per capita in
US-$
1)
Informal
Economy
GDP in US -$
per capita
Size of the
Informal
Economy (in % of
official GDP)
Currency
Demand
Approach
2)
Informal
Economy
Labor Force in
1000 people
3)
Informal
Economy
Participants in
% of official
Labor Force
4)
Sources of Informal Economy Labour
Force
Austria
90-91
97-98
20,636
25,874
25,382
29,630
5.47
8.93
300-380
500-750
9.6
16.0
Schneider (1998) and
own calculations
Denmark
1980
13,233
18,658
8.6
250
8.3
Mogensen, et. al.
1986
18,496
26,356
9.8
390
13.0
(1995)
1991
25,946
36,558
11.2
410
14.3
and own calculations
1994
34,441
48,562
17.6
420
15.4
France
1975-82
1997-98
12,539
24,363
17,542
34,379
6.9
14.9
800-1500
1400- 3200
3.0-6.0
6.0-12.0
De Grazia (1983) and
own calculations
Germany
1974-82
1997-98
11,940
26,080
17,911
39,634
10.6
14.7
3000- 4000
7000- 9000
8.0-12.0
19.0-23.0
De Grazia (1983), F. Schneider (1998b)
and own calculations
Italy
1979
1997-98
8,040
20,361
11,736
29,425
16.7
27.3
4000- 7000
6600-11400
20.0-35.0
30.0-48.0
Gaetani and d’Aragona (1979) and
own calculations
Spain
1979-80
1997-98
5,640
13,791
7,868
19,927
19.0
23.1
1250- 3500
1500- 4200
9.6-26.5
11.5-32.3
Ruesga (1984) and
own calculations
Sweden
1978
1997-98
15,107
25,685
21,981
37,331
13.0
19.8
750
1150
13.0-14.0
19.8
De Grazia (1983) and own calculations
European
Union
1978
1997-98
9,930
22,179
14,458
32,226
14.5
19.6
15 000
30 000
-
De Grazia (1983) and own calculations
OECD
(Europe)
1978
1997-98
9,576
22,880
14,162
33,176
15.0
20.2
26 000
48 000
-
De Grazia (1983) and own calculations
1) Source: OECD, Paris, various years
2) Source: Own calculations.
3) Estimated full-time jobs, including unregistered workers, illegal immigrants, and second jobs.
4) In percent of the population aged 20-69, survey method.

25
3 Determinants of the Increase of the Informal Economy
3.1 Increase of the Tax and Social Security Contribution Burdens
In almost all studies
11)
it has been found out, that the increase of the tax and social security
contribution burdens is one of the main causes for the increase of the informal economy.
Since taxes affect labor-leisure choices, and also stimulate labor supply in the informal
economy, or the untaxed sector of the economy, the distortion of this choice is a major
concern of economists. The bigger the difference between the total cost of labor in the official
economy and the after-tax earnings (from work), the greater is the incentive to avoid this
difference and to work in the informal economy. Since this difference depends broadly on the
social security system and the overall tax burden, they are key features of the existence and
the increase of the informal economy. But even major tax reforms with major tax rate
deductions will not lead to a substantial decrease of the informal economy. They will only be
able to stabilize the size of the informal economy and avoid a further increase. Social
networks and personal relationships, the high profit from irregular activities and associated
investments in real and human capital are strong ties which prevent people from transferring
to the official economy. For Canada, Spiro (1993) expected similar reactions of people facing
an increase in indirect taxes (VAT, GST). After the introduction of the GST in 1991 - in the
midst of a recession - , the individuals, suffering economic hardship because of the recession,
turned to the informal economy, which led to a substantial loss in tax revenue.
“Unfortunately, once this habit is developed, it is unlikely that it will be abandoned merely
because economic growth resumes.“ (Spiro 1993 p. 255). They may not return to the formal
sector, even in the long run. This fact makes it even more difficult for politicians to carry out
major reforms because they may not gain a lot from them.
12)
The most important factor in neoclassical models is the marginal tax rate. The higher the
marginal tax rate, the greater is the substitution effect and the bigger the distortion of the
labor-leisure decision. Especially when taking into account that the individual can also receive
income in the informal economy, the substitution effect is definitely larger than the income
11)
See Thomas (1992); Lippert and Walker (1997); Schneider (1994, 1997, 1998, 2000); Johnson, Kaufmann,
and Zoido-Lobatón (1998a,1998b); Tanzi (1999) and Giles (1999a) just to quote a few recent ones.
12)
See Schneider (1994b, 1998b) for a similar result of the effects of a major tax reform in Austria on the
informal economy. Schneider shows that a major reduction in the direct tax burden did not lead to a major
reduction in the informal economy. Because legal tax avoidance was abolished and other factors, like
regulations, were not changed; hence for a considerable part of the tax payers the actual tax and regulation
burden remained unchanged.

26
effect
13)
and, hence, the individual works less in the official sector. The overall efficiency of
the economy is, therefore (ceteris paribus), lower and the distortion leads to a welfare loss
(according to official GNP and taxation.) But the welfare might also be viewed as increasing,
if the welfare of those, who are working in the informal economy, were taken into account,
too.
14)
Empirical results of the influence of the tax burden on the informal economy is provided in
the studies of Schneider (1994b, 2000) and Johnson, Kaufmann and Zoido-Lobatón (1998a,
1998b); they all found strong evidence for the general influence of taxation on the informal
economy. This strong influence of indirect and direct taxation on the informal economy will
be further demonstrated by discussing empirical results in the case of Austria and the
Scandinavian countries. For Austria the driving force for the informal economy activities is
the direct tax burden (including social security payments), it has the biggest influence,
followed by the intensity of regulation and complexity of the tax system. A similar result has
been achieved by Schneider (1986) for the Scandinavian countries (Denmark, Norway and
Sweden). In all three countries various tax variables (average direct tax rate, average total tax
rate (indirect and direct tax rate)) and marginal tax rates have the expected positive sign (on
currency demand) and are highly statistically significant. Similar results are reached by
Kirchgaessner (1983, 1984) for Germany and by Klovela nd (1984) for Norway and Sweden.
Several other recent studies provide further evidence of the influence of income tax rates on
the informal economy: Cebula (1997), using Feige data for the informal economy, found
evidence of the impact of government income tax rates, IRS audit probabilities, and IRS
penalty policies on the relative size of the informal economy in the United States. Cebula
concludes that a restraint of any further increase of the top marginal income tax rate may at
least not lead to a further increase of the informal economy, while increased IRS audits and
penalties might reduce the size of the informal economy. His findings indicate that there is
generally a strong influence of state activities on the size of the informal economy: For
example, if the marginal federal personal income tax rate increases by one percentage point,
ceteris paribus, the informal economy rises by 1.4 percentage points. In another investigation,
Hill and Kabir (1996) found empirical evidence that marginal tax rates are more relevant than
average tax rates, and that a substitution of direct taxes by indirect taxes seems unlikely to
improve tax compliance. Further evidence on the effect of taxation on the informal economy
13)
If leisure is assumed to be a normal good.
14)
See Thomas (1992) p. 134-7.

27
is presented by Johnson, Kaufmann, and Zoido-Lobatón (1998b), who come to the conclusion
that it is not higher tax rates per se that increase the size of the informal economy, but the
ineffective and discretionary application of the tax system and the regulations by
governments. Their finding, that there is a negative correlation
15)
between the size of the
unofficial economy and the top (marginal) tax rates, might be unexpected. But since other
factors like tax deductibility, tax relives, tax exemptions, the choice between different tax
systems, and various other options for legal tax avoidance were not taken into account, it is
not all that surprising.
16)
On the other side Johnson, Kaufmann and Zoido-Lobatón (1998b)
find a positive correlation between the size of the informal economy and the corporate tax
burden. They come to the overall conclusion that there is a large difference between the
impact of either direct taxes or the corporate tax burden. Instit utional aspects, like the
efficiency of the administration, the extent of control rights held by politicians and
bureaucrats, and the amount of bribery and especially corruption, therefore, play a major role
in this “bargaining game“ between the government and the taxpayers.
In table 10 it is tried to provide an explanation of the different sizes of the informal economies
of some of the 21 OECD countries by comparing the overall tax and social security
contributions with the size of the informal economy of the diffe rent countries for the year
1996.
Table 10
With the exception of Spain (informal economy 22.9 %, tax and social security burden 67.2
%), Greece, Italy, Belgium and Sweden, who have the largest informal economies in 1996
also have the highest tax and social security burden (72.3, 72.9, 76.0 and 78.6%), whereas the
countries like Switzerland and U.S., who have the lowest overall tax and social security
burden (39.7 and 41.4%) they have the lowest informal economies with 7.5 and 8.8%, too! Of
course, there are exceptions, like the United Kingdom and Austria with a quite high overall
tax and social se curity burden (54.9 and 70.4%) and a quite low informal economy (13.1 and
8.3%), but the overall pictures seems to fit, the higher the overall social security and tax
burden, the higher the informal economy, ceteris paribus. The strong positive relationship that
15)
The higher the top marginal tax rate, the lower the size of the informal economy.
16)
Friedman, Johnson, Kaufmann and Zoido-Lobatón (1999) found a similar result in a cross country analysis
that higher tax rates are associated with less official activity as percent of GDP. They argue entrepreneurs go
underground not to avoid official taxes but they want to reduce the burden of bureaucracy and corruption.
However looking at their empirical (regression) results the finding that higher tax rates are correlated with a
lower share of the unofficial economy is not very robust and in most cases, using different tax rates, they do not

28
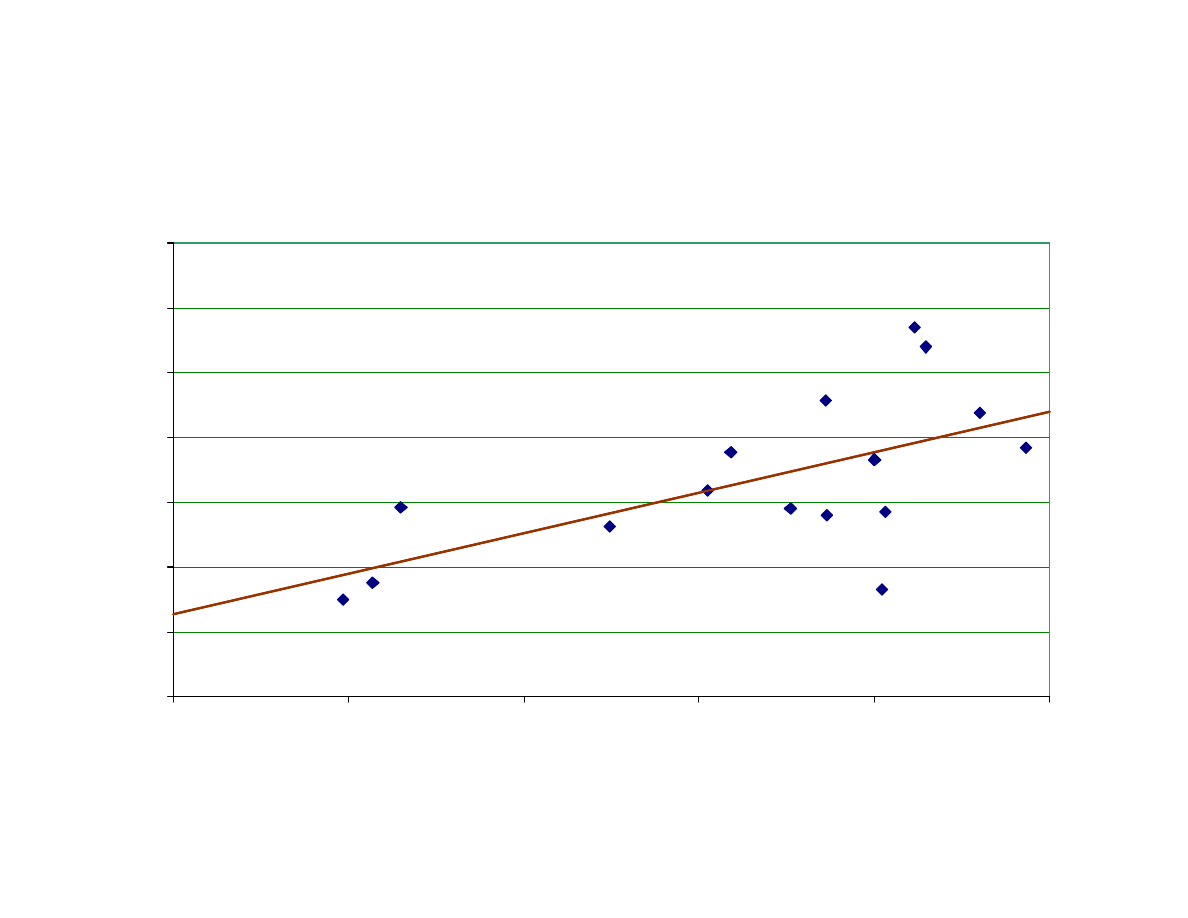
a rising tax and social security contribution burdens cause a higher informal economy, is also
demonstrated in figures 7.1 and 7.2
Figures 7.1 and 7.2
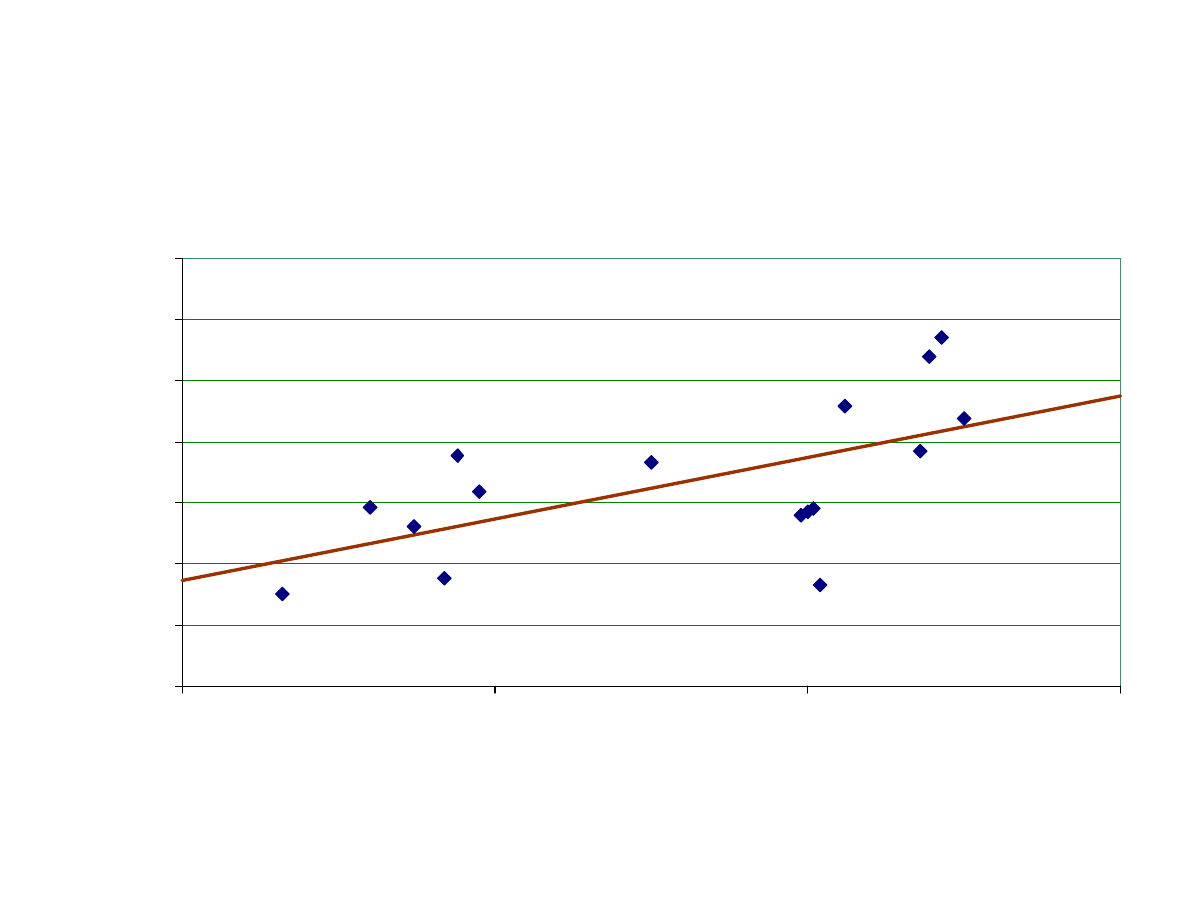
If one calculates the correlation coefficient between the tax and social security contribution
burden and the size of the informal economy, the coefficient has a value of 0.61, which is
clearly statistically significant from zero.
3.2 Intensity of Regulations
The increase of the intensity of regulations (often measured in the numbers of laws and
regulations, like licenses requirements) is another important factor, which reduces the
freedom (of choice) for individuals engaged in the official economy.
17)
One can think of labor
market regulations, trade barriers, and labor restrictions for foreigners. Johnson, Kaufmann,
and Zoido-Lobatón (1998b) find an overall significant empirical evidence of the influence of
(labor) regulations on the informal economy, the impact is clearly described and theoretically
derived in other studies, e.g. for Germany (Deregulation Commission 1990/91). Regulations
lead to a substantial increase in labor costs in the official economy. But since most of these
costs can be shifted on the employees, these costs provide another incentive to work in the
informal economy, where they can be avoided. Empirical evidence supporting the model of
Johnson, Kaufmann, and Shleifer (1997), which predicts, inter alia, that countries with more
general regulation of their economies tend to have a higher share of the unofficial economy in
total GDP, is found in their empirical analysis. A one-point increase of the regulation index
(ranging from 1 to 5, with 5 = the most regulation in a country), ceteris paribus, is associated
with an 8.1 percentage point increase in the share of the informal economy, whe n controlled
for GDP per capita (Johnson et. al. (1998b), p. 18). They conclude that it is the enforcement
of regulation, which is the key factor for the burden levied on firms and individuals, and not
the overall extent of regulation - mostly not enforced - which drive firms into the informal
economy. Friedman, Johnson, Kaufmann and Zoido-Lobaton (1999) reach a similar result.
find a statistically significant result.
17)
See for a (social) psychological, theoretical foundation of this feature, Brehm (1966, 1972), and for a (first)
application to the informal economy, Pelzmann (1988).
29
Table 10: The Size of the Informal Economy and the Burden of Taxes and Social Security Contributions in OECD
countries
Size of the
informal
economy (in
% of GDP)
Value added
tax rate (in
%)
1)
Average
direct tax
rate
(in %)
2)
Social security
contributions
by employees
rate
3)
(in %)
Social security
contributions
by employers
rate
3)
(in %)
Total social
security
contributions
rate
(in %)
sum of (4)+(5)
Total social
security
contributions +
direct tax
burden: sum
(4)+(5)+(3)
(in %)
Total tax
and social
security
burden:
sum
(2)+(3)+
(4)+(5)
1996
1996
1996
1996
1996
1996
1996
1996
Country
(1)
(2)
(3)
(4)
(5)
(6)
(7)
(8)
Greece
28.5
18.0
11.0
15.8
27.5
43.3
54.3
72.3
Italy
27.0
19.0
12.0
9.9
32.0
41.9
53.9
72.9
Spain
22.9
16.0
13.0
6.6
31.6
38.2
51.2
67.2
Belgium
21.9
21.0
19.0
10.0
26.0
36.0
55.0
76.0
Sweden
19.2
25.0
20.0
4.0
29.6
33.6
53.6
78.6
Norway
18.9
23.0
19.0
7.0
12.8
19.8
38.8
61.8
Denmark
18.3
25.0
36.0
9.0
0.0
9.0
45.0
70.0
Ireland
15.9
21.0
20.0
7.2
12.3
19.5
39.5
60.5
Canada
14.6
7.0
21.0
7.0
8.0
15.0
36.0
43.0
Germany
14.5
15.0
18.0
16.1
16.1
32.2
50.2
65.2
France
14.3
20.6
6.0
13.0
31.0
44.0
50.0
70.6
Netherlands
14.0
17.5
10.0
31.0
8.8
39.8
49.8
67.3
U.K.
13.1
17.5
16.0
10.7
10.2
21.4
37.4
54.9
USA
8.8
3.0
17.0
7.6
13.8
21.4
38.4
41.4
Austria
8.3
20.0
8.0
18.2
24.2
42.4
50.4
70.4
Switzerland
7.5
6.5
10.0
11.6
11.6
23.2
33.2
39.7
1) Rates of the year 1996; USA: Average sales tax
2) Average direct tax rate is calculated as the sum of all income taxes (+ payroll and manpower taxes) paid on wages and salaries (including income of self-employed)
divided by gross labor costs of an average income earner.
3) The rate is calculated on the basis of the annual gross earnings of an average income earner.
Source: Own calculations and OECD-working paper 176, 1997, Paris.
30
Figure 2.1: Size of the Shadow Economy vs Total Soc. Security
Contributions + Direct Tax Burden*, Year 1996
(Correlation Coefficient with AT = 0,61, without AT = 0,72)
CH
NL,FR,DE
US
UK
CA
NO
IE
AT
DK
SE
BE
ES
IT
GR
0,0
5,0
10,0
15,0
20,0
25,0
30,0
35,0
30,0
40,0
50,0
60,0
Total Soc. Security Contributions + Direct Tax Burden in %
* Sum of all income taxes paid on wages and salaries (including income of self-employed) divided by gross labor costs of an average income
earner
Shadow Economy in % of GDP (1996)
7.2:
31
Figure 2.2: Size of the Shadow Economy vs
Total Tax* and Soc. Security Burden, Year 1996
(Correlation Coefficient with AT = 0,62, without AT = 0,74)
ES
CH
US
CA
UK
IE
NO
GE
NL
FR
AT
DK
BE
SE
IT
GR
0,0
5,0
10,0
15,0
20,0
25,0
30,0
35,0
30,0
40,0
50,0
60,0
70,0
80,0
Total Tax and Soc. Security Burden in %
* Value added tax rate and average direct tax rate in %
Shadow Economy in % of GDP (1996)
7.2:

32
In their study every available measure of regulation is significantly correlated with the share
of the unofficial economy and the sign of the relationship is unambiguous: more regulation is
correlated with a larger informal economy. A one point increase in an index of regulation
(ranging from 1-5) is associated with a 10 % increase in the informal economy for 76
developing, transition and developed countries.
These findings demonstrate that governments should put more emphasis on improving
enforcement of laws and regulations, rather than increasing their number. Some governments,
however, prefer this policy option (more regulations and laws), when trying to reduce the
informal economy, mostly because it leads to an increase in power of the bureaucrats and to a
higher rate of employment in the public sector.
3.3 Public Sector Services
An increase of the informal economy leads to reduced state revenues which in turn reduces
the quality and quantity of publicly provided goods and services. Ultimately, this can lead to
an increase in the tax rates for firms and individuals in the official sector , quite often
combined with a deterioration in the quality of the public goods (such as the public
infrastructure) and of the administration, with the consequence of even stronger incentives to
participate in the informal economy. Johnson, Kaufmann, and Zoido-Lobatón (1998b) present
a simple model of this relationship. Their findings show that smaller informal economies
appear in countries with higher tax revenues, if achieved by lower tax rates, fewer laws and
regulations and less bribery facing enterprises. Countries with a better rule of the law, which
is financed by tax revenues, also have smaller informal economies. Transition countries have
higher levels of regulation leading to a significantly higher incidence of bribery, higher
effective taxes on official activities and a large discretionary framework of regulations and
consequently to a higher informal economy. The overall conclusion is that “wealthier
countries of the OECD, as well as some in Eastern Europe find themselves in the ‘good
equilibrium’ of relatively low tax and regulatory burden, sizeable revenue mobilization, good
rule of law and corruption control, and [relatively] small unofficial economy. By contrast, a
number of countries in Latin American and the Former Soviet Union exhibit characteristics
consistent with a ‘bad equilibrium’: tax and regulatory discretion and burden on the firm is
high, the rule of law is weak, and there is a high incidence of bribery and a relatively high
share of activities in the unofficial economy.“ (Johnson, Kaufmann and Zoido-Lobatón 1998a

33
p. I).
4 Methods to Estimate the Size of the Informal Economy
18)
As has already been mentioned in chapter 2 to undertake attempts to measure the size of a
informal economy is a difficult and challenging task. In this chapter a comprehensive
overview is given about the current knowledge of the various procedures to estimate the
informal economy. To measure the size and development of the informal economy three
different types of methods are most widely used. They are briefly disc ussed in the following
three subsections.
4.1 Direct Approaches
These are micro approaches which employ either well designed surveys and samples based on
voluntary replies or tax auditing and other compliance methods. Sample surveys designed for
estimation of the informal economy are widely used in a number of countries
19)
to measure
the informal economy. The main disadvantage of this method is that it presents the flaws of
all surveys: average precision and results depend greatly on the respondents willingness to
cooperate. It is difficult to asses the rise of the undeclared work from a direct questionnaire.
Most interviewed hesitate to confess a fraudulent behavior and quite often responses are
rarely reliable so that it is difficult, from this type of answers, to calculate a real estimate – in
monetary terms – of the extend of undeclared work. The main advantage of this method lies in
the detailed information about the structure of the informal economy, but the results from
these kinds of surveys are very sensitive to the way the questionnaire is formulated
20)
.
Estimates of the informal economy can also be based on the discrepancy between income
declared for tax purposes and that measured by selective checks. Fiscal auditing programs
have been particularly effective in this regard. Designed to measure the amount of undeclared
taxable income, they have been used to calculate the informal economy in several countries.
21)
A number of difficulties beset this approach. Firstly, using tax compliance data is equivalent
18)
This chapter closely follows Schneider and Enste (2000).
19)
The direct method of voluntary sample surveys has been extensively used for Norway by Isachsen, Klovland
and Strom (1982), and Isachsen and Strom (1985). For Denmark this method is used by Mogensen (et. al., 199 5)
in which they report „estimates“ of the informal economy of 2.7 percent of GDP for 1989, of 4.2 percent of GDP
for 1991, of 3.0 percent of GDP for 1993 and of 3.1 percent of GDP for 1994.
20)
The advantages and disadvantages of this method are extensively dealt by Mogensen et. al (1995) in their
excellent and very carefully done investigation.
21)
In the United States, IRS (1979, 1983), Simon and Witte (1982), Witte (1987), Clotefelter (1983), and Feige
(1986). For a more detailed discussion, see Dallago (1990) and Thomas (1992).

34
to using a (possibly biased) sample of the population. However, since in general a selection of
tax payers for tax audit is not random, but based on properties of submitted (tax) returns
which indicate a certain likelihood of (tax) fraud, such a sample is not a random one of the
whole population. This factor is likely to bias compliance – based estimates of the black
economy. Secondly, estimates based on tax audits reflect that portion of black economy
income which the authorities succeeded in discovering and this is likely to be only a fraction
of hidden income.
A further disadvantage of the two direct methods (surveys and tax auditing) is that they lead
only to point estimates. Moreover, it is unlikely that they capture all „informal“ activities, so
they can be seen as providing lower bound estimates. They are unable (at least at present) to
provide estimates of the development and growth of the informal economy over a longer
period of time. As already argued, they have, however at least one considerable advantage -
they can provide detailed information about informal economy activities and the structure and
composition of those who work in the informal economy.
4.2 Indirect Approaches
These approaches, which are also called „indicator“ approaches, are mostly macroeconomic
ones and use various economic and other indicators that contain information about the
development of the informal economy (over time). Currently there are five indicators which
leave some „traces“ of the development of the informal economy:
4.2.1 The Discrepancy between National Expenditure and Income Statistics
This approach is based on discrepancies between income and expenditure statistics. In
national accounting the income measure of GNP should be equal to the expenditure measure
of GNP. Thus, if an independent estimate of the expenditure site of the national accounts is
available, the gap between the expenditure measure and the income measure can be used as an
indicator of the extend of the black economy.
22)
However, since national accounts statisticians
will be anxious to minimize this discrepancy, the initial discrepancy or first estimate, rather
than the published discrepancy should be employed for this purpose. If all the components of
the expenditure site where measured without error, then this approach would indeed yield a
good estimate of the scale of the informal economy. However, unfortunately, this is not the
22)
See, e.g., Franz (1983) for Austria; MacAfee (1980) O’Higgins (1989) and Smith (1985), for Great Britain;
Petersen (1982) and Del Boca (1981) for Germany; Park (1979) for the United States. For a survey and critical
remarks, see Thomas (1992).

35
case and the discrepancy, therefore, reflects all omissions and errors everywhere in the
national accounts statistics as well as the informal economy activity. These estimates may
therefore be very crude and of questionable reliability.
23)
4.2.2 The Discrepancy between the Official and Actual Labor Force
A decline in participation of the labor force in the official economy can be seen as an
indication of increased activity in the informal economy. If total labor force participation is
assumed to be constant, a decreasing official rate of participation can be seen as an indicator
of an increase in the activities in the informal economy, ceteris paribus.
24)
The weakness of
this method is that differences in the rate of participation may also have other causes.
Moreover, people can work in the informal economy and have a job in the „official’ economy.
Therefore such estimates may be viewed as weak indicators of the size and development of
the informal economy.
4.2.3 The Transactions Approach
This approach has been developed by Feige.
25)
It assumes, that there is a constant relation
over time between the volume of transaction and official GNP. Feige’s approach therefore
starts from Fisher’s quantity equation, M*V = p*T (with M = money, V = velocity, p = prices,
and T = total transactions). Assumptions have to be made about the velocity of money and
about the relatio nships between the value of total transactions (p*T) and total (=official +
unofficial) nominal GNP. Relating total nominal GNP to total transactions, the GNP of the
informal economy can be calculated by subtracting the official GNP from total nominal GNP.
However, to derive figures for the informal economy, Feige has to assume a base year in
which there is no informal economy, and therefore the ratio of p*T to total nominal (official =
total) GNP was „normal“ and would have been constant over time, if there had been no
informal economy. This method, too, has several weaknesses: for instance, the assumption of
a base year with no informal economy, and the assumption of a „normal“ ratio of transactions
constant over time. Moreover, to obtain reliable informal economy estimates, precise figures
of the total volume of transactions should be available. This availability might be especially
difficult to achieve for cash transactions, because they depend, among other factors, on the
23)
A related approach is pursued by Pissarides and Weber (1988), who use micro data from household budget
surveys to estimate the extend of income understatement by self -employed. Also in this micro approach more or
less the same difficulties arise and the figures calculated for the informal economies may be crude.
24)
Such studies have been made for Italy, see e.g., Contini (1981) and Del Boca (1981); for the United States,
see O’Neill (1983), for a survey and critical remarks, see Thomas (1992).
25)
For an extended description of this approach, see Feige (1996); for a further application for the Netherlands,
Boeschoten and Fase (1984), and for Germany, Langfeldt (1984).

36
durability of bank notes, in terms of the quality of the papers on which they are printed.
26)
Also, in this approach the assumption is made that all variations in the ratio between the total
value of transaction and the officially measured GNP are due to the informal economy. This
means that a considerable amount of data is required in order to eliminate financial
transactions from “pure” cross payments, which are totally legal and have nothing to do with
the informal economy. In general, although this approach is theoretically attractive, the
empirical requirements necessary to obtain reliable estimates are so difficult to fulfil, that its
application may lead to doubtful results.
4.2.4 The Currency Demand Approach
The currency demand approach was first used by Cagan (1958), who calculated a correlation
of the currency demand and the tax pressure (as one cause of the informal economy) for the
United States over the period 1919 to 1955. 20 years later, Gutmann (1977) used the same
approach, but did not use any statistical procedures; instead he „only“ looked at the ratio
between currency and demand deposits over the years 1937 to 1976.
Cagan’s approach was further developed by Tanzi (1980, 1983), who econometrically
estimated a currency demand function for the United States for the period 1929 to 1980 in
order to calculate the informal economy. His approach assumes that informal (or hidden)
transactions are undertaken in the form of cash payments, so as to leave no observable traces
for the authorities. An increase in the size of the informal economy will therefore increase the
demand for currency. To isolate the resulting „excess“ demand for currency, an equation for
currency demand is econometrically estimated over time. All conventional possible factors,
such as the development of income, payment habits, interest rates, and so on, are controlled
for. Additionally, such variables as the direct and indirect tax burden, government regulation
and the complexity of the tax system, which are assumed to be the major factors causing
people to work in the informal economy, are included in the estimation equation. The basic
regression equation for the currency demand, proposed by Tanzi (1983), is the following:
ln (C / M
2
)
t
=
β
O
+
β
1
ln (1 + TW)
t
+
β
2
ln (WS / Y)
t
+
β
3
ln R
t
+
β
4
ln (Y / N)
t
+ u
t
with
β
1
> 0,
β
2
> 0,
β
3
< 0,
β
4
> 0
where
26)
For a detailed criticism of the transaction approach see Boeschoten and Fase (1984), Frey and Pommerehne
(1984), Kirchgaessner (1984), Tanzi (1982, 1986), Dallago (1990), Thomas (1986, 1992, 1999) and Giles
(1999a).

37
ln denotes natural logarithms,
C / M
2
is the ratio of cash holdings to current and deposit accounts,
TW is a weighted average tax rate (to proxy changes in the size of the informal economy),
WS / Y is a proportion of wages and salaries in national income (to capture changing payment
and money holding patterns),
R is the interest paid on savings deposits (to capture the opportunity cost of holding cash) and
Y / N is the per capita income.
27)
The „excess“ increase in currency, which is the amount unexplained by the conventional or
normal factors (mentioned above) is then attributed to the rising tax burden and the other
reasons leading people to work in the informal economy. Figures for the size and
development of the informal economy can be calculated in a first step by comparing the
difference between the development of currency when the direct and indirect tax burden (and
government regulations) are held at its lowest value, and the development of currency with
the current (much higher) burden of taxation and government regulations. Assuming in a
second step the same income velocity for currency used in the informal economy as for legal
M1 in the official economy, the size of the informal can be computed and compared to the
official GDP.
The currency dema nd approach is one of the most commonly used approaches. It has been
applied to many OECD countries,
28)
but has nevertheless been criticized on various
grounds.
29)
The most commonly raised objections to this method are:
(i)
Not all transactions in the informal economy are paid in cash. Isachsen and Strom
(1985) used the survey method to find out that in Norway, in 1980, roughly 80 percent
of all transactions in the hidden sector were paid in cash. The size of the total informal
economy (including barter) may thus be even larger than previously estimated.
(ii)
Most studies consider only one particular factor, the tax burden, as a cause of the
informal economy. But others (such as the impact of regulation, taxpayers’ attitudes
toward the state, „tax morality“ and so on) are not considered, because reliable data
for most countries is not available. If, as seems likely, these other factors also have an
27)
The estimation of such a currency demand equation has been criticized by Thomas (1999) but part of this
criticism has been considered by the work of Giles (1999a, 1999b) and Bhattacharyya (1999), who both use the
latest econometric technics.
28)
See Schneider (1997, 1998a), Johnson, Kaufmann and Zoido-Lobatón (1998a), and Williams and Windebank
(1995).

38
impact on the extent of the hidden economy, it might again be higher than reported in
most studies.
30)
(iii)
A further weakness of this approach, at least when applied to the United States, is
discussed by Garcia (1978), Park (1979), and Feige (1996), who point out that
increases in currency demand deposits are due largely to a slowdown in demand
deposits rather than to an increase in currency caused by activities in the informal
economy.
(iv)
Blades (1982) and Feige (1986, 1996), criticize Tanzi’s studies on the grounds that the
US dollar is used as an international currency. Tanzi should have considered (and
controlled for) the US dollars, which are used as an international currency and held in
cash abroad.
31)
Moreover, Frey and Pommerehne (1984) and Thomas (1986, 1992,
1999) claim that Tanzi’s parameter estimates are not very stable.
32)
(v)
Another weak point of this procedure, in most studies, is the assumption of the same
velocity of money in both types of economies. As Hill and Kabir (1996) for Canada
and Klovland (1984) for the Scandinavian countries argue, there is already
considerable uncertainty about the velocity of money in the official economy; the
velocity of money in the hidden sector is even more difficult to estimate. Without
knowledge about the velocity of currency in the informal economy, one has to accept
the assumption of an „equal“ money velocity in both sectors.
(vi)
Finally, the assumption of no informal economy in a base year is open to criticism.
Relaxing this assumption would again imply an upward adjustment of the figures
attained in the bulk of the studies already undertaken.
29)
See Thomas (1992, 1999), Feige (1986), and Pozo (1996).
30)
One (weak) justification for the use of only the tax variable is that this variable has by far the strongest impact
on the size of the informal economy in the studies known to the authors. The only exception is the study by Frey
and Weck-Hannemann (1984) where the variable „tax immorality“ has a quantitatively larger and statistically
stronger influence than the direct tax share in the model approach. In the study of Pommerehne and Schneider
(1985), for the U.S., besides various tax measures, data for regulation, tax immorality, minimum wage rates are
available, the tax variable has a dominating influence and contributes roughly 60 -70 percent to the size of the
informal economy. See also Zilberfarb (1986).
31)
In another study by Tanzi (1982, esp. pp. 110-113) he explicitly deals with this criticism. A very careful
investigation of the amount of US-$ used abroad and the US currency used in the informal economy and to
"classical" crime activities has been undertaken by Rogoff (1998), who concludes that large denomination bills
are major driving force for the growth of the informal economy and classical crime activities due to reduced
transactions costs.
32)
However in studies for European countries Kirchgaessner (1983, 1984) and Schneider (1986) reach the
conclusion that the estimation results for Germany, Denmark, Norway and Sweden are quite robust when using
the currency demand method. Hill and Kabir (1996) find for Canada that the rise of the informal economy varies
with respect to the tax variable used; they conclude „when the theoretically best tax rates are selected and a range
of plausible velocity values is used, this method estimates underground economic growth between 1964 and
1995 at between 3 and 11 percent of GDP.“ (Hill and Kabir [1996, p. 1553]).

39
4.2.5 The Physical Input (Electricity Consumption) Method
(1) The Kaufmann - Kaliberda Method
33)
To measure overall (official and unofficial) economic activity in an economy, Kaufmann and
Kaliberda (1996) assume that electric-power consumption is regarded as the single best
physical indicator of overall economic activity. Overall (official and unofficial) economic
activity and electricity consumption have been empirically observed throughout the world to
move in lockstep with an electricity/GDP elasticity usually close to one. By having a proxy
measurement for the overall economy and subtracting it from estimates of official GDP,
Kaufmann and Kaliberda derive an estimate of unofficial GDP. This means, that Kaufmann
and Kaliberda suggest, that the growth of total electricity consumption is an indicator for
representing a growth of official and unofficial GDP. According to this approach, the
difference between the gross rate of registered (official) GDP and the cross rate of total
electricity consumption can be attributed to the growth of the informal economy. This method
is very simple and appealing, however, it can also be criticized on various grounds:
(i)
Not all informal economy activities require a considerable amount of electricity (e.g.
personal services), and other energy sources can be used (gas, oil, coal, etc.), so that
only a part of the informal economy will be captured.
(ii)
Over time, there has been considerable technical progress. Both the production and
use of electricity are more efficient than in the past, and that will apply in both official
and unoffic ial uses.
(iii)
There may be considerable differences or changes in the elasticity of electricity/GDP
across countries and over time.
34)
(2) The Lackó Method
Lackó (1996, 1998, 1999) assumes that a certain part of the informal economy is associated
with the household consumption of electricity. It comprises, among others, the so-called
household production, do-it-yourself activities, and other non registered production and
services. Lackó assumes that in countries where the section of the informal economy
associa ted with the hous ehold electricity consumption is high, the rest of the hidden economy,
33)
This method was used earlier by Lizzeri (1979), Del Boca and Forte (1982), and then was used much later by
Portes (1996), Kaufmann and Kaliberda (1996), Johnson, Kaufmann and Shleifer (1997). For a critique see
Lackó (1998).
34)
Johnson, Kaufmann and Shleifer (1997) make an attempt to adjust for changes in the elasticity of
electricity/GDP.

40
that is the part Lackó cannot measure, will also be high. Lackó (1996, pp.19 ff.) assumes that
in each country a part of the household consumption of electricity is used in the informal
economy.
Lackó’s approach (1998, p.133) can be described by the following two equations:
ln E
i
=
α
1
ln C
i
+
α
2
ln PR
i
+
α
3
G
i
+
α
4
Q
i
+
α
5
H
i
+ u
i
(1)
with
α
1
> 0,
α
2
< 0,
α
3
> 0,
α
4
< 0,
α
5
> 0
H
i
=
β
1
T
i
+
β
2
(S
i
– T
i
) +
β
3
D
i
(2)
with
β
1
> 0,
β
2
< 0,
β
3
> 0
where
i: the number assigned to the country,
E
i
: per capita household electricity consumption in country i in Mtoe,
C
i
: per capita real consumption of households without the consumption of electricity in
country i in US dollars (at purchasing power parity),
PR
i
: the real price of consumption of 1 kWh of residential electricity in US dollars (at
purchasing power parity),
G
i
: the relative frequency of months with the need of heating in houses in country i,
Q
i
: the ratio of energy sources other than electricity energy to all energy sources in household
energy consumption,
H
i
: the per capita output of the hidden economy,
T
i
: the ratio of the sum of paid personal income, corporate profit and taxes on goods and
services to GDP,
S
i
: the ratio of public social welfare expenditures to GDP, and
D
i
: the sum on number of dependants over 14 years and of inactive earners, both per 100
active earners.
In a cross country study, she econometrically estimates equation (1) substituting H
i
by
equa tion (2). The econometric estimation results can then be used to establish an ordering of
the countries with respect to electricity use in their informal economies. For the calculation of
the actual size (value added) of the informal economy, Lackó should know how much GDP is
produced by one unit of electricity in the informal economy of each country. Since these data
are not known, she takes the result of one of the known informal economy estimations, that
were carried out for a market economy with another approach for the early 1990s, and she
applies this proportion to the other countries. Lackó used the informal economy of the United

41
States as such a base (the informal economy value of 10.5% of GDP taken from
Morris(1993)), and then she calculates the siz e of the informal economy for other countries.
Lackó's method is also open to criticism:
(i)
Not all informal economy activities require a considerable amount of electricity and
other energy sources can be used.
(ii)
Informal economy activities do not take place only in the household sector.
(iii)
It is doubtful whether the ratio of social welfare expenditures can be used as the
explanatory factor for the informal economy, especially in transition and developing
countries.
(iv)
It is questionable which is the most reliable base value of the informal economy in
order to calculate the size of the informal economy for all other countries, especially,
for the transition and developing countries.
4.3 The model approach
35
All methods described so far that are designed to estimate the size and development of the
informal economy consider just one indicator that “must” capture all effects of the informal
economy. However, it is obvious that its effects show up simultaneously in the production,
labor, and money markets. An even more important critique is that the causes which
determine the size of the hidden economy are taken into account only in some of the monetary
approach studies which usually consider one cause, the burden of taxation. The model
approach explicitly considers multiple ca uses leading to the existence and growth as well as
the multiple effects of the informal economy over time. The empirical method used is quite
different from those used so far. It is based on the statistical theory of unobserved variables,
which considers multiple causes and multiple indicators of the phenomenon to be measured.
For the estimation, a factor-analytic approach is used to measure the hidden economy as an
unobserved variable over time. The unknown coefficients are estimated in a set of structural
equations within which the “unobserved” variable cannot be measured directly. The
DYMIMIC (dynamic multiple-indicators multiple-causes) model consists in general of two
parts, the measurement model links the unobserved variables to observed indicators. The
35)
This part is a summarized version from a longer study by Aigner, Schneider, and Ghosh (1988, p. 303),
applying this approach for the United States over time. The pioneers of this approach are Weck (1983), Frey and
Weck-Hannemann (1984), who applied this approach to cross-section data from the 24 OECD countries for
various years. Before turning to this approach they developed the concept of „soft modeling“ (Frey, Weck, and
Pommerehne (1982), Frey and Weck (1983a and 1983b)), an approach which has been used to provide a ranking
of the relative size of the informal economy in different countries.

42
structural equations model specifies causal relationships among the unobserved variables. In
this case, there is one unobserved variable, the size of the informal economy. It is assumed to
be influenced by a set of indicators for the informal economy’s size, thus capturing the
structural dependence of the informal economy on variables that may be useful in predicting
its movement and size in the future. The interaction over time between the causes Z
it
(i = 1, 2,
..., k) the size of the informal economy X
t
, and the indicators Y
jt
(j = 1, 2, ..., p) is shown in
Figure 8.
Figure 8: Development of the informal economy over time.
There is a large body of literature
36)
on the possible causes and indicators of the informal
economy, in which the following three types of causes are distinguished:
Causes
(i)
The burden of direct and indirect taxation, both actual and perceived: a rising burden
of taxation provides a strong incentive to work in the informal economy.
(ii)
The burden of regulation as proxy for all other state activities: it is assumed that
increases in the burden of regulation give a strong incentive to enter the informal
economy.
(iii)
The „tax morality“ (citizens’ attitudes toward the state), which describes the readiness
of individuals (at least partly) to leave their official occupations and enter the informal
36)
Thomas (1992); Schneider (1994a, 1997); Pozo (1996); Johnson, Kaufmann and Zoido-Lobatón (1998a,
1998b); and Giles (1999a, 1999b).
Y
1t
Y
2t
...
Y
pt
Causes
Indicators
Development of the informal
economy over time
X
t
Z
1t
Z
2t
...
Z
kt
X
t-1
↓

43
economy: it is assumed that a declining tax morality tends to increase the size of the
informal economy.
37)
Indicators
A change in the size of the informal economy may be reflected in the follo wing indicators:
(i)
Development of monetary indicators: if activities in the informal economy rise,
additional monetary transactions are required.
(ii)
Development of the labor market: increasing participation of workers in the hidden
sector results in a decrease in participation in the official economy. Similarly,
increased activities in the hidden sector may be expected to be reflected in shorter
working hours in the official economy.
(iii)
Development of the production market: an increase in the informal economy means
that inputs (especially labor) move out of the official economy (at least partly); this
displacement might have a depressing effect on the official growth rate of the
economy.
The latest use of the model approach has been undertaken by Giles (1999a, 1999b) and by
Giles, Linsey and Gupsa (1999), and Giles and Tedd (2002). They basically estimates a
comprehensive (dynamic) MIMIC model to get a time serious index of the hidden/measured
output of New Zealand or Canada, and then estimate a separate “cash-demand model” to
obtain a benchmark for converting this index into percentage units. Unlike earlier empirical
studies of the hidden economy, they paid proper attention to the non-stationary, and possible
co-integration of time serious data in both models. Again this DYMIMIC model treats hidden
output as a latent variable, and uses several (measurable) causal variables and indicator
variables. The former include measures of the average and ma rginal tax rates, inflation, real
income and the degree of regulation in the economy. The latter include changes in the (male)
labor force participation rate and in the cash/money supply ratio. In their cash-demand
equation they allow for different velocities of currency circulation in the hidden and recorded
economies. Their cash-demand equation is not used as an input to determine the variation in
the hidden economy over time – it is used only to obtain the long-run average value of
hidden/measured output, so that the index for this ratio predicted by the DYMIMIC model
can be used to calculate a level and the percentage units of the informal economy. Giles latest
37)
When applying this approach for European countries, Frey and Weck-Hannemann (1984) had the difficulty in
obtaining reliable data for the cause series, besides the ones of direct and indirect tax burden. Hence, their study
was criticized by Helberger and Knepel (1988), who argue that the results were unstable with respect to

44
combination of the currency demand and DYMIMIC approach clearly shows that some
progress in the estimation technique of the informal economy has been achieved and a
number of critical points have been ove rcome.
5 Summary and Conclusions
There are many obstacles to be overcome to measure the size of the informal economy (in
value added and in the labor force) and to analyze its consequences on the official economy,
although some progress has been made. In this paper has been shown that though it is difficult
to estimate the size of the informal economy (in value added and in the labor force), it is not
impossible. I have demonstrated that with various methods, e.g. the currency demand, the
physical input measure the discrepancy method and the model approach, some insights can be
provided into the size and development of the informal economy (labor force) of the
developing, transition and the OECD countries. The general impression from the results of
these methods is that for all countries investigated the informal economy (labor force) has
reached a remarkably large size. The results are shown in table 11.
Table 11
To summarize: As it has already been argued, there is no „best“ or commonly accepted
method; each approach has its specific strengths and weaknesses as well as specific insights
and results. Although the different methods provide a rather wide range of estimates, there is a
common finding that the size of the in formal economies for most transition and all
investigated OECD countries has been growing over the recent decade. A similar finding can
be made for the „informal labor market“ which is attracting a growing attention due to high
unemployment in European OECD countries. Furthermore, the results of this study show that
an increasing burden of taxation and social security payments, combined with rising state
regulatory activities, are the major driving forces for the size and growth of the informal
economy. Finally, to conclude: Informal economies are a complex phenomenon, present to an
important extent even in the industrialized and developed economies. People engage in
informal economic activity for a variety of reasons, among most important, of which we can
count are government actions, most notable taxation and regulation. With these two insights,
goes a third, no less important one: a government aiming to decrease informal economic
activity has to first and foremost analyze the complex and frequently contradictory
relationships among consequences of its own policy decisions.
changing variables in the model and over the years.

45
Table 11: Average Size of the Informal Economy for Developing, Transition and OECD-Countries in Terms of
Value-Added and of the Labor Force over two periods (1999/2000)
Average Size of the Informal Economy
– Value added in % of official GDP
1999/2000
Average Size of the Informal Economy
Labor Force in % of official Labor
Force 1999/2000
Countries
Currency Demand and DYMIMIC method
(Number of Countries)
Survey and Discrepancy Methods
(Number of Countries)
Developing countries:
Africa
42
(23)
48.2
(23)
Central and South America
41
(18)
45.1
(18)
Asia
1)
29
(26)
33.4
(26)
Transition countries
35
(23)
-
Western OECD Countries - Europe
18
(16)
16.4
(7)
North American and Pacific OECD
Countries
13.5
(4)
-
1) Here not all countries are developing countries like Japan, Singapore or Hongkong.
Source: Own calculations
.

46
References
Aigner, Dennis; Schneider, Friedrich and Damayanti Ghosh (1988): Me and my informal:
estimating the size of the US hidden economy from time series data, in W. A. Barnett; E.
R. Berndt and H. White (eds.): Dynamic econometric modeling , Cambridge (Mass.):
Cambridge University Press, pp. 224-243.
Andreoni, James; Erard, Brian, and Jonathan Feinstein (1998): Tax compliance. Journal of
Economic Literature, 36, pp. 818-860.
Bagachwa, M.S.D. and A. Naho (1995): Estimating the second economy in Tanzania, World
Development, 23, no. 8, pp. 1387-1399.
Bhattacharyya, D.K. (1999): On the Economic Rationale of Estimating the Hidden Economy,
The Economic Journal 109/456, pp. 348-359.
Blades, Derek (1982): “The Hidden Economy and the National Accounts”, OECD
(Occasional Studies), Paris, pp. 28-44.
Boeschoten, Werner C. and Marcel M.G. Fase (1984): The volume of payments and the
informal economy in the Netherlands 1965 -1982, M. Nijhoff, Dordrecht.
Brehm, J.W. (1966): A theory of psychological reactance. New York (Academic Press).
Brehm, J.W. (1972): Responses to loss of freedom. A theory of psychological reactance.
Morristown (General Learning Press).
Cagan, Phillip (1958): “The Demand for Currency Relative to the Total Money Supply,”
Journal of Political Economy, 66:3, pp. 302-328.
Cebula, Richard J. (1997): “An Empirical Analysis of the Impact of Government Tax and
Auditing Policies on the Size of the Underground Economy: The Case of the United
States, 1993-94:” American Journal of Economics and Sociology, 56:2, pp.173-185.
Clotefelter, Charles T. (1983): Tax evasion and tax rates: An analysis of individual return,
Review of Economic Statistics , 65/3, pp. 363-373.
Contini, Bruno (1981): Labor market segmentation and the development of the parallel
economy – the Italian experience, Oxford Economic Papers, 33/4, pp. 401-12.
Del Boca, Daniela. (1981): Parallel economy and allocation of time, Micros (Quarterly
Journal of Microeconomics), 4/2, pp. 13-18.
Del Boca, Daniela and Francesco Forte (1982): Recent empirical surveys and theoretical
interpretations of the parallel economy in Italy; Tanzi, Vito (1982) (ed.): The
underground economy in the United States and abroad , Lexington (Mass.), Lexington,
pp. 160-178.
Feige, Edgar L. (1986): A re-examination of the “Underground Economy” in the United
States. IMF Staff Papers, 33/ 4, pp. 768-781.
Feige, Edgar L. (1989) (ed.): The underground economies. Tax evasion and information
distortion . Cambridge, New York, Melbourne, Cambridge University Press.
Feige, Edgar L. (1994): The underground economy and the currency enigma, Supplement to
Public Finance/ Finances Publiques, 49, pp. 119-136.
Feige, Edgar L. (1996): Overseas holdings of U.S. currency and the underground economy,
in: Pozo, Susan (ed.): Exploring the Underground Economy. Kalamazoo, Michigan, pp.
5-62.
Franz, A. (1983): Wie groß ist die “schwarze” Wirtschaft?, Mitteilungsblatt der
Österreichischen Statistischen Gesellschaft, 49/1, pp. 1-6.

47
Frey, Bruno S. and Hannelore Weck (1983a): “Bureaucracy and the Informal Economy: A
Macro-Approach”, in Horst Hanusch (ed.): Anatomy of Government Deficiencies. Berlin:
Springer, pp. 89-109.
Frey, Bruno S. and Hannelore Weck (1983b): “Estimating the Informal Economy: A ‘Naive’
Approach,” Oxford Economic Papers, 35, pp. 23-44.
Frey, Bruno S. and Hannelore Weck-Hannemann (1984): The hidden economy as an
“unobserved” variable, European Economic Review, 26/1, pp. 33-53.
Frey, Bruno S. and Werner Pommerehne (1984): The hidden economy: State and prospect for
measurement, Review of Income and Wealth , 30/1, pp. 1-23.
Frey, Bruno S., Weck Hannelore and Werner W. Pommerehne (1982): Has the informal
economy grown in Germany? An exploratory study, Weltwirtschaftliches Archiv , 118/4,
pp. 499-524.
Friedman, E., Johnson, S., Kaufmann, D. and Zoido-Labton, P. (1999): Dodging the grabbing
hand: The determinants of unofficial activity in 69 countries, Discussion paper,
Washington D.C: World Bank.
Garcia, Gillian (1978): “The Currency Ratio and the Subterranean Economy,” Financial
Analysts Journal, 69:1, pp. 64-66.
Giles, David, E.A. (1999a): Measuring the hidden economy: Implications for econometric
modelling, The Economic Journal, 109/456, pp.370-380.
Giles, David, E.A. (1999b): Modelling the hidden economy in the tax-gap in New Zealand,
Working paper, Department of Economics, University of Victoria, Canada.
Giles, David, E.A., Tedds, Linsey, M. and Werkneh, Gugsa (1999): The Canadian
underground and measured economies, Working paper, Department of Economics,
Unive rsity of Victoria, Canada.
Giles, David, E.A. and Linsey M. Tedds (2002): Taxes and the Canadian Underground
Economy, Canadian Tax Paper No. 106, Cana dian Tax Foundation, Toronto/Ontario.
Gutmann, Pierre M. (1977): “The Subterranean Economy,” Financial Analysts Journal, 34:1,
pp. 24-27.
Hartzenburg, G.M. and Leimann, A.: The Informal Economy and its Growth Potential, In:
Adebian, E. and Standish, B. (eds.) Economic Growth in South Africa , Oxford: Oxford
University Press, 1992, pp. 187-214.
Helberger, Claus and Hans Knepel (1988): “How big is the informal economy? A re-analysis
of the unobserved-variable approach of B. S. Frey and H. Weck-Hannemann”, Euro pean
Economic Journal, 32, pp. 965-76.
Hill, Roderick and Muhammed Kabir (1996): Tax rates, the tax mix, and the growth of the
underground economy in Canada: What can we infer? Canadian Tax Journal/ Revue
Fiscale Canadienne, 44/ 6, pp. 1552-1583.
IRS (1979): Estimates of income unreported on individual tax reforms, Washington D.C.:
Internal revenue service, U.S. Department of the Treasury.
IRS (1983): Income tax compliance research: Estimates for 1973-81, Washington D.C.:
Internal revenue service, U.S. Depa rtment of the Treasury.
Isachsen, Arne J. and Steinar Strom (1985): The size and growth of the hidden economy in
Norway, Review of Income and Wealth, 31/1, pp. 21-38.
Isachsen, Arne J.; Klovland, Jan and Steinar Strom (1982): The hidden economy in Norway,
in: Tanzi Vito (ed.): The underground economy in the United States and Abroad, Heath,
Lexington, pp. 209-231.

48
Johnson, Simon; Kaufmann, Daniel; and Andrei Shleifer (1997): The unofficial economy in
transition , Brookings Papers on Economic Activity, Fall, Washington D.C.
Johnson, Simon; Kaufmann, Daniel and Pablo Zoido-Lobatón (1998a): Regulatory discretion
and the unofficial economy. The American Economic Review, 88/ 2, pp. 387-392.
Johnson, Simon; Kaufmann, Daniel and Pablo Zoido-Lobatón (1998b): Corruption, pub lic
finances and the unofficial economy. Washington, D.C.: The World Bank, discussion
paper.
Kaufmann, Daniel and Kaliberda, Aleksander (1996), Integrating the unofficial economy into
the dynamics of post socialist economies: A framework of analyses and evidence,
Washington, D.C., The Worldbank, Policy research working paper 1691 .
Kirchgaessner, Gebhard (1983): Size and development of the West German informal
economy, 1955-1980, Zeitschrift für die gesamte Staatswissenschaft, 139/2, pp. 197-214.
Kirchgaessner, Gebhard (1984): Verfahren zur Erfassung des in der Schattenwirtschaft
erarbeiteten Sozialprodukts, Allgemeines Statistisches Archiv, 68/4, pp. 378-405.
Klovland, Jan (1984): “Tax Evasion and the Demand for Currency in Norway and Sweden: Is
there a Hidden Relationship?” Scandinavian Journal of Economics, 86:4, pp. 423-39.
Lackó Mária (1996): Hidden economy in East-European countries in international
comparison, Laxenburg: International Institute for Applied Systems Analysis (IIASA),
working paper.
Lackó Mária (1998): The hidden economies of Visegrad countries in international
comparison: A household electricity approach , In: Halpern, L. and Wyplosz, Ch. (eds.),
Hungary: Two wards a market economy, Cambridge (Mass.): Cambridge University
Press, p.128-152.
Lackó Mária (1999): Hidden economy an unknown quantitiy? Comparative analyses of
hidden economies in transition countries in 1989 -95, Working paper 9905, Department
of Economics, University of Linz, Austria.
Langfeldt, Enno (1984): The unobserved economy in the Federal Republic of Germany, in:
Feige, Edgar L. (ed.): The unobserved economy, Cambridge University Press., pp. 236-
260.
Lippert, Owen and Michael Walker (eds.) (1997): The underground economy: Global
evidences of its size and impact, Vancouve r, B.C.: The Frazer Institute.
Lizzeri, C. (1979): Mezzogiorno in controluce. Enel, Naples.
Loayza, Norman V. (1996): The economics of the informal sector: a simple model and some
empirical evidence from Latin America. Carnegie -Rochester Conference Series on
Public Policy 45, pp. 129-162.
MacAfee, Kerrick (1980): A Glimpse of the hidden economy in the national accounts,
Economic Trends, 136, pp. 81-87.
Madzarevic, Sanja and Davor Mikulic (1997): Measuring the unofficial economy by the
system of national accounts, Zagreb: Institute of Public Finance, working paper.
Mauleon, Ignacio (1998): Quantitative Estimation of the Spanish Underground Economy,
Discussion paper, Department of Economics and History, University of Salamanka,
Salamanka, Spain.
Mogensen, Gunnar V.; Kvist, Hans K.; Körmendi, Eszter and Soren Pedersen (1995): The
informal economy in Denmark 1994: Measurement and results, Study no. 3,
Copenhagen: The Rockwool Foundation Research Unit.

49
Morris, B. (1993), Editorial Statement. International Economic Insides, IV, International
Statistical Yearbook, Budapest.
O’Higgins, Michael (1989): Assessing the underground economy in the United Kingdom, in:
Feige, E.L. (ed.): The underground economies: tax evasion and information distortion,
Cambridge: Cambridge University Press, pp. 175-195.
O’Neill, David M. (1983): Growth of the underground economy 1950-81: Some evidence
from the current population survey, Study for the Joint Economic Committee, U.S.
Congress, Joint Committee Print 98-122, U.S. Gov. Printing Off ice, Washington.
Park, T. (1979): Reconciliation between personal income and taxable income, pp. 1947-77,
mimeo, Washington D.C.: Bureau of Economic Analysis.
Pelzmann, Linde (1988): Wirtschaftspsychologie. Arbeitslosenforschung, Schattenwirtschaft,
Steuerpsychologie. Wien, New York (Springer).
Petersen, Hans -Georg (1982): Size of the public sector, economic growth and the informal
economy: Development trends in the Federal Republic of Germany, Review of Income
and Wealth, 28/2, pp. 191-215.
Pissarides, C. and Weber, G. (1988): An expenditure – based estimate of Britain’s black
economy, CLE working paper no. 104, London.
Pommerehne, Werner W. and Friedrich Schneider (1985): The decline of productivity growth
and the rise of the informal economy in the U.S., Working Paper 85 -9 , University of
Aarhus, Aarhus, Denmark.
Portes, Alejandro (1996): The informal economy, in: Pozo, Susan (ed.): Exploring the
underground economy. Kalamazoo, Michigan, pp. 147-165.
Pozo, Susan (ed.) (1996): Exploring the underground economy: Studies of illegal and
unreported activity, Michigan: W.E. Upjohn, Institute for Employment Research.
Rogoff, Kenneth, (1998), Blessing or Curse? Foreign and underground demand for euro
notes, Economic policy: The European Forum 26, pp. 261-304.
Schneider, Friedrich (1986): Estimating the size of the Danish informal economy using the
currency demand approach: An attempt, The Scandinavian Journal of Economics, 88/4,
pp. 643-668.
Schneider, Friedrich (1994a): Measuring the size and development of the informal economy.
Can the causes be found and the obstacles be overcome? in: Brandstaetter, Hermann, and
Güth, Werner (eds.): Essays on Economic Psychology, Berlin, Heidelberg, Springer
Publishing Company, pp. 193-212.
Schneider, Friedrich (1994b): Can the informal economy be reduced through major tax
reforms? An empirical investigation for Austria, Supplement to Public Finance/ F inances
Publiques, 49, pp. 137-152.
Schneider, Friedrich (1997): The informal economies of Western Europe, Journal of the
Institute of Economic Affairs, 17/3, pp. 42-48.
Schneider, Friedrich (1998a): Further empirical results of the size of the informal economy of
17 OECD-countries over time, Paper to be presented at the 54. Congress of the IIPF
Cordowa, Argentina and discussion paper, Department of Economics, University of
Linz, Linz, Austria.
Schneider, Friedrich (1998b): Stellt das Anwachsen der Schwarzarbeit eine
wirtschaftspolitische Herausforderung dar? Einige Gedanken aus volkswirtschaftlicher
Sicht. Linz, Mitteilungen des Instituts für angewandte Wirtschaftsforschung (IAW),
I/98, S. 4-13.

50
Schneider, Friedrich (2000), The Increase of the Size of the Informal Economy of 18 OECD-
Countries: Some Preliminary Explanations, Paper presented at the Annual Public
Choice Meeting , March 10-12, 2000, Charleston, S.C.
Schneider, Friedrich and Dominik Enste (2000): Informal Economies: Size, Causes, and
Consequences, The Journal of Economic Literature, 38/1, pp. 77-114.
Simon, C.B. and A.G. Witte (1982): Beating the system: The underground econo my, Boston,
(Mas.): Urban House.
Smith, J.D (1985): Market motives in the informal economy, in: Gaertner, W. and Wenig, A.
(eds.): The economics of the informal economy, Heidelberg: Springer Publishing
Company, pp. 161-177.
Spiro, Peter S. (1993): “Evidenc e of a Post-GST Increase in the Underground Economy;”
Canadian Tax Journal/ Revue Fiscale Canadienne, , 41:2, pp. 247-258.
Tanzi, Vito (1980): “The Underground Economy in the United States: Estimates and
Implications,” Banca Nazionale del Lavoro , 135:4, pp. 427-453.
Tanzi, Vito (1982) (ed.): The underground economy in the United States and abroad,
Lexington (Mass.), Lexington.
Tanzi, Vito (1982): A second (and more skeptical) look at the underground economy in the
United States; in: Tanzi, Vito (1982) (ed.): The underground economy in the United
States and abroad, Lexington (Mass.), Lexington, pp. 38-56.
Tanzi, Vito (1983): “The Underground Economy in the United States: Annual Estimates,
1930-1980, “IMF-Staff Papers, 30:2, pp. 283-305.
Tanzi, Vito (1986): The underground economy in the United States, Reply to comments by
Feige, Thomas, and Zilberfarb. IMF - Staff Papers, 33/ 4, pp. 799-811.
Tanzi, Vito (1999): Uses and Abuses of Estimates of the Underground Economy, The
Economic Journal 109/456, pp.338-340.
Thomas, Jim J. (1986): The underground economy in the United States: A comment on Tanzi,
IMF-Staff Papers, Vol. 33, No. 4, pp. 782-789.
Thomas, Jim J. (1992): Informal economic activity , LSE, Handbooks in Economics, London:
Harvester Wheatsheaf.
Thomas, Jim J. (1999): Quantifying the Black Economy: ‘Measurement without Theory’ Yet
Again?, The Economic Journal 109/456, pp. 381-389.
Weck, Hannelore (1983): Schattenwirtschaft: Eine Möglichkeit zur Einschränkung der
öffentlichen Verwaltung? Eine ökonomische Analyze, Bern-Frankfurt.
Williams, Colin C. and Jan Windebank (1995): “Black market work in the European
Community: Peripheral work for peripheral localities?”, International Journal of Urban
and Regional Research , 19/1, pp. 23-39.
Witte, A.D. (1987): The nature and extend of unreported activity: A survey concentrating on a
recent US-research, in: Alessandrini, S. and Dallago, B. (eds.): The unofficial economy:
Consequences and perspectives in different economic systems, Gower: Aldershot.
Yoo, Tiho, and Hyun, Jin K., (1998), International comparison of the black economy:
Empirical evidence using micro-level data, Unpublished paper, Presented at the 1998
Congress of the International Institute of Public Finance, Cordoba, Argentina.
Zilberfarb, Ben-Zion (1986): Estimates of the underground economy in the United States,
1930 -80. IMF-Staff Papers, 33/ 4, pp. 790-798.
Wyszukiwarka
Podobne podstrony:
Measurements of the temperature dependent changes of the photometrical and electrical parameters of
African Filmmaking North and South of the Sahara
Haruki Murakami HardBoiled Wonderland and the End of the World
The?uses and?fects of the Chernobyl Nuclear Reactor Melt
Preliminary Analysis of the Botany, Zoology, and Mineralogy of the Voynich Manuscript
On demand access and delivery of business information
Advantages and drawbacks of the Internet
A Tale of Two Cities Summary and Themes of the Book
Confederation And Constitution of the United States
activity-animals-and-parts-of-the-body, Filologia angielska, Praktyki
The Goals and?ilures of the First and Second Reconstructio
Cigarettes and Their?struction of the Brain
Pros and Cons of the?ath Penalty
Availability and?scription of the File Checksum Integrity Verifier utility
Stephenson, Neal Dreams and Nightmares of the Digital Age
[Mises org]French,Doug Walk Away The Rise And Fall of The Home Ownership Myth
więcej podobnych podstron