
Shock Waves (2000) 10: 95–101
Pitot pressures of correctly-expanded and underexpanded
free jets from axisymmetric supersonic nozzles
H. Katanoda, Y. Miyazato, M. Masuda, K. Matsuo
Graduate School of Engineering Sciences, Kyushu University, Kasuga, Fukuoka 816-8580, Japan
Received 4 February 1998 / Accepted 27 August 1998
Abstract. The structures of the axisymmetric free jets from supersonic nozzles with the exit Mach numbers
of 1.5 and 2.0 are studied with special attention to the decay of the Pitot pressures downstream of the
Mach disk. The Pitot pressure probe and schlieren method are used in the experiments to diagnose the
flowfield. A TVD numerical method is also applied to the Euler equations, and the computed jet structures
are compared with experiments. In the underexpanded jet, the experimentally obtained Pitot pressure
near the jet centerline is found to substantially recover downstream of the Mach disk. By comparing the
numerical computation, this phenomenon is thought to be caused by the turbulent momentum transfer to
the central region from the region outside the slip line where the stagnation pressure loss is small.
Key words: Compressible flow, Supersonic jet, Axisymmetric flow, Pitot pressure
1 Introduction
Supersonic free jets are widely used in engineering applica-
tions such as sootblowers ( Moskal et al. 1993), jet burners
( Shimada et al. 1994) and rocket engines ( Neilson et al.
1969). The sootblower is used to remove the fireside de-
posit in kraft recovery boilers, where high pressure steam
accelerated to supersonic speed by a nozzle washes off the
deposits on the heat transfer surfaces of the boiler. The
cleaning power of the jet is thought to be enhanced by the
increase in the local total pressure, which is related to the
Pitot pressure.
Much work has been done experimentally ( Ashkenas
and Sherman 1966, Driftmyer 1972), analytically ( Tam
1972) and numerically ( Dash and Thorpe 1981,Kobayashi
et al. 1984, Saito et al. 1986, Viswanathan and Sankar
1995, Thies and Tam 1996) on the structure of axisym-
metric supersonic free jets. However, most of these studies
have been restricted to the correctly-expanded jets from
supersonic nozzles or the underexpanded jets from sonic
nozzles, and little information is available on the under-
expanded free jets from supersonic nozzles ( Love et al.
1959,Fox 1974). Although the decay of the Pitot pressure
in underexpanded supersonic free jets is very important
for the design of the sootblower nozzles, its characteristics
downstream of the Mach disk are not well understood.
The present paper describes the distributions of the
Pitot pressures both in the correctly-expanded and the
underexpanded supersonic free jets issuing from axisym-
Correspondence to: H. Katanoda
(e-mail: katanoda@ence.kyushu-u.ac.jp)
metric supersonic nozzles, with special emphasis on its
decay downstream of the potential core.
2 Experimental setup and method
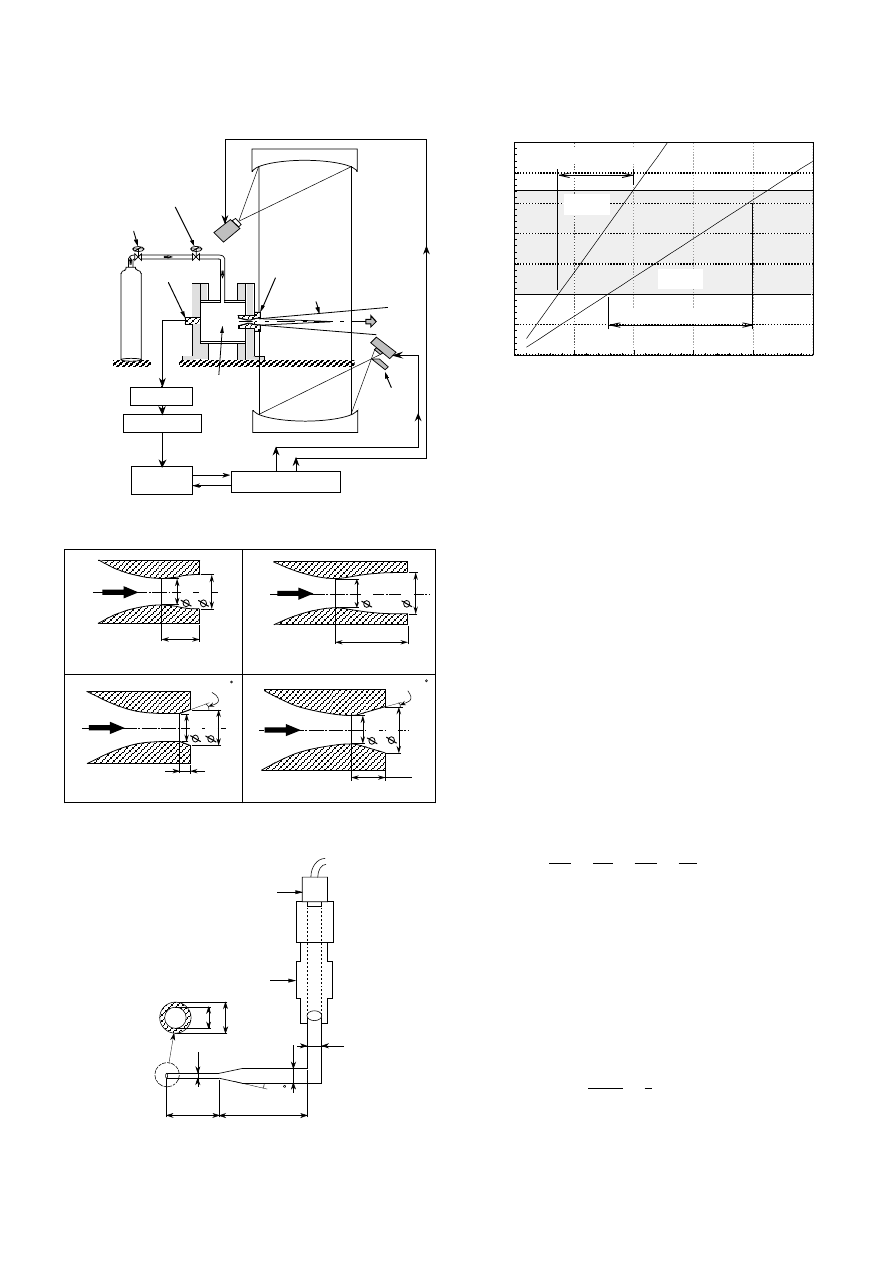
A schematic diagram of the experimental setup is shown
in Fig. 1. The working gas was nitrogen, which, in a high
pressure reservoir, was supplied to the plenum chamber
through the pressure control valve. After the gas was stag-
nated in the plenum chamber, it was accelerated by the
test nozzle and discharged into the atmosphere. The pres-
sure in the plenum chamber was carefully adjusted by the
pressure control valve so that the pressure ratio across the
nozzle was kept constant at a desired value.
Four axisymmetric nozzles used in the present experi-
ments are shown in Fig. 2. The number 1.5 or 2.0 in the
names indicates the exit Mach number calculated by the
one-dimensional isentropic theory. The nozzles labeled as
L had a supersonic part contoured by an approximate the-
ory ( Foelsch 1949), and those labeled as C had a conical
supersonic part with the divergence half angle of 7.5
◦
. The
conical nozzles are often used in sootblowers because of
their manufacturing simplicity. In the design of the con-
toured nozzle, the displacement effect of the boundary
layer was not considered. When operating these nozzles
under a correct-expansion pressure ratio, the stagnation
pressure was adjusted by monitoring the Pitot pressure at
the nozzle exit plane in order to match the static pressure
at the nozzle exit with the ambient pressure.
The jet flowfield was measured by the standard Pitot
pressure probe shown in Fig. 3. The tip of this probe had a
1.0-mm outer diameter, a 0.9-mm inner diameter and was
96
H. Katanoda et al.: Pitot pressures of correctly-expanded and underexpanded free jets
Valve
Nozzle
Supersonic jet
Light source
Camera
Knife edge
Mirror
Mirror
Amplifier
A/D converter
Signal controller
N gas reservoir
2
Pressure
control valve
Personal
computer
Plenum
chamber
transducer
Pressure
Fig. 1. Experimental setup
Nozzle 2.0C
6.9
7.8
6.0
Flow
(d)
=7.5
θ
(a)
(b)
(c)
Nozzle 1.5L
6.0
6.5
Flow
8.6
Nozzle 1.5C
14.8
7.8
6.0
Flow
Nozzle 2.0L
6.0
6.5
2.1
Flow
=7.5
θ
Fig. 2. Nozzle geometry
1.0
5.0
30
50
5.0
Pressure
transducer
Joint
0.9
1.0
30
Fig. 3. Pitot pressure probe
0.5
1.0
1.5
2.0
2.5
3.0
3.5
0
5
10
15
20
25
Range of experiments
Range of experiments
M
d
=2.0
M
d
=1.5
p
e
/ p
b
p
o1
/ p
b
Fig. 4. Experimental conditions
30 mm in length. The Pitot pressure probe was mounted
on the traversing device to scan the flowfield. As shown
in Fig. 1, the spark schlieren method was used to visual-
ize the flowfield. The spark light source had a duration of
20 ns, which is shorter than the typical turbulence charac-
teristic time in the jet. This means that the present system
visualized the instantaneous pattern of the flowfield.
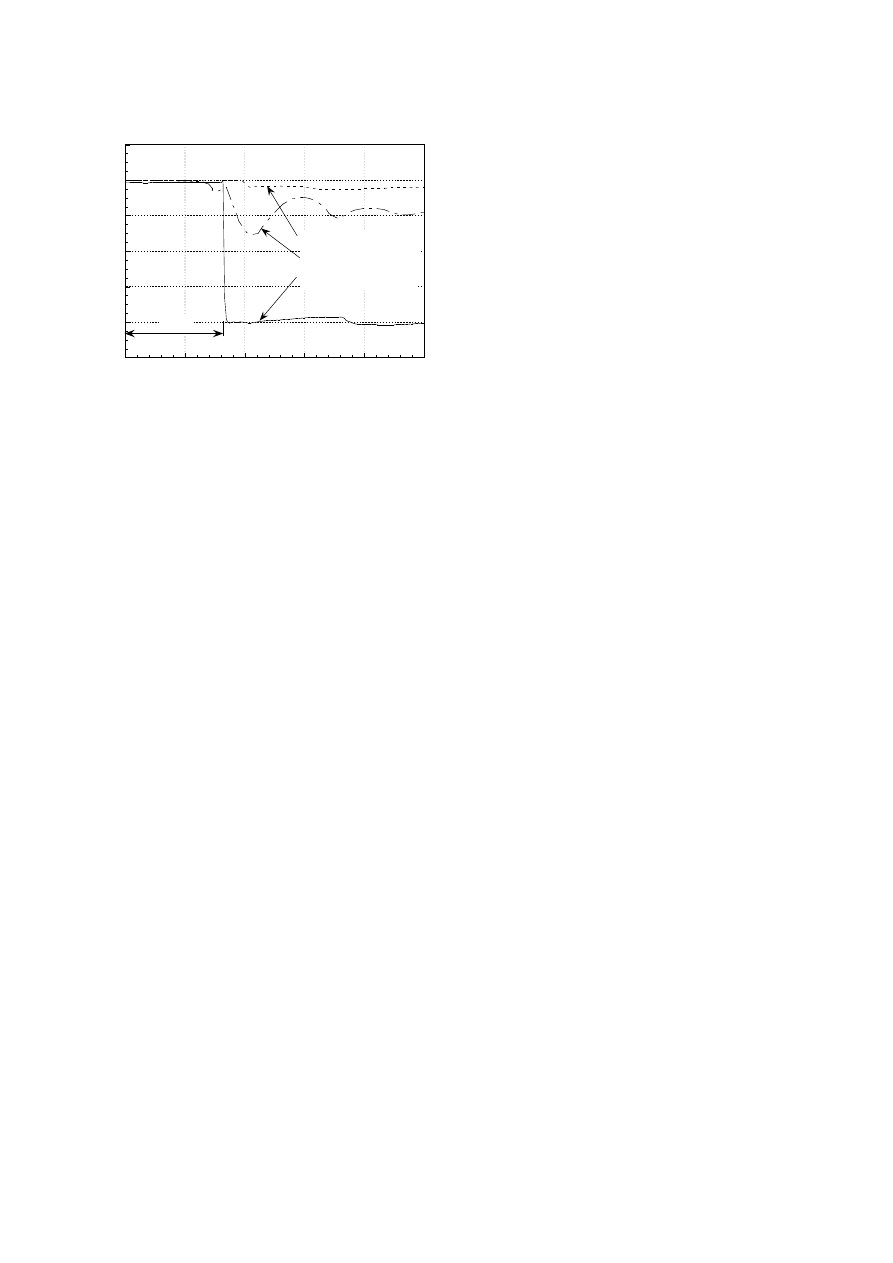
The experimental conditions are summarized in Fig. 4.
The nozzle with the design exit Mach number M
d
= 1.5
was tested with the ratio of the stagnation pressure p
◦1
to the back pressure p
b
from 4.0 to 10, and these pressure
ratios corresponded to the ratio of the nozzle exit pressure
p
e
to p
b
from 1.0 to 2.7. For the nozzle with M
d
= 2.0, the
range of the tests was p
◦1
/p
b
= 8.0 to 20 (p
e
/p
b
= 1.0 to
2.5).
3 Numerical method
The structure of the supersonic free jets was also obtained
numerically under the same conditions as for the present
experiments. The basic equations are the Euler equations
in cylindrical coordinates, and are written as:
∂U
∂t
+
∂F
∂x
+
∂G
∂r
+
W
r
= 0 ,
(1)
U =
ρ
ρu
ρv
e
, F =
ρu
ρu
+ p
ρuv
(e + p) u
,
G =
ρv
ρuv
ρv
+ p
(e + p) v
, W =
ρv
ρuv
ρv
(e + p) v
,
e =
p
γ − 1
+
ρ
2
(u
2
+ v
2
) ,
where x is the axial distance from the nozzle exit plane,
r the radial distance from the jet centerline, t the time,
H. Katanoda et al.: Pitot pressures of correctly-expanded and underexpanded free jets
97
p the pressure, ρ the density, u the axial velocity, v the
radial velocity and e the sum of the internal energy and the
kinetic energy per unit volume, respectively. The specific
heat ratio γ was taken as 1.4. Equation (1) was solved with
the equation of state for an ideal gas. To capture shock
waves in underexpanded free jets, numerical fluxes were
evaluated using the Chakravarthy–Osher-type TVD finite-
difference scheme ( Yee 1987). Numerical solutions were
advanced in time by using an explicit three-step Runge–
Kutta method.
The computational domain consists of both the inside
and the outside of the nozzle. The following boundary con-
ditions are assumed: perfect slip on the nozzle wall, zero
normal gradient on the outermost surface of the domain
and axial symmetry on the flow centerline. At the nozzle
throat, physical quantities are calculated by the approx-
imate theory of the transonic flow with a circular throat
( Shapiro 1954).
4 Results and discussion
4.1 Experimental and numerical flow visualization
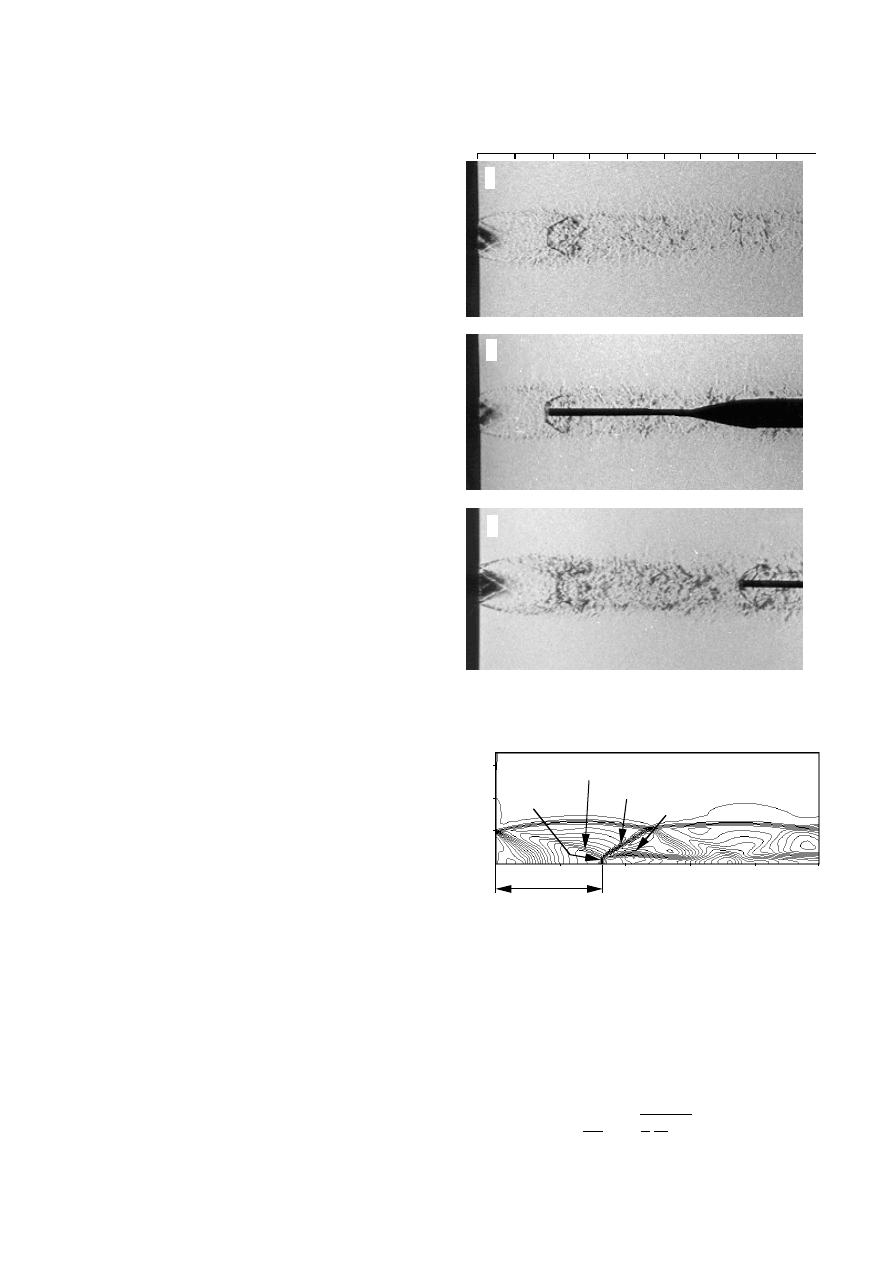
Figure 5 shows three schlieren photographs of the under-
expanded free jets from the nozzle 1.5L. They were taken
for the same nozzle pressure ratio p
◦1
/p
b
= 8.0, and the
corresponding exit pressure ratio p
e
/p
b
was 2.18. The scale
shown in the upper part of the figure is the axial distance
x from the nozzle exit normalized by the nozzle exit di-
ameter D. In Fig. 5a, the Pitot pressure probe is not in-
serted and the Mach disk is observed at x/D = 1.78. In
Fig. 5b and c, the Pitot pressure probe is inserted on the
jet axis with its tip at x/D = 1.80 and 6.67, respectively.
By comparing Fig. 5a and b, the Mach disk location and
diameter do not seem to be affected by the probe. As
shown in Fig. 5c, the bow shock wave is observed in front
of the probe, indicating the flow at this point as being
supersonic. The bow shock wave near the flow centerline,
however, is almost normal to the axis, so that the Pitot
pressure probe measures the stagnation pressure behind
the normal shock wave.
Figure 6 shows the density contours obtained by the
present numerical simulation for the nozzle 1.5L with the
pressure ratio p
◦1
/p
b
= 8.0 (p
e
/p
b
= 2.18). The numeri-
cally obtained flow parameters on the jet axis fluctuated at
each calculation step. The calculated density was, there-
fore, averaged over 3000 successive calculation steps. The
Mach disk, barrel shock wave, reflected shock wave and
slip line are clearly seen in this figure. The downstream
distance from the nozzle exit to the Mach disk, x
m
/D,
equals 1.65 and is close to the value 1.78 obtained exper-
imentally (Fig. 5a).
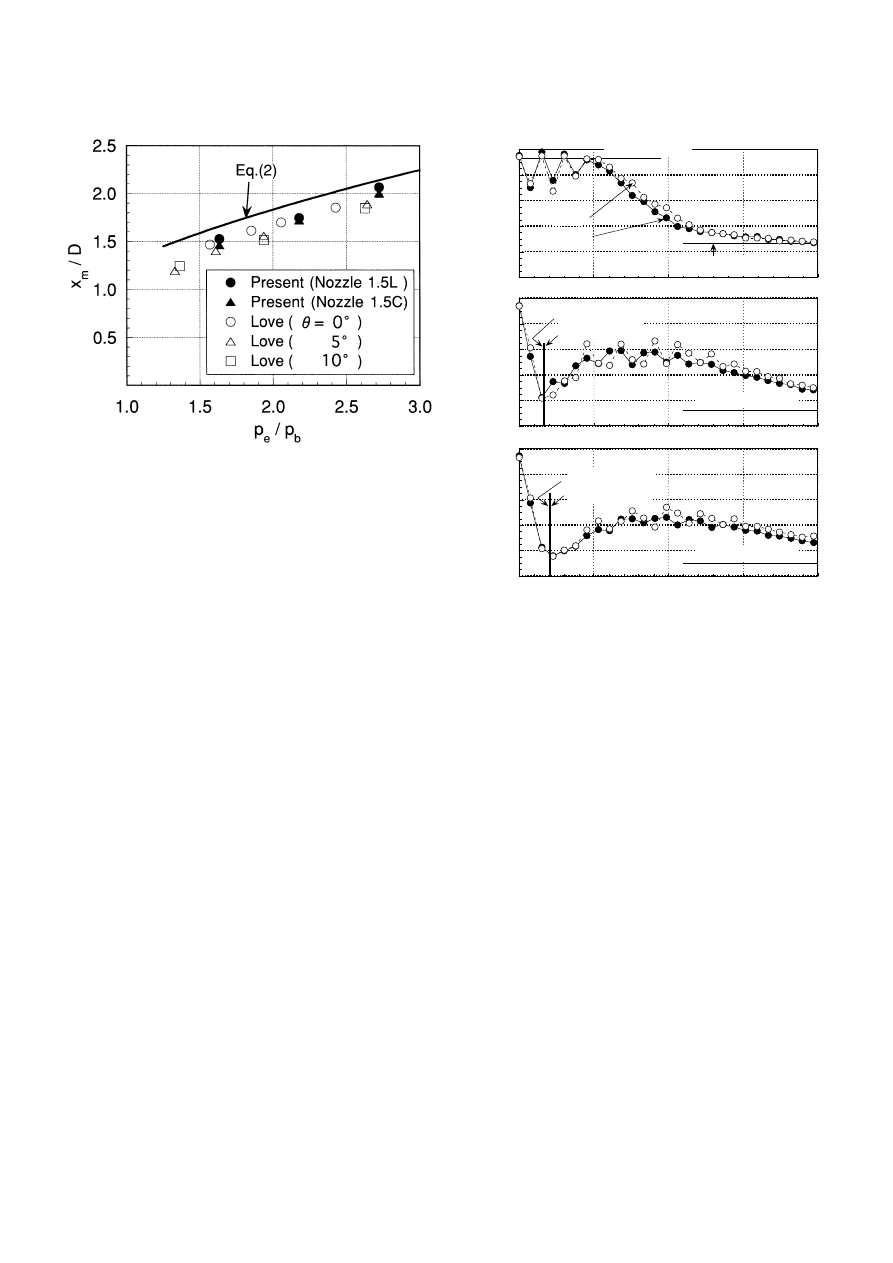
4.2 Mach disk
The location of the Mach disk was measured from schlieren
photographs for various experimental conditions, and the
normalized distance x
m
/D is plotted against the nozzle
x/D
1
2
3
4
5
6
7
8
0
a
b
c
Fig. 5a–c. Schlieren photographs of supersonic free jets; nozzle
1.5L, p
◦1
/p
b
= 8.0 (p
e
/p
b
= 2.18). a Without Pitot tube; b
Pitot tube at x/D = 1.80; c Pitot tube at x/D = 6.67
0
x/D
Mach disk
Barrel shock wave
Reflected shock wave
Slip line
1
2
3
4
5
x /D
m
0.5
1.0
1.5
r/D
Fig. 6. Computed density contours; nozzle 1.5L, p
◦1
/p
b
= 8.0
(p
e
/p
b
= 2.18)
exit pressure ratio p
e
/p
b
in Fig. 7 for the nozzles 1.5L and
1.5C. This figure also includes the previous experimental
data ( Love et al. 1959) for supersonic air jets from three
nozzles with the exit Mach number 1.5 and a divergence
half angle θ at the exit of 0
◦
, 5
◦
and 10
◦
. Driftmyer (1972)
summarized experimental results and proposed the follow-
ing empirical formula for the Mach disk location:
x
m
D
=
r
γ
2
p
e
p
b
M
2
d
.
(2)
98
H. Katanoda et al.: Pitot pressures of correctly-expanded and underexpanded free jets
Fig. 7. Measured Mach disk locations; nozzles 1.5L and 1.5C
The solid line in Fig. 7 is the result calculated using the
above formula (2). The present experimental data agree
well with the previous experiments for the nozzle with θ
= 0
◦
. It is also shown that x
m
/D becomes smaller with
the increase in θ for the same exit pressure ratio. In the
previous data, x
m
/D decreases by 5–8% with the increase
in θ from 0
◦
to 5
◦
. On the other hand, the present x
m
/D
decreases by 2–4% with the increase in θ from 0
◦
to 7.5
◦
.
Equation (2) also predicts slightly larger values of x
m
/D
than the experimental data, even for the nozzle with θ =
0
◦
, which gives the largest x
m
/D.
4.3 Pitot pressure
The Pitot pressure distributions were measured along the
centerline of nozzles 1.5L and 1.5C, and the results are
plotted in Fig. 8 as a function of x/D. In this figure, p
i
is
the Pitot pressure, p
◦1
the plenum chamber pressure, and
p
b
the back pressure, respectively. Figure 8a corresponds
to the flowfield of the correctly-expanded jet. The p
ie
in
this figure is the Pitot pressure at the nozzle exit calcu-
lated by the one-dimensional theory, and is shown to agree
well with the experiments for both nozzles. Although the
pressure ratio across the nozzle is correct, the jet immedi-
ately downstream of the nozzle exit indicates the existence
of compression and expansion waves. As mentioned pre-
viously, nozzle 1.5L has a wall contour computed by an
approximate theory. The Pitot pressure distribution for
this nozzle in the range 0 < x/D <∼ 5, however, suggests
that the weak compression and expansion waves still exist
in the flowfield. Nozzle 1.5L was designed to be used as a
sootblower nozzle so that the nozzle length is limited. Con-
sequently, it is probably not possible to cancel expansion
and compression waves generated in the nozzle completely.
In addition to this, Fourguette et al. (1991) observed a
similar phenomenon through their experiments with the
contoured axisymmetric nozzle for the exit Mach number
0
0.2
0.4
0.6
0.8
1.0
x
m
/ D for 1.5C
x
m
/ D for 1.5L
p
b
/ p
o 1
=0.13
p
i
/ p
o1
0
0.2
0.4
0.6
0.8
1.0
1.5L
1.5C
p
ie
/ p
o 1
=0.93
p
b
/ p
o 1
=0.27
p
i
/ p
o1
0.2
0.4
0.6
0.8
1.0
0
5
10
15
20
p
i
/ p
o1
x/D
x
m
/ D for 1.5C
x
m
/ D for 1.5L
p
b
/ p
o 1
=0.10
a
b
c
Fig. 8a–c. Pitot pressure distributions along the centerline;
nozzles 1.5L and 1.5C. a p
◦1
/p
b
= 3.7; b p
◦1
/p
b
= 8.0; c
p
◦1
/p
b
= 10
of 1.5. They attributed this to the weak shock waves gen-
erated in the nozzle. The shock waves in the nozzles were
discussed for the conical ( Migdal and Kosson 1965) and
contoured ( Legge and Dettleff 1986) nozzles, respectively.
Their results indicated that a weak shock wave was gen-
erated immediately downstream of the nozzle throat and
this could not be eliminated when the nozzle shape was ax-
isymmetric. The expansion and compression wave pattern
shown in Fig. 8a is probably attributed to this effect. Due
to this effect, the Pitot pressures fluctuate from the nozzle
exit to x/D ∼ 5, where the potential core is terminated.
Downstream of x/D ∼ 5, the Pitot pressures of nozzles
1.5L and 1.5C decrease gradually with x/D and approach
the back pressure. In this region, the effect of turbulence
generated in the jet boundary extends to the centerline
and decreases the Pitot pressure. Although the schlieren
photographs do not reveal the flow structure near the cen-
terline, the effect of turbulence can be seen qualitatively
in Fig. 5.
Figure 8b,c shows the jet for the underexpanded pres-
sure ratios. The x
m
/D in this figure is the Mach disk loca-
tion obtained from the schlieren measurements. As shown
in this figure, the Pitot pressure decreases rapidly imme-
diately downstream of the nozzle exit, and takes the min-
imum value at x/D = 1.5 ∼ 2. This x/D value corre-
sponds to the Mach disk location as observed from the
schlieren photographs. The Pitot pressure distributions
H. Katanoda et al.: Pitot pressures of correctly-expanded and underexpanded free jets
99
0
0.2
0.4
0.6
0.8
1.0
p
i
/ p
o1
x
m
/ D for 2.0C
x
m
/ D for 2.0L
p
b
/ p
o 1
=0.06
0
0.2
0.4
0.6
0.8
1.0
p
i
/ p
o1
2.0L
2.0C
p
ie
/ p
o 1
=0.72
p
b
/ p
o 1
=0.14
0.2
0.4
0.6
0.8
1.0
0
5
10
15
20
p
i
/ p
o1
x/D
p
b
/ p
o 1
=0.05
x
m
/ D for 2.0C
x
m
/ D for 2.0L
a
b
c
Fig. 9a–c. Pitot pressure distributions along the centerline;
nozzles 2.0L and 2.0C. a p
◦1
/p
b
= 7.4; b p
◦1
/p
b
= 16; c
p
◦1
/p
b
= 20
downstream of the Mach disk indicate that the compli-
cated compression and expansion wave pattern exists in
this region. In particular, the Pitot pressure increases af-
ter the Mach disk under the underexpansion condition.
This can not be explained by the inviscid flow theory.
A similar phenomenon with the Pitot pressure recovering
downstream of the Mach disk was also reported by Don-
aldson et al. (1971), who investigated the underexpanded
free air jet obtained from the convergent nozzle. We shall
discuss this below.
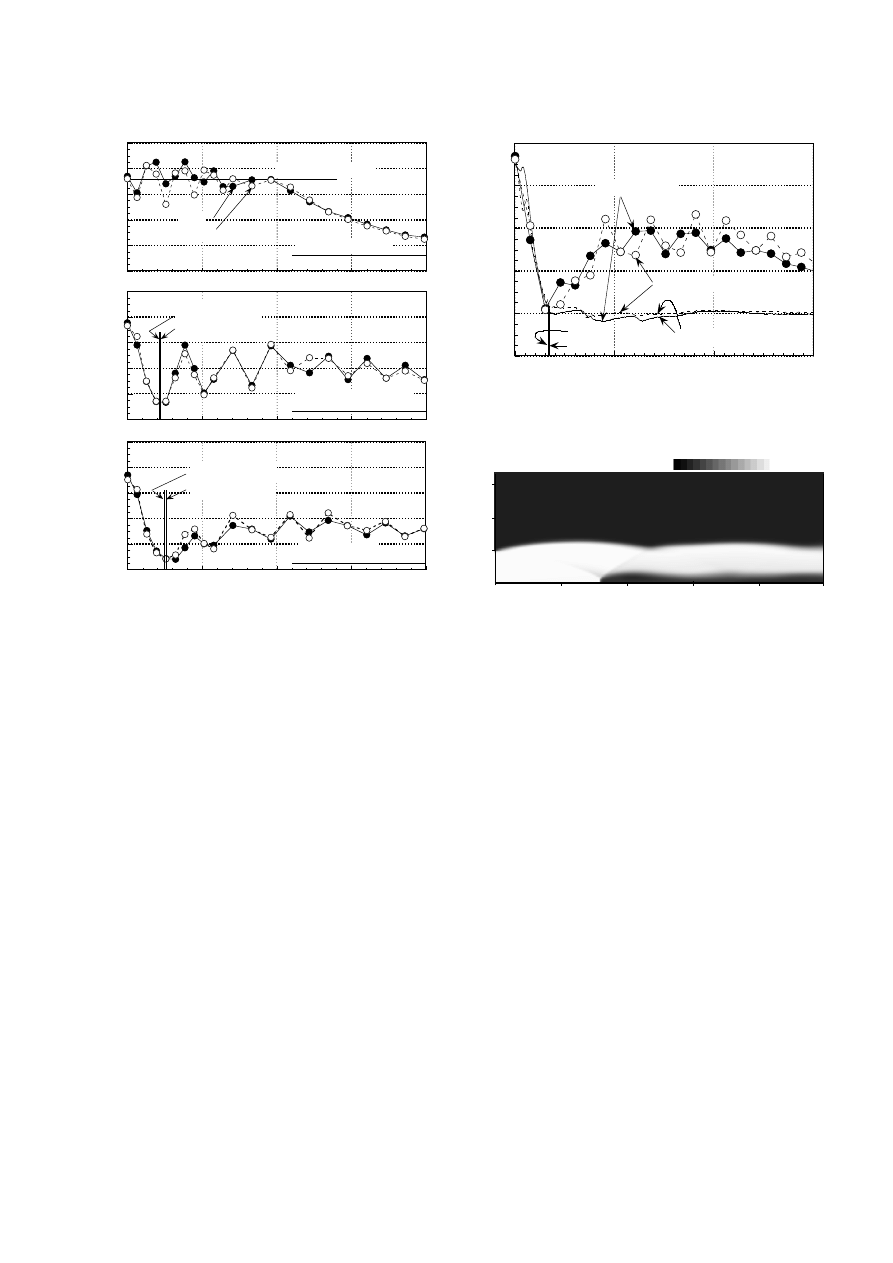
The Pitot pressure distributions were also measured
for nozzles 2.0L and 2.0C, and the results are plotted in
Fig. 9. As shown in this figure, the behavior of the Pitot
pressure does not differ greatly from Fig. 8, except that
the compression and expansion wave pattern downstream
of the Mach disk seems more distinct than in Fig. 8. The
Pitot pressure downstream of the Mach disk is also seen
to increase with x/D.
To investigate the recovery of the Pitot pressure down-
stream of the Mach disk, the jet flowfield was computed
with the method described in the previous section. The
numerical Pitot pressure was calculated by assuming the
normal shock wave standing in front of the tube when the
local flow speed was supersonic; when the local flow was
subsonic, the numerical Pitot pressure was simply taken
as the local stagnation pressure. As described before, the
0.2
0.4
0.6
0.8
1.0
0
5
10
15
p
i
/ p
o1
x/D
Nozzle 1.5L
Nozzle 1.5C
Computation
x
m
/ D for 1.5C
x
m
/ D for 1.5L
Fig. 10. Measured and computed Pitot pressure distributions;
nozzles 1.5L and 1.5C, p
◦1
/p
b
= 8.0 (p
e
/p
b
= 2.18)
x/D
0.5
1.0
1.5
r/D
0
1
2
3
4
5
0.125
1.0
p /p
0
01
Fig. 11. Computed total pressure spatial distribution; nozzle
1.5L, p
◦1
/p
b
= 8.0 (p
e
/p
b
= 2.18)
solutions of 3000 successive time steps were averaged to
get the numerical Pitot pressure. The Pitot pressure dis-
tributions along the jet centerline are shown in Fig. 10
for the nozzle 1.5L and 1.5C. In this figure, both com-
puted and experimental results are shown for the pres-
sure ratio p
◦1
/p
b
= 8.0 (p
e
/p
b
= 2.18). The experimen-
tal Pitot pressure decreases rapidly from the nozzle exit
to the Mach disk, and agrees reasonably well with the
computation. The computed results in this region, how-
ever, show a slight increase in the Pitot pressure at about
x/D ∼ 0.5. This increase is observed even in the flow from
the contoured nozzle 1.5L, and is probably attributed to
the shock wave generated in the nozzle. Downstream of
the Mach disk, a large discrepancy is observed between the
experimental and computed results; the computed Pitot
pressure does not increase there.
The total pressure distributions are also computed for
the nozzle 1.5L with the pressure ratio p
◦1
/p
b
= 8.0 (p
e
/p
b
= 2.18), and the results are shown in Figs. 11 and 12. Fig-
ure 11 presents the total pressure field, and shows that the
total pressure decreases abruptly downstream of the Mach
disk. This low total pressure region, however, is restricted
to the vicinity of the centerline, and the decrease in total
pressure is small in the region outside the slip line. This
tendency is quantitatively shown in Fig. 12, where the to-
tal pressures are plotted as a function of x/D for three
different radial positions. In Fig. 12, r is the radial dis-
tance measured from the centerline and r
m
the radius of
100
H. Katanoda et al.: Pitot pressures of correctly-expanded and underexpanded free jets
0.2
0.4
0.6
0.8
1.0
1.2
0
1
2
3
4
5
p
o
/ p
o1
x /D
r /D=0.35 ( > r
m
/D )
r /D=0.20 ( > r
m
/D )
x
m
/ D
r /D=0 ( < r
m
/D )
Fig. 12. Computed total pressure in the jet; nozzle 1.5L
p
◦1
/p
b
= 8.0 (p
e
/p
b
= 2.18)
the Mach disk. According to the density contours shown
in Fig. 6, the Mach disk is formed at x
m
/D = 1.65 with
its radius r
m
/D = 0.1. The total pressure on the center-
line decreases from 1.0 to 0.2 across the Mach disk, and
this decrease agrees well with the calculation by the one-
dimensional normal shock relations. The total pressure at
r/D = 0.2, however, does not decrease appreciably after
the Mach disk, and it decreases and increases periodically
due probably to the complicated expansion and compres-
sion waves generated in the jet. At r/D = 0.35, the total
pressure decreases at the position of the reflected shock
wave x/D ∼ 2, but the amount of the decrease is not large.
These numerical results for the inviscid jet suggest that
the Pitot pressure recovery observed in the experiments
downstream of the Mach disk is caused by the transfer
of momentum from the outer high total pressure region
to the central part of the jet. This momentum transfer is
probably caused by the difference in velocity across the
slip line. Previous experiments on the axisymmetric sonic
jet of air (Yip et al. 1989) indicated that the large-scale
vortical structure existed along the slip line. The helical or
flapping instability wave of the jet generated by acoustic
disturbances near the nozzle exit (Tam et al. 1994) may
also affect the momentum transfer.
5 Concluding remarks
The Pitot pressure distributions have been studied both
experimentally and numerically for the axisymmetric free
jets obtained from supersonic nozzles. The tested nozzles
had an exit Mach number of 1.5 and 2.0 with contoured
or 7.5
◦
half–angle conical supersonic part. Results of the
present study are summarized as follows.
(1) With the correct expansion pressure ratio, the jet from
both contoured and conical nozzles show a similar wave
pattern; the compression and expansion waves are gen-
erated in the jet resulting in the cell structure in the
potential core region, and the Pitot pressure decreases
with the increase in axial distance downstream of the
potential core. The flow pattern of the contoured noz-
zle does not differ greatly from that of the conical noz-
zle. This is probably attributed to the length of the
contoured nozzle being too short to cancel the com-
pression and expansion waves generated in the nozzle
and also to the axisymmetric geometry of the nozzle.
(2) When the pressure ratio across the nozzle exceeds the
correct expansion ratio, the Pitot pressure is found to
recover significantly downstream of the potential core.
To interpret this, the Pitot and total pressure distri-
butions were computed with the Euler equations. The
results indicate that, although the Pitot pressure in
the vicinity of the jet centerline does not increase after
the first Mach disk, the total pressure outside the slip
line is almost equal to its inviscid value. This suggests
that the experimentally observed increase in the Pitot
pressure downstream of the Mach disk is attributed to
the transfer of momentum from the region outside the
slip line to the central part of the jet.
Acknowledgements. The authors would like to express their
thanks to Mr. J. Tanaka and Mr. H. Saito for their assistance
in the experimental works.
References
Ashkenas H, Sherman FS (1966) Experimental methods in rar-
efied gas dynamics. Rarefied Gas Dynamics, 2, Academic
Press, New York, pp 84–105
Dash SM, Thorpe RD (1981) Shock-capturing method for one-
and two-phase supersonic exhaust flow. AIAA J 19:842–851
Donaldson CD, Snedeker RS (1971) A study of free jet im-
pingement. Part I. Mean properties of free and impinging
jets. J Fluid Mech 45:281–324
Driftmyer RT (1972) A correlation of freejet data. AIAA J
10:1093–1095
Foelsch K (1949) The analytical design of an axially symmetric
Laval nozzle for a parallel and uniform jet. J Aeronaut Sci
16:161–188
Fourguette DC, Mungal MG, Dibble RW (1991) Time evolu-
tion of the shear layer of a supersonic axisymmetric jet.
AIAA J 29:1123–1130
Fox JH (1974) On the structure of jet plumes. AIAA J 12:105–
107
Kobayashi H, Nakagawa T, Nishida M (1984) Density mea-
surements in freejets by laser interferometry. Proc 14th
Int Symp on Rarefied Gas Dynamics, University of Tokyo
Press, pp 501–508
Legge H, Dettleff G (1986) Pitot pressure and heat-transfer
measurements in hydrazine thruster plumes. J Spacecraft
and Rockets 23:357–362
Love ES, Grigsby CE, Lee LP, Woodling MJ (1959) Exper-
imental and theoretical studies of axisymmetric free jet.
NASA TR R-6
Migdal D, Kosson R (1965) Shock prediction in conical nozzle.
AIAA J 3:1554–1556
Moskal TE, Bunton MA, Jordan CA (1993) Results of labora-
tory testing and field trials of improved sootblower nozzles.
TAPPI 1993 Engineering Conference Proceedings, TAPPI
Press, Atlanta, pp 963–967

H. Katanoda et al.: Pitot pressures of correctly-expanded and underexpanded free jets
101
Neilson JH, Gilchrist A, Lee CK (1969) Control forces in rocker
nozzles produced by a secondary gas stream inclined at
various angles to the nozzle axis. J Mech Eng Sci 11:175–
180
Saito T, Nakatsuji H, Teshima K (1986) Numerical simula-
tion and visualization of freejet flow-fields. Trans Japan
Soc Aero Space Sci 34:161–165
Shapiro AH (1954) The dynamics and thermodynamics of com-
pressible fluid flow. The Ronald Press, New York, vol 2,
pp 826–833
Shimada S, Koyama T, Sakusabe K (1994) Development
of drying-disintegration system by high-temperature jet.
Shigen-to-Sozai 110:1179–1183
Tam CKW (1972) On the noise of a nearly ideally expanded
supersonic jet. J Fluid Mech 51:69–96
Tam CKW, Ahuja KK, Jones III RR (1994) Screech tones from
free and ducted supersonic jets. AIAA J 32:917–922
Thies AT, Tam CKW (1996) Computation of turbulent ax-
isymmetric and nonaxisymmetric jet flows using the k-ε
model. AIAA J 34:309–316
Viswanathan K, Sankar LN (1995) Toward the direct calcu-
lation of noise: fluid/acoustic coupled simulation. AIAA J
33:2271–2279
Yee HC (1987) Upwind and symmetric shock-capturing
schemes. NASA TM-89464
Yip B, Lyons K, Long M, Mungal MG, Barlow R, Dibble R
(1989) Visualization of supersonic underexpanded jet by
planar Rayleigh scattering. Phys Fluids A 1:1449–1449
Wyszukiwarka
Podobne podstrony:
James Dawes The Language of War, Literature and Culture in the U S from the Civil War through World
Song of Myself Individuality and Free Verse
Comparison of theoretical and experimental free vibrations of high industrial chimney interacting
Comparison of theoretical and experimental free vibrations of high industrial chimney interacting
Simons; 3 Judging correctly Brentano and the reform of elementary logic
The Effects of Probiotic Supplementation on Markers of Blood Lipids, and Blood Pressure in Patients
Playwriting The Structure of Action Revised and Expanded Edition Sam Smiley 2005
Insensitive Semantics~ A Defense of Semantic Minimalism and Speech Act Pluralism
Estimation of Dietary Pb and Cd Intake from Pb and Cd in blood and urine
Development of Carbon Nanotubes and Polymer Composites Therefrom
Analysis of soil fertility and its anomalies using an objective model
Modeling of Polymer Processing and Properties
DICTIONARY OF AUSTRALIAN WORDS AND TERMS
A Chymicall treatise of the Ancient and highly illuminated Philosopher
Extensive Analysis of Government Spending and?lancing the
Comparison of Human Language and Animal Communication
The?onomic Emergence of China, Japan and Vietnam
Hoban The Lion of Boaz Jachin and Jachin Boaz
Comparison of the Russians and Bosnians
więcej podobnych podstron