
Innovative Food Science and Emerging Technologies 4
(2003) 203–209
1466-8564/03/$ - see front matter
䊚 2003 Elsevier Science Ltd. All rights reserved.
doi:10.1016/S1466-8564(03)00016-X
Modelling of dehydration-rehydration of orange slices in combined
microwave
yair drying
G. Ruız Dıaz, J. Martınez-Monzo, P. Fito, A. Chiralt*
´
´
´
´
Department of Food Technology, Universidad Politecnica de Valencia, Camino de Vera, syn, 46022, Valencia, Spain
´
Received 12 December 2002; accepted 24 January 2003
Abstract
The development of new citrus products, such as dry products for direct use or for rehydration, is interesting to promote their
consumption. Combined microwaves
(MW)–air (2 mys, 60 8C) drying of orange slices has been studied in terms of process
kinetics and of the rehydration capability as affected by the applied MW power
(0, 0.17, 0.36, 0.69 and 0.88 Wyg). Drying
curves were modelled considering two periods, with different kinetic constants, related with the effective water diffusivity. These
constants increased linearly with the applied MW power and, despite the low levels of MW power used, a sharp reduction in
drying time of orange slices was obtained. Rehydration behaviour of orange slices was modelled through Peleg’s and Weibull’s
equations. No differences in rehydrating behaviour were observed as a function of the applied MW power. So, the highest level,
which was limited to avoid sample browning, will be recommended to reduce the drying time.
䊚 2003 Elsevier Science Ltd. All rights reserved.
Keywords: Orange; Drying; Microwaves; Rehydration
Industrial relevance: A combined microwave
(power levels 0 to 0.88 Wys) proved effective in increasing drying rates. However, lack of
steadiness of the drying rate in the first drying period suggests a diffusion controlled water transport in the sample interface with the process
driving force progressively being reduced in linear with the water activity reduction of the external cells for all samples. Also of interest is that
the rehydration properties were not influenced by the drying conditions tested. Close fit of both models
(Weibull’s, Peleg’s equations) was
observed.
1. Introduction
Citrus fruit occupy an important place in world fruit
production. They have a great nutritional potential due
to their high content in vitamins and fibber as well as
in flavonoids and terpenes
). Most of the citrus production is
destined for the direct consumption or processed to
produce juice, the fresh consumption having decreased
in the last few years. The demand for healthy, natural
and tasty is continuously increasing, not only for fin-
ished products, but also for ingredients to be included
in complex foods such as ice-creams, cereals, dairy,
confectionery and bakery products. In this sense, orange
is dehydrated for different products such as powders,
flakes and slices
(Samson, 1986). The development of
*Corresponding author. Tel.: q34-96-387-7341; fax: q34-96-387-
7369.
E-mail address: dchiralt@tal.upv.es
(A. Chiralt).
new citrus products
(such as dry products for direct use
or for rehydration
) is interesting to promote their con-
sumption according to the current tendencies.
High temperatures or long drying times in conven-
tional air drying, may cause serious damage to product
flavour, colour and nutrients, reducing bulk density and
rehydration capacity of the dried product
& Scaman, 1998; Drouzas, Tsami & Saravacos, 1999
).
The desire to avoid these problems to some extent,
prevent significant quality loss, and achieve fast and
effective thermal processing has resulted in the increased
use of microwaves for food drying. The use of micro-
wave power in some food processes such as baking,
tempering, pasteurisation, cooking, and heating results
in a substantially reduced processing time leading to
increased production capacity, as well as improved
quality and shelf life of final products
Studies on drying applying a combined microwave
y
convection has been tackled by several authors
G.R. Dıaz et al. / Innovative Food Science and Emerging Technologies 4 (2003) 203–209
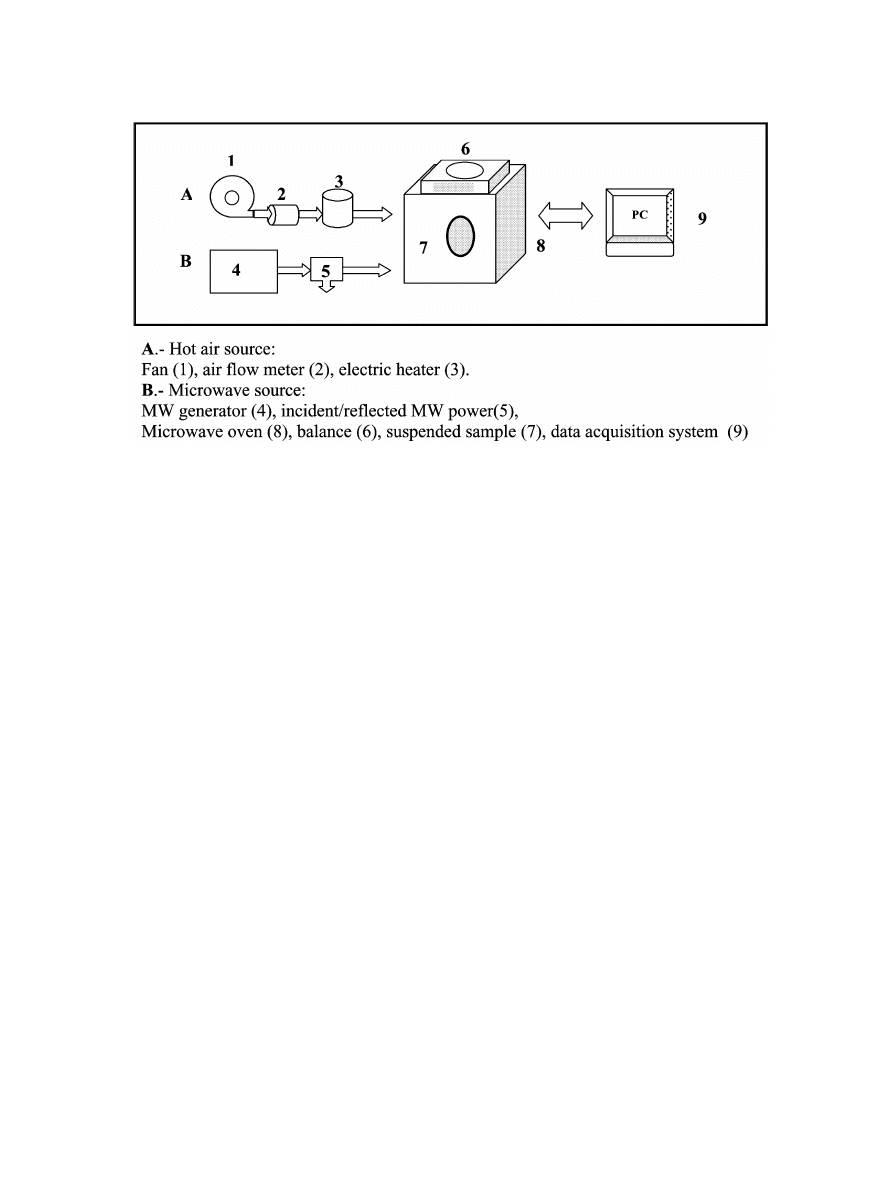
Fig. 1. Scheme of combined MW-hot air equipment.
). The combination of microwaveyhot air
was successfully used for the final drying of onions by
conducting experiments using various combinations of
hot air and microwave energy for drying materials with
high higroscopicity
(Witt, 1980; Bhartia, Stuchly &
). The quick energy absorption by water
molecules causes rapid evaporation of water
(resulting
in higher drying rates of the food
), creating an outward
flux of rapidly escaping vapour
). In addition to improving the drying
rate, this outward flux can help to prevent the shrinkage
of tissue structure, which prevails in most conventional
air drying techniques. Hence better rehydration charac-
teristics may be expected in microwave dried products
(Prabhanjan, Ramaswamy & Raghavan, 1995; Tsami,
Krokida & Drouzas, 1999; Krokida, Kiranoudis & Mar-
oulis, 1999
). Microwave application has been reported
to improve product quality such as better aroma, faster
and better rehydration, considerable savings in energy
and much shorter drying times compared with hot air
drying alone
(Rosenberg & Boegl, 1987; Decareau,
).
The objective of this study is to analyse and model
drying kinetics of orange slices using combined micro-
wave
yhot air-drying and to determine rehydration kinet-
ics and properties of the obtained products in the
different conditions.
2. Materials and methods
Oranges
(variety Navel Late) were obtained from a
local supermarket and stored at 5"0.5 8C for a maxi-
mum of two days until the experiments were carried
out. Prior to drying, they were cut with peel in 5 mm
thick slices taken from the equatorial zone of the fruit.
The samples were characterised as for their moisture
content and soluble solid content before and after the
drying.
Water content was analysed by vacuum drying at 60
8C until constant weight was achieved
Soluble solid contents were measured in a refractometer
(ABBE ATAGO 89553 of Zeiss) at 20 8C.
Drying experiments were carried out in a modified
microwave oven
(Fig. 1), with two parallel connected
lines, one for the application of hot air and another for
the generation and application of the microwaves
(Martın, Andres, Martınez-Navarrete, Chiralt & Fito,
). The temperature and velocity of the air were 60
8C and 2 m
ys, respectively. The incident and reflected
power of MW were controlled by using a directional
coupler in the power measure system to estimate the
power absorbed by sample. Five levels of supplied MW
power were applied 0, 20, 40, 60 and 100 W
(0, 0.17,
0.36, 0.69 and 0.88 W
yg of sample, respectively
). In
each experiment, 5 slices were put in the oven. One of
these was suspended in the centre of the cavity by
means of a nylon thread from a balance in order to
monitor the sample weight loss. The other samples were
suspended from a Teflon cylinder also parallel to the
airflow.
The dried slices
(until approx. 0.12 d.b.), previously
characterised in 8Brix and moisture content were rehy-
drated in distilled water at 25 8C, using a ratio dry
sample
ywater of 1:25. At the different rehydration times
(between 0 and 1560 min), the weight of the samples
205
G.R. Dıaz et al. / Innovative Food Science and Emerging Technologies 4 (2003) 203–209
´
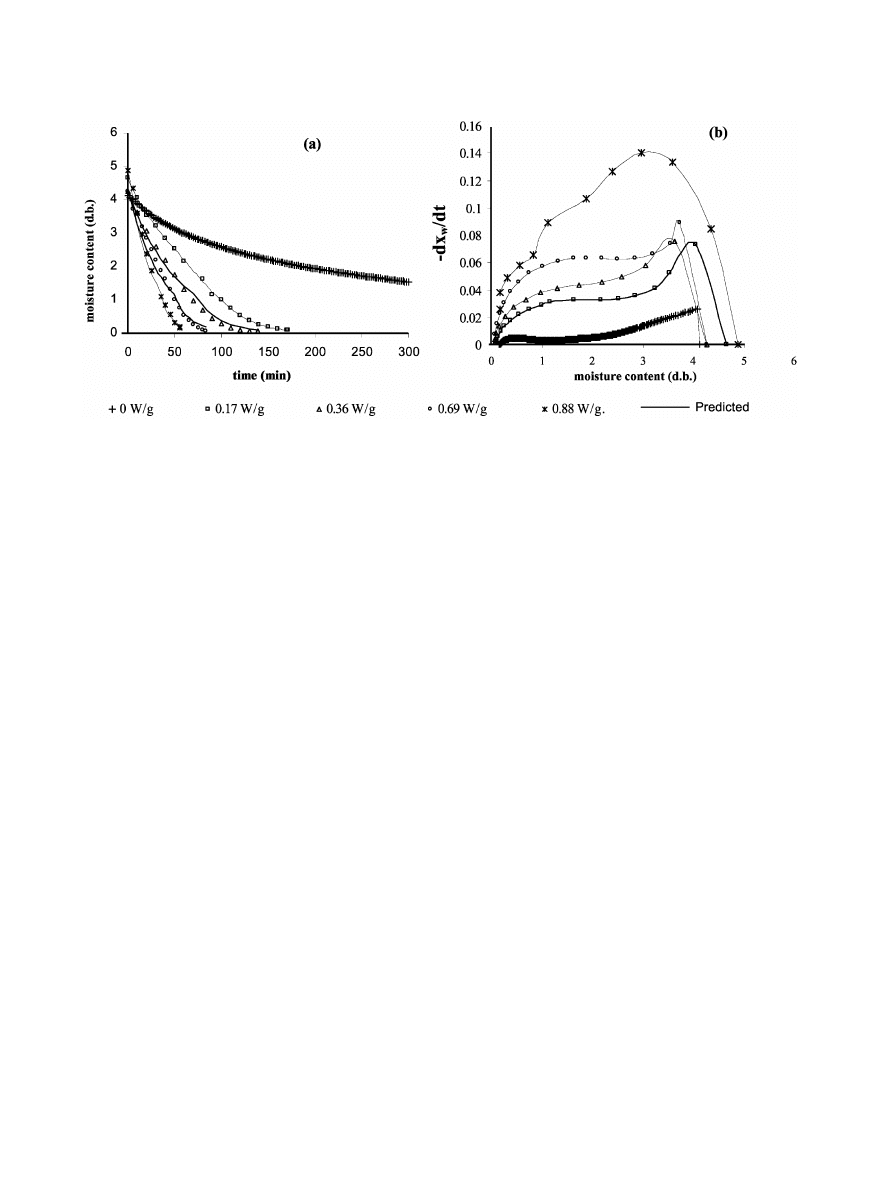
Fig. 2. Drying curves and drying rate curves at different drying conditions
(or MW power applied).
was determined as well as the weight and 8Brix of the
rehydrating solution.
3. Results and discussion
The drying rate was significantly increased for micro-
wave-heated samples compared to only air-dried as can
be seen in Fig. 2, that shows drying curves and drying
rate curves for all the applied power levels. The higher
the power level, the greater the increase in drying rates.
Nevertheless, a limit for power application was estab-
lished on the basis of the colour stability of the product,
since for the maximum level applied incipient browning
was detected probably due to sugar caramelisation by
excessive local heating
). Drying rate showed a fast
increase at the beginning of the process due to MW
sample heating and a subsequent decrease, showing two
differentiated periods: the first, where drying rate
decreases slowly to reach a plateau with a practically
constant value, and the second with a rapidly decreasing
drying rate from a given critical moisture content. So,
drying rate curves showed a sigmoid shape, where the
influence of MW power can be observed in practically
the entire range of sample moisture content. Neverthe-
less, at a higher power level, the initial rates are more
greatly enhanced.
The lack of steadiness in the drying rate in the first
period, even in the air drying experiment, points out the
diffusion controlled water transport in the sample inter-
face where the process driving force is progressively
reduced in line with the water activity reduction of the
external cells. From a specific moisture content, when a
great number of cell layers in the tissue have lost a
considerable amount of moisture, dried cell layers offer
a much greater resistance to water diffusion through the
interface and the drying rate slows down rapidly.
At the first step of the process, sample MW power
absorption provokes internal water heating and evapo-
ration, greatly increasing the effective water diffusion.
This can also provoke cell rupture and debonding since
solubility of pectic material of middle lamellae increases.
In this sense, the less structured material will offer lower
resistance to water transport and drying rate becomes
much higher. Nevertheless, the loss factor of the sample
decreases in the course of drying, thus inhibiting the
MW effect and limiting drying rate at lower moisture
content.
On the basis of these considerations, drying of orange
slices was modelled through a simple empiric model
with two steps, also considered by other authors for
microwave drying of fruits
Mujumdar, 1995; Kiranoudis, Tsami & Maroulis, 1997;
Maskan, 2000, 2001
) In each step, a kinetic coefficient
(k ) related with the water effective diffusion was
i
obtained. To obtain kinetic coefficients, the logarithm of
reduced moisture content
(ratio between the moisture
content at time
t
(x ) and the initial value (x ), both
w
wo
on d.b.x was plotted as a function of the drying time. In
this way, two linear ranges for experimental points were
observed at each MW power. The slopes of each fitted
straight-lines are
k and k coefficients, respectively, for
1
2
the first and second periods, according to kinetic Eqs.
(1) and (2). Critical values of moisture (x ) and time
wc
(t ) that separate these periods were obtained from the
c
straight-line intersection. Table 1 shows the kinetic
parameters obtained for all drying conditions. In all
linear regressions
r was greater than 0.96.
2
For
tGt :
c
y
k Øt
(
)
1
x
x Øe
(1)
s
w
wo

206
G.R. Dıaz et al. / Innovative Food Science and Emerging Technologies 4 (2003) 203–209
´
Table 1
Values of kinetic constants and critical times and moisture contents obtained for each drying condition
Microwave power
(Wyg)
k
(min )
y
1
1
k
(min )
y
1
2
x
(d.b.)
wc
t
(min)
c
x
(d.b.)
wf
S.E.
0
y
0.0031
y
0.014
0.605
653
0.14
2.85
0.17
y
0.0120
y
0.033
0.888
127
0.13
0.38
0.36
y
0.0209
y
0.038
0.876
72
0.10
0.20
0.69
y
0.0324
y
0.076
1.005
44
0.11
0.21
0.88
y
0.0453
y
0.085
1.038
29
0.14
0.21
2
8
x yx calc.
Ž
.
i
i
S.E.
y
N
For
tFt :
c
y
k tyt
(
(
))
2
c
x sx Øe
(2)
w
wc
Values of kinetic constants and critical time were
correlated with the applied MW power, expressed per
mass unit of product. The following Eqs.
obtained by linear regression, allow us to explain a high
percentage of the total variance. In Eqs.
k
and
k
were the
k and k values obtained in air
01
02
1
2
drying, without applying MW. Although the standard
deviation of
k
and
k
are higher than those of other
01
02
k , this fact does not imply a great error in predictions
i
due to their very small values when compared with the
other
k . Model predicts a linear increase in kinetic
i
constants in line with the MW power level, whereas an
inversely proportional
(hyperbolic) relationship was
deduced between critical time, from which moment
forwards the drying rate falls sharply, and the applied
MW power.
k yk sbØ
(P ym )
(3)
1
01
i
o
k yk sgØ
(P ym )
(4)
2
02
i
o
a
t s
(5)
c
P ym
Ž
.
i
o
where
P is the applied MW power
(W), m the sample
i
o
initial weight
(g),
a
s
23.584 W min
yg,
b
s
0.047 g
y
Wmin,
g
s
0.082 g
yWmin, and critical time
(t ) and k
c
i
are, respectively, in min and min
.
y
1
In Fig. 2a, lines represent the predicted drying curves,
by applying Eqs.
(1)–(5) at each MW power level. A
close fit can be observed which was quantified through
standard error
(S.E.) of the model shown in Table 1 for
each drying condition. The higher the power level, the
closer the fit of the model.
Rehydration experiments were performed to obtain
the sample moisture uptake and also the decrease of
soluble solids. In this sense, the solute concentration in
the rehydrating solution
(RS) was followed through
refractometry, as well as the solution weight losses
during sample manipulation at each control. Applying
mass balances for water and solutes
the water gain
(DM ) (Eq. (8)) and solute loss (DM )
w
s
(Eq. (9)) of the samples were deduced at each time, as
well as the moisture and solute contents. At the end,
sample analysis was carried out to check balances. In
Eq.
(6) and Eq. (7), weight changes were always
referred per initial sample dry matter, according to Eq.
(8) to Eq. (11).
D
M
s
D
M qDM
(6)
w,RS
w
w,L
D
M
s
D
M qDM
(7)
s,RS
s
s,L
being,
t
t
o
o
m Øx ym Øx
w
w
D
M s
(8)
w
o
o
m Ø 1yx
Ž
.
w
t
t
o
o
m Øx ym Øx
s
s
D
M s
(9)
s
o
o
m Ø 1yx
Ž
.
w
t
t
o
o
m Ø 1yy ym Ø 1yy
Ž
.
Ž
.
RS
s
RS
s
D
M
s
(10)
w,RS
o
o
m Ø 1yx
Ž
.
w
t
t
o
o
M Øy ym Øy
RS
s
RS
s
D
M
s
(11)
s,RS
o
o
m Ø 1yx
Ž
.
w
t
t
t
D
m Ø 1yy
Ž
.
s
8
ts0
D
M
s
(12)
w,L
o
o
m Ø 1yx
Ž
.
w
t
t
t
D
m Øy
s
8
ts0
D
M s
(13)
s,L
o
o
m Ø 1yx
Ž
.
w
Where:
207
G.R. Dıaz et al. / Innovative Food Science and Emerging Technologies 4 (2003) 203–209
´
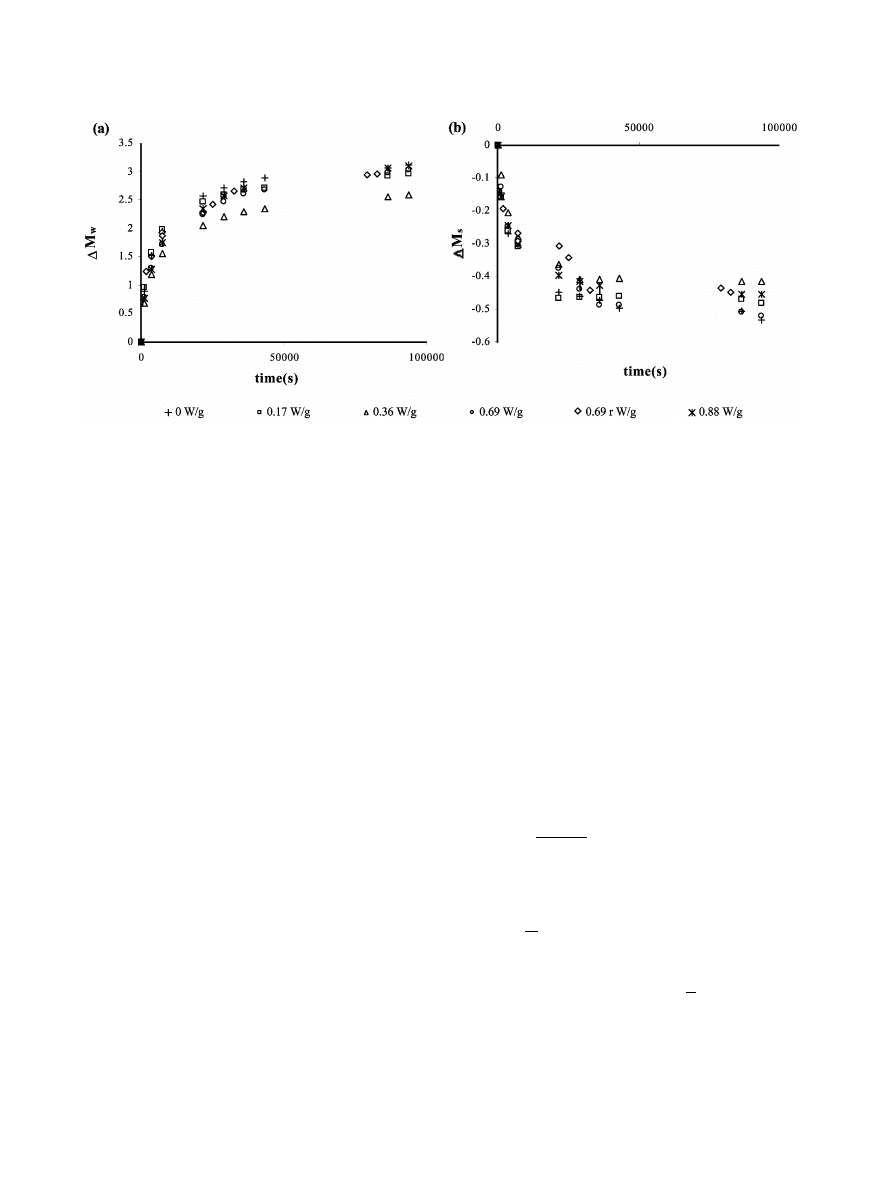
Fig. 3. Water gain and soluble solid loss in rehydration experiments for the different MW power applied in drying.
m:
mass
(g)
x:
mass fraction of component
i
(water or solutes) in
sample
y:
mass fraction of component
i
(water or solutes) in
rehydrating solution.
Subscripts:
s:
soluble solids,
w: water, RS: rehydrating solution,
L: rehydrating liquid losses during sample handling.
Superscripts:
t: at time t, 0: at initial time
D
m :
t
difference between the total mass
(sample plus solu-
tion
) at the time t and the total mass at the previous
control time, which corresponds to the liquid lost be-
tween two successive controls.
Fig. 3 shows the water gain and solute loss of the
samples dried by different treatments as a function of
the rehydration time. No clear tendencies concerning
rehydration rate or asymptotic values were observed as
a function of the MW power, although samples treated
with 0.36 W
yg seem to show lesser water gains and
solute losses at long rehydration times. Nevertheless,
this result might not be significant since it corresponds
to an isolated result at intermediate MW power level.
On the other hand, the two experimental series carried
out at 0.69 W
yg show experimental values that cover
practically the complete range of variation at a deter-
mined time. The water absorption capacity
(g of gained
water per g of water lost during drying
) range between
0.62 and 0.77 without clear tendencies as a function of
the MW power applied. In the same sense the soluble
solid retention
(g of soluble solids in dehydrated sample
per g of soluble solids in dried sample
) was 0.6"0.2.
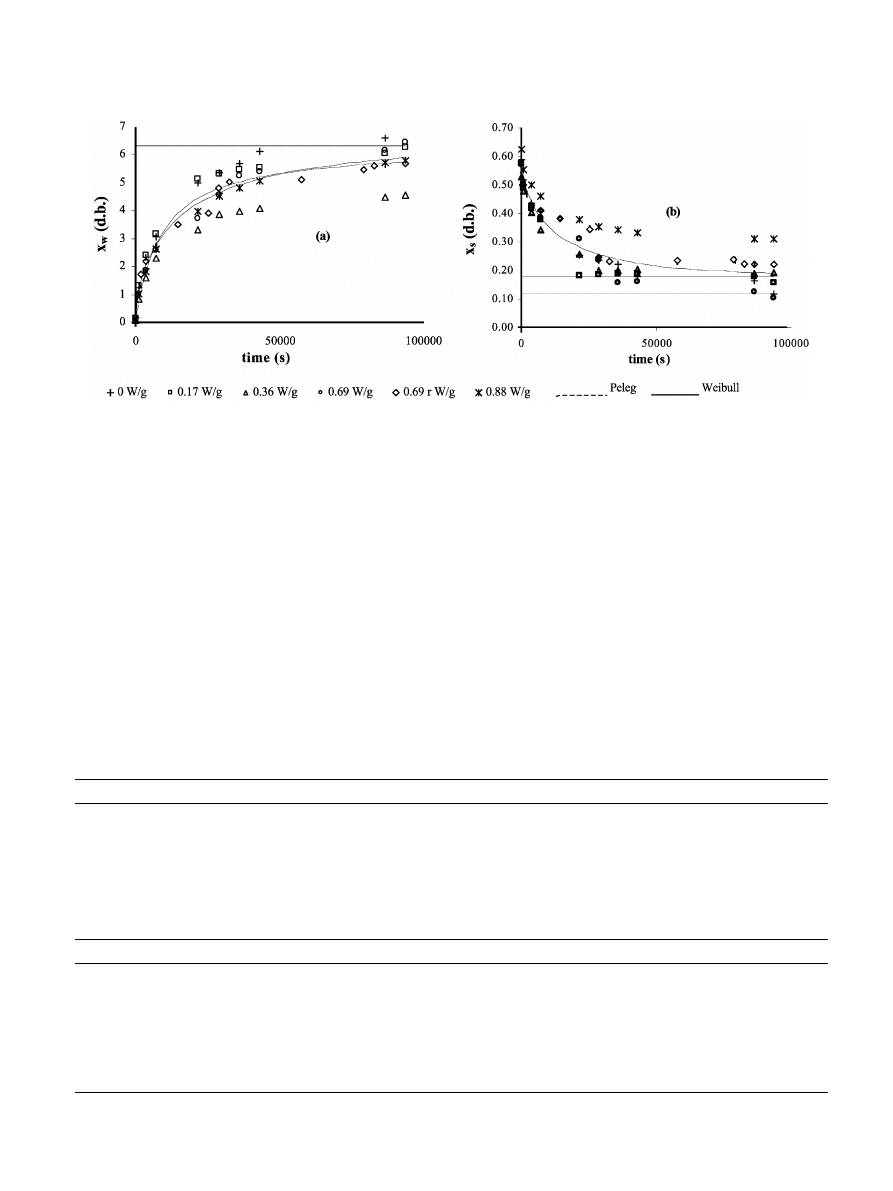
In Fig. 4, the development of water and soluble solid
contents
(d.b.) as a function of rehydration time can be
observed. Experimental values at long dehydration cover
a wide range but, as commented on above, no clear
tendencies as a function of applied MW power were
observed. Treatment at the highest power level showed
the highest values of soluble solid loss, whereas the
samples dried by hot air seems to show the highest
values of water uptake.
Table 2 shows the initial moisture content of dried
samples as well as the parameters obtained from fitting
the Peleg’s (Eq.
(14) and Eq. (15)) and Weibull’s (Eq.
(16)) models (Hahn & Shapiro, 1967; Peleg, 1988;
Cunha, Oliveira & Oliveira, 1998
) to rehydration data,
in terms of water and soluble solid contents, for the
different drying conditions and for all data obtained in
different conditions grouped. Both models were fitted
by a non-linear procedure
(using SOLVER from
EXCEL97
) and the standard error (S.E.) estimated
either in the individual fittings or in the fitting or
grouped data are shown in Table 2. The close fit of both
models can be seen through the low values of S.E.,
even when considering data from all treatments together.
t
o
x t sx q
(14)
Ž .
w
w
k qk Øt
1
2
where,
1
o
x sx q
(15)
we
w
k
2
a
B
B
B
E EE
t
o
o
C
C C F FF
x t sx q x yx Ø 1yexp y
(16)
Ž .
Ž
.
w
w
we
w
D
D
D
G GG
b
Where
x smoisture content initial
(d.b)
o
w
x
(t)smoisture content (d.b.)
w
x smoisture equilibrium
(d.b)
we
208
G.R. Dıaz et al. / Innovative Food Science and Emerging Technologies 4 (2003) 203–209
´
Fig. 4. Moisture contents and soluble solid contents reached during rehydration experiments for different MW power applied in drying
(experi-
mental points and fitted models
). Horizontal lines show the equilibrium moisture content predicted by the models.
Table 2
Parameter of rehydration obtained from fitting of Peleg and Weibull equations for moisture and soluble solid content date
W
yg
D
M
wmax
x
(d.b.)
wo
x
(d.b.)
1
we
k
1
1
k
1
2
S.E.
a
2
b
2
x
(d.b)
2
we
S.E.
Water
0
3.1
0.18
7.4
1408
0.13
0.22
0.62
193.5
7.4
0.11
0.17
2.9
0.12
6.5
1060
0.15
0.18
0.64
116.9
6.3
0.02
0.36
2.5
0.07
4.8
1721
0.20
0.11
0.72
102.1
4.4
0.12
0.66
3.0
0.15
7.2
2163
0.14
0.29
0.60
341.9
7.6
0.04
0.66*
2.9
0.15
5.9
1336
0.17
0.34
0.50
235.6
6.5
0.18
0.88
3.0
0.07
6.2
1709
0.16
0.18
0.62
205.3
6.2
0.01
Group
2.9
0.16
6.9
1761
0.14
0.47
0.59
183.3
6.6
0.40
W
yg
D
M
smax.
x
(d.b.)
so
x
(d.b.)
1
se
k
1
1
k
1
2
S.E.
a
2
b
2
x
(d.b)
2
se
S.E.
Soluble solid content
0
y
0.53
0.58
0.09
y
20918
y
2.03
0.02
0.65
180.4
0.11
0.01
0.17
y
0.48
0.57
0.12
y
14278
y
2.22
0.022
0.83
89.24
0.17
0.02
0.36
y
0.41
0.52
0.15
y
18464
y
2.68
0.012
0.81
98.0
0.19
0.01
0.66
y
0.52
0.57
0.04
y
26478
y
1.91
0.03
0.64
252.5
0.05
0.02
y
0.44
0.57
0.19
y
21223
y
2.66
0.03
0.51
212.4
0.17
0.03
0.88
y
0.45
0.62
0.29
y
19297
y
3.02
0.01
0.59
122.6
0.30
0.004
Group
y
0.55
0.58
0.12
y
16993
y
2.10
0.04
0.48
230.0
0.18
0.03
Replicate.
*
k sconstant
(s )
y
1
1
k sconstant
2
a
s
shape parameter
b
s
rate parameter
tstime
(s)
From the obtained data it can be concluded that drying
conditions tested did not influence the rehydration
capacity of orange slices and so, this index did not
indicate notable differences in sample quality. Water and
soluble content predictions could be made with a similar
error by using Peleg’s or Weibull’s models and the
parameters obtained from the respective fitting of data
from all experimental conditions together. Similar results
were reported by Funebo and Ohlsson
(1998) and
(2000) for microwave assisted drying of apple,
mushrooms and banana slices. Nevertheless, Drouzas
and Schubert
(1996) observed that microwave–vacuum
dried banana slices absorbed twice as much as moisture
than the one conventionally dried.
4. Conclusion
Despite the low levels of MW power used, a sharp
reduction in drying time of orange slices was obtained
when these were applied in combination with air drying
at 60 8C. Kinetic constants increase linearly with the
applied MW power, whereas time required to reach

209
G.R. Dıaz et al. / Innovative Food Science and Emerging Technologies 4 (2003) 203–209
´
critical moisture content decreases inversely proportional
to MW power. Additionally, no differences in rehydrat-
ing behaviour were observed as a function of the applied
MW power. So, the highest level, which was limited to
avoid sample browning, will be recommended to reduce
the drying time.
Acknowledgments
Authors thank the Commission Interministerial de
Ciencia y Tecnologıa
(Spain) and CYTED program for
´
the financial support.
References
AOAC.
(1980). Association of Official Analytical Chemist. Official
methods of Analysis. Washington DC.
Bhartia, P., Stuchly, S. S., & Hamid, M. A. K.
(1973). Experimental
results for combination microwave and hot air drying.
Journal of
Microwave Power, 8, 245 –252.
Cunha, L. M., Oliveira, F. A. R., & Oliveira, J. C.
(1998). Optimal
experimental design for estimating the kinetic parameters of pro-
cesses described by the Weibull probability distribution function.
Journal of Food Engineering, 37, 175 –191.
Decareau, R. V.
(1985). Microwave in the food processing industry.
Food Technology, 41, 85 –91.
Drouzas, A. E., & Schubert, H.
(1996). Microwave application in
vacuum drying of fruits.
Journal of Food Engineering, 28, 203 –
209.
Drouzas, A. E., Tsami, E., & Saravacos, G. D.
(1999). Microwavey
vacuum drying of model fruits gels.
Journal of Food Engineering,
63, 679 –683.
Funebo, T., & Ohlsson, T.
(1998). Microwave—assisted air dehydra-
tion of apple and mushroom.
Journal of Food Engineering, 38,
353 –367.
Hahn, G. J., & Shapiro, S. S.
(1967). Statistical Models in Engineer-
ing. New York: John Wiley & Sons.
Lin, T. M., Durance, T. D., & Scaman, C. H.
(1998). A Character-
isation of vacuum microwave air and freeze dried carrots slices.
Food Research International, 4, 111 –117.
Lyons, D. W., Hatcher, J. D., & Sunderland, J. E.
(1972). Drying of
a porous medium with internal heat generation.
International
Journal Heat Mass Transfer, 15, 897.
Kiranoudis, C. T., Tsami, E., & Maroulis, Z. B.
(1997). Microwave
vacuum kinetics of some fruits.
Drying Technology, 15
(10), 2421 –
2440.
Krokida, M. K., Kiranoudis, C. T., & Maroulis, Z. B.
(1999).
Viscoelastic behaviour of dehydrated products during rehydration.
Journal of Food Engineering, 40, 269 –277.
Martın, M. E., Andres, A., Martınez-Navarrete, N., Chiralt, A., &
´
´
´
Fito, P.
(1999). Combined air–microwave of fruit as affected by
vacuum impregnation treatments. In G. V. Barbosa-Canovas, S. P.
´
Lomberdo,
Proceedings of the sixth conference of food engineering
(pp. 465 –470). New York: AIChE.
Maskan, M.
(2000). Microwaveyair and microwave finish drying of
banana.
Journal of Food Engineering, 44, 71 –78.
Maskan, M.
(2001). Drying, shrinkage and rehydration characteristics
of kiwifruits during hot air and microwave drying.
Journal of Food
Engineering, 48, 177 –182.
Monselise, S. P.
(1986). Citrus. In S. P. Monselise, CRC Handbook
of fruit Set and Development
(pp. 87 –108). Boca Raton, FL: CRC
Press.
Mudgett, R. E.
(1989). Microwave food processing. Food Technology,
43, 117 –126.
Peleg, M.
(1988). A empirical model for the description of moisture
sorption curves.
Journal of Food Science, 53, 1216 –1219.
Prabhanjan, D. G., Ramaswamy, H. S., & Raghavan, G. S. V.
(1995).
Microwave—assisted convective air drying of the thin layer carrots.
Journal of Food Engineering, 25, 283 –293.
Rosenberg, U., & Boegl, W.
(1987). Microwave thawing, drying and
baking in the food industry.
Food Technology, 41
(6), 85 –91.
Ruız Dıaz, G., Martınez-Monzo, J., Barat, J. M., Chiralt, A., & Fito,
´
´
´
´
P.
(2000). Applying microwaves in drying of orange slices. Pro-
ceedings of the 12th international drying symposium. IDS 2000 .
Amsterdam: Elsevier Science (Paper n8 239).
Samson, J. A.
(1986). Citrus. Tropical Fruits. Second edition (pp.
73 –138
). Essex: Longman Group UK Ltd.
Shiffman, R.
(1985). An update of the application of microwave
power in the food industry.
Journal of Microwave Power, 15, 221 –
224.
Ting, S. V., & Attaway, J. A.
(1971). Citrus fruits. In A. C. Hulme,
The Biochemistry of Fruits and their Products vol 2
(pp. 107 –
169
). London: Academic Press.
Tsami, E., Krokida, M. K., & Drouzas, A. E.
(1999). Effect of drying
on the sorption characteristics of model fruit powders.
Journal of
Food Engineering, 38, 381 –392.
Tulasidas, T. N., Raghavan, G. S. V., Norrish, E. R.
(1992). Compar-
ative Studies on Air and Microwave Drying of Grapes. Proceedings
of the ASAE Annual Meeting, Charlotte, NC, Paper n8 923016.
Tulasidas, T. N., Raghavan, G. S. V., & Norrish, E. R.
(1993).
Microwave and convective drying of grape.
Transaction ASAE, 36,
1861 –1865.
Tulasidas, T. N., Raghavan, G. S. V., & Mujumdar, A. S.
(1995).
Microwave drying of grapes in a single mode cavity at 250 MHz—
I: Drying kinetics.
Drying Technology, 13
(8&9), 1949 –1971.
Witt, A.
(1980). Microwaves and Food Processing. Proceedings UIE
Conferences, Cannes, June.
Document Outline
Wyszukiwarka
Podobne podstrony:
Dance, Shield Modelling of sound ®elds in enclosed spaces with absorbent room surfaces
Dance, Shield Modelling of sound ®elds in enclosed spaces with absorbent room surfaces
Mapping of temperature distribution in pharmaceutical microwave vacuum drying
Experimental study on drying of chilli in a combined Microwave vacuum rotary drum dryer (Weerachai K
Drying kinetics and quality of vacuum microwave dehydrated garlic cloves and slices
Drying kinetics and drying shrinkage of garlic subjected to vacuum microwave dehydration (Figiel)
Proteomics of drug resistance in C glabrata
Microstructures and stability of retained austenite in TRIP steels
MMA Research Articles, Risk of cervical injuries in mixed martial arts
Development of financial markets in poland 1999
Antigone Analysis of Greek Ideals in the Play
Analysis of Police Corruption In Depth Analysis of the Pro
Low Temperature Differential Stirling Engines(Lots Of Good References In The End)Bushendorf
01 [ABSTRACT] Development of poplar coppices in Central and Eastern Europe
Drying, shrinkage and rehydration characteristics of kiwifruits during hot air and microwave drying
13 161 172 Investigation of Soldiering Reaction in Magnesium High Pressure Die Casting Dies
feminism and formation of ethnic identity in greek culture
więcej podobnych podstron