
PRZEGL!D ELEKTROTECHNICZNY (Electrical Review), ISSN 0033-2097, R. 86 NR 10/2010 187
Irena FRYC
Bialystok University of Technology, Faculty of Electrical Engineering
LED's spectral power distribution under different condition of
operating temperature and driving current
Streszczenie. Jako!" !wiat#a emitowanego przez LED-y zale$y od wielu czynników. Najwi%kszy wp#yw maj& temperatura oraz nat%$enie pr&du
pracy. W zastosowaniach o!wietleniowych jednym z najwa$niejszych parametrów jest utrzymanie sta#ego strumienia !wietlnego oraz barwy
emitowanego !wiat#a. W artykule przedstawione zosta#y dane pomiarowe komercyjnie dost%pnych diod elektroluminescencyjnych. Na podstawie
tych danych przeanalizowana zosta#a mo$liwo!" uzyskiwania z LED !wiat#a o sta#ych strumieniu i barwie w zmieniaj&cej si% temperaturze otoczenia.
(Analiza w!a"ciwo"ci spektralnych LEDów z zale#no"ci od temperatury i nat$#enia ich pr%du pracy)
Abstract. The quality of light emitted by LEDs depends on many factors. The most significant are ambient temperature and driving current. In
lighting application the most important is to have light with constant value of luminous flux and color. In this paper some data taken from
measurement of commercially available LEDs will be presented. Based on those data is possible to make an analysis which can be helpful with
getting constant output of LED luminous flux.
S!owa kluczowe: pomiary promieniowania optycznego, diody elektroluminescencyjne, rozk!ad widmowy mocy promieniowania
optycznego, zale"no#ci temperaturowe.
Keywords: optical radiation measurement, light emitting diodes, spectral power distributions, temperature dependence.
Introduction [1]
The
light-emitting diodes
(LEDs) were discovered by
British radio engineer Henry Joseph Round completely by
accident. While investigating the electrical properties of a
metal semiconductor SiC he witnessed the light emission
from a solid-state material driven by an electrical current.
Round
reported
this
“curious
phenomenon”
of
electroluminescence in 1907. Right now we can see the
scientific and commercial significance of such a discovery,
but the phenomenon of electroluminescence was forgotten
for several years. However, in 1923 it was rediscovered by
Russian scientist Oleg Vladimirovich Lossev. In 1924 he
take the first photograph of electroluminescence from an
LED and he carried out detailed measurements of the
diode’s current-voltage characteristics. Also he showed that
the emission could be switched on and off very rapidly. In
recognition of his accomplishments he was awarded the
PhD degree in 1938. Lossev’s was the first who did detailed
study of semiconductor electroluminescence but he did not
make a correct interpretation physical phenomena of light
emission emitted by this kind of diode. The first correct
interpretation of light emission from a p-n junction was
provided by Kurt Lehovec and colleagues at the Signal
Corps Engineering Laboratories in New Jersey in 1951.
T
he first commercial LED was introduced to the world
only about 40 years ago. Since then, the performance of
LEDs has been improved continuously with a breathtaking
acceleration of progress in the last decade.
These
advances were kick started by replacing SiC with more
efficient materials based on III-V compounds. Key
milestones include the demonstration of single-crystal GaAs
(Welker, 1952), which provides the ideal substrate for many
devices. This platform was used for the initial development
of GaAs LEDs. The first visible LEDs based on III-V
materials were built in 1955 by Wolff and colleagues at the
Signal Corps Engineering Laboratories. This orange-
emitting GaP device generated light through the impact
ionization of carriers at the metal-semiconductor junction.
LED progress followed through the development of new
red, yellow, or
ange and green emitting materials in
the1960s and 70s,which were made from III-V compounds,
such as GaPAs, nitrogen-doped GaP, nitrogen-doped
GaPAs, and zinc and oxygen doped GaP. These LEDs
were far more efficient than Wolff’s metal-semiconductor
structure but they still fall well short of the performance of
today’s high-power LEDs, which are based on AlGaAs and
AlGaInP. But still there was lack of blue LEDs.
In 1969 Paul Maruska made a single-crystalline GaN
film. However, these films were unintentionally n-doped and
the addition of p-type dopant only produced insulating
material. The lack of p-doped material led Maruska’s team
to build metal-insulator-semiconductor diodes, but such
devices are inevitably inefficient and this project was
abandoned in the early 1970s. However, in 1989 Isamu
Akasaki and co-workers from Nagoya in Japan produced
the first p-type doping and conductivity in GaN. An LED with
1% efficiency followed three years later, but this was soon
surpassed by Shuji Nakamura from Nichia, who managed
to fabricate blue and green GaInN double-heterostructure
LEDs that were 10 times as efficient. Further improvements
have continued to this day.
Current interest in single-color LEDs is overshadowed
by their white cousins. One approach to producing white
light involves the mixing of emissions from several different-
colored LEDs. However, the dominant commercial method
that was pioneered by Nichia, which is simpler and
produces a high color rendering index, involves a yellow
phosphor and a blue LED chip. The blue-emitting chip
excites the yellow-emitting phosphor and white light is
created from mixing these two sources.
Scientists and engineers that strive to control and tune
all of the properties of an LED have the unprecedented
challenge of constructing light sources that can be
controlled in terms of spectrum, polarization, color
temperature, temporal modulation and spatial emission
pattern.
The physical mechanism by which semiconductor
LEDs emit light [2]
The spontaneous recombination of electron–hole pairs and
simultaneous emission of photons is the physical
mechanism by which semiconductor LEDs emit light is.
Spontaneous recombination has certain characteristics that
determine the optical properties of LEDs. In an electron–
hole recombination process is electrons in the conduction
band and holes in the valence band are assumed to have
the parabolic dispersion relations.
(1)
!
"
#
$
%
&
'
(
)
*
e
C
m
k
h
E
E
2
2
2
2
(for electrons)
188 PRZEGL!D ELEKTROTECHNICZNY (Electrical Review), ISSN 0033-2097, R. 86 NR 10/2010
and
(2)
!
"
#
$
%
&
'
(
+
*
h
V
m
k
h
E
E
2
2
2
2
(for holes)
where
!
e
m and
!
h
m are the electron and hole effective
masses, h is Planck’s constant, k is the carrier wave
number, and
V
E and
C
E are the valence and conduction
band edges, respectively.
The requirement of energy and momentum conservation
leads to further insight into the radiative recombination
mechanism. It follows from the Boltzmann distribution that
electrons and holes have an average kinetic energy of kT .
Energy conservation requires that the photon energy is
given by the difference between the electron energy,
e
E
and the hole energy,
h
E , i.e.
(3)
g
h
e
E
E
E
h
,
+
*
-
The photon energy is approximately equal to the
bandgap energy,
g
E , if the thermal energy is small
compared with the bandgap energy
g
E
kT ..
. Thus the
desired emission wavelength of an LED can be attained by
choosing a semiconductor material with an appropriate
bandgap energy. It is helpful to compare the average carrier
momentum with the photon momentum. A carrier with
kinetic energy kT and effective mass
!
m
has the
momentum
(4)
kT
m
m
m
m
p
!
!
!
!
*
-
*
-
*
2
2
1
2
2
The momentum of a photon with energy
g
E can be
derived from the de Broglie relation
(5)
c
E
c
h
k
h
p
g
*
-
*
(
*
2
Calculation of the carrier momentum (using Eq. 4) and
the photon momentum (using Eq. 5) yields that the carrier
momentum is orders of magnitude larger than the photon
momentum. Therefore the electron momentum cannot
change significantly during the transition from the
conduction to the valence band. The transitions are
therefore “vertical” i.e. electrons only recombine with holes
that have the same momentum or k value.
Using the requirement that electron and hole moment
are the same, the photon energy can be written as the joint
dispersion relation:
(6)
!
!
!
"
#
$
%
&
'
(
)
*
"
#
$
%
&
'
(
)
+
"
#
$
%
&
'
(
)
*
r
g
h
V
e
C
m
k
h
E
m
k
h
E
m
k
h
E
E
2
2
2
2
2
2
2
2
2
2
2
2
where
r
m is the reduced mass given by:
(7)
!
!
!
)
*
h
e
r
m
m
m
1
1
1
Using the joint dispersion relation, the joint density of
states can be calculated as:
(8)
/
0
g
/
*
r
E
E
/
h
m
(E)
+
"
"
#
$
%
%
&
'
(
(
*
1
2
3
2
2
2
2
2
1
The distribution of carriers in the allowed bands is given
by the Boltzmann distribution:
(9)
"
#
$
%
&
'
+
*
kT
E
exp
)
E
(
f
B
The emission intensity as a function of energy is
proportional to the product of Eqs. (8) and (9),
(10)
"
#
$
%
&
'
+
+
2
kT
E
exp
E
E
)
E
(
I
g
The maximum emission intensity occurs at:
(11)
kT
E
E
g
2
1
)
*
LED's
photometric
parameters
under
different
condition of operating temperature
All LEDs photometric parameters could be derived
based on measured SPDs. The LED spectral power
distribution depends on many factors but most important is
drive current and junction temperature
j
T . Based on Eqs.
(10) and (11) we can see, that SPDs of an LED depend on
junction temperature
j
T . Also according to manufacturer
data of high power LEDs, reported in Cree® XLamp® Long-
Term Lumen Maintenance [3] there is additional factor that
affects the rate of spectral power distribution and lumen
depreciation for LED. This is the temperature
A
T of the air
surrounding the LED. For this reason is possible to say that
LEDs SPDs depends on the operating temperature. The
term operating temperature means that we take under
consideration
j
T and
A
T
.
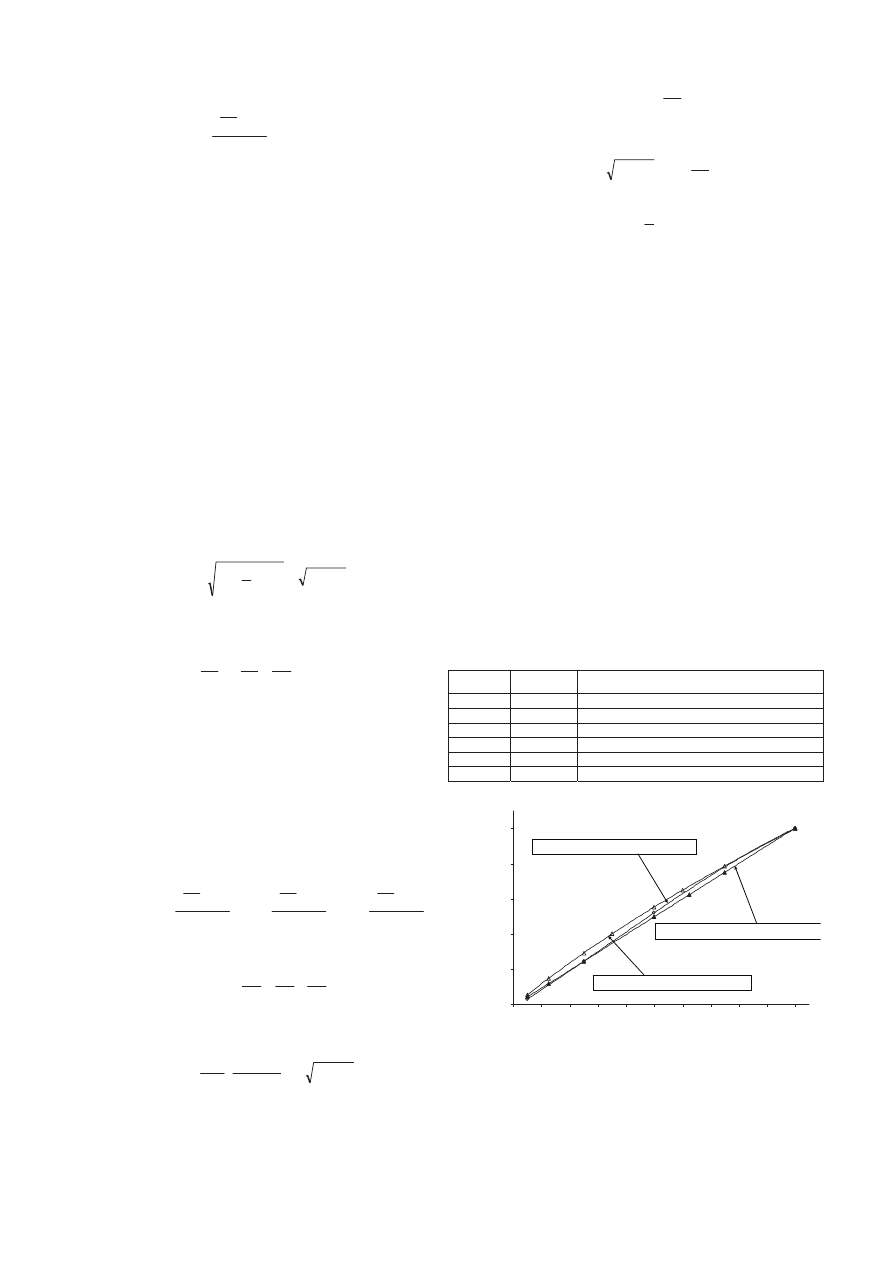
All LEDs photometric parameters were measured
according to recommendations given by CIE 127:2007
document. Figure (1) and (2) show the LEDs luminous flux
relative value versus relative value of drive current. The
measurements
were taken at connstant operating
temperature. Under consideration [4] (Table. 1) were taken
LEDs from blue to red.
Table 1. The LEDs taken under consideration [4]
No.
p
3
[nm]
Part number
1
420.0
LEDREPS UVA-15N20K
2
472.5
SunLED Corporation XLBB12WH
3
504.4
Roithner Lasertechnik 383-2UBGC
4
587.7
LEDTRONICS INC, L200CY5B
5
633.9
LEDTRONICS INC. L200CWR3KH-30D
6
715.0
Roithner Lasertechnik ELD-720-524
Fig. 1. The LEDs luminous flux relative value versus relative value
of drive current [4]
0,0
0,2
0,4
0,6
0,8
1,0
0,0
0,1
0,2
0,3
0,4
0,5
0,6
0,7
0,8
0,9
1,0
current relative value
lu
m
in
o
u
s
f
lu
x
r
e
la
ti
v
e
v
a
lu
e
.
2 - SunLED Corporation XLBB12WH
3 - Roitchner Lasertechnik 383-2UBGC
6 - Roitchner Lasertechnik ELD-720-524
PRZEGL!D ELEKTROTECHNICZNY (Electrical Review), ISSN 0033-2097, R. 86 NR 10/2010 189
0,0
0,2
0,4
0,6
0,8
1,0
0,0
0,1
0,2
0,3
0,4
0,5
0,6
0,7
0,8
0,9
1,0
drive current relative value
lu
m
in
o
u
s
f
lu
x
r
e
la
ti
v
e
v
a
lu
e
1 - LEDREPS UVA-L5N20K
5 - LEDTRONICS INC. L200CWR3KH-30D
4 - LEDTRONICS INC. L200CY5B
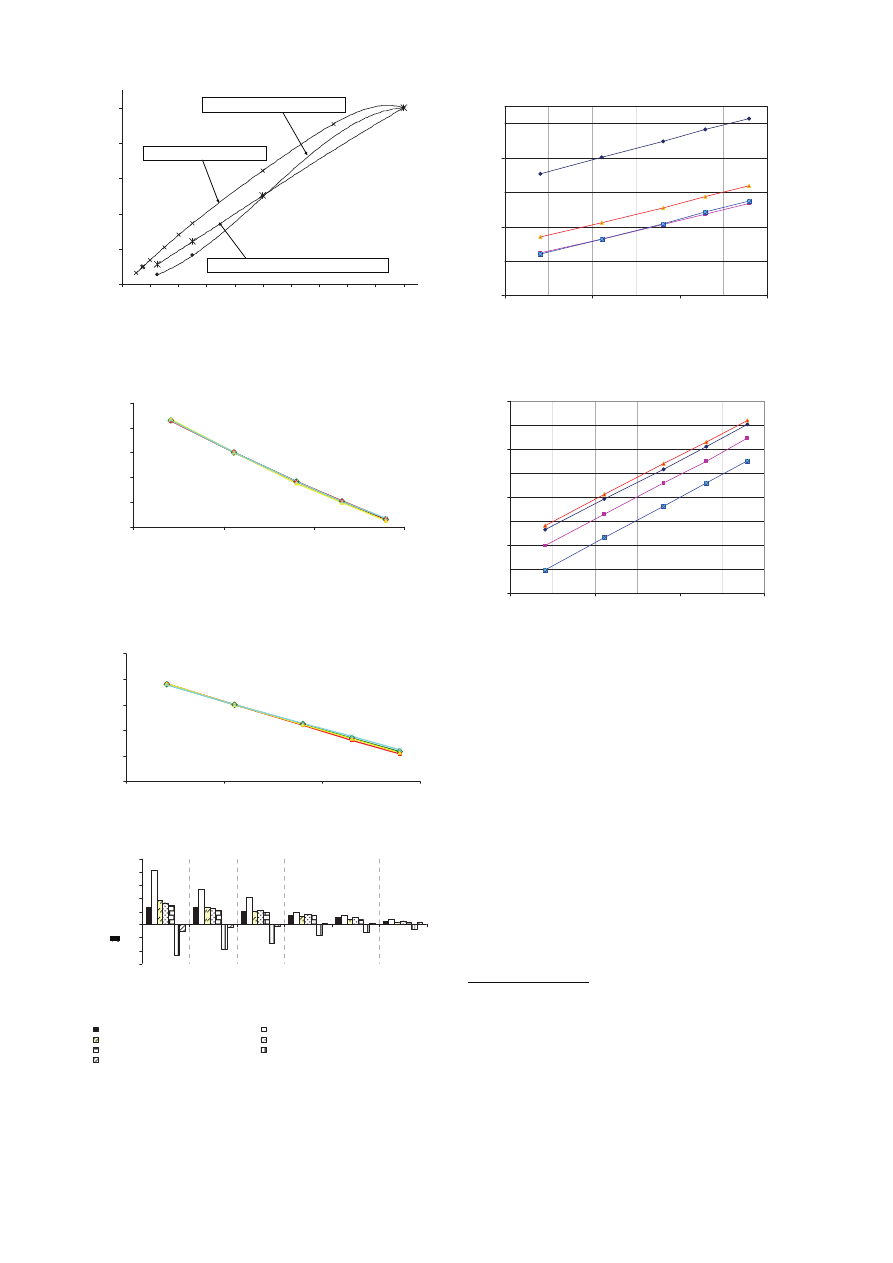
Fig. 2. The LEDs luminous flux relative value versus relative value
of drive current [4]
4 LEDs HLMP-EL30 type with
3
p
= 591 nm
0,7
0,8
0,9
1,0
1,1
1,2
10
20
30
40
Temperature [
o
C]
lu
m
in
o
u
s
f
lu
x
re
la
ti
v
e
v
a
lu
e
Fig. 3. The LED luminous flux relative value versus temperature [4]
4 LEDs HLMP-C116 type with
3
p
= 643 nm
0,7
0,8
0,9
1,0
1,1
1,2
10
20
30
40
Temperature [
o
C]
lu
m
in
o
u
s
f
lu
x
re
la
ti
v
e
v
a
lu
e
.
Fig. 4. The LED luminous flux relative value versus temperature [4]
-6
-4
-2
0
2
4
6
8
10
0.05 Imax, 0.125 Imax, 0.25 Imax,
0.5 Imax,
0.625 Imax, 0.75 Imax,
drive current relative value
s
p
e
c
tr
a
l
s
h
if
t
c
o
m
p
a
re
d
t
o
p
[n
m
]
u
n
d
e
r
I
m
a
x
Roitchner Lasertechnik ELD-720-524
Roitcher Lasertechnik 383 -2UBGC
LEDTRONICS INC. L200CY5B
Roitchner Lasertechnik LED-750-03AU
LEDTRONICS INC. L200CWR3KH-30D
SunLED Corporation XLBB12WH
LEDREPS UVA-L5N20K
Fig. 5. The LEDs spectral shift versus relative value of drive current
at constant temperature [4]
Dominant wavelength vs. temperature
471,50
472,50
473,50
10
20
30
40
Temperature [C]
D
o
m
in
a
n
t
w
a
v
e
l.
[
n
m
]
0.033 nm/ degree C
Fig. 6. The value of dominant wavelength of blue LED versus
temperature
Dominant wavelength vs. temperature
589,50
590,50
591,50
592,50
593,50
10
20
30
40
Temperature [C]
D
o
m
in
a
n
t
w
a
v
e
l.
[
n
m
]
0.096nm / degree C
Fig. 7. The value of dominant wavelength of yellow LED versus
temperature
The LEDs luminous flux relative value versus
temperature are show on Fig. 3 and 4. Figure 5 shows the
LEDs spectral shift versus relative value of drive current at
constant operating temperature. The bigest peak shift was
obserwed for SunLED Corporation XLBB12WH blue and
Roithner Lasertechnik 383-2UBGC green-blue LED.
Figures (6) and (7) shovs dependence of the value of LEDs
dominant wavelength versus temperature.
The work was done in Bialystok University of Technology
under grant S/WE/2/08.
REFERENCES
[1] E. Fred
Schubert and J.K. Kim, 100 years of LEDs, Compound
Semiconductors (2007)
[2] E. Fred Schubert, Light-Emitting Diodes, Cambridge University
Press (2006)
[3] Cree® XLamp® Long-Term Lumen Maintenance (2009)
[4] I. Fryc, Zrodlo swiatla o ksztaltowanej charakterystyce
widmowej, Bialystok University Press (2006)
Author: Irena Fryc, PhD, DsC, Bialystok University of Technology,
Faculty of Electrical Engineering, Department of Optical Radiation,.
Wiejska 45d, 15-351 Bialystok, E-mail: fryc@pb.edu.pl;
Wyszukiwarka
Podobne podstrony:
fairclough semiotic condition of social reproduction and transformation
Colonization with Arbuscular Mycorrhizal Fungi Promotes the Growth of Morus alba L Seedlings under G
Power Distribution Circuit (2 of 5)
Power Distribution Circuit (4 of 5)
Kinetics of scrap tyre pyrolysis under vacuum conditions
Power Distribution Circuit (5 of 5)
Power Distribution Circuit (3 of 5)
Power Distribution Circuit (1 of 5)
Testy Different use of english 10 r bzdak
Iannace, Ianniello, Romano Room Acoustic Conditions Of Performers In An Old Opera House
1 3 16 Comparison of Different Characteristics of Modern Hot Work Tool Steels
Learner differences roles of a teacher
88 1249 1261 Examination of the Real Prestressing Conditions of Tooling Systems
Fidic Conditions Of Contract F
Bille 2010 Different Shades of Blue
Chapter 10 Relation between different kinds of stratigraphic units
The comparison of two different forms of?vertisement
03 Power distribution Power losses
więcej podobnych podstron