
Energy performance and ef
ficiency of two sugar crops for the biofuel
supply chain. Perspectives for sustainable
field management in
southern Italy
Pasquale Garofalo
,
, Laura D'Andrea
, A. Vittorio Vonella
, Michele Rinaldi
,
A. Domenico Palumbo
a
Consiglio per la Ricerca in Agricoltura e l'Analisi dell'Economia Agraria
e Centro di Ricerca per la Cerealicoltura (CRA-CER), S.S. 673 km 25,200,
Foggia, Italy
b
Consiglio per la Ricerca in Agricoltura e l'Analisi dell'Economia Agraria
e Unita di Ricerca per i Sistemi Colturali degli Ambienti Caldo-Aridi (CRA-SCA),
via Celso Ulpiani, 5, Bari, Italy
a r t i c l e i n f o
Article history:
Received 3 May 2015
Received in revised form
6 August 2015
Accepted 11 October 2015
Available online 19 November 2015
Keywords:
Bioethanol
Fertilization
Soil tillage
Sweet sorghum
Sugar beet
a b s t r a c t
Improvement of the energy balance and ef
ficiency for reduced input of cropping systems is one of the
main goals for the cultivation of energy crops. In this
field study, two sugar crops for bioethanol pro-
duction were cultivated under different soil tillage management (conventional; no tillage) and mineral
nitrogen application (0, 75, 150 kg N ha
1
): sweet sorghum and sugar beet. The energy performance and
ef
ficiency along the bioethanol supply chain were analysed and compared. Both of these crops showed
good growth adaptation to the different soil and nitrogen management, and thus the energy return,
resource and energy ef
ficiencies were significantly improved in the low-input system. Sweet sorghum
provided better responses in terms of water and nitrogen use ef
ficiency for biomass accumulation, as
well as its energy yield and net gain, compared to sugar beet, whereas sugar beet showed higher energy
ef
ficiency than sorghum. According to these data, both of these crops can be cultivated in a Mediter-
ranean environment with low energy input, which guarantees good crop and energy performances for
biofuel strategy planning.
© 2015 Elsevier Ltd. All rights reserved.
1. Introduction
European countries are largely dependent on imported fossil
fuels, and the transport sector accounts for more than 30% of the
imported energy
. Most greenhouse gas emission is due to the
transport industry, and CO
2
emission into the air has risen by 90%
over the last two decades (Biofuels Advisory Council,
). To cope
with further increases in greenhouse gas emission, the EU
Renewable Energy Directive
de
fined a framework for the pro-
motion of energy from renewable sources. The target of this
Directive is that by 2020 with the use of biofuels, it will be possible
to achieve a 20% share of energy from renewable sources, and a
reduction of 20% in greenhouse gas emissions, with 10% of this
being renewable in the transport sector. Moreover the
“Climate
Action and Renewable Energy Package
”
has been proposed to
save energy use through an improved energy ef
ficiency of 20% by
2020. In view of these policy targets, some investigations have
focused on the role of the agricultural sector for biofuel production
and the energy ef
ficiency of different cropping systems
,
while others have focused on the reduction of greenhouse gas
emission through the introduction of biofuels and the replacement
of fossil fuel use
.
Some studies have reported that crop productivity of several
species (e.g., wheat, corn, soybean) is not compromised when the
energy input is reduced at the
field level (mainly through soil tillage
and nitrogen management), to improve the energy balance and
ef
ficiency
. Other studies have instead indicated signi
ficant
reductions in crop and energy performance with reduced energy
input applied at the
field level
, as also observed for the pro-
ductivity of winter sorghum
, where a reduced tillage system
lowered the water-use ef
ficiency of the crop, and consequently the
grain yield.
* Corresponding author. Consiglio per la Ricerca e la Sperimentazione in Agri-
coltura
e Centro di Ricerca per la Cerealicoltura (CRA-CER), S.S. 673 km 25,200,
Foggia, Italy. Tel.:
þ39 0881742972; fax: þ39 0881713150.
E-mail address:
(P. Garofalo).
Contents lists available at
Energy
j o u r n a l h o me p a g e :
w w w . e l s e v i e r . c o m/ l o ca t e / e n e r g y
http://dx.doi.org/10.1016/j.energy.2015.10.031
0360-5442/
© 2015 Elsevier Ltd. All rights reserved.
e1557

Currently, the debate on second-generation biofuels remains
open
, and their energy and environmental performance are
under study, although they are unlikely to have any effective impact
before 2020
. The conversion tecnologies are well known for
the
first generation of biofuels
, whereas for second generation
biofuels, these are still under development
. Moreover, the
advantage in terms of energy performance and climate impact of
second generation biofuels is achieved through low-input peren-
nial crops
. Recently, the CAP reform 2014-2020 (EU Regulation
1307/2013)
established that two or more crops should be
cultivated on farms to allow the claiming of subsidies (i.e., crop
diversi
fication as a ‘greening’ measure). Thus, herbaceous crops
with a short growing cycle and high biomass production (e.g.,
sorghum) or high sugar content (e.g., sugar beet) can satisfy both
the greening measure and the biofuel planning strategy.
Crops like sugar beet are not suitable for second-generation
biofuels, because the accumulation of large amounts of lignocel-
lulose can delay the harvest time, with the consequent loss of
biomass (i.e., dead leaves and relocation of sugar from roots to new
leaves). For other crops such as sorghum, the harvest time at full
maturity can compromise the
field operations and/or the sowing
time of the autumn species that follows. Finally, the cultivation of
sucrose crops for feed has dramatically declined in Italy over past
years (72% decrease from 2001 to 2012; ISTAT 2015,
), because
of the European policies (EU Regulation 320/2006); however, the
use of these crops can provide diversi
fication of the farm income
using the expertise and machinery available on the farm.
Assessment of the energy performance of various crops has
been carried out using different parameters and/or at different
stages of the supply chain. Koga (2008)
reported the energy
balance at the
field scale as the difference between the gross energy
output from sugar beet and the energy cost for its cultivation. Other
studies
have de
fined the EROI (energy return on the energy
investment) as the ratio of the quantity of energy delivered by a
biofuel society to the energy used as an input in the process to
produce the energy, with a comparison of EROI of bioethanol ob-
tained from corn and lignocellulose materials.
Most of the studies that have analysed energy crop perfor-
mances have been limited to a single species
or a single
growing season
, or have been based on literature data
rather than applied to a speci
fic environment. Moreover, in Italy,
field experiments have been mainly carried out in central or
northern regions
, with pedo-climatic condition that are
relatively dissimilar to the typical climate of the Mediterranean
area of the present study. In addition, the system boundaries are
often limited to the farm, thus excluding the cost of transportation
and the conversion of biomass into biofuel, although the energy for
transport is not negligible and can reach up to 23% of the total
energy cost
Comparisons of the energy performances of sucrose crops for
bioethanol production under different cropping systems (e.g., with
modulation of soil tillage and nitrogen supply) under speci
fic pedo-
climatic conditions that are prolonged over several years need to be
investigated. Thus, the present study was designed to: (i) determine
the biomass and sugar yield of sweet sorghum and sugar beet in
southern Italy cultivated for
first-generation biofuel; and (ii)
compare the energy performances between these two crops under
different management (i.e., conventional and no tillage practices, and
different nitrogen levels), with consideration also of the
flow along
all of the supply chain (i.e., from farm to bioethanol conversion plant).
2. Materials and methods
The
field experiment was carried out over a 3-year period from
2009 to 2012 in Foggia (latitude, 41
88
0
7
00
N; longitude, 15
83
0
05
00
E;
altitude, 90 m a.s.l.), in the Apulia region of southern Italy. The soil
was a vertisol of alluvial origin, Typic Calcixeret
classi
fied as
silty-clay, with the following characteristics: organic matter, 2.1%;
total nitrogen, 0.122%; NaHCO
3
-extractable phosphorus, 41 ppm;
NH
4
OAc extractable K
2
O
, 1598 ppm; pH (water), 8.3;
field capacity
water content, 0.396 m
3
m
3
; permanent wilting point water
content, 0.195 m
3
m
3
; and available soil water, 202 mm m
1
. The
climate was
‘accentuated thermo-Mediterranean’
, with tem-
peratures below 0
C in winter and above 40
C in summer. The
annual rainfall (mean, 550 mm) was mostly concentrated in the
winter months. The class
‘A pan’ evaporation was 1033 mm over
the year, and 657 mm from May to August. The daily meteorological
data of temperature, humidity, rainfall, wind velocity, and solar
radiation were recorded at a meteorological station located at the
same experimental farm.
2.1. Field experiment
Sweet sorghum (cv
‘Sucro 506’) was sown at the beginning of
May, in rows 0.5 m apart and at a distance of 0.08 m between the
seeds in each row (i.e., 250,000 seeds per hectare). The crop was
harvested before heading (mid-August) to maintain an adequate
plant water content (75%), as necessary for the fermentation pro-
cess. Sugar beet (cv
‘Autave’) was sown between late November and
early December, with row spacing of 0.5 m, and plant-to-plant
spacing of 0.20 m (i.e., 100,000 seeds ha
1
). The crop was harvest
at the beginning of August, when the plant achieved a good
compromise between water content and root sugar content.
Irrigation of both of these crops was managed according to the
water consumed by the plants, as estimated by the gravimetric
method (at 0
e0.8 m soil depth). Each time the water used by the
sweet sorghum and sugar beet reached 60 mm and 30 mm,
respectively, the irrigation was triggered. To ensure uniform water
distribution, a drip irrigation system was used, with one line for
each plant row, and drippers with a 4 L h
1
flow. The total amount
of water applied for the irrigation of the sorghum was 120 mm,
176 mm and 300 mm for the
first, second and third experimental
years, respectively, with rainfall of 79 mm, 73 mm and 68 mm
during the growing seasons in 2010, 2011 and 2012, respectively.
For the sugar beet, 90 mm, 65 mm and 108 mm of irrigation water
were applied in the
first, second and third growing seasons,
respectively, with the total rainfalls of 473 mm, 399 mm and
236 mm during the growing seasons in 2010, 2011 and 2012,
respectively.
For both of these crops, the soil management was carried out
according to CT (conventional tillage) and NT (no tillage). For CT,
shallow ploughing (soil depth, 25 cm) was performed with a
five-
furrow plow, followed by disc harrowing, power harrowing, and
seeding with a precision driller. For NT, no soil practice was
scheduled, with only direct seeding with a Gaspardo No-Till 1040,
which ensured light and shallow tillage in the strip area affected by
the furrowers. For NT, before seeding, 5 L ha
1
glyphosate was
applied for weed control.
Mineral nitrogen fertilisation was managed with 75 kg ha
1
(N75) and 150 (N150) kg ha
1
nitrogen in the form of ammonium
nitrate (34%), as compared with no nitrogen fertilisation (N0). The
nitrogen fertilizer was split into two doses, one as basal dressing
before sowing, and the second as top dressing in the middle of May
for sugar beet, and between the end of June and the beginning of
July for sorghum. Phosphate fertilizer was applied before sowing
(100 kg ha
1
P
2
O
5
).
The main treatment of these crops was related to soil tillage,
while the secondary treatment was for the different nitrogen
supplies. The experimental design was a split-plot design with
three replications. The area of each subplot was 84 m
2
. In the 2-year
P. Garofalo et al. / Energy 93 (2015) 1548
e1557
1549

rotation, the farm was split into two halves, with one crop for each
half. In the following year, the crop placings were inverted.
Diesel consumption was measured directly at the farm, as the
difference between the amount of fuel necessary to re
fill the tractor
tank after one soil operation and the following one. The time to
fully complete each
field operation was also recorded.
At harvest, a range of parameters were determined: the weight
of the total fresh and dry biomass (sweet sorghum, leaves and
stems; sugar beet, roots and leaves); the soluble solids content in
Brix (PR model 32 ATAGO Palette digital refractometer), with the
Brix multiplied by the fresh biomass/roots for the TSS (total soluble
solid); the potential sugar yield from the biomass and roots, as
reported by Wortmann et al. (2010)
(see also
); and the
WUE (crop water) and nitrogen (NUE) use ef
ficiency, calculated as
the ratio between the water used by the crop (i.e., irrigation plus
rainfall), the nitrogen applied, and the parameters analysed.
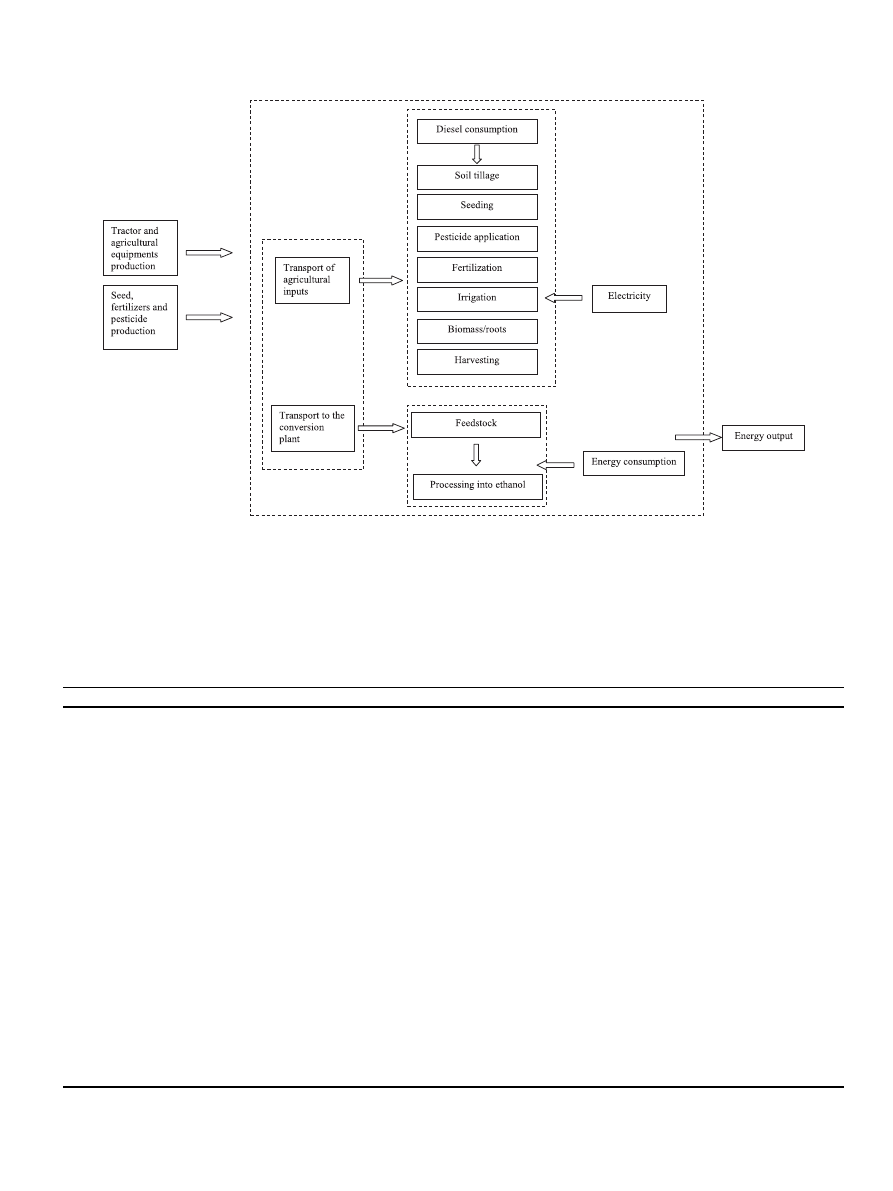
2.2. Energy balance and ef
ficiency
To determine the energy
fluxes for the input and output of the
product systems analysed, the system boundaries were established
(
). The energy input at the
field level was calculated separately
for the tractor, implements, fuel, seed, and chemicals used during
crop management, taking into account the direct and indirect in-
puts. The indirect input included the materials to build the tractor,
and the machinery and implements, and their maintenance. To
follow all the energy cost along the bioethanol supply chain, the
estimations were performed as reported in
For a full overview of the energy performance and ef
ficiency,
several indicators were used. The EY (energy yield) provided the
gross energy output for the potential bioethanol production, minus
the cost to convert the sugar into biofuel, but not including the
transport, and hence indicating the effective energy deliverable by
the power plant. In the NEG (net energy gain), the direct and in-
direct costs for crop cultivation, transport of materials, and biomass
and sugar-bioethanol conversion were subtracted from the EY to
indicate the energy that was effectively gained from the biofuel
supply chian. Finally, to determine how much of the production
process of the biofuel was energy advantageous, and to quantify the
positive returns on investment obtained, the EROI was calculated.
All of the equations necessary for these parameter calculations are
reported in
, and the parameters are reported fully in
The ratio between NEG and the sum of the rainfall plus the
irrigation, and between NEG and the N applied, provided the water
energy use ef
ficiency (EWUE; MJ m
3
) and the nitrogen energy use
ef
ficiency (ENUE; MJ kg
1
)
2.3. Statistical analysis
The analysis was performed using the statistical analysis soft-
ware SAS/STAT
®
(SAS Institute Inc., Cary, NC, USA). The data un-
derwent ANOVA (analysis of variance), considering the Year as the
random effect and the appropriate error test for the soil manage-
ment (in the main plot), nitrogen (in the sub-plot) and their in-
teractions. Differences among treatments were assessed using
Tukey
eKramer tests and significance was accepted at P ¼ 0.05.
3. Results
3.1. Crop productivity
The crop performances for sweet sorghum and sugar beet are
reported in
. For the soil management, there were no
differences across all of the analysed parameters for either of the
crops. On average over the 3-year experimental period, the fresh
biomass of sweet sorghum was 99.9 t ha
1
, and the water content at
harvest was 25%. The
Brix was a little higher for NT (
þ4%)
compared to CT, although compared to NT, CT promoted a better
response in terms of TSS (
þ6%). The water and nitrogen use effi-
ciencies were slightly improved for CT over NT, but globally, these
parameters were not statistically different between CT and NT.
Sweet sorghum saw little bene
fit of the increased nitrogen
supply, with an increase in fresh biomass from 98.1 t ha
1
with N0
to 102.4 t ha
1
with N150, and for dry biomass from 23.4 t ha
1
to
25.4 t ha
1
. These productivity levels are comparable with those
reported by Habyarimana et al. (2004)
for sorghum biomass,
where they showed dry biomass accumulation (20
e29 t ha
1
) close
to the experimental values in the present study, under similar
environmental and rainfall conditions.
The sweet sorghum
Brix was more stable among the nitrogen
treatments, whereas TSS was improved with N150 when compared
to the lower nitrogen levels (
þ12%). However, the differences in
productivity and the WUE indicators did not reach statistical sig-
ni
ficant. On the other hand, with the doubling of the nitrogen dose,
NUE was halved for the fresh and dry biomass and TSS parameters.
In comparison to sweet sorghum, the sugar beet growth was
more dependent on the different nitrogen supplies. Indeed, the
differences in the fresh and dry roots as well as TSS indicated a
Table 1
Estimation of direct and indirect energy input for crop cultivation, transport, sugar-bioethanol conversion, energy performance and ef
ficiency indicators.
Equation
No
Unit
Description
CSY
¼ ðFMY DMYÞ*
Brix
*0:75
(1)
t ha
1
Conservative sugar yield
JY
; 80%extracted ¼ ½FMY ðDMY CSYÞ*0:8
(2)
t ha
1
Juice yield
SY
¼ JY*
Brix
*0:75
(3)
t ha
1
Sugar yield
E
ct
¼
E
e
*M
w
L
(4)
MJ ha
1
Energy coef
ficient for each implement
E
l
¼ T
l
*H
c
(5)
MJ ha
1
Energy coef
ficient for human labour
E
s
¼ E
ps
*S
r
(6)
MJ ha
1
Energy coef
ficient for seed
E
N
;P;G
¼ EC
N
;P;G
*R
N
;P;G
(7)
MJ ha
1
Energy coef
ficient for materials
I
c
¼
d*g*H*Q
n
1
*n
o
*10
6
(8)
MJ ha
1
Energy input for the irrigation
E
t
ðI;IIÞ
¼
D
t
*D
ðI;IIÞ
*
W
m
Pl
*D
ef
(9)
MJ ha
1
Energy for transportation
EY
¼ ðBE*BYÞ ðCE*BYÞ
(10)
MJ ha
1
Energy yield
NEG
¼ EY ðEFI þ ET
I
þ ET
II
Þ
(11)
MJ ha
1
Net energy gain
EFI
¼ ðEt
ðI;IIÞ
þ D
c
*D
ef
þ E
ct
þ E
l
þ E
s
þ E
N
;
P
;
G
þ I
c
Þ
(12)
MJ ha
1
Total energy input
EUE
¼
BY
EFI
(13)
kg ha
1
Energy use ef
ficiency
EROI
¼
NEG
ðEFIþE
t
ðI;IIÞ
Þ
(14)
Energy return on energy invested
a
Sugar concentration of juice is 75% of Brix expressed in g kg
1
sugar juice and 95% of the extracted sugar is converted to ethanol.
P. Garofalo et al. / Energy 93 (2015) 1548
e1557
1550
different pattern of plant responses according to the nitrogen dose.
Here, N150 showed the best response for fresh (38.1 t ha
1
) and dry
(10.5 t ha
1
) roots, and TSS production (7.7 t ha
1
), with these data
signi
ficantly worst for N0 (decreases, 23%, 31%, 25%, respectively),
with intermediate data for the N75 treatment. A similar response
was observed for water use ef
ficiency, with the same trend re-
ported under the same environment conditions by Rinaldi and
Vonella (2006)
, although they reported higher water
Fig. 1. Flow diagram (input and output) and system boundaries of the bioethanol production in sweet sorghum and sugar beet.
Table 2
Variables and parameters, and their values as used in the equations given in
Symbol
Description
Unit
Value
Reference
FMY
Fresh matter yield
t ha
1
See text
DMY
Dry matter yield
t ha
1
See text
BY
Bioethanol yield
t ha
1
See text
E
e
Energy cost for building, maintenance, transport for
the machineries and implements
MJ kg
1
See
M
w
Mass
kg
See
L
Lifespan
h
See
T
l
Human labour
h
See text
H
c
Human energy consumption
MJ h
1
1.08
E
ps
Energy value for the seed production,
MJ kg
1
36.98 for sugar beet; 54 MJ kg
1
for sweet sorghum
S
r
Seed rate
kg
1 for sugar beet; 14 MJ kg
1
for sweet sorghum
N, P, G
Nitrogen, phosphorous, glyphosate
EC
Energy coef
ficient of materials
MJ kg
1
48.89 for N, 15.23 for P, 268.4 for G
R
Application rate of materials
kg
See text
d
Water density
kg m
3
1000
H
Total dynamic head
m
5
Q
Water applied
m
3
ha
1
See text
n
1
Pump ef
ficiency
0.65
n
0
Ef
ficiency of the electric motor
0.22
E
t(I)
Transport of materials from the factory to the farm
MJ ha
1
See text
E
t(II)
Transport of biomass from the farm to the conversion plant
MJ ha
1
See text
D
t
Diesel consumption of the truck
l km
1
or kg km
1
0.34 l or 0.27
Pl
Payload
t
27
D
(I)
Distance from the factory (materials) to the farm
km
100
D
(II)
Distance from the farm to the conversion plant
km
70
W
m
Weight of the mass transported
t
See text
D
ef
Energy density of diesel
MJ kg
1
43.1
BE
Energy density of bioethanol
MJ kg
1
26.8
CE
Energy to convert biomass in anhydrous ethanol
MJ kg
1
18.33
a
Differences between the level of water suction in the well (10 m) and the level of the water surface in the collecting basin (5 m).
b
70 km as maximum distance in the short supply chain for the Apulia region; Reg. No 42/2012.
P. Garofalo et al. / Energy 93 (2015) 1548
e1557
1551

availability (mean irrigation, 249 mm; mean rainfall, 353 mm) and
crop productivity (fresh roots, 38.2
e60.0 t ha
1
).
Finally, the halving of the nitrogen dosing from N150 to N75
resulted in large difference in nitrogen use ef
ficiencies (i.e., almost a
doubling;
).
3.2. Energy input
shows the amount of energy required for crop man-
agement of the sorghum and sugar beet. The highest impact of the
energy needed was due to the diesel used for the movement of
tractors and equipment, as well as the nitrogen fertilizer applica-
tions. The diesel input for cultivation accounted for 37% and 49% for
sorghum and sugar beet, respectively for the CT_N0 treatment,
although these values dropped to around 15% when compared to
the full nitrogen supply management in the NT treatment. Indeed,
the nitrogen fertilizer required an energy cost of 3647 MJ ha
1
and
7349 MJ ha
1
, when passing from the N75 to the N150 treatments,
with a minimum effect of 25% (sweet sorghum, CT_N75) to a
maximum effect of 50% (sugar beet, NT_N150) of the total energy
use.
The indirect input due to the tractors and implements used was
between 1% for sorghum (NT_N150) to 7% for sugar beet (NT_N0), of
the total energy use. In sweet sorghum the cost for seeding and
irrigation accounted for 750 MJ ha
1
and 933 MJ ha
1
respectively,
with the maximum percentage of 9% for the irrigation cost at the
lowest energy use. In sugar beet, the input due to the seed and
irrigation supply was negligible, as it was constantly below 6% of
the total energy budget. Generally, the estimated energy input at
field scale is higher in northern European countries than in
southern European countries. Indeed, in the UK, the total energy
cost for sugar beet was reported to be up to 26.8 GJ ha
1
, and in
Germany, 29.7 GJ ha
1
. On the other hand, in Greece, the en-
ergy input for sun
flower cultivation was reported as 10.5 GJ ha
1
Table 3
Energy coef
ficients for the indirect energy input used for the machinery for the sorghum and sugar beet
Item
Mass (kg)
Life (h)
Energy cost
Energy coef
ficient
(MJ h
1
)
Materials (MJ kg
1
)
Assembly (MJ kg
1
)
Transport (MJ kg
1
)
Maintenance (MJ kg
1
)
Tractor (132 kW)
6300
12,000
35.2
18.7
1.9
29.6
44.8
Tractor (51 kW)
4000
12,000
35.2
18.7
1.9
29.6
28.5
Plough
1000
3000
34.5
12.3
1.3
25.7
24.6
Disk harrow
1200
3000
34.5
12.3
1.3
25.7
29.5
Fertilizer distributor
100
3000
34.5
12.3
1.3
25.7
2.5
Sprayer
200
2000
34.5
12.3
1.3
25.7
7.4
Power harrow
500
3000
34.5
12.3
1.3
25.7
12.3
Seeder (sorghum)
800
3000
34.5
12.3
1.3
25.7
19.7
(Sugar beet)
1000
3000
34.5
12.3
1.3
25.7
24.6
Harvester (sorghum)
8000
3000
41.3
14.8
1.5
30.9
354.0
Harvester (sugar beet)
8500
3000
41.3
14.8
1.5
30.9
250.8
Trailer
1000
3500
34.5
12.6
1.3
25.9
22.3
a
Mass and life based on local survey.
b
For fertilizing, spraying and for the trailer.
Table 4
Biomass performance, and water and nitrogen use ef
ficiency of sweet sorghum, as affected by soil tillage and nitrogen fertilization during the experimental trial (2009e2012).
Treatment Parameter
FB (t ha
1
) DB (t ha
1
)
Brix TSS (t ha
1
) WUEfb (kg m
3
) WUEdm (kg m
3
) WUEtss (kg m
3
) NUEfb (kg kg
1
) NUEdb (kg kg
1
) NUEtss (kg kg
1
)
CT
101.9
24.8
8.9
8.7
39.9
9.8
3.6
1007.1
244.5
85.4
NT
97.7
24.6
9.3
8.2
37.8
9.5
3.3
995.4
262.2
81.7
N0
98.1
23.4
9.1
8.3
38.2
9.2
3.4
e
e
e
N75
99.0
25.3
9.1
8.2
38.3
9.8
3.4
1319.6 a
337.5 a
108.8 a
N150
102.4
25.4
9.2
8.8
40.1
9.9
3.7
682.8 b
169.1 b
58.3 b
Mean
99.8
24.7
9.1
8.4
38.9
9.6
3.5
1001.3
253.3
83.6
FB, fresh biomass; DB, dry biomass; TSS, total soluble solid; WUE, water use ef
ficiency for fresh biomass (fb), dry biomass (db) and total soluble solid (tss); NUE, nitrogen use
ef
ficiency for biomass (fb), dry biomass (db) and total soluble solid (tss); CT, reduced tillage; NT, no tillage; N0, N75, N150, nitrogen application (0, 75, 150 kg ha
1
).
Different letters indicate different means at P
¼ 0.05 (TukeyeKramer tests).
Table 5
Biomass performance, water and nitrogen use ef
ficiency of sugar beet as affected by soil tillage and nitrogen fertilization during the experimental trial (2009e2012).
Treatment
Parameter
FR (t ha
1
)
DR (t ha
1
)
Brix
TSS (t ha
1
)
WUEfr (kg m
3
)
WUEdr (kg m
3
)
WUEtss (kg m
3
)
NUEfr (kg kg
1
)
NUEdr (kg kg
1
)
NUEtss (kg kg
1
)
CT
35.8
8.8
20.1
7.2
7.5
1.8
1.5
378.1
93.5
76.7
NT
33.4
9.0
20.9
6.8
6.9
1.9
1.4
360.9
97.2
74.1
N0
29.3 b
7.2 b
20.2
5.8 c
6.0 b
1.5 b
1.2 b
e
e
e
N75
36.4 ab
9.0 ab
20.8
7.5 a
7.6 a
1.9 ab
1.6 a
485.2 a
120.6 a
99.4 a
N150
38.1 a
10.5 a
20.5
7.7 a
8.0 a
2.3 a
1.6 a
253.8 b
70.1 b
51.4 b
Mean
34.6
8.9
20.5
7.0
7.2
1.9
1.5
369.5
95.3
75.4
FR, fresh biomass; DR, dry root biomass; TSS, total soluble solid; WUE, water use ef
ficiency for fresh root (fr), dry root (dr) and total soluble solid; NUE, nitrogen use efficiency for
fresh root (fr), dry root (dr) and total soluble solid (tss); CT, reduced tillage; NT, no tillage; N0, N75, N150, nitrogen application (0, 75, 150 kg ha
1
).
Different letters indicate different means at P
¼ 0.05 (TukeyeKramer test).
P. Garofalo et al. / Energy 93 (2015) 1548
e1557
1552

, and in Italy, for giant reed cultivation, this value has oscillated
from 4 GJ ha
1
to 18 GJ ha
1
. Despite this large variability
across these studies, they all agreed that diesel consumption and
nitrogen supply are the components that have the greatest effects
on the energy
flux.
For the transport of feedstock from the farm to the plant con-
version platform, the mean energy costs were 3123 MJ ha
1
and
1082 MJ ha
1
, for the biomass of sorghum and the roots of sugar
beet, respectively. This was mainly due to the fresh biomass weight
(three-fold greater in sorghum than beet). Finally, passing from the
highest to the lowest energy intensity treatment, the energy saving
was 6720 MJ ha
1
for sorghum (reduction, 38%) and 7011 MJ ha
1
for sugar beet (reduction, 48%), when compared to CT_150.
3.3. Energy performance
The energy yield, or EY, for sweet sorghum oscillated between
35.2 GJ ha
1
(CT_N150) and 30.0 GJ ha
1
(NT_N75), as shown in
, although no statistically signi
ficant differences were
observed among the treatments. For the sweet sorghum NEG,
although the unfertilized treatments (N0) provided the highest
values (mean, 21.9 GJ ha
1
;
þ35%) with respect to the other treat-
ments, there were no statistical differences in the responses across
all of the treatments for NEG. Consequently, sweet sorghum
showed a relatively stable response for NEG (mean, 17.7 GJ ha
1
)
across the different management practices, which is in line with
data reported in other studies
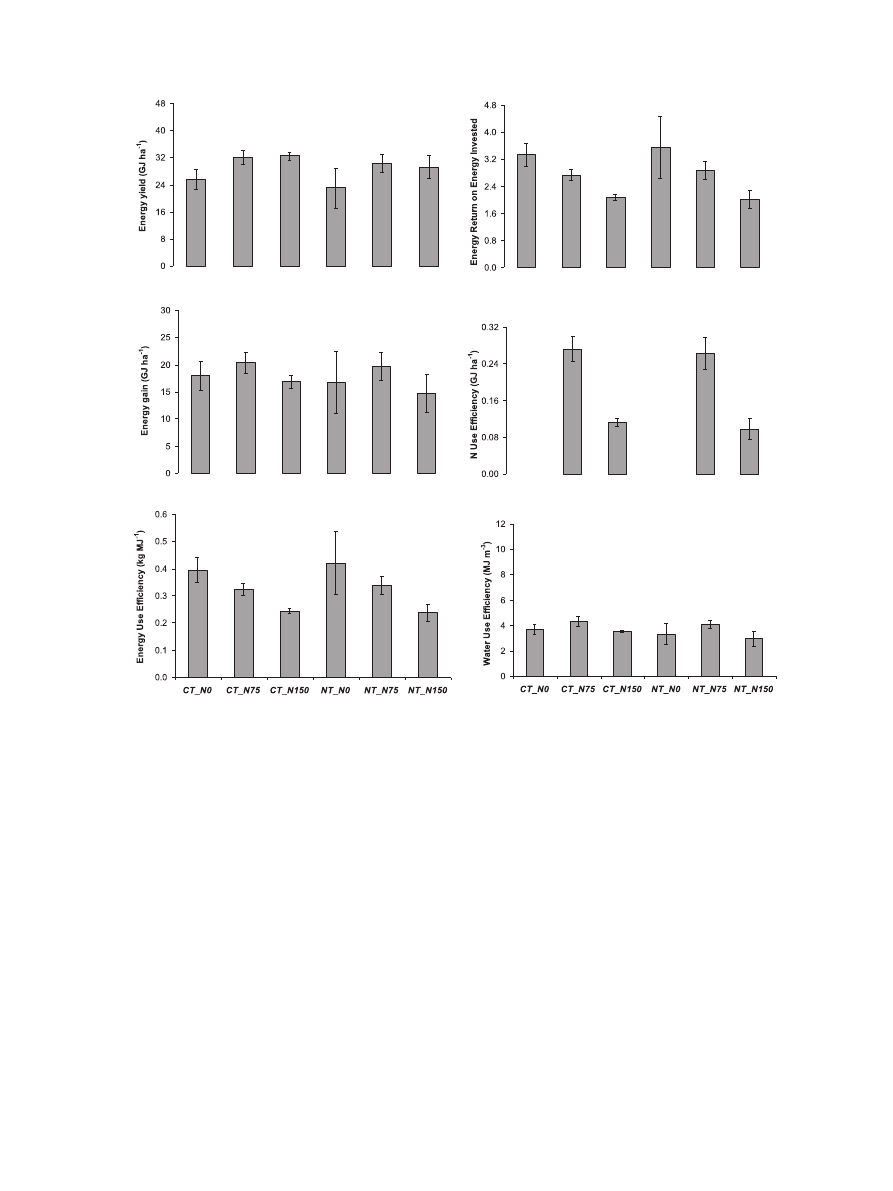
For sugar beet, compared to the unfertilized treatment, EY was
improved by the N75 to N150 change, with an increase of 28% (24.3
vs. 31.0 GJ ha
1
). However, these differences did not reach statistical
signi
ficance among the treatments, and unlike for sweet sorghum,
the performances among the years were more stable. The sugar
beet NEG was 17.3 GJ ha
1
, 20.1 GJ ha
1
, and 15.6 GJ ha
1
for the N0,
N75, and N150 treatments, respectively (
), and CT provided a
small advantage over the NT treatment of 8%, although globally the
net energy returns were comparable for all of the soil and nitrogen
management treatments.
3.4. Resource ef
ficiency
In sorghum, the nitrogen application rather than the soil man-
agement (
) improved WEUE. Indeed, for N0, there was 9.2 MJ
of energy gain per m
3
water used by the crop, followed by the N_75
and N_150 treatments (mean, 7.1 MJ m
3
), with small changes due
to soil management (
þ6% for CT treatment) that did not reach
statistical signi
ficance. The halving of the nitrogen that was applied
to the sweet sorghum provided strongly improved bene
fits in terms
of energy gain, as when the nitrogen supply was reduced from
150 kg ha
1
to 75 kg ha
1
, the ENUE increased from 0.11 GJ kg
1
to
0.23 GJ kg
1
.
Compared to sweet sorghum, for sugar beet, the best energy
return per m
3
water used was for the N75 treatment (mean,
4.2 MJ m
3
), with the lowest for N150 (3.3 MJ m
3
) (
). As for
sorghum, CT slightly improved WEUE, enhancing the value from
3.7 GJ ha
1
for NT to 3.8 GJ ha
1
for CT, as the means of all of the
nitrogen fertilizer treatments. Finally, ENUE more than doubled
when the nitrogen application was halved (0.11 MJ kg
1
for N150 vs.
0.27 MJ kg
1
for N75).
3.5. Energy ef
ficiency
The reduction in energy input intensity together with no
meaningful biomass yield reduction led to a signi
ficant increase in
energy ef
ficiency for sweet sorghum. Indeed, as shown in
,
NT_N0 and CT_N0 provided the best EUE, with the mean production
of 0.37 kg ethanol per MJ energy applied in the
field, followed by
Table 6
Energy input at the
field level for the different soil and crop management for the sweet sorghum and sugar beet.
Crop
Parameter
Energy input according to soil tillage management and nitrogen application in the
field (MJ ha
1
)
Conventional tillage
No tillage
N0
N75
N150
N0
N75
N150
Sorghum
Seed
750
750
750
750
750
750
Pesticide
0
0
0
1342
1342
1342
Nitrogen
0
3674
7349
0
3674
7349
P
2
O
5
1523
1523
1523
1523
1523
1523
Transport (I)
7
18
25
5
18
25
Machinery
242
255
255
163
171
172
Tractor
408
476
476
114
115
115
Labour
11
12
12
3
3
3
Diesel
4079
4271
4508
2260
2560
2526
Irrigation
933
933
933
933
933
933
Transport (II)
3198
3088
3276
2939
3105
3133
Total
11151
15000
19107
10032
14194
17871
Sugar beet
Seed
37
37
37
37
37
37
Pesticide
0
0
0
1342
1342
1342
Nitrogen
0
3674
7349
0
3674
7349
P
2
O
5
1523
1523
1523
1523
1523
1523
Transport (I)
5
17
24
10
17
24
Machinery
517
518
518
427
427
427
Tractor
468
483
483
114
122
123
Labour
13
13
13
4
4
4
Diesel
3662
3902
4122
1663
1978
2287
Irrigation
369
369
369
369
369
312
Transport (II)
965
1154
1240
867
1123
1142
Total
7559
11,690
15,678
6356
10,616
14,570
Data are means over the three experimental years (2009
e2012).
N0, N75, N150, nitrogen application in the
field (0, 75, 150 kg ha
1
); Transport (I), energy input for transport of seed, fertilizers and herbicides at the farm (100 km); Transport
(II), energy input for transport of sorghum biomass or sugar beet root to the conversion plant (70 km).
P. Garofalo et al. / Energy 93 (2015) 1548
e1557
1553
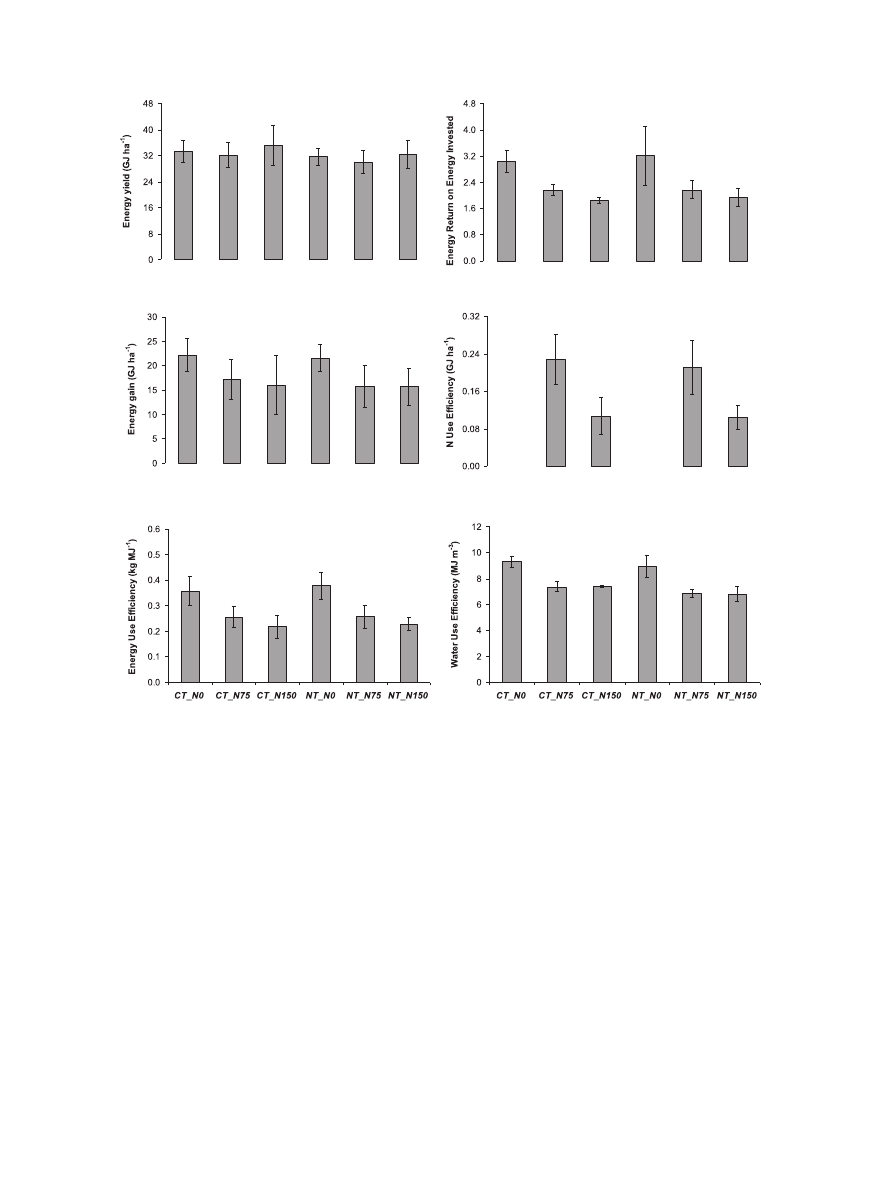
the N75 and N150 treatments (0.26 and 0.22 kg MJ
1
, respectively).
N0 provided the highest EROI for the bioethanol supply chain, at
3.2, which was 44% and 65% greater than for N75 and N150,
respectively.
For sugar beet, the analysis of EUE showed different ef
ficiencies
as a consequence of the nitrogen doses applied. Indeed, lowering
the energy input (essentially due to lowering the nitrogen levels),
the ef
ficiency for potential bioethanol production per energy
applied in the
field increased (
), with the lowest for N150
(0.24 MJ kg
1
), followed by N75 (
þ37%), and the highest for N0
(
þ69%). These differences were confirmed also in the EROI analysis,
which indicated that the highest energy return in terms of bio-
ethanol energy output per unit energy used was for N0 (3.5), then
N75 (2.8), and
finally N150 (2.0), with NT slightly better than CT
(
þ4%).
4. Discussion
The soil management had a small impact on the crop produc-
tivity response for both of these crops for this mid-term period,
whereas the nitrogen management indicated greater growth of
sugar beet with increasing nitrogen doses. The nitrogen also
in
fluenced the water use efficiency differently between these two
crops: the water use ef
ficiency remained unchanged for sorghum,
irrespective of the nitrogen management, while it increased for
sugar beet as the nitrogen availability increased. Our
findings are in
line with those reported by Ceotto et al. (2014)
, who indicated
that the productivity of sorghum under N0 treatment was com-
parable to that for partial and fully fertilized sorghum even after 5
years. For sugar beet, a signi
ficant growth reduction was observed
as a consequence of reduced nitrogen supply
, even if in the
present study these differences emerged between N0 and N150,
rather than between N0 and N75. Thus, these data indicated that
soil with good nutrient availability provides good and stable re-
sponses for sweet sorghum in terms of nitrogen use ef
ficiency and
plant growth (with reduced or even no nitrogen supply) for several
years, while for sugar beet, the productivity is more susceptible to
the nitrogen doses.
However, in sugar beet, the increase in energy intensity at the
field scale did not lead to dramatic increases in terms of the root
and potential bioethanol production, as indicated above. This will
be due to the very deep root system of both of these crops, which
will allow greater soil exploration when compared to other crops
(i.e., wheat), in which the different nitrogen doses can have an
appreciable effect on plant growth
. As a consequence, the best
energy performances were achieved by reducing the energy
Fig. 2. Energy balance and ef
ficiencies for the sweet sorghum (as indicated). Data are means ± standard errors over the three experimental years (2009e2012).
P. Garofalo et al. / Energy 93 (2015) 1548
e1557
1554
intensity at the
field scale, for both of these crops. This was espe-
cially the case when accounting for the nitrogen supply, high-
lighting nitrogen as the key factor for improvement in the energy
gain. Also, the coupling of wise fertilization management with
conservative tillage practices has been shown to reduce the fossil
energy requirements and greenhouse gas emission in previous
investigations
. These bene
fits can be further emphasized
when the reduced input to the cropping system does not dramat-
ically affect the crop production, as con
firmed in the mid-term in
the present study. These data are, however, in contrast to those of
Ceccon et al. (2003)
, who indicated that the gross energy
output and ef
ficiency that was achievable in their crops was
improved, as the input increased due to better productivity in
comparison with the low-input treatment at the
field scale.
For the biomass production, TSS and potential sucrose yield,
these data indicate that sorghum provides greater improvements
for the resource ef
ficiency than sugar beet. This is true at the farm
scale, where different energy patterns were seen when analysing
the whole supply chain, and thus with the introduction of the
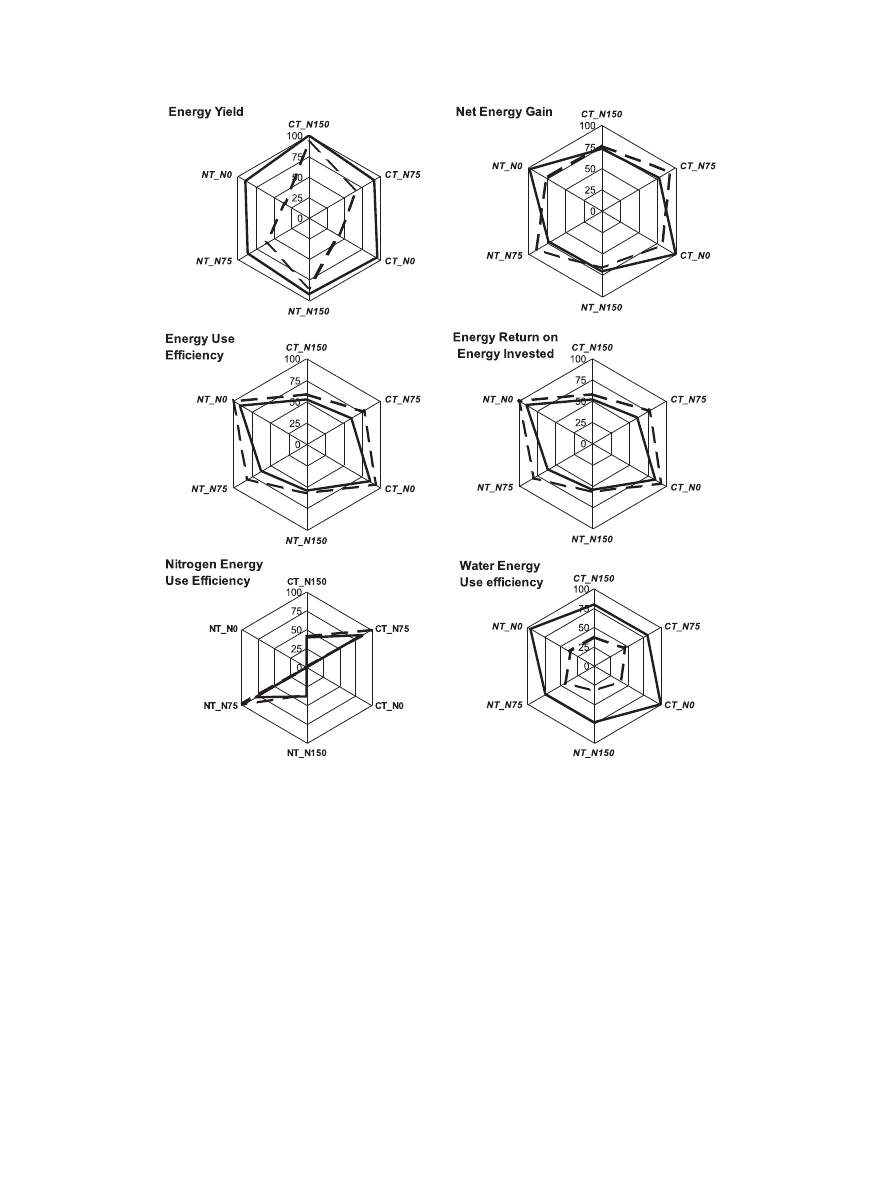
transport costs. This direct comparison between sweet sorghum
and sugar beet gave a mixed response in terms of the most suitable
species for energy purposes according to the bioethanol supply
chain, as also illustrated by the spider plots in
. For the energy
achievable from the potential bioethanol production (i.e., EY),
sweet sorghum and sugar beet gave comparable values at the
highest energy intensity, although a better response emerged with
sorghum compared to sugar beet with the reduction in the nitrogen
and soil-tillage input. With the subtraction of the cost for cultiva-
tion and transport from EY, to obtain NEG, the best energy return
was for sweet sorghum with the N0 management and for both soil
treatments.
Some studies have indicated that the minimun threshold of the
net energy achievable by a crop suitable for energy purposes is
20 GJ ha
1
, a value that was reached only by sweet sorghum at
the lowest energy management. However, this estimation was
based on the low heating value of the biomass and only considered
the cost at the
field scale. This means that in the present study, the
NEG would have far exceeded 20 GJ ha
1
if it had relied on the low
heating value and included only the energy needed at the
field
scale, which is also the case for the sugar beet for the mid-input
management.
With sorghum, the high amounts of biomass that need to be
moved from the farm to the plant added from 17% to 29% onto the
total energy costs, which thus negatively affected the EUE and EROI
of sorghum with respect to sugar beet (i.e., with lower biomass
production but higher sugar content than sorghum); the greater
Fig. 3. Energy balance and ef
ficiencies for the sugar beet (as indicated). Data are means ± standard errors over the three experimental years (2009e2012).
P. Garofalo et al. / Energy 93 (2015) 1548
e1557
1555
the energy saving at the
field scale, the greater the advantage of the
sugar beet over the sorghum (see
). This was based on a dis-
tance from the farm to the conversion plant of 70 km (i.e., the
maximum distance for the short supply chain in the Apulia region),
although with a smaller distance (e.g.,
<25 km) the efficiency pa-
rameters become more comparable between these crops (data not
shown).
These
findings are in line with those reported by de Vries et al.
(2010)
, who indicated that crops with high energy yields (e.g.,
sweet sorghum) do not necessarily have the highest energy ratios.
However, both sorghum and sugar beet gave higher energy yields
(i.e., the energy content of the bioethanol minus the cost to convert
the sugar into bioethanol) from 2.2-fold (i.e., the mid-energy in-
tensity for sweet sorghum) to 3.5-fold (i.e., the lowest energy
management for sugar beet) the total energy costs, with the values
over the minimum threshold of 2.0 indicated by Venturi and
Venturi (2003)
.
Moreover, although ENUE was similar or slightly better for sugar
beet (i.e., for the mid-input treatment), WEUE underlined that
sweet sorghum (a C4 species) can produce higher amounts of
biomass per water used by the crop
, with respect to sugar beet
(see
), with this also coupled to a shorter and faster growing
cycle. This is a crucial point for the selection of energy crops in an
environment with reduced water availability and/or with the need
to introduce summer-energy crops in rotation with, rather than
substitution of, winter-food crops.
5. Conclusions
In the present study, both sweet sorghum and sugar beet
showed good potential as energy crops in southern Italy, as they can
maximize the energy balance (sweet sorghum) or the energy ef
fi-
ciency (sugar beet) with lowered energy input.
Due to its deep roots and drought resistance, sweet sorghum
showed favourable exploitation of the water resource and nitrogen
availability, which allows signi
ficant energy saving with stable
productivity under reduced energy intensity. However, when tak-
ing into account the energy costs due to transport of the sorghum
Fig. 4. Relative sustainabilities (as indicated) of the assessed cropping systems for the sweet sorghum (continuous lines) and the sugar beet (dotted lines). Data are percentages
relative to the highest value for the energy balance and ef
ficiencies.
P. Garofalo et al. / Energy 93 (2015) 1548
e1557
1556

biomass to the biofuel conversion plant, the results are reversed,
due to the better energy use ef
ficiency for sugar beet than sweet
sorghum.
When the land that can be dedicated to energy crops is limited,
then the goal is to achieve the greatest energy return from a
cropped unit to ful
fil energy demands, and hence sweet sorghum
will be the most suitable crop. However, vice versa (i.e., no limits in
the land available), the crop with the higher energy ef
ficiency
should be preferred (i.e., sugar beet), to achieve improved energy
output with reduced fossil energy use during the crop cycle.
The overall result here, which highlights that conservative
agriculture allows energy saving and improvements in energy ef-
ficiency, should be considered valid in the short-term to mid-term,
as carried out in the present study. A long-term approach is needed
to determine for how long the soil fertility can satisfy the crop ni-
trogen requirements, and to validate the effects of conservative
tillage on the water and nutrient dynamics.
Finally, other factors other than the energy performance and
ef
ficiency might lead to a different approach in the selection of one
crop over another, such as the available technologies on the farm
(i.e., a beet harvester rather than a forage harvester), the expertise
of the farmer relative to a speci
fic crop, or the different income
levels (i.e., due to the selling price of the raw materials, and to the
costs of the starting materials and the transport).
References
[1]
[2] RED;
2009/28/EC;
http://eur-lex.europa.eu/legal-content/EN/ALL/?
. [accessed 13.07.15].
[3]
.
[4]
de Vries SC, van de Ven GWJ, van Ittersum MK, Giller KE. Resource use ef
ciency and environmental performance of nine major biofuel crops, processed
by
first-generation conversion techniques. Biomass Bioenerg 2010;34:
.
[5]
Nassi o Di Nasso N, Bosco S, Di Bene C, Coli A, Mazzoncini M, Bonari E. Energy
ef
ficiency in long-term Mediterranean cropping systems with different
management intensities. Energy 2011;36:1924
[6]
e9
.
[7]
ficiency and greenhouse gas emissions of
corn-ethanol. J Ind Ecol 2009;13:58
[8]
e5
.
[9]
[10]
.
[11]
Patil SL. Winter sorghum (Sorghum bicolor) productivity as in
tillage practices and nitrogen management in Vertisol of SAT, India. Soil Till
Res 2013;126:183
[12]
e80
.
[13] Jesse JH, van der Linde C. Oil turbulence in the next decade: an essay on high
oil prices in a supply-constrained world. CIEP Energy Paper 2008/03. 2008,
June
[accessed
13.07.15],
http://www.feelingeurope.eu/Pages/Oil%
20turbulence%20in%20the%20next%20decade%20(Clingendael%20juli%
202008).pdf
.
[14]
e76
.
[15]
Naik SN, Goud VV, Rout PK, Dalai AK. Production of
ation biofuels: a comprehensive review. Renew Sustain Energy Rev 2010;14:
578
e97
.
[16]
Karp A, Richter GM. Meeting the challenge of food and energy security. J Exp
Bot 2011;62(10):3263
e71
[17] EU Reg. 1307/2013 (art. 43-47)
http://ec.europa.eu/agriculture/newsroom/
. [accessed 13.07.15].
[18] ISTAT, 2015.
http://seriestoriche.istat.it/
. [accessed 13.07.15].
[19]
[20]
[21]
e97
[22]
Monti A, Venturi G. Comparison of the energy performance of
sweet sorghum and wheat monocultures in Northern Italy. Eur J Agron
2003;19(1):35
[23]
e55
.
[24]
e26
.
[25]
Spugnoli P, Dainelli R, D'Avino L, Mazzoncini M, Lazzeri L. Sustainability of
sun
flower cultivation for biodiesel production in Tuscany within the EU
Renewable Energy Directive. Biosyst Eng 2012;112:49
[26]
.
[27]
USDA. Keys to soil taxonomy. 11th ed. 2010. p. 346
[28]
fic and Cultural Organization; 1962
[29]
[30]
& biomass engineering. In: CIGR Handbook of agricultural
[31]
& biomass engineering. In: CIGR handbook of agricultural
engineering. Energy and biomass engineering, vol. V. CIGR
Commission of Agricultural Engineering. American Society of Agricultural
Engineers; 1999. p. 351
[32]
e9
.
[33]
[34]
ciency. Field Crops Res 2006;95:103
e14
.
[35]
[36]
[37]
Kallivroussis L, Natsis A, Papadakis G. The energy balance of sun
duction for biodiesel in Greece. Biosyst Eng 2002;81(3):347
e54
.
[38]
.
[39]
.
[40]
Reddy BVS, Rames S, Reddy PS, Ramaih B, Salimath M, Kachpur R. Swee
tsorghum
e a potential alternate raw material for bioethanol and bioenergy.
Int Sorghum Millets Newsl 2005;2005(46):79
e86
.
[41]
ficiency. Ind Crop Prod 2014;62:380e6
.
[42]
e201
[43]
[44]
e89
[45]
e83
[46]
Garofalo P, Rinaldi M. Water-use ef
ficiency of irrigated biomass sorghum in a
Mediterranean environment. Span J Agric Res 2013;11(4):1153
e69
.
[47]
ficient for agriculture inputs in Western Canada. Canada:
Canadian Agricultural Energy End-Use Data Analysis Centre (CAEEDAC); 1999.
p. 41
P. Garofalo et al. / Energy 93 (2015) 1548
e1557
1557
Document Outline
Wyszukiwarka
Podobne podstrony:
Performance and evaluation of small
Simulation, construction and testing of a two cylinder solar Stirling engine powered by a flat plate
Tale of Two Cities Essay on the Roots of Revolution
The Code of Honor or Rules for the Government of Principals and Seconds in Duelling by John Lyde Wil
Design and construction of three phase transformer for a 1 kW multi level converter
Command and Control of Special Operations Forces for 21st Century Contingency Operations
Sexual behavior and the non construction of sexual identity Implications for the analysis of men who
Barwiński, Marek Reasons and Consequences of Depopulation in Lower Beskid (the Carpathian Mountains
Islamic System Of Practising Social Security For The Needy
(IV)The effect of McKenzie therapy as compared with that of intensive strengthening training for the
Energy and CO2 analysis of poplar and maize crops for biomass production in Italy Włochy 2016
Can we accelerate the improvement of energy efficiency in aircraft systems 2010 Energy Conversion an
Bearden Misc Moore Relationship between Efficiency and Coefficient of Performance (www cheniere o
Induction of two cytochrome P450 genes, Cyp6a2 and Cyp6a8 of Drosophila melanogaster by caffeine
A Tale of Two Cities Summary and Themes of the Book
EFFECTS OF EATING AND NOT EATING ON ENERGY STORES AND BODY WEIGHT
William Pelfrey Billy, Alfred, and General Motors, The Story of Two Unique Men, a Legendary Company
więcej podobnych podstron