
by Joe Duarte, MD
Trading Futures
FOR
DUMmIES
‰
01_287224-ffirs.qxp 5/27/08 10:17 PM Page i

01_287224-ffirs.qxp 5/27/08 10:17 PM Page iv

by Joe Duarte, MD
Trading Futures
FOR
DUMmIES
‰
01_287224-ffirs.qxp 5/27/08 10:17 PM Page i

Trading Futures For Dummies
®
Published by
Wiley Publishing, Inc.
111 River St.
Hoboken, NJ 07030-5774
www.wiley.com
Copyright © 2008 by Wiley Publishing, Inc., Indianapolis, Indiana
Published by Wiley Publishing, Inc., Indianapolis, Indiana
Published simultaneously in Canada
No part of this publication may be reproduced, stored in a retrieval system, or transmitted in any form or by
any means, electronic, mechanical, photocopying, recording, scanning, or otherwise, except as permitted
under Sections 107 or 108 of the 1976 United States Copyright Act, without either the prior written permis-
sion of the Publisher, or authorization through payment of the appropriate per-copy fee to the Copyright
Clearance Center, 222 Rosewood Drive, Danvers, MA 01923, 978-750-8400, fax 978-646-8600. Requests to the
Publisher for permission should be addressed to the Legal Department, Wiley Publishing, Inc., 10475
Crosspoint Blvd., Indianapolis, IN 46256, 317-572-3447, fax 317-572-4355, or online at http://www.wiley.
com/go/permissions
.
Trademarks: Wiley, the Wiley Publishing logo, For Dummies, the Dummies Man logo, A Reference for the
Rest of Us!, The Dummies Way, Dummies Daily, The Fun and Easy Way, Dummies.com and related trade
dress are trademarks or registered trademarks of John Wiley & Sons, Inc. and/or its affiliates in the United
States and other countries, and may not be used without written permission. All other trademarks are the
property of their respective owners. Wiley Publishing, Inc., is not associated with any product or vendor
mentioned in this book.
LIMIT OF LIABILITY/DISCLAIMER OF WARRANTY: THE PUBLISHER AND THE AUTHOR MAKE NO REP-
RESENTATIONS OR WARRANTIES WITH RESPECT TO THE ACCURACY OR COMPLETENESS OF THE CON-
TENTS OF THIS WORK AND SPECIFICALLY DISCLAIM ALL WARRANTIES, INCLUDING WITHOUT
LIMITATION WARRANTIES OF FITNESS FOR A PARTICULAR PURPOSE. NO WARRANTY MAY BE CREATED
OR EXTENDED BY SALES OR PROMOTIONAL MATERIALS. THE ADVICE AND STRATEGIES CONTAINED
HEREIN MAY NOT BE SUITABLE FOR EVERY SITUATION. THIS WORK IS SOLD WITH THE UNDER-
STANDING THAT THE PUBLISHER IS NOT ENGAGED IN RENDERING LEGAL, ACCOUNTING, OR OTHER
PROFESSIONAL SERVICES. IF PROFESSIONAL ASSISTANCE IS REQUIRED, THE SERVICES OF A COMPE-
TENT PROFESSIONAL PERSON SHOULD BE SOUGHT. NEITHER THE PUBLISHER NOR THE AUTHOR
SHALL BE LIABLE FOR DAMAGES ARISING HEREFROM. THE FACT THAT AN ORGANIZATION OR
WEBSITE IS REFERRED TO IN THIS WORK AS A CITATION AND/OR A POTENTIAL SOURCE OF FURTHER
INFORMATION DOES NOT MEAN THAT THE AUTHORS OR THE PUBLISHER ENDORSES THE INFORMA-
TION THE ORGANIZATION OR WEBSITE MAY PROVIDE OR RECOMMENDATIONS IT MAY MAKE.
FURTHER, READERS SHOULD BE AWARE THAT INTERNET WEBSITES LISTED IN THIS WORK MAY HAVE
CHANGED OR DISAPPEARED BETWEEN WHEN THIS WORK WAS WRITTEN AND WHEN IT IS READ.
For general information on our other products and services, please contact our Customer Care
Department within the U.S. at 800-762-2974, outside the U.S. at 317-572-3993, or fax 317-572-4002.
For technical support, please visit www.wiley.com/techsupport.
Wiley also publishes its books in a variety of electronic formats. Some content that appears in print may
not be available in electronic books.
Library of Congress Control Number: 2008929124
ISBN: 978-0-470-28722-4
Manufactured in the United States of America
10 9 8 7 6 5 4 3 2 1
01_287224-ffirs.qxp 5/27/08 10:17 PM Page ii

About the Author
Dr. Joe Duarte is a widely read market analyst, writer, and an active trader.
His daily Market IQ column is read by thousands of investors, futures and
stock traders, information seekers, intelligence aficionados, and professionals
around the world.
Dr. Duarte is well recognized as a geopolitical and financial market analyst
combining a unique set of viewpoints into an original blend of solutions for
his audience. His daily columns appear at www.joe-duarte.com and are
syndicated worldwide by FinancialWire.
He is author of Successful Energy Sector Investing, Successful Biotech Investing,
Futures and Options For Dummies, and coauthor of After-Hours Trading Made
Easy.
He is a board certified anesthesiologist, a registered investment advisor, and
President of River Willow Capital Management.
Dr. Duarte has appeared on CNBC and appears regularly on The Financial
Sense Newshour with Jim Puplava radio show, where he comments on the
energy markets and geopolitics. He has logged appearances on Biz Radio,
Wall Street Radio, JagFn, WebFN, KNX radio in Los Angeles, and WOWO radio.
One of CNBC’s original Market Mavens, Dr. Duarte has been writing about the
financial markets since 1990. An expert in health care and biotechnology stocks,
the energy sector, as well as financial market sentiment, his daily syndicated
stock columns have appeared on leading financial Web sites, including Reuter’s
e-charts, afterhourtrades.com and MarketMavens.com.
His articles and commentary have appeared on Marketwatch.com. He has
been quoted in Barron’s, U.S.A. Today, Smart Money, Medical Economics,
Rigzone.com
, and in Technical Analysis of Stocks and Commodities magazine.
01_287224-ffirs.qxp 5/27/08 10:17 PM Page iii

01_287224-ffirs.qxp 5/27/08 10:17 PM Page iv

Dedication
To my mother, whose long fight with cancer is remarkable and a sign of the
human spirit’s ability to persevere in the toughest of circumstances.
Author’s Acknowledgments
A book is always more a product of circumstances than of the author’s wits
and ability to research data and synthesize it. No author can create without
the help of others. So here’s the list of important people for this one:
My family, my office staffs from my other life, and the Wiley editorial staff,
especially Stacy and Tracy who worked with me despite the inevitable cir-
cumstances that arose in the production of this book.
Grace, “the wonder agent” and purveyor of recurrent gigs.
Frank, “the master of all things Web-related,” without whom there would be
no Joe-Duarte.com.
To the inventor of audio books, because they keep me sane in my travels
between the places that I must go to in my search for truth, justice, and bucks.
As always, coffee, tea, vitamins, sports drinks, nutrition bars, and the game of
tennis also help.
Especially to those who read my books, subscribe to my Web site, and have
kept this thing going for 18 years.
And also to two long-time friends, John and Greg, whose interactions with me
always prove to be worthwhile and interesting, to say the least.
If I’ve forgotten to mention anyone, it wasn’t intentional — I’m not as young
as I used to be.
01_287224-ffirs.qxp 5/27/08 10:17 PM Page v

Publisher’s Acknowledgments
We’re proud of this book; please send us your comments through our Dummies online registration
form located at www.dummies.com/register/.
Some of the people who helped bring this book to market include the following:
Acquisitions, Editorial, and Media
Development
Project Editor: Tracy Brown Collins
Copy Editor: Christy Pingleton
Acquisitions Editor: Stacy Kennedy
Technical Editor: Brian Richman
Editorial Manager: Jennifer Ehrlich
Editorial Supervisor and Reprint Editor:
Carmen Krikorian
Art Coordinator: Alicia South
Editorial Assistants: Erin Calligan Mooney,
Joseph Niesen, David Lutton, and
Jennette ElNaggar
Cartoons: Rich Tennant
(www.the5thwave.com)
Composition Services
Project Coordinator: Katie Key
Layout and Graphics: Reuben W. Davis,
Melissa K. Jester, Ronald Terry,
Christine Williams
Proofreaders: Laura Albert,
Melissa Bronnenberg, Valerie Haynes Perry
Indexer: Bonnie Mikkelson
Publishing and Editorial for Consumer Dummies
Diane Graves Steele, Vice President and Publisher, Consumer Dummies
Joyce Pepple, Acquisitions Director, Consumer Dummies
Kristin A. Cocks, Product Development Director, Consumer Dummies
Kathleen Nebenhaus, Vice President and Executive Publisher, Consumer Dummies, Lifestyles,
Pets, Education Publishing for Technology Dummies
Gerry Fahey, Vice President of Production Services
Debbie Stailey, Director of Composition Services
01_287224-ffirs.qxp 5/27/08 10:17 PM Page vi

Contents at a Glance
Introduction .................................................................1
Part I: Understanding the Financial Markets ..................7
Chapter 1: The Ins and Outs of Trading Futures ............................................................9
Chapter 2: Where Money Comes From ..........................................................................25
Chapter 3: The Futures Markets .....................................................................................39
Chapter 4: Some Basic Concepts About Options on Futures .....................................53
Chapter 5: Trading Futures Through the Side Door ....................................................67
Part II: Analyzing the Markets ....................................79
Chapter 6: Understanding the Fundamentals of the Economy ..................................81
Chapter 7: Getting Technical Without Getting Tense ................................................101
Chapter 8: Speculating Strategies That Use Advanced Technical Analysis............125
Chapter 9: Trading with Feeling Now!..........................................................................143
Part III: Financial Futures.........................................161
Chapter 10: Wagging the Dog: Interest Rate Futures .................................................163
Chapter 11: Rocking and Rolling: Speculating with Currencies ...............................185
Chapter 12: Stocking Up on Indexes ............................................................................205
Part IV: Commodity Futures.......................................219
Chapter 13: Getting Slick and Slimy: Understanding Energy Futures ......................221
Chapter 14: Getting Metallic Without Getting Heavy.................................................247
Chapter 15: Getting to the Meat of the Markets: Livestock and More.....................265
Chapter 16: The Bumpy Truth About Agricultural Markets .....................................279
Part V: The Trading Plan ...........................................293
Chapter 17: Trading with a Plan Today So You Can Do It Again Tomorrow ...........295
Chapter 18: Looking for Balance Between the Sheets ...............................................303
Chapter 19: Developing Strategies Now to Avoid Pain Later....................................313
Chapter 20: Executing Successful Trades ...................................................................323
Part VI: The Part of Tens ...........................................333
Chapter 21: Ten Killer Rules to Keep You Sane and Solvent.....................................335
Chapter 22: More Than Ten Additional Resources ....................................................341
Index .......................................................................347
02_287224-ftoc.qxp 5/27/08 10:49 PM Page vii

02_287224-ftoc.qxp 5/27/08 10:49 PM Page viii

Table of Contents
Introduction..................................................................1
About This Book...............................................................................................2
Conventions Used in This Book .....................................................................3
What I Assume about You ...............................................................................3
How This Book Is Organized...........................................................................4
Part I: Understanding the Financial Markets ......................................5
Part II: Analyzing the Markets...............................................................5
Part III: Financial Futures.......................................................................5
Part IV: Commodity Futures..................................................................5
Part V: The Trading Plan .......................................................................5
Part VI: The Part of Tens .......................................................................6
Icons Used in This Book..................................................................................6
Where to Go from Here....................................................................................6
Part I: Understanding the Financial Markets ...................7
Chapter 1: The Ins and Outs of Trading Futures . . . . . . . . . . . . . . . . . . . .9
Who Trades Futures?.....................................................................................10
What Makes a Futures Trader Successful? .................................................11
What You Need in Order to Trade................................................................12
Seeing the Two Sides of Trading ..................................................................13
Getting Used to Going Short .........................................................................13
Managing Your Money ...................................................................................14
Analyzing the Markets ...................................................................................15
Noodling the Global Economy......................................................................16
The China phenomenon ......................................................................16
Europe: Hitting the skids .....................................................................17
North America: Ignore it at your own risk ........................................19
Emerging markets: There’s more to keep tabs
on than you may expect...................................................................20
Militant Islam ........................................................................................21
Relating Money Flows to the Financial Markets.........................................22
Enjoying Your Trading Habit.........................................................................23
Chapter 2: Where Money Comes From . . . . . . . . . . . . . . . . . . . . . . . . . .25
Discovering How Money Works: The Fiat System......................................26
Money’s money because we say it’s money......................................26
Where money comes from ..................................................................27
02_287224-ftoc.qxp 5/27/08 10:49 PM Page ix

Trading Futures For Dummies
x
Introducing Central Banks (Including the Federal Reserve) ....................28
The central bank of the United States (and the world):
The Federal Reserve.........................................................................28
How central banks function ................................................................30
Understanding Money Supply ......................................................................31
Equating money supply and inflation ................................................31
Seeing how something from something is something more ...........33
Getting a handle on money supply from a trader’s point of view ....34
Putting Fiat to Work for You..........................................................................35
Bonding with the Fed: The Nuts and Bolts of Interest Rates....................36
Central Banks..................................................................................................37
Chapter 3: The Futures Markets . . . . . . . . . . . . . . . . . . . . . . . . . . . . . . . .39
Taking Big Risks and Guarding Against Them: Two Types of Traders....40
Hedging bets to minimize risk ............................................................40
Speculating that there’s a profit to be had........................................42
Limiting Risk Exposure: Contract and Trading Rules................................43
Checking the expiration date..............................................................43
Chilling out: Daily price limits ............................................................43
Sizing up your account ........................................................................43
Staying Up to Snuff: Criteria for Futures Contracts ...................................44
Seeing Where the Magic Happens................................................................45
Exploring How Trading Actually Takes Place .............................................47
Shifting sands: Twenty-four-hour trading..........................................48
Talking the talk .....................................................................................49
Making the Most of Margins .........................................................................51
Chapter 4: Some Basic Concepts About Options on Futures . . . . . . . .53
Getting Options on Futures Straight............................................................54
SPANning your margin .........................................................................54
Types of options ...................................................................................55
Types of option traders .......................................................................56
Breaking down the language barrier..................................................56
Grappling with Greek ...........................................................................57
Understanding Volatility: The Las Vega Syndrome ....................................61
Some Practical Stuff .......................................................................................63
General rules of success......................................................................64
Useful information sources ................................................................66
Chapter 5: Trading Futures Through the Side Door . . . . . . . . . . . . . . . .67
Introducing Exchange-Traded Funds...........................................................68
Stocking Up on Stock Index Future ETFs ....................................................70
The S&P 500 (SPX) ...............................................................................70
The Nasdaq 100 Index (NDX)..............................................................71
The Dow Jones Industrial Average.....................................................71
02_287224-ftoc.qxp 5/27/08 10:49 PM Page x

xi
Table of Contents
Comfort via Commodity ETFs ......................................................................72
Energizing your ETF Trades ................................................................72
The golden touch — metal ETFs ........................................................74
Getting Current with Currency ETFs ...........................................................74
Using ETFs in Real Trading ...........................................................................75
Part II: Analyzing the Markets .....................................79
Chapter 6: Understanding the Fundamentals of the Economy . . . . . . .81
Understanding the U.S. Economy: A Balancing Act ...................................83
Getting a General Handle on the Reports ...................................................84
Exploring how economic reports are used .......................................85
Gaming the calendar ............................................................................86
Exploring Specific Economic Reports .........................................................86
Working the employment report ........................................................87
Probing the Producer Price Index (PPI) ............................................88
Browsing in the Consumer Price Index (CPI) ...................................89
Managing the ISM and purchasing manager’s reports ....................90
Considering consumer confidence ....................................................91
Perusing the Beige Book......................................................................92
Homing in on housing starts...............................................................94
Staying Awake for the Index of Leading Economic Indicators .................95
Grossing out with Gross Domestic Product (GDP) ..........................96
Getting slick with oil supply data .......................................................96
Enduring sales, income, production,
and balance of trade reports...........................................................98
Trading the Big Reports ................................................................................98
Keeping It Simple............................................................................................99
Chapter 7: Getting Technical Without Getting Tense . . . . . . . . . . . . .101
Picturing a Thousand Ticks: The Purpose of Technical Analysis..........102
First Things First: Getting a Good Charting Service ................................104
Deciding What Types of Charts to Use......................................................107
Stacking up bar charts.......................................................................108
Weighing the benefits of candlestick charts ...................................108
Getting the Hang of Basic Charting Patterns ............................................111
Analyzing textbook base patterns....................................................111
Using lines of resistance and support to place buy
and sell orders ................................................................................113
Moving your average .........................................................................114
Breaking out ........................................................................................116
Using trading ranges to establish entry and exit points ...............117
Seeing gaps and forming triangles ...................................................118
Seeing through the Haze: Common Candlestick Patterns ......................119
Engulfing the trend.............................................................................120
Hammering and hanging for traders, not carpenters ....................121
Seeing the harami pattern .................................................................122
02_287224-ftoc.qxp 5/27/08 10:49 PM Page xi

Trading Futures For Dummies
xii
Chapter 8: Speculating Strategies That
Use Advanced Technical Analysis . . . . . . . . . . . . . . . . . . . . . . . . . . . . .125
Using Indicators to Make Good Trading Decisions..................................126
Making good use of moving averages ..............................................126
Understanding and using oscillators ...............................................128
Seeing how trading bands stretch....................................................130
Trading with trend lines ....................................................................134
Lining Up the Dots: Trading with the Technicals.....................................137
Identifying trends ...............................................................................137
Getting to know setups ......................................................................138
Buying the breakout...........................................................................139
Swinging for dollars ...........................................................................139
Selling and shorting the breakout in a downtrend.........................140
Setting your entry and exit points ...................................................142
Chapter 9: Trading with Feeling Now! . . . . . . . . . . . . . . . . . . . . . . . . . .143
The Essence of Contrarian Thinking .........................................................144
Bull Market Dynamics..................................................................................145
Survey Says: Trust Your Feelings ...............................................................145
Considering Volume (And How the Market Feels About It)....................148
Out in the Open with Open Interest...........................................................151
Rising markets ....................................................................................152
Sideways markets...............................................................................152
Falling markets....................................................................................152
Putting Put/Call Ratios to Good Use ..........................................................153
Total put/call ratio..............................................................................154
Index put/call ratio.............................................................................154
Understanding the Relationship Between Open Interest and Volume ....156
Using Soft Sentiment Signs..........................................................................157
Scanning magazine covers and Web site headlines .......................157
Monitoring congressional investigations and activist protests......158
Developing Your Own Sentiment Indicators.............................................159
Part III: Financial Futures .........................................161
Chapter 10: Wagging the Dog: Interest Rate Futures . . . . . . . . . . . . .163
Bonding with the Universe..........................................................................164
Looking at the Fed and bond-market roles .....................................164
Hedging in general terms ..................................................................166
Globalizing the markets.....................................................................168
Yielding to the Curve ...................................................................................170
02_287224-ftoc.qxp 5/27/08 10:49 PM Page xii

xiii
Table of Contents
Deciding Your Time Frame..........................................................................171
Shaping the curve...............................................................................172
Checking out the yield curve ............................................................173
Getting the Ground Rules of Interest-Rate Trading .................................173
Playing the Short End of the Curve: Eurodollars & T-Bills .....................175
Eurodollar basics................................................................................175
Trading Eurodollars ...........................................................................176
Trading Treasury-bill futures ............................................................179
Trading Bonds and Treasury Notes...........................................................180
What you’re getting into ....................................................................180
What you get if you take delivery.....................................................181
Chapter 11: Rocking and Rolling: Speculating with Currencies . . . .185
Understanding Foreign Exchange Rates....................................................186
Exploring Basic Spot-Market Trading ........................................................187
Dabbling in da forex lingo .................................................................188
Electronic spot trading ......................................................................190
The U.S. Dollar Index ...................................................................................197
Trading Foreign Currency ...........................................................................199
Trading the euro against the dollar .................................................199
The UK pound sterling.......................................................................200
The Japanese yen ...............................................................................200
The Swiss franc...................................................................................201
Arbitrage Opportunities and Sanity Requirements .................................202
Chapter 12: Stocking Up on Indexes . . . . . . . . . . . . . . . . . . . . . . . . . . .205
Seeing What Stock-Index Futures Have to Offer.......................................206
Contracting with the Future: Looking into Fair Value..............................208
Major Stock-Index Futures Contracts ........................................................208
The S&P 500 futures (SP)...................................................................209
The NASDAQ-100 Futures Index (ND) ..............................................210
Minimizing your contract ..................................................................211
Formulating Trading Strategies ..................................................................212
Using futures rather than stocks ......................................................212
Protecting your stock portfolio ........................................................213
Swinging with the rule .......................................................................215
Speculating with stock-index futures...............................................216
Using Your Head to Be Successful .............................................................216
Get real.................................................................................................217
Limit your risk ....................................................................................217
Become a contract specialist............................................................217
Don’t trade when your mind is elsewhere ......................................218
Never be afraid of selling too soon ..................................................218
Never let yourself get a margin call .................................................218
02_287224-ftoc.qxp 5/27/08 10:49 PM Page xiii

Trading Futures For Dummies
xiv
Part IV: Commodity Futures .......................................219
Chapter 13: Getting Slick and Slimy:
Understanding Energy Futures . . . . . . . . . . . . . . . . . . . . . . . . . . . . . . . .221
Some Easy Background Info........................................................................222
Completing the Circle of Life: Oil and the Bond Market .........................222
Watching the bond market ................................................................223
Looking for classic signs as oil prices rise......................................224
Examining the Peak Oil Concept ................................................................226
The Post-9/11 Mega Bull Market in Energy ...............................................227
Understanding Supply and Demand ..........................................................229
Playing the Sensible Market........................................................................230
Handling Seasonal Cycles ...........................................................................232
Preparing for the Weekly Cycle ..................................................................233
Checking other sources before Wednesday....................................233
How to react to the report ................................................................234
Forecasting Oil Prices by Using Oil Stocks ...............................................235
Burning the Midnight Oil.............................................................................237
Getting the Lead Out with Gasoline...........................................................238
Contract specifications......................................................................239
Trading strategies ..............................................................................239
Keeping the Chill Out with Heating Oil......................................................240
Getting Natural with Gas .............................................................................243
Getting in Tune with Sentiment and the Energy Markets .......................244
Some Final Thoughts about Oil ..................................................................245
Chapter 14: Getting Metallic Without Getting Heavy . . . . . . . . . . . . .247
Tuning In to the Economy ...........................................................................248
Gold Market Fundamentals.........................................................................249
Lining the Markets with Silver....................................................................253
Catalyzing Platinum .....................................................................................253
Industrializing Your Metals .........................................................................254
Getting into Metal Without the Leather: Trading Copper.......................254
Setting up your copper-trading strategy .........................................255
Charting the course ...........................................................................256
Organizing the charts ........................................................................260
Making sure fundamentals are on your side...................................262
Getting a handle on the Fed ..............................................................263
Pulling it together...............................................................................264
Chapter 15: Getting to the Meat of the Markets:
Livestock and More . . . . . . . . . . . . . . . . . . . . . . . . . . . . . . . . . . . . . . . . . .265
Exploring Meat-Market Supply and Demand,
Cycles, and Seasonality ...........................................................................266
02_287224-ftoc.qxp 5/27/08 10:49 PM Page xiv

xv
Table of Contents
Understanding Your Steak ..........................................................................267
The breeding process ........................................................................268
The packing plant...............................................................................268
The feeder cattle contract.................................................................269
The CME live cattle contract ............................................................269
Understanding Your Pork Chop .................................................................270
Living a hog’s life ................................................................................270
Pork bellies..........................................................................................271
Matching Technicals with Fundamentals..................................................271
Watching for the Major Meat-Market Reports..........................................273
Counting cattle ...................................................................................273
Posting pig-related data.....................................................................274
Other meat-market reports to watch...............................................274
Interpreting Key Report Data .....................................................................275
Outside Influences that Affect Meat Prices ..............................................276
Chapter 16: The Bumpy Truth About Agricultural Markets . . . . . . . .279
Staying Out of Trouble Down on the Farm ...............................................280
Agriculture 101: Getting a Handle on the Crop Year................................281
Weathering the highs and lows of weather.....................................282
Looking for Goldilocks: The key stages of grain development.....283
Cataloging Grains and Beans ......................................................................284
The soybean complex........................................................................284
Getting corny ......................................................................................286
Culling Some Good Fundamental Data ......................................................286
Getting a handle on the reports .......................................................287
Don’t forget the Deliverable Stocks of Grain report ......................288
Gauging Spring Crop Risks..........................................................................288
Agriculture 102: Getting Soft.......................................................................290
Having coffee at the exchange ..........................................................290
Staying sweet with sugar ...................................................................291
Building a rapport with lumber ........................................................292
Part V: The Trading Plan............................................293
Chapter 17: Trading with a Plan Today So You Can
Do It Again Tomorrow . . . . . . . . . . . . . . . . . . . . . . . . . . . . . . . . . . . . . . . .295
Financing Your Habit ...................................................................................296
Deciding Who’s Going to Do the Trading ..................................................296
Choosing a CTA ............................................................................................298
Reviewing the CTA’s track record.....................................................298
Other CTA characteristics to watch for...........................................299
Considering a trading manager ........................................................299
Choosing a Broker........................................................................................300
Falling in the pit of full service .........................................................301
Choosing a futures discount broker ................................................302
02_287224-ftoc.qxp 5/27/08 10:49 PM Page xv

Trading Futures For Dummies
xvi
Chapter 18: Looking for Balance Between the Sheets . . . . . . . . . . . .303
Exploring What’s on Your Mental Balance Sheet .....................................304
Why do you want to trade? ...............................................................304
Trading as part of an overall strategy .............................................305
Trading for a living .............................................................................306
The Financial Balance Sheet .......................................................................306
Organizing your financial data..........................................................306
Setting realistic goals .........................................................................308
Calculating Your Net Worth ........................................................................308
Chapter 19: Developing Strategies Now to Avoid Pain Later . . . . . .313
Deciding What You’ll Trade ........................................................................313
Adapting to the Markets..............................................................................314
Trading the reversal...........................................................................315
Trading with momentum ...................................................................315
Swing trading ......................................................................................316
Managing Profitable Positions....................................................................316
Building yourself a pyramid (without being a pharaoh)...............317
Preventing good profits from turning into losses ..........................317
Never adding to losing positions......................................................318
Back Testing Your Strategies ......................................................................318
Setting Your Time Frame for Trading ........................................................319
Day trading ..........................................................................................319
Intermediate-term trading .................................................................319
Long-term trading...............................................................................320
Setting Price Targets ....................................................................................320
Reviewing Your Results ...............................................................................320
Remember Your Successes and Manage Your Failures ...........................322
Making the Right Adjustments ...................................................................322
Chapter 20: Executing Successful Trades . . . . . . . . . . . . . . . . . . . . . . .323
Setting the Stage ..........................................................................................323
Getting the Big Picture ................................................................................325
Viewing the long-term picture of the market ..................................325
Doing a little technical analysis........................................................326
Stalking the Setup.........................................................................................326
Checking your account ......................................................................327
Reviewing key characteristics of your contract.............................328
Reviewing your plan of attack ..........................................................328
Jumping on the Wild Beast: Calling In Your Order...................................329
Riding the Storm...........................................................................................330
Knowing If You’ve Had Enough...................................................................331
Reviewing Your Trade..................................................................................332
Mastering the Right Lessons ......................................................................332
02_287224-ftoc.qxp 5/27/08 10:49 PM Page xvi

Part VI: The Part of Tens ............................................333
Chapter 21: Ten Killer Rules to Keep You Sane and Solvent . . . . . . .335
Trust in Chaos ..............................................................................................335
Avoid Undercapitalization ..........................................................................336
Be Patient ......................................................................................................336
Trade with the Trend...................................................................................337
Believe in the Charts, Not the Talking Heads ...........................................338
Remember, Diversification Is Protection...................................................338
Limit Losses ..................................................................................................339
Trade Small ...................................................................................................339
Have Low Expectations ...............................................................................340
Set Realistic Goals........................................................................................340
Chapter 22: More Than Ten Additional Resources . . . . . . . . . . . . . . .341
Government Web Sites ................................................................................341
General Investment Information Web Sites ..............................................342
Commodity Exchanges ................................................................................343
Trading Books...............................................................................................344
Newsletter and Magazine Resources.........................................................345
Index........................................................................347
xvii
Table of Contents
02_287224-ftoc.qxp 5/27/08 10:49 PM Page xvii

Trading Futures For Dummies
xviii
02_287224-ftoc.qxp 5/27/08 10:49 PM Page xviii

Introduction
R
isk and uncertainty go hand in hand with opportunities to make money.
Those who can shake off the chains of preconceived notions and ideol-
ogy and who discover how to make money as markets rise or fall are more
successful than investors who buy and hold.
And that’s what this book is about: embracing the inherent volatility of the
world and the markets and using it as a wealth-building tool.
Goods, services, and basic materials probably will undergo major price
swings, up and down, at one time or another during the next 20 years. The
volatility of the markets is only going to increase. And the chances for sus-
tainable trends that last for decades, the way the stock market rallied in the
1980s and 1990s, are less likely than they were a few years ago.
If global warming doesn’t get you, then politicians, militants, or dictators are
almost certain to try. That’s why finding out how to trade futures is important
for investors who not only want to diversify their own portfolios but also
want to find ways to protect and grow their money when times are hard in
traditional investment venues such as the stock market, a point well illus-
trated by the action in the financial markets in 2007 and early 2008.
The world has changed since the events of September 11, 2001. China, India,
Brazil, and other economies are now competing with the United States and
Europe. This competition is not likely to ebb or change for several decades,
which means that market volatility is not likely to go away any time soon.
Whereas in the past investors could afford the luxury of buying and holding
stocks or mutual funds for the long term, the post-September 11, 2001, world
calls for a more active and even a speculative investor. The new world calls
for a trader. And the futures markets, although high risk, offer some of the
best opportunities to make money by trading in volatile times.
So you need to get ready to work as a stock trader, a geopolitical analyst, a
money manager, and an expert in the oil and commodity markets. In my line
of work, I have to keep up with news about the economy, disruptions in the
supply of oil, the weekly trends of oil supply, weather patterns, and the stock
market, both in a macro and micro universe. As a futures trader, you have to
do the same with your contract of choice, and you have to pay attention to
03_287224-intro.qxp 5/27/08 10:59 PM Page 1

time factors, especially expiration dates and how much time you have left to
decide whether you have to exercise your option.
Remember that successful traders
Have a plan, follow it, and adjust it to changing conditions
Look at trading as a business
Are disciplined in their personal and professional lives
Understand the risks and the game they’re playing
Know and accept that they will make mistakes
Never forget their mistakes and benefit from them
Never enter into a trade without knowing their exit strategy — how
they’ll get out of the market
Never risk money that they aren’t willing to or can’t afford to lose
Never allow a bad trade to lead to a margin call
Trading futures isn’t gambling; it’s speculating. It’s also about being prepared,
gathering information, and making judgment calls about situations that are
unfolding, and it’s a process of self-protection and an ongoing education.
You may think of yourself as a dummy. But after you read this book, you’ll
know how trading futures is done and how to stay in the game as long as you
want, not necessarily by hitting home runs but rather by showing up to work
every day, getting your uniform dirty, and playing good, consistent, funda-
mental baseball.
About This Book
Futures markets are resurging and are likely to be hot for several decades,
given the political landscape. Changing world demographics and the emer-
gence of China and India as economic powers and consumers, coupled with
changing politics in the Middle East, are likely to fuel the continued promi-
nence of these markets.
I take you inside these markets and give you tools that you can use for
Analyzing, trading, or just gaining a better understanding of how
money works and affects your daily life.
Starting fresh in your views of how the markets work. A traditional
buy and hold mind-set is a recipe for trouble in futures and options
trading, while profit-taking or hedging a position before the weekend
is normal operating procedure.
Trading Futures For Dummies
2
03_287224-intro.qxp 5/27/08 10:59 PM Page 2

Discovering that time is on your side in the stock and bond markets,
but it’s your enemy in futures. You have to be on top of how much time
you have left before your trading position expires, becoming worthless,
or you have a load of something delivered with a bill for a large sum of
money.
Reading a sentence just the way it’s written. No tricks, hidden clues,
political agendas, or attempts to make you look foolish. If you don’t get
it, I didn’t do a good job of writing it.
Remembering that measuring the return of your money is more
important than measuring the return on your money.
Conventions Used in This Book
To help you make the best use of this book, I use the following conventions:
Italic is used for emphasis and to highlight new words or terms.
Boldface text is used to indicate key words in bulleted lists or the action
parts of numbered steps.
Monofont
is used for Web addresses.
What I Assume about You
I had to start somewhere, so I assumed some things that may or may not
apply to you. I’m not trying to offend you or to be condescending. So here’s
what I’ve assumed about you:
You’re not a beginner. In fact, you’ve got some experience in investing and at
least conceptually know that professionals are not the buy and hold investors
that Wall Street would like to make the public believe that they are.
You’re looking for a better way to make money in the markets, but even
though you have some experience, don’t know enough to trade futures
and want to find out how to do it without losing your shirt.
Even though you’ve been a stock trader or investor, you’d like to know
more about using charts, indicators, and trading psychology.
You want to find out how to decrease the risk within your portfolio.
You want to become a more active trader and make money more consis-
tently by letting your profits run and cutting your losses short.
You want to know how to make sense of the big picture in the markets
and to try your hand at trading currencies, bonds, and commodities.
3
Introduction
03_287224-intro.qxp 5/27/08 10:59 PM Page 3

You like the idea of trading on margin, and you’re not afraid of leveraging
additional money.
You aren’t afraid of being wrong five or six times in a row when trading,
but you’re willing to try again until you succeed.
You want to investigate more about how politics, wars, weather, and
external events can be used as opportunities to trade.
And most important, you know that reading an introductory or interme-
diate work, such as this, is an excellent beginning, but that you’ll have to
read more, find out more, and make changes to your trading skills as
time passes.
If these assumptions describe you, you’ve picked up the right book. Never-
theless, I also assume that you have some tools and resources at your dis-
posal. Here’s what you need to get started in futures trading:
Plenty of money and a cast-iron stomach to boot. You need to have at
least twice the amount that your broker/advisor lists as a minimum for
opening an account. And you have to be ready to lose it all, fast, although
if you follow the money management rules in this book, that won’t nec-
essarily happen.
Your head screwed on straight before you start. Futures trading is
really dangerous and can wither away your trading capital fast.
A quiet place to prepare, set up your trading station, and make sure
that you know your market stuff really well. Exchange hours, what bro-
kers do and don’t do, what trading terms like bid and offer mean, and how
to read a brokerage statement are only some of what you need to know.
A fast computer with a fast Internet connection.
Access to good charts. You can gain access to charts either through the
Web or a good trading software program, which gives you the ability to
test your strategies before you commit to them.
Subscriptions to newsletters, books, magazines, and software. Be
ready to spend some money for these important information resources.
You can also take courses, and you need to get used to paper trading
(practicing without money) before jumping into the deep end.
How This Book Is Organized
I’ve organized Trading Futures For Dummies into six parts. Parts I and II intro-
duce you to the futures markets and market analysis — technical and funda-
mental. Parts III through V take you into the nuts and bolts: the exchanges,
the contracts, trading strategies, and indicators. Part VI is the now-famous
For Dummies Part of Tens, in which you can discover a little about a lot of
different futures information.
Trading Futures For Dummies
4
03_287224-intro.qxp 5/27/08 10:59 PM Page 4

Part I: Understanding the
Financial Markets
Sure, this sounds like a lot to swallow, but if you don’t understand how the
pieces fit together, you won’t get the finer points that can make you a better
trader.
This part shows you three things:
Where money comes from and why markets move the way they do
What the function and role of futures and options markets are
How the financial markets work together
Part II: Analyzing the Markets
This part is where you get your basic training. It’s all about fundamental and
technical analyses, and it gives you details about supply and demand, how to
use economic reports, and how to take advantage of seasonal and chart pat-
terns and market sentiment.
Part III: Financial Futures
Most stock investors think the stock market is the center of the universe.
After you read this part, you’ll see things differently, because I look at the
role of the bond market and how it’s really the tail that wags the dog.
Part IV: Commodity Futures
Yeah, baby! We finally get to pork bellies, soybeans, and wheat. But more
important, this part is about trading oil, natural gas, steel, copper, gold, you
name it — all of which are affected by strange things like weather, pollution,
and electricity thrown in for good measure.
Part V: The Trading Plan
This part is a big case of the nuts and bolts of trading. Relax, it isn’t catching,
but it is likely to get you a bit more organized. Who can’t use a little disci-
pline, eh?
5
Introduction
03_287224-intro.qxp 5/27/08 10:59 PM Page 5
This part details how you can set up, organize, execute, and operate a trading
business, starting with the trading calendar and working all the way to decid-
ing what your best markets and surefire strategies are and how to mix and
match approaches while trading and hedging.
Part VI: The Part of Tens
Here I give you lists of rules and resources that can not only help you make
money but also keep you from losing big chunks of it whenever the markets
turn on you.
Icons Used in This Book
For Dummies books use little pictures, called icons, to flag certain chunks of
text and information that are of particular interest. Here’s what they actually
mean to you, the reader:
Yup, this one is important. Don’t forget the stuff marked with this icon.
The bull’s-eye gives you info that you can put to use right away, such as when
to trade or how to engage a specific strategy.
I like this one best because it reminds me of Inspector Clouseau of The Pink
Panther fame. The “bemb,” as Clouseau would say, is a sign that you need to
read the information highlighted by it carefully. If you ignore this icon, you
can end up in a world of hurt.
Although you can skip this important, but not necessarily essential, informa-
tion without repercussion, you may not be able to impress your friends at the
water cooler as much as you otherwise would.
Where to Go from Here
For Dummies books are set up so you can start reading anywhere. Don’t feel
as though you have to read everything from beginning to end. If you’re a true
beginner, or feel as if you need to brush up on the basics of the global econ-
omy before moving on to trading, I recommend that you read Parts I and II
carefully before you start skipping around. Here’s to profitable futures trading.
Trading Futures For Dummies
6
03_287224-intro.qxp 5/27/08 10:59 PM Page 6
Part I
Understanding the
Financial Markets
04_287224-pp01.qxp 5/27/08 10:55 PM Page 7

In this part . . .
Y
ou get a handle on where money comes from and the
important details about how the futures markets
work in this part of Trading Futures For Dummies. I start
you out with the key relationship between central banks
and the bond markets and take you on a tour of the futures
markets, while offering a little history lesson along the
way. That leads you into an overview of today’s markets —
how they work with and depend on one another.
04_287224-pp01.qxp 5/27/08 10:55 PM Page 8

Chapter 1
The Ins and Outs
of Trading Futures
In This Chapter
Finding out who trades futures and what makes them successful
Gathering your trading tools and know-how
Checking out market analysis, short trades, and money management
Understanding the effects of a global economy
Discovering how much fun trading can be
I
f you’re one of those people who look at their mutual fund portfolios once
a year and wonder how the results came about, futures trading isn’t for
you — at least until you make some changes in how you view the financial
markets. Much of what the average person believes to be true is not applica-
ble to the financial markets. One example is how sometimes the stock market
rallies when people lose their jobs. The reason is that sometimes job losses
lead to lower interest rates from central banks. And lower interest rates tend
to be a good thing for the stock market at some point in the future.
In other words, as a trader, you need a different mind-set than that of a work-
ing or professional person. To be sure, I’m not asking you to change your per-
sonal outlook on life, every minute of the day, but it will be helpful to your
trading success if you change a few of your views while trading.
No, you don’t have to live in a monastery and wear a virtual-reality helmet
that plugs into the Internet, has satellite TV, and features real-time quotes and
charts. You are, however, going to have to take the time to review your current
investing philosophy and find out how futures trading can fit into your day-
to-day scheme of things without ruining your family life and your nest egg.
Trading is not investing; it’s speculating. Speculating is defined as assuming a
business risk with the hope of profiting from market fluctuations. Successful
speculating requires analyzing situations, predicting outcomes, and putting
your money on the side of the trade that represents the way you think the
05_287224-ch01.qxp 5/27/08 10:55 PM Page 9

market is going to go, up or down. Speculating also involves an appreciation
of the fact that you can be wrong 70 percent of the time and still be a success-
ful futures trader if you apply the correct techniques for analyzing trades,
managing your money, and protecting your account.
Basically that means you have to chuck all your preconceptions about buy-
and-hold investing, asset allocation, and essentially all the strategies that
stock brokerages put out for public consumption. And just so you don’t call
your brother-in-law the broker and get the publisher and me in trouble: what
I mean is that buy-and-hold doesn’t work in the futures markets because
futures are designed for trading.
Trading futures contracts is a risky business and requires active participa-
tion. It can be plied successfully only if you’re serious, well prepared, and
committed to getting it right. That means that you have to develop new rou-
tines and master new things. In essence, you must be able to cultivate your
trading craft by constantly reviewing and modifying your plan and strategies.
To be a successful futures trader, you have to become connected with the
world through the Internet, television, and other news sources so you can be
up-to-date and intimately knowledgeable with regard to world events. And I
don’t mean just picking up on what you get from occasionally watching the
evening or headline news shows.
Setting up for this endeavor also requires a significant amount of money. You
need a computer, a trading program, and a brokerage account of some sort,
not to mention how well capitalized you have to be to be able to survive.
In essence, in order to morph from couch potato to futures trader, you have
to work at it, or you’ll be out of the game very quickly.
Who Trades Futures?
Aside from professional speculators and hedgers, whose numbers are many,
the ranks of futures traders essentially are made up of people like you and me
who are interested in making money in the markets. A wide variety of people
trade futures contracts at the retail level.
In his book Starting Out in Futures Trading (McGraw-Hill), author Mark Powers
cites a study by the Chicago Mercantile Exchange (CME) that described the
profile of a futures trader in the 1970s as a male between 35 and 55 years of
age with middle- to upper-class income. The study indicated that
Fifty-four percent were professionals, including doctors, lawyers, den-
tists, and white-collar workers, especially upper-management types.
10
Part I: Understanding the Financial Markets
05_287224-ch01.qxp 5/27/08 10:55 PM Page 10

Sixty-eight percent were college graduates.
Their overall tendency was toward short-term trading.
By 1999, Futures Industry magazine surveyed futures brokers regarding online
futures trading. A summary of the results identified
Some general tendencies but couldn’t settle on a description for a typi-
cal online futures trader
Account sizes ranging from $14,000 to $30,000 at brokerages aimed at
retail investors, with average transaction sizes within that group ranging
from 1.6 to 5 contracts
Account sizes ranging from $40,000 to millions of dollars at brokerages
with mostly institutional clienteles, with average transaction sizes within
that group ranging from 17 contracts to even larger transactions
Yet, this is a fluid situation, and it’s important to keep the macro demograph-
ics of society in mind. For example, as the general population ages, the poten-
tial for massive shifts in investment trends increases. Will a significant number
of retirees begin to look at futures markets as a potential set of investments?
Will this large group of investors start to cash in their stock portfolios? The
answers to these questions will be of importance over the next 20 years, as
baby boomers begin to leave full-time work and start to cash in long-term
equity investments.
The bottom line seems to be that to be able to trade futures you need to have
a certain amount of education and the technological and financial means to
get started.
What Makes a Futures
Trader Successful?
Everyone knows that it helps to know a few things about the financial mar-
kets and that you need the ability to at least consider online trading. And, of
course, you need the financial resources to trade futures contracts.
But how do you become good at it? How do you manage to survive, even
when you’re not particularly good at it?
The answer is simple. You must have the money and the ability to develop
a trading plan that enables you to keep making trades in the markets long
enough to make enough money to capitalize your next big trade.
Simply put: If you don’t have enough money, you won’t last. And if you don’t
have a good trading plan, your money quickly disappears.
11
Chapter 1: The Ins and Outs of Trading Futures
05_287224-ch01.qxp 5/27/08 10:55 PM Page 11
Ninety-five percent of all futures traders lose money consistently. You have to
prepare yourself to be one of the 5 percent who beat the odds. Your success
depends more than anything else on how you prepare yourself financially,
intellectually, technologically, and personally through the development of a
detailed and easy-to-implement trading plan.
What You Need in Order to Trade
You need money, knowledge, patience, and technology to be able to trade
futures contracts.
In terms of money, many experienced traders say that you need $100,000 to
get started, but the figures from the previous section show that retail
investors rarely have that much money in their accounts — at least as of
1999. The truth is that there are many talented traders who have made for-
tunes after starting out with significantly less than $100,000. However, it
would be irresponsible for me to lead you astray and give you the false
impression that the odds are very much in your favor if you start trading at a
very low equity level.
The reality is that different people fare differently, depending on their trading
ability, regardless of their experience level. A trader with a million dollars in
equity can lose large amounts just as easily as you and I can with $10,000
worth of equity in our accounts. My only point here is to make sure that you
understand the risk involved and that you go into trading with realistic
expectations.
If you’re looking for a magic number, $25,000 might be a goodcompromise;
$10,000 might get you by. And $5,000 is the absolute minimum.
If you don’t have that much money and are not sure how to proceed, you
need to either reconsider trading altogether, develop a stout trading plan and
the discipline required to heed its tenets, or consider managed futures con-
tracts. I discuss these topics in detail in Chapter 17. Would-be traders who
have less than $30,000 should also consider the managed futures opportuni-
ties like the ones I tell you about in Chapter 17.
When it comes to technology, you need an efficient computer system that has
enough memory to enable you to look at large numbers of data and run
either multiple, fully loaded browsers or several monitors at the same time.
You also need a high-speed Internet connection. If you get serious about trad-
ing, you may need to consider having two modes of high-speed Internet
access. For a home office, a full-time trader often has high-speed Internet
through the cable television service and through DSL (digital subscriber
line), with one or the other serving as a backup.
12
Part I: Understanding the Financial Markets
05_287224-ch01.qxp 5/27/08 10:55 PM Page 12
Seeing the Two Sides of Trading
Trading futures contracts is truly a hybrid that lies somewhere between the
types of trading that are separately based on technical analysis and funda-
mental analysis.
The fundamental side of trading (see Chapter 6 for all the details) involves
getting to know the following:
The industry in which you’re making trades
Contract specifications
Seasonal tendencies of the markets
Important reports on which you need to keep an eye
The technical side of trading (at least the part that I concentrate on) focuses
on what the market is doing in response to fundamentals. When you use tech-
nical analysis, you look at jargonistic things, such as trading volume, price
charts, and open interest, and how they respond to factors like the global
economy, interest rates, and politics — to name just a few influences on
prices. To do that, you need to have access to and be able to read charts and
know how to use indicators, such as trend lines, moving averages, and oscil-
lators. (I show you how in Chapters 7, 8, and 20.) These instruments and indi-
cators help you to keep track of prices and guide you in choosing when and
how best to place your trades — in other words, when to get in and out of the
markets. Without them, your trading is likely to suffer.
To be sure, there are other approaches to technical analysis, ranging from
those listed in this book to rather esoteric techniques that are not mentioned,
such as using astrology or rather precise, but not so commonly seen, chart pat-
terns. My goal here is to give you methods and examples that you can begin to
see and use immediately. See Chapter 7 for more on technical analysis.
Making money is always better than being right. The key is not what you
think should happen, but rather how the market responds to events and fun-
damental information and how you manage your trade. Success comes from
letting winning positions go as long as possible and cutting losses short
before they wipe you out.
Getting Used to Going Short
Going or selling short is the opposite of going long. Shorting the market, as it
is often referred to, usually troubles stock investors. Going short means that
you’re trying to make money when prices fall, while going long means that
you are trying to make money when prices rise. In the stock market, going
13
Chapter 1: The Ins and Outs of Trading Futures
05_287224-ch01.qxp 5/27/08 10:55 PM Page 13
short involves borrowing shares of stock from someone, usually your broker,
so you can sell it at a high price, wait for prices to fall, buy it back at the
lower price, return the asset to the lender, and pocket the difference between
what you sold it for and what you paid for it.
In the futures market, going short means that you’re trying to make money as
a result of falling contract prices. No borrowing is involved.
Although this may sound confusing, trading software simplifies the concept
for futures traders, by giving you a button choice for short selling. Chapters 7
and 8 offer nice examples, including illustrations of what short selling is and
when it’s the correct strategy to follow.
In futures trading, every transaction involves a trader who’s trading short
and one who’s trading long.
If selling short confuses you, you definitely need to read this book carefully
before you consider trading futures contracts or, for that matter, aggressively
trading stocks.
You can also bet on the market falling by using options strategies, a subject
that I touch on briefly in Chapter 4 and throughout the book as appropriate,
but that is covered in much greater detail in Trading Options For Dummies by
George A. Fontanills (Wiley).
Managing Your Money
To be a successful trader, you must have a successful money management
system that includes a minimum of these four components:
Having enough money: You need enough money to get a good start and
to keep trading. Undercapitalization is the major reason for failure. See
“What You Need to Trade,” earlier in this chapter.
Setting appropriate limits: You need to set reasonable limits on how
much you’ll risk, how you’ll diversify your account, how much you’re
willing to lose, and when and how you’ll take profits. Knowing your
limits and sticking to them with regard to all these factors is important
to successful trading. You get there by doing things like developing and
regularly reviewing your trading plan, and using techniques such as
placing stop-loss orders under your trades to limit losses if you’re
wrong. See Chapters 17, 18, 19, and 20 for trading strategies.
Setting realistic goals: Know where you want to be on a monthly, quar-
terly, and yearly basis. This will help you evaluate the efficacy of your
trading plan.
14
Part I: Understanding the Financial Markets
05_287224-ch01.qxp 5/27/08 10:55 PM Page 14

Avoiding margin calls: Margin calls will come if your account’s equity
falls below critical levels. Margin levels are different for each contract
that you trade. A margin call is what happens when you hold a position
that is falling in value beyond a limit set by the exchange. For example, if
you are trading widgets with a margin set at $1,000 and your widget con-
tracts fall below $1,000, your broker calls you and asks you for more
money. If you can’t put more money in the account, either by wiring it or
by selling what’s left of your widgets, the broker sells the widgets to
raise the money, and your account is inactive until you raise the amount
of money needed to meet future margins.
Analyzing the Markets
One of the most important steps you can take toward being a good trader is
developing a knack for analyzing the markets. That means you need to under-
stand the technical and fundamental aspects of the market with respect to
the underlying asset that you’re trading.
The two basic ways for choosing what to trade are
Monitoring different markets to see which ones are moving or are
likely to move. The more markets that you understand and become
familiar with, the better off you’ll be. When you have an understanding
of the environment and the variables that move more than one market,
you can trade each of them individually, based on your knowledge and
within the overall trend that they are displaying at any given time. In
other words, you’re not locked into just trading stocks when the market
is going up, because you can also trade oil, natural gas, bonds, curren-
cies, and grains.
The advantage to knowing more than one market is that you’ll almost
always have something to trade. The disadvantage is that when you’re
just getting started, you certainly won’t be an expert in too many mar-
kets, so don’t be in a hurry. Chapters 6 through 8 focus on technical and
fundamental analyses of the economy, the futures markets, and basic
speculating strategies.
Becoming an expert (on the technical and fundamental aspects) in at
least one or two markets, and then trading them exclusively. The
advantage is that you get a good feeling for the subtleties of these mar-
kets and your chances of success are likely to increase. The disadvantage
is that you may have a good deal of dead time or dull stretches if the
markets you choose don’t move much. Chapters 10 through 16 cover the
major mainstream futures markets in detail, including trading strategies.
15
Chapter 1: The Ins and Outs of Trading Futures
05_287224-ch01.qxp 5/27/08 10:55 PM Page 15

Noodling the Global Economy
The dominant economic variables currently emerging in the world are the
advance of militant Islam, the Chinese economy, and the emerging purchas-
ing power of the developing world, which now competes effectively for com-
modities with the developed world.
Every era has one major trend that separates it from the others. In the 1970s,
investing was all about commodities, real estate, and oil. In the 1980s, it was
about the first generation of technology companies bursting onto the scene.
And in the 1990s, it was all about the Internet. These major dynamics came
about because a specific set of political and economic circumstances
spawned them.
The 21st century has brought inflation back, which means that the commod-
ity markets are the place to be in the foreseeable future. Trends of this magni-
tude tend to remain in place for many years, but are not guaranteed to go
straight up, or straight down, which gives you ample opportunity to trade on
the long and the short side. But, at some point, the dominant trend will
reverse, and you need to be ready for that moment. Thus, the key to better
trading is to know when a major change is occurring and whether that partic-
ular trend has changed temporarily or permanently.
The China phenomenon
The first bull market of the 21st century has arguably been in industrial com-
modities, and much of it has been spurred by the demand for oil, steel, and
other raw materials from China as it has transitioned from a centrally run
economy to one that’s more market oriented.
From that transition, all variables with regard to the financial markets in the
early part of the century emerged, as money flows began to chase the seem-
ingly incessant growth story in China. To be sure, this story, as all stories do,
will change. And when that unwinding takes place, it will provide smart
traders the opportunity to make money by betting against China. As with
most bull markets or other economic phenomena, things don’t happen
overnight. These events take several years to set up, and they slowly emerge
until they become evident to the majority. After that they eventually collapse
because smart money traders who establish positions early on take their
profits and unload their high-priced assets onto the unsuspecting greater
fools who come late to the party and spend much more to attend.
The underlying cause of China’s miracle boom of the early 21st century
started in the late 1970s when President Richard Nixon made his historic
visit to Communist China. The pieces already were falling into place before
that historic event, but what ensued was a steady opening up of the Chinese
16
Part I: Understanding the Financial Markets
05_287224-ch01.qxp 5/27/08 10:55 PM Page 16
economy to foreign capital. Slowly, often in fits and starts, infused money led
to a domestic building boom and later to an export boom of Chinese goods.
The Fed’s massive lowering of interest rates after the events of September 11,
2001, fueled a more rapid rate of advance in the Chinese economy. Cheap
money and easy credit, meaning money borrowed at lower interest rates,
moved money to China where it attracted high rates of return based on that
country’s economic growth rates. When China joined the World Trade
Organization in the early 21st century, however, problems surfaced. A cor-
rupt and frail banking system was exposed, and massive environmental prob-
lems and significant social inequalities, especially between farmers and city
dwellers, became evident.
The Chinese economy at present seems headed for an inflationary spiral, a
situation that has the potential to rattle the global economy. This kind of
action will have a major impact on the futures markets, and you should be
very aware of it.
China’s economy is now a key to what happens in the world financial system.
Therefore, you need to know that the Chinese economy
Had large sums of money sunk into it by virtually every major bank, bro-
kerage firm, mutual funds that invest in international assets, and major
significant individual investor in the world. When the Chinese economy
eventually hits the skids, a major trading opportunity in bonds, curren-
cies, short-selling of commodities, and other trading vehicles will take
place.
Is a double-edged sword. Although the potential for growth exists, so
does the potential for losing lots of money fast.
Can be a major risk. Despite its size, it will remain a risk for many years
because of the Chinese government’s close involvement.
Will cause futures markets to play a significant role in global financial
developments because major players use these markets to hedge their
bets or to make large trades with less risk than directly owning Chinese
assets.
Europe: Hitting the skids
Unlike China, Europe is a region in decline. After decades of stable growth fol-
lowing World War II, Europe began to fade because large outlays of state
money were needed to keep a welfare system afloat, and that led to rising
budget deficits.
When the Berlin Wall fell in 1989, Germany, the engine of growth for the conti-
nent, started to feel the weight of extending its social safety net to East
Germany’s Russian-style economy. Outdated East German technology and a
17
Chapter 1: The Ins and Outs of Trading Futures
05_287224-ch01.qxp 5/27/08 10:55 PM Page 17
poorly trained, unmotivated workforce that was unfamiliar with capitalism
became an economic albatross around the country’s neck.
France suffered a similar fate as an influx of Middle Eastern and African
refugees moved there, in many cases putting increased strain upon that coun-
try’s social safety net.
The cumbersome socialist regulations of France and Germany, combined
with high taxes and a tendency for short workweeks and long vacations, com-
pleted the circle that led to the significant decline of the European economy.
Badly conceived political ploys by France at a time when the countries of
Europe were banding together in the European Union (EU), and again when it
expanded in 2004, put a strain on the unity of the entire continent. The war in
Iraq is another divisive stake that pits the more established EU states against
newer members. As the 21st century evolves, you’ll probably see Germany
and France moving away from each other ideologically in search of other
alliances. Right now, France leans toward China, while Germany leans toward
Russia. That could change at any moment.
Friction between the United States and Europe, especially France and
Germany (together or separately) will appear regularly. As a futures trader,
you can make money from this naturally strained relationship, especially in
the bond and currency markets where geopolitical situations tend to get
played out more aggressively than in stocks (although stocks are becoming
increasingly volatile).
Here’s the lay of the fractured land in Europe:
Germany is the economic engine of Europe, as is France to a variable
degree, depending on the political leanings of the government in power.
Germany and France are deeply in debt because of their socialist ten-
dencies, high tax rates, and lack of growth incentives in their economies.
Heavily unionized industries and the expense of subsidizing East
Germany after unification made Germany weaker during the latter part
of the 20th century.
France sees itself as the leader of a united Europe, but not all members
of the EU agree.
Divisions between the members of the EU offer futures traders opportu-
nities to trade currencies and international bonds.
The euro is a good antithesis to the dollar, because some governments
and political entities have mounted a campaign to make the euro the
world’s reserve currency, the traditional place of the U.S. Dollar. As with
any currency, when a trend is established, the euro tends to trend in one
direction for weeks to months at a time.
18
Part I: Understanding the Financial Markets
05_287224-ch01.qxp 5/27/08 10:55 PM Page 18

Interest rates don’t change direction in Europe as often as they do in the
United States. This is because the European Central Bank (ECB) uses
inflation targets as a guide, while the Fed uses multiple indicators, anec-
dotal evidence, and indicator data when dealing with interest rates.
The United Kingdom, although smaller than the European continent, still
is a major player because it’s an oil-producing nation, it has its own mili-
tary, and it has its own currency.
North America: Ignore it at your own risk
North America is comprised of the United States, Canada, and Mexico.
Together, they form NAFTA, or the North America Free Trade Agreement.
Three countries at different stages of development with vastly different ide-
ologies share a vast land rich with natural resources, industry, cross-border
commerce, and, in the United States, the world’s most powerful financial
institutions and most advanced military.
Those last two factors are most important to traders. Yes, it may sound crass,
but that’s the way traders think when they go to work. Everything is built
around whatever it takes to make money. And because of its financial and mil-
itary might, the United States still has the world’s number-one economy.
Sure, this assessment is fluid, and the terrorist attacks of September 11, 2001,
and the Iraq War have caused the United States to take a small step back in
its ability to compete in the transatlantic economy. However, ignoring the
United States, especially the Federal Reserve, the Pentagon, Congress, and
private power brokers — Wall Street brokers, insurance companies, and
hedge funds — is a recipe for disaster from a trader’s perspective. So here’s
what you need to know about the United States, Canada, and Mexico:
The U.S. dollar and the U.S. Treasury-bond market still are the most
liquid markets in the world. U.S. Treasury bonds still are considered the
flight-to-quality financial instruments in times of crisis.
Despite the setbacks of the Iraq War, the U.S. military still is the most
advanced in the world.
The combination of a strong military, a still sought-after currency, and a
liquid and highly respected bond market makes the United States the
center of the world’s financial system.
Although they belong to NAFTA, Mexico and Canada are not on par with
the United States; however, each plays a significant role in the region’s
financial stability. When the Mexican economy was in danger of default-
ing during the Clinton administration, the United States wisely bailed out
its trading partner.
19
Chapter 1: The Ins and Outs of Trading Futures
05_287224-ch01.qxp 5/27/08 10:55 PM Page 19

The United States has high budget deficits that it finances with foreign
money. Much of that money comes directly from foreign central banks
that buy dollars and treasury bonds.
The United States also
• May be in the early stages of a social security crisis
• Depends on foreign oil for most of its energy
• Has a political system that is steadily deteriorating into partisan
bitterness
As a futures trader, especially in the bond and currency markets, you must
consider these observations on a daily basis because they point to the kinds
of factors that big-money traders tick off in their heads as they focus on sup-
port and resistance levels while poring over their charts. This basic set of
assumptions about North America is what you need as you sit down in front
of your trading screen right before the employment report hits the wires.
(For more information about vital reports and their effects, see Chapter 6.)
Emerging markets: There’s more to keep
tabs on than you may expect
In the old days before the Internet, things were easier to keep straight. The
developed world traded for and used the commodities produced by the
developing world. But in the last few decades, globalization and advances in
communications have enabled trading to evolve into a platform for develop-
ing and developed countries to compete for the commodities each produces.
From a futures trader’s point of view, Brazil and India are the most important
emerging markets outside of China. Brazil is a major producer of natural
resources and a rapidly growing political power in South America, where the
populist capitalism of President Lula da Silva is behind aggressive attempts to
Curb the country’s foreign debt
Pursue foreign money from non-U.S. sources, such as China, the Middle
East, and India
These kinds of emerging and ever-changing dynamics are perfect examples of
what futures traders have to contend with.
India is on the verge of making the transition from a developing country to a
more developed one, although not on par yet with the United Kingdom or the
United States.
Although the distinctions are subtle, from a trading standpoint, you need to
keep them in mind because the bottom line is that serious money not only
20
Part I: Understanding the Financial Markets
05_287224-ch01.qxp 5/27/08 10:55 PM Page 20
filters into but it also emerges from places like India, Brazil, and other coun-
tries where governments and private enterprises increasingly buy raw mate-
rials from outside their borders.
India is probably the best example at this time. Although it’s a ravenous user
of petroleum, its economy is growing, especially its information technology
(IT) sector where many U.S. companies use Indian/English speakers to pro-
vide customer support services. Other energy-guzzling, IT-related businesses
in India include server farms, software development firms, and manufacturing.
Aside from being a producer of lumber and oil, Brazil has an active pharmaceu-
tical manufacturing industry that is a big user of energy and other resources.
When considering the big picture about the emerging markets, you need to
think globally. Here’s why:
Everyone has money now and can move it around with the push of a
mouse button.
Virtually all countries in the world, except for the poorest and most
politically isolated ones, now are involved on both ends of the produc-
tion/user equation.
Demand for commodities, although it may rise and fall much as it always
has, more than likely has been reset at a higher baseline, meaning that
more people are going to want more things. And that translates to higher
demand and a general upward pressure on prices.
Resetting demand, coupled with increasing supply tightness, creates the
potential for frequent squeezes in the market.
This new set of dynamics — which is very fluid, meaning that the whole pic-
ture can, and probably will, change often — will be the major influence in
futures trading for the next several decades to come.
Militant Islam
The events of 9/11 and the subsequent aftermath changed the world forever,
as it brought what was only known to the most niche-oriented players in the
various global intelligence agencies to the forefront of the menu for dinner
conversation.
Yes, there is a growing group of people in the world who are willing to
commit acts of violence in order to convert the world to their ideology.
From a trading standpoint, that is a variable that cannot be ignored. And
because of the geographical and political factors that are involved, the
energy, metals, commodities, and currency markets are the most likely mar-
kets to provide plenty of trading opportunities with regard to this factor.
21
Chapter 1: The Ins and Outs of Trading Futures
05_287224-ch01.qxp 5/27/08 10:55 PM Page 21

Relating Money Flows to
the Financial Markets
The more money that sloshes around the world, the better the chances that
futures, options, and financial markets in general will move aggressively. And
that means a more profitable trading atmosphere for those with know-how.
Money is only good as long as the people who are exchanging it for goods
and services have faith in the fact that it’s worth something. Money is a cre-
ation of the human mind that is extremely convenient, but it isn’t one of the
basic tenets of the universe.
Keep that in mind, and you can steadily develop the steely-eyed gaze of a
trader. If you buy into the widely held notion that the U.S. dollar or any other
currency is anything more than a vehicle for storing the value of something,
you’ll probably have trouble making decisions about what to do with it in the
futures market or life in general.
For most of the business cycle, demand is not always as important as the
supply side of the equation.
The higher the money supply, the easier it is to borrow, and the higher the
likelihood that commodity markets will rise. As more money chases fewer
goods, the chances of inflation rise, and the central banks begin to make it
more difficult to borrow money. If you keep good tabs on the rate of growth
of the money supply, you’ll probably be ahead of the curve on what future
trends in the markets are going to be.
To make big money in all financial markets, futures included, you have to find
out how to spot changes in the trend of how easy or difficult it is to borrow
money. The perfect time to enter positions is as near as possible to those
inflection points in the flow of money — when they appear on the charts as
changes in the direction of a long-standing trend.
These moves can come before or after any changes in money supply or
adjustments to borrowing power appear. However, when a market trends in
one direction (up or down) for a considerable amount of time and suddenly
changes direction after you notice a blip in the money supply data, you know
that something important is happening, and you need to pay close attention
to it.
22
Part I: Understanding the Financial Markets
05_287224-ch01.qxp 5/27/08 10:55 PM Page 22
Enjoying Your Trading Habit
I trade regularly, based on market conditions and my time commitments to
other activities. What I’ve discovered through years of trading is that few
times have I not enjoyed the process of analysis and decision making that it
involves. To me, trading is just about as good as it gets. Maybe it’s something
that’s programmed into my DNA, personality, or mojo that just keeps me
coming back.
As you progress through this and other books about trading futures and
options, you’ll discover whether your connection to the force (your karma)
is good for trading.
Just remember that when you’re ready to trade, you’re going to be excited.
That’s okay, because the thrill of the hunt is one of the reasons everyone
trades. However, you need to temper that excitement and hone it to your
advantage. If you can manage the exhilaration of trading and turn it into an
awareness of what is happening, you’re likely to be more successful.
Welcome to one of the final frontiers left on the planet earth.
If you start trading and you’re not enjoying it, you need to revise your trading
plan or find another way to put your investment capital to work.
23
Chapter 1: The Ins and Outs of Trading Futures
05_287224-ch01.qxp 5/27/08 10:55 PM Page 23

24
Part I: Understanding the Financial Markets
05_287224-ch01.qxp 5/27/08 10:55 PM Page 24

Chapter 2
Where Money Comes From
In This Chapter
Understanding where and how money does its work
Investigating the inner workings of central banks
Understanding money supply from a trading standpoint
Relating to money’s effect on the global financial system and futures markets
M
oney doesn’t grow on trees. But the truth isn’t far from that. In fact,
money is manufactured inside the world’s central banks, especially the
United States Federal Reserve System, essentially from thin air.
Okay, so there is some method to the madness. But the global monetary
system mostly seems like madness that is far from leading to any certain out-
comes, which, of course, is what makes trading a potentially profitable occu-
pation — as long as you know what to look for. The big picture is that central
banks are part think tank, part political and public relations offices, and
above all, lenders of last resort.
If you know how the system works and how to use it, you can turn it to your
advantage. In this chapter, I tell you how the Federal Reserve System in the
United States (also referred to as the Fed — the central bank of the United
States) and other central banks around the world have branch offices
throughout their respective countries, where economists directly monitor
economic activity. They do this by going out into the community and talking
to businesses, by designing and refining models, and by compiling reports
based on all the data collected.
I also let you in on what happens when the Fed and its branch chiefs meet a
few times every year to look at all this economic information so they can
make informed decisions about how much money to pump into the system
and how easy (or hard) they’re going to make it to borrow that money.
You can’t get into the inner workings of the Fed without knowing about the
interactions between money supply, interest rates, and inflation, so I also
include these topics and tie them together with the Federal Reserve, central
banks, and money and the markets in general.
06_287224-ch02.qxp 5/27/08 10:55 PM Page 25

When I talk about the Federal Reserve, unless I say otherwise, I also refer to
other central banks, because they all work in similar fashion. When there are
important differences in the way they go about their business, I let you know.
Discovering How Money
Works: The Fiat System
As a result of globalization, the world’s central banks are finding it difficult to
determine their own country’s monetary policy without keeping an eye on
what goes on in other countries. They watch how the financial markets
respond to the global economy.
The global monetary system is what’s called a fiat system, in which money is a
storage medium for purchasing power and a substitute for barter. Each dollar
bill, euro, yen, gold ingot, or whatever currency you choose enables you to
buy things as the need or want arises, thus making the barter system (trading
one service or product for another) mostly obsolete.
Before there was money, if you owned land you produced your own necessi-
ties and traded the surplus with other people for whatever else you needed.
Money changed that system by its inherent ability to store purchasing power,
thus giving people the opportunity to make plans for the future and to spe-
cialize. For example, if you’re a good wheat farmer, then you can specialize in
wheat, buying equipment, hiring workers, and looking for neighbors’ land to
buy to expand your wheat farm.
Markets and central banks value the relative worth of the paper (currency)
based on the perception of how a particular country is governing itself, the
current state of its economy, and the effects the interplay of those two fac-
tors have on interest rates.
Money’s money because we say it’s money
Most of the world’s money is called fiat money, meaning it is accepted as
money because a government says that it’s legal tender, and the public has
confidence in the money’s ability to serve as a storage medium for purchas-
ing power. A fiat system is based on a government’s mandate that the paper
currency it prints is legal tender for making financial transactions. Legal
tender means that the money is backed by the full faith and credit of the gov-
ernment that issues it. In other words, the government promises to be good
for it. I know how it sounds. But that’s what the world’s financial system is
based on.
26
Part I: Understanding the Financial Markets
06_287224-ch02.qxp 5/27/08 10:55 PM Page 26

Fiat money is the opposite of commodity money, which is money that’s based
on a valuable commodity, a method of valuation that was used in the past. At
times, the commodity itself actually was used as money. For instance, the use
of gold, grain, and even furs and other animal products as commodity money
preceded the current fiat system.
Where money comes from
Central banks create money either by printing it or by buying bonds in the
treasury market. When central banks buy bonds, they usually buy their own
country’s treasury bonds, and their purchases are made from banks that own
bonds. The money from the central banks goes to the bank vaults, and
becomes loan-making capital.
When the Fed wants to increase the money supply in the United States, it
buys bonds from banks in the open market. It uses a pretty simple formula to
calculate how much money it actually is creating.
Instead of using gold as the basis for the monetary system, as was the custom
until 1971, the Fed requires its member banks to keep certain specific amounts
of money on reserve as a means of keeping a lid on the uncontrolled expan-
sion of fiat money — in other words, to keep the money supply from explod-
ing. These reserve requirements are the major safeguard of the system.
When the economy slows down, the Fed attempts to jump-start it by lowering
interest rates. The Fed lowers interest rates by injecting money into the system
through the purchase of government bonds from the banking system. This is
the nuts and bolts of what happens when they lower the Fed Funds rate. The
monetary injection is sort of like a flu shot for an ailing economy. But instead
of a vaccine, the Fed injects money into the system by buying bonds from the
banks.
To keep the system from becoming inflationary, the Fed keeps a lid on how
much banks can actually lend by using a bank reserve management system.
The reserve management system, to be sure, is not an exact science, but over
the long haul, it tends to work as long as the public buys the validity of the
system, which, in the United States, it does.
Here’s how the reserve requirements work:
If the current formula calls for a 10 percent reserve ratio, it means that
for every dollar that a bank keeps in reserve, it can lend ten dollars to its
clients.
At the same time, if the Fed buys $500 million in bonds in the open
market, it creates $5 billion in new money that makes its way to the
public via bank loans.
27
Chapter 2: Where Money Comes From
06_287224-ch02.qxp 5/27/08 10:55 PM Page 27
The reverse, or opposite, is true when the Fed wants to tighten credit
and slow down the economy. It sells bonds to banks, thus draining
money from the system, again based on the reserve formula.
Fiat money is created (and gotten rid of) out of thin air, but the process isn’t
by hocus-pocus from some wizard’s wand. Its power comes from its use as
accurate storage for purchasing power that is based on
The public’s acceptance of the legal-tender mandate. See the earlier sec-
tion, “Money’s money because we say it’s money.”
The market’s expectations that a government’s promise to make its cur-
rency legal tender, by law, will hold.
Introducing Central Banks (Including
the Federal Reserve)
Central banks are designed to make sure that their respective domestic
economies run as smoothly as possible. In most countries, central banks are
expected at the very least to combat inflationary pressures.
The overarching goal of the central banks is to repeal (or keep in check) the
boom-and-bust cycles in the global economy. So far this goal is only an inten-
tion, because boom and bust cycles remain in place and are now referred to
as the business cycle.
One good impact has come from the actions of the Fed and other central
banks. They’ve been able to lengthen the amount of time between boom and
bust cycles to the extent that they’ve smoothed out volatile trends and cre-
ated an environment in which the futures markets offer a perfect vehicle for
hedging and speculation.
Prior to the advent of central banks, booms and busts in the global economy
came about as often as every harvest season. Because money was hard to come
by prior to the centralization of the global economies, a bad harvest, a spell
of bad weather, or just a bad set of investment decisions by a local bank in a
farming community could devastate the economy in an area or even a country.
The central bank of the United States
(and the world): The Federal Reserve
The Federal Reserve, otherwise known as the Fed, is the prototype central
bank because of its relative success, not because it was the first central bank.
Created in 1913 to stabilize the activities of the money and credit markets, it
28
Part I: Understanding the Financial Markets
06_287224-ch02.qxp 5/27/08 10:55 PM Page 28

administers the Federal Reserve Act, which mandated the creation of an
agency intent on “improving the supervision” of banking and “creating an
elastic currency.”
The current objectives of the Fed are to fight inflation and maintain full
employment to keep the consumption-based U.S. and global economies
moving.
29
Chapter 2: Where Money Comes From
Inside the central banks’ boom and bust cycle
Just because the world’s central banks have
somewhat smoothed out the boom and bust
cycle, the system is still nowhere near risk free.
And that means opportunity for you and me as
futures traders.
Sure, innovation is a good thing, as is tweaking
an old practice in order to make it available to
more people for less money. But, history shows
that every so-called “new” financial practice
eventually leads to excess, and outright cheat-
ing. The cheating eventually leads to the collapse
of the trend, and a liquidity crisis. When the even-
tual liquidity crisis comes along, the world’s cen-
tral banks are essentially forced to act in order
to keep the global economy from collapsing.
The difference between what has happened in
modern times and what happened in past
cycles is that the actions of the Federal
Reserve, despite significant criticism, have at
least kept the U.S. economy from reaching a
recession so deep that it could be called a
Depression. In the 20-year period from 1987 to
2007, the Federal Reserve has, depending on
your point of view, “corrected” or “bailed out”
Wall Street and the U.S. economy, in one way or
another, at least seven times by lowering inter-
est rates and providing loans as the lender of
last resort. Here’s a list of those occasions:
1987 — Junk bonds and the savings and loan
crisis led to the stock market crash of 1987.
1991 — The U.S. economy was in a recession
that worsened due to worries about the first
Gulf War.
1994 — The United States was in a run-of-the-
mill economic recession.
1997 to 1998 — The Asian currency crisis,
a phenomenon that started in Thailand,
spread throughout Asia and eventually led
to the Russian debt default and the bail-
out of the Long Term Capital Management
hedge fund in a deal brokered by then Fed
Chairman Alan Greenspan.
2000 — The dot.com boom imploded, an event
that led to the start of a bear market in the
U.S. Stock market, which lasted well into
2003.
2001 — The 9/11 attacks on the World Trade
Center accelerated an economic contrac-
tion in the United States that was already in
progress due to the dot.com implosion.
When the Twin Towers fell, money started
to move to foreign shores, a fact that was
accelerated by the aggressive lowering of
interest rates by the Federal Reserve.
2007 — The subprime mortgage crisis is the
latest example of the boom-bust cycle that
has not been eradicated, as central banks
would have you believe. In fact, this exam-
ple of the phenomenon followed the script
fairly well. Too many people made bets that
were too far beyond their ability to pay off.
And the result was the same as always, the
financial ruin of many at all levels of the
food chain.
06_287224-ch02.qxp 5/27/08 10:55 PM Page 29

Under Chairman Alan Greenspan (whose appointment as a member of the
Fed Board of Governors expired on January 31, 2006), the Federal Reserve
became the most important financial institution in the world. In reality, the
Fed is the central bank to the world, especially having grown in prestige and
deeds during Greenspan’s more than 18 years as chairman.
Greenspan’s successor, Ben Bernanke, was tested in his abilities to guide the
U.S. economy during the summer of 2007, as the subprime mortgage crisis
unfolded. Despite having a different management style than Greenspan,
Bernanke had no choice but to lower interest rates, which he did in August
and September of 2007 with moderate success, at least as of late September
2007.
The Fed had a tough act to follow in Greenspan. His 18-year tenure gave the
markets a time-tested pattern of action from a central bank that, prior to his
stewardship, had been less than stellar during several crucial periods.
How central banks function
The Fed has two official mandates: keeping inflation under control and main-
taining full employment. However, it has some leeway and in many ways has
outgrown its mandates, becoming lender of last resort and source- of money
in times of crises. In many speeches, especially after September 11, 2001,
Greenspan and other Fed governors made it clear that their perception of the
Fed’s duties included maintaining the stability of the financial system and
containing systemic risk.
Some central banks, such as the European Central Bank (ECB), use inflation-
ary targets to gauge their successes. Unlike the Fed (which didn’t set such
targets under Chairman Alan Greenspan, but may do so in the future), the
ECB must keep raising interest rates until the target is achieved, even if
unemployment is high in Europe, as long as inflation is above the central
bank’s target.
The positive side of inflation targeting is that it gives the market a sense of
direction with regard to what the central bank’s actions may be toward inter-
est rates. The negative side, as is evident in Europe, is that the use of infla-
tion targets often prevents the ECB from moving on interest rates. As a result,
the European economy has lagged in its ability to grow. In other words, the
dogma of adhering to the target set by the central bank has hurt the
European economy. In contrast, despite frequent criticism, the U.S. economy,
albeit in fits and starts, has continued to be the leading economy in the
world. Much of that is because of the relatively good management of interest
rates by the Fed.
The ECB’s mandate opens up opportunities for trading currency, interest rates,
and commodity futures, because after a central bank starts down a certain
30
Part I: Understanding the Financial Markets
06_287224-ch02.qxp 5/27/08 10:55 PM Page 30

policy route, it usually stays with it for months, creating an intermediate-term
trend on which to base the direction of trading.
For example, after September 11, 2001, the Fed lowered interest rates six
times, — starting on September 17, 2001 — and left them at 1 percent until
the summer of 2004, when it began to raise them until the summer of 2006.
The Fed had already lowered interest rates six times prior to the post 9/11
reductions. In September 2007, the Federal Reserve lowered the Discount
rate and the Fed Funds rate, in response to the subprime mortgage crisis.
Understanding Money Supply
Money supply is how much money is available in the economy to buy goods,
services, and securities. The Federal Reserve stopped emphasizing the role
of money supply on the economy in the year 2000, and stopped publishing
the M3 money supply figure in March 2006, because “M3 did not appear to
convey any additional information about economic activity that was not
already embodied in M2. Consequently, the Board judged that the costs of
collecting the data and publishing M3 outweigh the benefits,” according to a
summary of money supply on the New York Fed’s Web site. That leaves three
figures to get to know:
MO: The total of all physical currency plus the currency in accounts
held at the Federal Reserve that can be exchanged for physical currency.
M1: The M1 money supply is M0 minus those portions of MO held as
reserves or cash held in vaults plus the amounts in checking or current
accounts.
M2: The M2 money supply is M1 plus money housed in other types of
savings accounts, such as money market funds and certificates of
deposit (CDs) of less than $100,000.
Equating money supply and inflation
It would be easy to get into the esoteric aspects of money supply, but it
wouldn’t do a whole lot of good. So, the key is to understand the following
concept: At some point in the future, it may come to pass that global central
banks will have put so much money into circulation that money supply may
become as important an indicator as it was in decades past. If and when that
time comes, the inflation-sensitive markets, such as gold, energy, and grains,
are likely to become very active. When that happens, you need to be able to
trade them effectively. See the remember icon, directly ahead, for a more
specific summary.
31
Chapter 2: Where Money Comes From
06_287224-ch02.qxp 5/27/08 10:55 PM Page 31
I don’t like equations (and my guess is that you don’t either), but this one is
important. It’s called the monetary exchange equation, and it explains the rela-
tionship between money supply and inflation as:
Velocity
×
Money Supply = Gross Domestic Product (GDP)
×
GDP Deflator
Velocity is a measure of how fast money is changing hands, because it records
how many times per year the money actually is exchanged. GDP is the sum of
all the goods and services produced by the economy. The GDP deflator is a
measure of inflation, or a sustained rise in prices. Inflation is usually defined
as a monetary phenomenon in which prices rise because too much money is
in circulation, and that money’s chasing too few goods.
Here’s what’s important about the money supply as it applies to futures
trading:
Money supply is related to inflation because of the number of times it
actually changes hands (see the definition of velocity in thepreceding
paragraph).
More money in the system — chasing goods and services at a faster
rate — is inflationary.
A rising money supply tends to spur the economy and eventually fuels
demand for commodities.
A rising money supply usually is spawned by lower interest rates.
Whenever the money supply rises to a key level, which differs in every
cycle, eventually inflationary pressures begin to appear, and the Fed
starts reducing the money supply.
Deflation is when money supply shrinks because nobody wants to buy
anything. Deflation usually results from oversupply, or a glut of goods in
the marketplace. The key psychology of deflation is that in contrast to
inflation, consumers put off buying things, hoping that prices will fall far-
ther — as opposed to times of inflation when consumers are willing to
pay high prices in fear that they will rise farther.
Reflation is when central banks start pumping money into the economic
system, hoping that lower borrowing costs will spur demand for goods
and services, create jobs, and create a stronger economy.
The more money that’s available, the more likely it is that some of it will
make its way into the futures markets.
As a general rule, futures prices respond to inflation. Some tend to rise, such
as gold, and others tend to fall, such as the U.S. dollar (see Chapters 11 and
14). Each individual area of the futures market, though, is more responsive to
its own fundamentals and its own supply-and-demand equation at any given
32
Part I: Understanding the Financial Markets
06_287224-ch02.qxp 5/27/08 10:55 PM Page 32

time. With that noted, here is a quick-and-dirty guide to general money supply/
commodity tendencies:
Metals, agricultural products, oil, and livestock contracts generally tend
to rise along with money supply. This tendency is not a daily occurrence
but rather one that you can see over an extended period of time if you
compare graphs and charts of economic indicators with futures prices.
The overall trend is toward higher consumer prices, which have resulted
from higher commodity prices.
Bonds and other interest-rate products do the opposite. Generally, bond
prices fall, and interest rates or bond yields rise in response to inflation
(see Chapter 10).
Stock index futures are more variable in their relationship with the
money supply, but eventually, they tend to rise when interest rates —
either from the Fed or market rates in the bond and money markets —
are falling, and they tend to fall when interest rates reach a high enough
level. In other words, the relationship of money supply to the stock
market and stock index futures is indirect and has more to do with how
effectively the Fed and the bond market are bringing about the desired
effect on the economy, whether slowing it down or speeding it up.
However, during some periods, such as 1994 and most of 2005 when the
Fed raised interest rates, stocks and stock index futures stayed in a trad-
ing range.
Currencies tend to fall in value during times of inflation.
In a global economy, many of these dynamics occur simultaneously or in
close proximity to each other, which is why an understanding of the global
economy is more important when trading futures than when trading individ-
ual stocks.
Seeing how something from something
is something more
The wildest thing about money is how one dollar counts as two dollars when-
ever it goes around the loop enough times in an interesting little concept
known as the multiplier effect. For example, say the Fed buys $1 worth of
bonds from Bank X, and Bank X lends it to Person 1. Person 1 then buys
something from Person 2, who then deposits the dollar in Bank 2. Bank 2 then
lends the money to Person 3, who then deposits it in Bank 1, where the $1, in
terms of money supply, is now $2, because it has been counted twice.
By multiplying this little exercise by billions of transactions, you can arrive
at the massive money supply numbers in the United States, where, as of
late 2004, the M0 alone was $688 billion. As of March 7, 2008, M1 was $1.38
33
Chapter 2: Where Money Comes From
06_287224-ch02.qxp 5/27/08 10:55 PM Page 33
trillion, unchanged from March 2005 and M2 was $7.63 trillion, compared to
$6.41 trillion in March 2005. The growth in M2 was one of the reasons that
gold prices were rising during this period as inflation was heating up.
Getting a handle on money supply
from a trader’s point of view
Although you and I can use money supply data in many ways from an acade-
mic point of view, believe me, it won’t make you the life of the dinner party.
The key to making money by using money supply information is to have a
good grip on whether the Fed actually is putting money into the system or
taking it out. What’s even more important is how fast the Fed is doing what-
ever it’s doing at the time. In the old days, I used to keep strict money supply
data and plug it into a formula that I invented. It used to work fairly well. But
like other indicators that used to work, it became fairly irrelevant, and I
stopped using it.
Instead, I pay more attention to what the Fed says and does, and how the
market anticipates events and responds to the words and actions of the cen-
tral bank(s). In other words, the market, by its actions, factors in what it
thinks the money supply is doing, and what effects it will have on the econ-
omy and the way the world works. All you and I, as traders, have to do is to
pay attention and follow the overall trend of the market.
For example, if the Federal Reserve starts to lower interest rates, and the
market responds by rallying gold prices, lowering the dollar, and raising
long-term bond yields, the market is betting on inflation becoming a factor
at some point in the future.
I can follow those trends and trade those markets. That, in my view, is better
than using a formula that stopped working a few years ago.
Don’t get caught up in jargon or the opinions of talking heads in the media.
You can do quite well for yourself, just by paying attention to what’s going on
in the markets.
Recognize when the Fed is being cautious in its conduction of monetary
policy, say, by using ambiguous statements after its Federal Open Market
Committee meetings or in its members’ speeches to the public. You need to
be cautious in how you trade, but you also need to be monitoring the mar-
kets for their response. You don’t want to let a good set of opportunities pass
you by.
A perfect example is what happened in September 2007 and into 2008. The
Federal Reserve, and other global central banks, lowered interest rates and
offered discount rate loans to banks and financial institutions in response to
34
Part I: Understanding the Financial Markets
06_287224-ch02.qxp 5/27/08 10:55 PM Page 34

a liquidity crunch in the global credit markets, which had resulted from the
subprime mortgage crisis. The response of the markets to the Fed’s actions
was to deliver not only a rally in stocks, at least initially, but also a rally in
gold, along with a significant breakdown in the U.S. dollar and significant
volatility in the U.S. Treasury bond market. That combination of events sug-
gested that the market was concerned about inflation at some point in the
future.
Putting Fiat to Work for You
The average person may find the fiat concept difficult to grasp. But as a
futures trader, it is the center of your universe. If you can figure out which
way interest rates are headed and where money is flowing, most of what hap-
pens in the markets in general will fall into place, and you can make better
decisions about which way to trade. Keep these relationships in mind:
Futures markets often move based on the relationship between the bond
market and the Fed, which means that when either the Fed or the bond
market moves interest rates in one direction, the other eventually will
follow. See Chapters 6 and 10.
Higher interest rates tend to eventually slow economic growth, while
lower interest rates tend to spur economies.
Another excellent example of how the system works occurred after the
events of September 11, 2001. In response to the catastrophe, the Fed low-
ered key official interest rates, such as the Fed funds and discount rates, but
it also bought massive amounts of government treasuries, thus making much
more money available to the banking system.
Currency traders, who are not well known for their patriotism, sold dollars
and bought euros, yen, and other currencies, and effectively moved money
out of the United States.
Much of the money that the Fed injected into the system made its way to
China and ended up fueling the major economic boom in that country that
marked the post September 11, 2001, economic recovery. China used the infu-
sion of foreign money to finance a building boom that, in turn, led to increased
demand for oil and raw materials, such as copper, steel, and lumber. This
major change in the flow of money spread to all the major futures markets and
led to a bull market in commodities because China bought increasing amounts
of steel, copper, and the fuel needed to power the boom — oil.
When the Fed began to raise interest rates, it did so partially with the inten-
tion of cooling off the growth in China and diverting the flow of dollars away
from Beijing and back to the U.S.
35
Chapter 2: Where Money Comes From
06_287224-ch02.qxp 5/27/08 10:55 PM Page 35
Get in the habit of watching all the markets together. When the Fed starts
lowering interest rates, it is doing so because it wants the economy to grow
and jobs to be created. When the Fed starts to ease rates, as a trader, you
want to start looking at what happens to commodities like copper, gold, oil,
and so on. The commodities markets provide you with confirmation of what
the markets in general are starting to expect as the Fed makes its move.
Normally, you begin to see these markets come to life at some point before or
after the Fed makes a move. For example, if you see the copper market start-
ing to move, you want to check on what the bond and stock markets are
doing, because smart money starts pricing in expectations of a change in
trend by the Fed.
Bonding with the Fed: The Nuts
and Bolts of Interest Rates
If you want to make money in futures, you need to become intimately familiar
with what the Fed does and how it goes about it. Credit makes the world go
around. Credit enables everyone to have the things they want now and to pay
for them later. How much stuff you can buy depends on how easy the Fed
makes it for you to borrow the money. The Fed wants to create an environ-
ment that prompts consumers to buy as much stuff as they want without let-
ting them create inflation.
One way the Fed raises and lowers interest rates is by buying or selling U.S.
Treasury bonds in the open market. In past decades, the market had to guess
what the Fed was trying to do with interest rates where the bond market was
concerned. In the latter years of Alan Greenspan’s terms as Fed chairman, the
central bank became more open in its communications with the markets, but
a fair amount of Fedspeak, the often-difficult-to-decipher language from the
central bank, still was in use. In some cases, it was even conjecture.
Greenspan’s successor, Chairman Ben Bernanke, used a different formula in
2007, at least initially, in order to calm the credit markets during the sub-
prime mortgage crisis. Instead of initially lowering the Fed Funds rate,
Greenspan’s favorite weapon, Bernanke lowered the Discount Rate, the rate
of last resort used by banks that can’t get credit anywhere else and have to
borrow from the Fed. Because he didn’t want to flood the whole economy
with easy money, Bernanke targeted those financial institutions that were in
trouble and “destigmatized” the Discount window by making it known that
the Fed would not be penalizing those banks that used the credit facility. This
bought Bernanke some time, which he used to gather more data, before
finally lowering the Fed Funds rate a couple of weeks after lowering the
Discount rate.
36
Part I: Understanding the Financial Markets
06_287224-ch02.qxp 5/27/08 10:55 PM Page 36

No matter what you think of the Fed and central banks in general, they’re a
fact of life, and the better you can understand them and decipher some of the
things they say and do, the better you can trade and make other decisions
about your money. Finding out how central banks work is easier than trying
to decipher what they say and do. They buy and sell bonds and inject or
extract money from the banking system they control. When the Fed buys
bonds, it gives the markets and the economy money. When the Fed sells
bonds, it takes money out of the markets and the economy. Pretty simple,
right?
The amount of money that the Fed uses to buy bonds can signal which way
the Fed’s Board of Governors wants interest rates to go. This relationship is
pretty simple any more, because the Fed rarely goes into the bond market —
other than for routine maintenance of the money supply — without making a
statement. The New York Fed conducts routine maintenance. An example is
when the Fed adds more reserves than usual during holiday periods, such as
Christmas, to make sure banks have enough money on hand to handle the
shopping season. In the new year, the Fed drains the extra reserves from the
system. The Fed usually doesn’t mean this maneuver as a major economic
action.
The Bernanke Fed, following the tradition started by the Greenspan Fed, will
usually announce its “target rate” for the Fed Funds rate. This is the rate that
banks charge each other for overnight loans, and is the primary interest rate
that the Federal Reserve manipulates to set the overall trend for all other
rates. When the Fed makes significant changes in monetary policy, the cen-
tral bank clearly announces it has made a move, and why it has made it.
Central Banks
Central banks have convinced the world’s corporations and population that
money and its wonderful extension, credit, are the centerpieces of the
world’s economic system. And the easier it is to borrow money, the more
things get done and the bigger things get built.
When central banks buy bonds from banks and dealers, they’re putting
money into circulation, making it easy for people and businesses to borrow.
At the juncture where money becomes easier to borrow, the potential for
commodity markets to become explosive reaches its zenith.
Commodity markets thrive on money, and their actions are directly related to
Interest rates
Underlying supply
37
Chapter 2: Where Money Comes From
06_287224-ch02.qxp 5/27/08 10:55 PM Page 37

The perceptions and actions of the public, governments, and traders, as
they react to
• Supply: How much is available and how fast it’s going to be used up
• Demand: How long this period of rising demand is likely to last
Demand is not as important for most of the business cycle as the supply side
of the equation.
The higher the money supply, the easier it is to borrow, and the higher the
likelihood that commodity markets will rise. As more money chases fewer
goods, the chances of inflation rise, and the central banks begin to make it
more difficult to borrow money.
If you keep good tabs on the rate of growth of the money supply, you’ll proba-
bly be ahead of the curve on what future trends in the markets are going to be.
To make big money in all financial markets, you have to find out how to spot
changes in the trend of how easy or difficult it is to borrow money. The per-
fect time to enter positions is as near as possible to those inflection points in
the flow of money — when they appear on the charts as changes in the direc-
tion of a long-standing trend.
These moves can come before or after any changes in money supply or
adjustments to borrowing power appear. However, when a market trends in
one direction (up or down) for a considerable amount of time and suddenly
changes direction after you notice a blip in the money supply data, you know
that something important is happening, and you need to pay close attention
to it.
38
Part I: Understanding the Financial Markets
06_287224-ch02.qxp 5/27/08 10:55 PM Page 38

Chapter 3
The Futures Markets
In This Chapter
Making the futures markets go ’round: Hedgers and speculators
Keeping risk manageable
Playing by the rules: Six criteria futures contracts must meet
Exploring exchanges and the ways and means of trading
Getting a grasp on margins
A
futures contract is a security, similar conceptually to a stock or a bond,
yet significantly different. When you buy a stock, you’re buying part of a
company, while a bond makes you a lender to a government or a corporation.
Whereas a stock gives you equity and a bond makes you a debt holder, a
futures contract is a legally binding contract that sets the conditions for the
delivery of commodities or financial instruments at a specific time period in
the future.
Futures markets emerged and developed in fits and starts several hundred
years ago as a mechanism through which merchants traded goods and ser-
vices in the present based on their expectations for crops and harvest yields
in the future. Today, futures markets are the hub of capitalism, because they
provide the base for prices at wholesale and eventually retail markets for
commodities ranging from gasoline and lumber to key items in the food
chain, such as cattle, pork, corn, and soybeans.
Futures contracts are available for a variety of financial products and com-
modities. There are contracts for trading just about anything, starting with
familiar securities such as stock index futures, interest rate products like
bonds and treasury bills, to lesser known commodities like propane and
ethanol. Some futures contracts are even designed to hedge against weather
risk and to trade electricity. The latest introduction, as of late 2007, is that of
real estate market contracts.
Now virtually all financial and commodity markets are linked, with futures
and cash markets functioning as a single entity on a daily basis. Thus, as a
successful trader, you need to understand the basics of all major markets —
bonds, stocks, currencies, and commodities — and their relationships to
each other and the economic cycle.
07_287224-ch03.qxp 5/27/08 10:55 PM Page 39

In this chapter, you gain an understanding of who the major players are, how
the futures markets evolved to their prominent role in the global economy,
and what basic rules and regulations keep the markets as fair and reasonable
as possible.
Taking Big Risks and Guarding Against
Them: Two Types of Traders
The futures markets serve two major constituencies: hedgers and specula-
tors. Although these two groups have differing interests, the participation of
both is necessary for the markets to function.
Hedgers, in general, are major companies that actually produce the commodi-
ties, or others (like farmers) who have an inherent interest in the market.
Hedgers may employ professional traders to use futures contracts on com-
modities and related products to decrease the company’s risk of loss. Their
goal is not to profit from futures trading, but rather to cover their risk of
losses and keep company operations moving forward.
Speculators, the second constituency (including you and me), trade futures
contracts with the goal of making money from market trends and special situ-
ations. In other words, the speculator’s job is to see where the big money is
going and follow it there, regardless of whether prices are going up or down.
So although hedgers may actually take delivery of or receive products speci-
fied in a futures contract, speculators are trying to ride the price trend of
those products as long as possible, while always intending to cash in before
the delivery date.
Hedging bets to minimize risk
Farmers, producers, importers, and exporters are hedgers, because they
trade not only in futures contracts but also in the commodity, equity, or prod-
uct represented by the contract. They trade futures to secure the future price
of the commodity of which they will take delivery and then sell later in the
cash market.
People who buy commodities, or holders, are said to be long, because they’re
looking to buy at the lowest possible price and sell at the highest possible
price. Short sellers sell commodities in the hope that prices will fall. If they’re
40
Part I: Understanding the Financial Markets
07_287224-ch03.qxp 5/27/08 10:55 PM Page 40

correct, they offset, or close, the position at a lower price than when they
sold it. (For more on the long and short of trading, see “Talking the talk,” later
in this chapter.)
Futures contracts are attractive to longs and shorts, because they provide
price and time certainty, and they reduce the risk associated with volatility,
or the speed at which prices change up or down. At the same time, hedging
can help lock in an acceptable price margin, or difference between the futures
price and the cash price for the commodity, and improve the risk between
the cost of the raw material and the retail cost of the final product by cover-
ing for any market-related losses. Note: Hedge positions don’t always work,
and in some cases, they make losses worse.
Exxon Mobil is a good example of a hedger in the oil markets, because the
company must gauge the potential risk of weather, politics, and other exter-
nal factors on future oil production. Warm winter weather, for example,
reduces the demand for heating oil and therefore puts downward pressure on
the price of oil. Exxon wants to protect itself from such a risk.
Another good current example of a hedger is an airline in the post-September
11, 2001, world, and its fuel costs. Aside from labor, airplane fuel is by far the
most expensive component of an airline’s costs. A good airline also has
expertise in the oil market.
Say that Duarte Air (I know, I know, it’s self-serving promotion) is projecting a
need for large amounts of jet fuel for the summer season, based on the trends
in travel during the past decade. As the airline’s CEO, I know that demand for
gasoline tends to rise in the summer; thus, prices for the jet fuel I need are
also likely to rise because of refinery usage issues — refineries switch a
major portion of their summer production to gasoline.
In order to hedge its costs for crude oil in the summer, Duarte Air starts
buying July crude oil and gasoline futures a few months ahead of time,
hoping that as the prices rise, the profits from the trades can offset the costs
of the expected rise in jet fuel. Say, for instance, that Duarte Air bought July
crude futures at $50 per barrel in December, and by June they were trading at
$60 per barrel. As the prices continued to rise, Duarte would start unloading
the contracts, pocketing the $10-per-barrel profit and using it to offset the
higher costs of its fuel in the spot market (during the summer travel season).
On the other hand, if Duarte’s hedging was wrong and the price of oil went
down, the airline could always use options to hedge the futures contracts, or
go short, by selling futures contracts high and making money by buying them
back at lower prices if there was a sudden price drop.
41
Chapter 3: The Futures Markets
07_287224-ch03.qxp 5/27/08 10:55 PM Page 41

Speculating that there’s a profit to be had
Speculators, in contrast to hedgers, are betting on the price change potential
for one reason only — profit. Speculators do the opposite of hedgers; they
look to increase risk and increase the chances of making money.
A hedger tries to take the speculator’s money and vice versa. So a normal
futures transaction is likely to include a member of each of these subgroups.
A speculator is likely to be buying a contract from a hedger at a low price,
while the hedger is expecting the price to decline farther, which is why he’s
selling the contract.
Think of this dance in terms of risk. Hedgers are transferring the risk of price
variability to others in exchange for the cost of the hedge. Speculators
assume price variability risk, thus making the transfer possible in exchange
for the potential to gain. A hedger and a speculator can both be very happy
from the outcome of price variability in the same market.
This interaction between speculators and hedgers is what makes the futures
markets efficient. This efficiency and the accuracy of the supply-and-demand
equation (see the later “Talking the talk” section) increase as the underlying
contract gets closer to expiration and more information about what the mar-
ketplace requires at the time of delivery becomes available.
42
Part I: Understanding the Financial Markets
Considering the effects of a crash
The stock market crash of 1987 had one positive
result. It ushered in the era of the one market.
After that fateful day, October 19, 1987, anyone
who’d ever invested in any market understood
that all markets are linked, regardless of the
underlying securities traded on them, and that
money can and does flow at the speed of light
from one type of market to another. In fact, the
futures markets, according to Mark Powers, in
his book
Starting out in Futures Trading
(McGraw-Hill), are like “convenient laborato-
ries” for conducting market analysis.
After the 1987 crash, the Brady Commission
coined and defined the concept that all markets
were linked, because the action in one or more
of them had an influence on one or several
others. But the commission did little to dissuade
the media’s and the public’s perception that
the futures markets were not to blame for the
crash — something the Federal Reserve con-
cluded in its post-crash study released in 1988.
Another positive of the post-crash environment
was the implementation of
circuit breakers, or
intraday limits on trading that slow or stop trad-
ing in specific products when the markets for
those products are moving too fast. The Board
of Governors of the Federal Reserve System
(the Fed), the Securities and Exchange
Commission (SEC), and the various exchanges
(see the section “Seeing Where the Magic
Happens,” later in this chapter, for a list of
exchanges) also developed better techniques
for monitoring position sizes and overall market
liquidity after the crash.
07_287224-ch03.qxp 5/27/08 10:55 PM Page 42
Limiting Risk Exposure: Contract
and Trading Rules
By design, futures contracts are meant to limit the amount of time and risk
exposure experienced by speculators and hedgers, those traders who use
them. As a result, futures contracts have several key characteristics that
enable traders to trade them effectively. I list and briefly describe these char-
acteristics in the sections that follow and use these explanations to expand
on how the contracts work throughout the book.
Checking the expiration date
All futures contracts are time based; they expire, which means that at some
point in the future they will no longer exist. From a trading standpoint, the
expiration of a contract forces you to make one of the following decisions:
Sell the contract and roll it over by buying the contract for the next front
month (the futures contract month nearest to expiration) or another
that’s farther into the future.
Offset the contract (taking your profits or losses) and just stay out of the
market.
Take delivery of the underlying commodity, equity, or product repre-
sented by the contract.
Chilling out: Daily price limits
Because of the volatility of futures contracts and the potential for cata-
strophic losses, limits are placed on futures contracts that freeze prices but
do not freeze trading. Limits are meant to let markets cool down during peri-
ods of extremely active trading.
When the limit rules are triggered, the market can trade at the limit price but
not beyond it. Some contracts have variable limits, which means that the limits
are changed if the market closes at the limit. For example, if the cattle markets
close at the limit for two straight days, the limit is raised on the third day.
Sizing up your account
Most brokers require individuals to deposit a certain amount of money in a
brokerage account before they can start trading. A fairly constant figure in
the industry is $5,000.
43
Chapter 3: The Futures Markets
07_287224-ch03.qxp 5/27/08 10:55 PM Page 43

For most people, depositing only $5,000 with the brokerage firm probably is
not enough to provide them with a good trading experience. Some experi-
enced traders will tell you that $100,000 is a better figure to have on hand,
and $10,000 to $30,000 is probably the least amount you can actually work
with comfortably. These are not hard and fast rules, though. The bottom line
is that to be a successful trader, you should know yourself and your risk tol-
erance, get a good handle on your trading plan, let your winners ride, and cut
your losses short.
Staying Up to Snuff: Criteria
for Futures Contracts
Futures contracts are nothing like credit-card transactions. Buying something
and promising to pay for it later, the way you do when you go shopping with
a credit card, doesn’t make a futures contract. True futures contracts must
meet the following six criteria, which have developed since the inception of
the futures markets:
Trading must be conducted on an organized exchange. This exchange
is a physical place, where trading actually takes place either by open-cry
trading in a trading pit, which is what you see on television when you
turn on the business channels, or by electronic means, which is an
increasing phenomenon, especially in Europe, where trading already is
done nearly 100 percent electronically, as opposed to the U.S. where
both electronic and open-cry trading take place.
Common rules govern all transactions. The two most important ones
are as follows:
• Trading occurs in one designated place, the ring or pit of the
exchange, by open outcry or electronically, during specific trading
hours, with every participant having equal access to the bids and
offers and the flow of trading.
• No exchange member can offer to fill or match an order without
first offering it to the crowd. A member is a firm or an individual
who buys a seat on the exchange, or the privilege to trade directly
for his own account and to be an intermediary for other traders.
When a floor broker fills an order, he is fulfilling your request from
his own inventory of futures contracts. When a floor broker
matches an order, he is fulfilling your request by finding a buyer or
seller in the trading crowd and matching the buyer with the seller.
44
Part I: Understanding the Financial Markets
07_287224-ch03.qxp 5/27/08 10:55 PM Page 44

Contract sizes, delivery dates, mode of delivery, and procedure are
standardized. That means that there is consistency as each contract of
each individual commodity is equal to the other contracts in its class,
and the important dates of each contract year are easy to follow.
Traders negotiate only the original transaction with each other.
Beyond the original agreement, the exchange becomes a clearinghouse,
and the obligation of the parties to a futures contract transaction is with
the exchange.
Futures contracts are canceled, or closed out, by offset. When a
trader sells a contract to deliver a specific amount of a marketable prod-
uct for December delivery, he has an obligation to deliver that product
to the exchange by December. If he buys a contract for the same amount
of that product before December, then he has met his obligation; he
has offset the original sale with an equivalent buy and is out of the
market.
The exchange clearinghouse acts as a guarantor, or guardian, for each
transaction. It accomplishes this by requiring its members to have mini-
mum amounts of working capital and enough funds to meet their out-
standing debts. Exchange members who are not clearinghouse members
must associate with exchange members, who are to guarantee and verify
all contracts.
Seeing Where the Magic Happens
Several active futures and options exchanges are open for business in the
United States. Each has its own niche, but some overlaps occur in the types
of contracts that are traded. In this section, I cover the basics of three of the
more frequently used Chicago exchanges, along with a handful of exchanges
based in other cities.
The names of the exchanges are as follows:
Chicago Board Options Exchange (www.cboe.com): The premier
options exchange market in the world, the CBOE specializes in trading
options on individual stocks, stock index futures, interest rate futures,
and a broad array of specialized products such as exchange-traded
mutual funds. The CBOE is not a futures exchange but is included here
to be complete, because futures and options can be traded simultane-
ously, as part of a single strategy. I discuss this throughout the book
where applicable, but go into in a bit more detail in Chapter 4.
45
Chapter 3: The Futures Markets
07_287224-ch03.qxp 5/27/08 10:55 PM Page 45

Chicago Board of Trade (www.cbot.com): Trades are made in futures
contracts for the agriculturals, interest rates, Dow Indexes, and metals.
Specific contracts traded on the CBOT include
• Agricultural futures: Corn, the soybean complex, wheat, ethanol,
oats, rough rice, and mini contracts in corn, soybeans, and wheat
• Interest rate–related futures: Treasury bonds, spreads, Fed funds,
municipal bonds, swaps, and German debt
• Dow Jones Industrial Average: Dow Jones Industrial mini contracts
• Metals futures: Gold and silver and e-mini contracts for gold and
silver
Chicago Mercantile Exchange (www.cme.com): The CME is the largest
futures exchange in North America. CME Group merged with the CBOT,
forming a formidable contender in the exchange industry. The merged
entity, a publicly traded company, operates both exchanges and trades
on the New York Stock Exchange under the ticker symbol CME. The two
exchanges, although they are one company, have two separate trading
floors, and between the two distinct areas offer the opportunity to trade
a wide variety of instruments, including commodities, stock index
futures, foreign currencies, interest rates, TRAKRS, and environmental
futures. Among the contracts traded on the CME are
• Commodities: Live cattle, milk, lean hogs, feeder cattle, butter,
pork bellies, lumber, the Goldman Sachs Commodities Index (and
associated futures contracts), and fertilizer
• Stock index futures: S&P 500, S&P 500 Midcap, S&P Small Cap 600,
NASDAQ Composite, NASDAQ 100, Russell 2000, and the corre-
sponding e-mini contracts for all the major indexes traded
• Other important stock-related contracts: Single stock futures,
futures on exchange-traded funds (ETFs), and futures on Japan’s
Nikkei 225 index
• Options: Options on the futures contracts that are listed by
the CME
Kansas City Board of Trade (KCBT, www.kcbt.com): The KCBT is a
regional exchange that specializes in wheat futures and offers trading
on stock index futures for the Value Line Index, a broad listing of 1,700
stocks.
Minneapolis Grain Exchange (MGEX, www.mgex.com): MGEX is a
regional exchange that trades three kinds of seasonally different wheat
futures, and offers futures and options on the National Corn Index and
the National Soybeans Index.
46
Part I: Understanding the Financial Markets
07_287224-ch03.qxp 5/27/08 10:55 PM Page 46
New York Board of Trade (NYBOT, www.nybot.com): A major interna-
tional exchange, the NYBOT offers a broad array of products, including
• Commodities: Sugar, cocoa, cotton, frozen orange juice, ethanol
and pulp, and the Reuters/Jefferies CRB Index
• Currencies: U.S. dollar index and a wide variety of foreign currency
pairs and cross rates
• Stock index futures: Russell Equity Indexes and NYSE Composite
Index
New York Mercantile Exchange (NYMEX, www.nymex.com): The
NYMEX is the hub for energy trading in
• Energy futures: Light sweet crude, natural gas, unleaded gasoline,
heating oil, electricity, propane, and coal
• Metals: Gold, silver, platinum, copper, palladium, and aluminum
Futures contracts for the Goldman Sachs Commodity Index and options on
the futures contracts that the CME lists also are traded on the CME.
E-mini contracts are smaller-value versions of the larger contracts. They trade
for a fraction of the price of the full value instrument and thus are more suit-
able for small accounts. The attractive feature of e-mini contracts is that you
can participate in the market’s movements for lesser investment amounts. Be
sure to check commissions and other prerequisites before you trade, though.
Exploring How Trading
Actually Takes Place
Around the world, most futures exchanges have converted from open-cry to
electronic trading. The United States, however, still uses the open-cry system
of futures trading, where traders on a trading floor or in a trading pit shout
and use hand signals to make transactions or trades with each other. Futures
contracts are traded in a clear, albeit nonlinear, order.
When you call your broker, he relays a message to the trading floor, where a
runner relays the message to the floor broker, who then executes the trade.
The runner then relays the trade confirmation back to your broker, who tells
you how it went. The order is just about the same when you trade futures
online, except that you receive a trade confirmation via an e-mail or other
online communiqué.
47
Chapter 3: The Futures Markets
07_287224-ch03.qxp 5/27/08 10:55 PM Page 47

Trade reporters on the floor of the exchange watch for executed trades,
record them, and then transmit these transactions to the exchange, which,
in turn, transmits the price to the entire world almost simultaneously.
Shifting sands: Twenty-four-hour trading
In the United States, physical commodities, such as agriculturals and oil, are
still traded primarily by an open-cry system; however, most futures markets
in the world also offer electronic models of trading because they provide
A more level playing field
More price transparency
Lower transaction costs
Globex, the electronic data and trading system founded in 1992, extends futures
trading beyond the pits and into an electronic overnight session. Globex is
active 23 hours per day, and contracts are traded on it for Eurodollars, S&P
500, NASDAQ-100, foreign exchange rates, and the CME e-mini futures. You
can also trade options and spreads on Globex.
When you turn to the financial news on CNBC before the stock market opens,
you see quotes for the S&P 500 futures and others taken from Globex as
traders from around the world make electronic trades. Globex quotes are
real, meaning that if you keep a position open overnight and you place a sell
stop under it, or you place a buy order with instructions to execute in
Globex, you may wake up the next morning with a new position, or out of a
position altogether.
Globex trading overnight tends to be thinner than trading during regular
market hours (usually from 8:30 a.m. to 4:15 p.m. eastern time), and it tends
to be more volatile in some ways than trading during regular hours.
You can monitor Globex stock index futures, Eurodollars, and currency
trades on a delayed basis overnight free of charge at www.cme.com/
trading/dta/del/globex.html
.
Here are a few good questions to ask your futures broker about trading via
Globex:
Does the brokerage firm that you’re using provide access to Globex? If
so, what kind of an interface, front-end system, or link to Globex does it
supply? You want to know whether the system is compatible with
Globex and how smoothly it works.
Are the commissions for Globex trading different than the commissions
charged for using the firm’s regular trade routing?
48
Part I: Understanding the Financial Markets
07_287224-ch03.qxp 5/27/08 10:55 PM Page 48

Are there any other rule or requirement changes, such as limits on the
number of contracts that you can trade, margin requirements, or other
particulars?
You may want to put in an order by phone. Does the firm offer customer
support in after-hours trading?
Talking the talk
If you’re going to trade futures, you have to know trader talk. Knowing sev-
eral key terms helps you get the job done and helps you understand what
reporters and advisors are talking about.
Some key terms that refer to your expectations of the market include
Going long: Being bullish, or positive on the market, and wanting to buy
something. When I say I’m long oil, in the context of futures trading, it
means that I own oil futures.
Being short: Being bearish, or negative on the market in which you are
trading. Your goal is to make money when the price of the futures con-
tract that you choose to short falls in price. If you deal in the stock
market, you know that you have to borrow stocks before you can sell
them short. In the futures market, you don’t have to borrow anything;
you just post the appropriate margin and instruct your broker that
you’re interested in selling short.
I know this can be confusing, so it is best looked upon from the point of
view of reversing, or offsetting, your position. To illustrate the point,
consider an example in a vacuum. If you sell a crude oil contract short at
$59 and the price drops to $54, you have a $5 profit. At that point, if you
decide that you’ve made enough of a profit, you then offset the position
by buying back the contract to cover your short sale. In other words,
what you’re selling short is the contract, and by offsetting the position,
you are now finishing the trade.
Locals: The people in the trading pits. They’re usually among the first to
react to news and other events that affect the markets.
Front month: The futures contract month nearest to expiration. This time
frame may not always feature the most widely quoted futures contract. As
one contract expires, the next contract in line becomes the front month.
Orders: Instructions that lead to the completion of a trade. They can be
placed in a variety of ways, including
• A stop-loss order, which means that you want to limit your losses at
or above a certain price.
A stop-loss order becomes a market order (see next entry) to buy
or sell at the prevailing market price after the market touches the
49
Chapter 3: The Futures Markets
07_287224-ch03.qxp 5/27/08 10:55 PM Page 49

stop price, the price at which you’ve instructed the broker to sell.
A buy stop is placed above the market. A sell stop is placed below
the market. Stop orders can also be used to initiate a long or short
position, not just close (offset) an open position.
• A market order, which means you’ll take the prevailing price that
the market has to offer. (It has nothing to do with trying to get
fresh fish.)
• A trailing stop, is an order to sell placed a certain number of ticks
below the price of your contract if you’re long, and a certain
number of ticks above your contract if you’re short. The purpose
of a trailing stop is to lock in profits. Here’s how it works. Say you
buy one S&P 500 futures contract at 1000 and you want to limit
your loss to five points. You would place your stop at 995. If the
contract moves up to 1005, you then change your trailing stop to
1000.75, to give yourself some breathing room. If the contract
moves up another two points, then raise your stop to 1002.75, and
so on. When the market turns and your stop is hit, you’re out of
the market automatically.
Hedging: A trading technique that’s used to manage risk. It may mean
that you’re setting up a trade that can go either way, and you want to be
prepared for whichever way the market breaks. In the context of large
producers of commodities, hedging means putting strategies in place in
case the market does the opposite of what is expected, such as a major
and sudden rise in oil prices caused by a hurricane.
The following terms can help you understand hedging:
• Putting on a hedge means that you’re setting up a trading situation
that enables you to cover all the bases for whichever way the
market decides to go. Hedgers often account for 20 to 40 percent of
all the open, or active, futures contracts in a particular market.
They’re usually companies or large entities that are protecting
their investments against the risk of price fluctuation in the future
by buying or shorting futures contracts.
• A cross hedge isn’t fancy shrubbery; it’s the act of using a different
contract to manage the risk of another contract in which you’re
primarily interested. For example, an oil company may use gaso-
line contracts to hedge the risk of their crude oil contracts.
The pit: This isn’t Hell, although if you’re on the wrong end of the trade,
it can feel like it. The pit is where all futures contracts are traded during
a regular-hours trading session in the futures markets.
Speculators: Traders (usually, but not always, small- to medium-sized)
who are trying to make money only from the fluctuation of prices with-
out intending to take delivery of the contract. Hedge funds are also
speculators.
50
Part I: Understanding the Financial Markets
07_287224-ch03.qxp 5/27/08 10:55 PM Page 50
Floor brokers: Agents who receive a commission to buy and sell futures
contracts for their clients. These clients generally are futures commis-
sion merchants. A floor broker may also trade for his own account,
under certain restrictions. Floor traders rarely make agent trades. They
use their exchange membership to buy and sell futures for their own
accounts, taking advantage of very low commissions and immediate
access to market information. Floor brokers, by exchange rules, cannot
place their own orders ahead of yours. Your broker can trade for him-
self, but he cannot put his order in ahead of yours.
Bid: The price at which you want to buy something.
Offer: The price at which you are willing to sell something.
Taking delivery: Taking the product on which you were speculating.
Supply and demand equation: Trader talk referring to whether there
are more buyers than sellers. When there are more sellers than buyers,
the equation tilts toward supply, and vice versa.
Expiration: This isn’t a reference to death or breathing out. Expiration
with regard to a contract means that the contract is no longer trading.
Delivery: What futures contracts are all about — someone actually
delivering or handing something to someone else in exchange for
money.
Making the Most of Margins
Margins are what make futures trading so attractive, because they add lever-
age to futures contract trades. The downside is that if you don’t understand
how trading on margin works, you can take on some big losses in a hurry.
Trading on margin enables you to leverage your trading position. By that I
mean that you can control a larger number of assets with a smaller amount of
money. Margins in the futures market generally are low; they tend to be near
the 10 percent range. Thus, you can control, or trade, $100,000 worth of com-
modities or financial indexes with only $10,000 or so in your account.
Trading on margin in the stock market is a different concept than trading on
margin in the futures market.
In the stock market, the Federal Reserve sets the allowable margin at 50 per-
cent. So, in order to trade stocks on margin, you must put up 50 percent of
the value of the trade. Futures margins are set by the futures exchanges and
are different for each different futures contract. Margins in the futures market
can be raised or lowered by the exchanges, depending on current market
conditions and the volatility of the underlying contract.
51
Chapter 3: The Futures Markets
07_287224-ch03.qxp 5/27/08 10:55 PM Page 51
Generally, when you deposit a margin on a stock purchase, you buy partial
equity of the stock position and owe the balance as debt. In the futures
market, a margin acts as a security deposit that protects the exchange from
default by the customer or the brokerage house.
When you trade futures on margin, in most cases you buy the right to partici-
pate in the price changes of the contract. Your margin is a sign of good faith,
or a sign that you’re willing to meet your contractual obligations with regard
to the trade.
In the futures market, your daily trading activity is marked to market, which
means that your net gain or net loss from changes in price of the outstanding
futures contracts open in your account is calculated and applied to your
account each day at the end of the trading day. Your gains are available for
use the following day for additional trading or withdrawal from your account.
Your net losses are removed from your account, reducing the amount you
have to trade with or that you can withdraw from your account.
You can reduce the risk of buying futures on margin by
Trading contracts that are lower in volatility.
Using advanced trading techniques such as spreads, or positions in
which you simultaneously buy and sell contracts in two different com-
modities or the same commodity for two different months, to reduce the
risk. An example of an intramarket spread is buying March crude oil and
selling April crude. An example of an intermarket spread is buying crude
oil and selling gasoline.
For more detailed information about margins, turn to Chapter 4.
52
Part I: Understanding the Financial Markets
07_287224-ch03.qxp 5/27/08 10:55 PM Page 52

Chapter 4
Some Basic Concepts About
Options on Futures
In This Chapter
Getting the lowdown on types of options and traders
Speaking option-ese (both English and Greek)
Factoring in volatility
Checking out other resources
W
hy would a book on trading futures have a chapter on options? The
answer is actually fairly simple. Options on futures are quite an impor-
tant part of the market, and it’s important for you to be exposed to the very
basics of the options market as they relate to futures. This chapter is by no
means a complete treatise, but rather a broad overview of the major aspects
of options on futures. You can get a whole lot more by reading Trading Options
for Dummies by George Fontanills (Wiley).
Still, trading options, even options on futures, doesn’t have to be confusing
if you take the time to discover the specific nuances of the market. In fact,
when used properly, options give you an opportunity to diversify your hold-
ings beyond traditional investments and to hedge your portfolio against risk.
To be sure, investors are increasingly interested and active in the options
markets. And while many of the general concepts are the same, some impor-
tant differences exist between the options of individual stocks and those of a
futures contract.
In this chapter, I cover the very basics of options on futures. This, though, is
a highly complex topic which requires extensive space. My goal here is to
expose you only to the rudimentary concepts so that you can have a base for
further reading. At the end of the chapter, I provide some important sources
where you can get more details.
08_287224-ch04.qxp 5/27/08 10:56 PM Page 53

Getting Options on Futures Straight
A futures contract is a standardized contract that calls for the delivery of a
specific commodity at some time in the future. Thus, unlike options on stocks,
in which you take delivery of a lot consisting of at least 100 (and possibly
more) shares of stock, an option on a futures contract gives you the opportu-
nity to buy or sell the futures contract, not the underlying commodity. So
when you exercise or assign your option on a futures contract, you receive
the contract, not the cash value of the index, the soybeans, or the gold.
Options on futures
Are always for one contract of the underlying commodity.
Require that you understand the underlying futures contract, be it for
gold, soybeans, oil, or whatever, before you begin trading.
Trade in the same price units as the underlying futures contract, in most
cases. That means that a one-point move in a stock index futures con-
tract is a one-point move in the corresponding option. T-bond futures
and options are an exception. The former trade in 32nds, while the latter
trade in 64ths.
Don’t move on their own in price; rather, they move along with the
underlying futures contract.
Can have quirky expiration dates. For example, March soybean options
actually expire in February. What expires in March is the March soybeans
contract, which is why the options are referred to as “March options.” The
best thing to do is to look very carefully at a well-documented futures and
options expirations calendar. You can get one from your broker, or see the
December issue of Futures magazine for good calendars.
Offer round turn commission in many cases. This means that you only
pay the broker when you exit your position, instead of paying to both
enter and exit, as with stock options. Check with your individual broker
for his practices.
SPANning your margin
Margin in futures and options on futures is different than margin on stocks.
While margin in the context of stocks is a loan from your broker so you can
buy stock worth more money than you have, margin in the former two is just
the amount of money that you have to have in your account to trade futures
and futures on options. Also, in terms of futures and options on futures, margin
is a performance bond that earns interest if it’s held in the form of Treasury
bills, as SPAN margin allows. (Keep reading for a definition of SPAN margin.)
54
Part I: Understanding the Financial Markets
08_287224-ch04.qxp 5/27/08 10:56 PM Page 54

Moreover, margin becomes important in options on futures if you want to
implement more sophisticated strategies, such as writing spreads. Spreads
are sophisticated techniques used by traders to make money in sideways
markets. The value of the spread is derived from the difference in two or more
assets. Spread trading is really beyond this chapter, but it’s an important
aspect of options trading that you may want to look at as you gain experience.
SPAN stands for Standard Portfolio ANalysis of risk, a practice used in the
exchanges where options on futures trade (the Chicago Board of Trade and
the Chicago Mercantile Exchange) in order to determine the entire risk of a
portfolio, including all futures and options held within it. SPAN is based on a
sophisticated algorithm and is designed to help you make the best use of
your trading capital.
The algorithm is designed to calculate the worst possible one-day move in all
your positions. Then it automatically shifts the excess margin from any posi-
tion(s) to new positions or those that don’t have enough. Here are some gen-
eral details on margin for options on futures strategies:
Initial margin is just the amount needed to open the position. Margin
requirements fluctuate on a daily basis.
A good rule of thumb for options writers is to have a 2-to-1 ratio of
margin to net premium collected.
T-bill margins are valued at less than the actual value of the T-bills. For
example, a T-bill with a $25,000 value gets a margin value between
$23,750 and $22,500, depending on the clearinghouse. Still, the interest
earned on such a T-bill may be good enough to offset some of your
transaction costs, another good thing about SPAN. For more details on
SPAN and options on futures, visit www.optionsnerd.com.
Types of options
Two types of options are traded. One kind lets you speculate on prices of
the underlying asset rising, and the other lets you bet on their fall. Options
usually trade at a fraction of the price of the underlying asset, making them
attractive to investors with small accounts.
Calls
I think of a call option as a bet that the underlying asset is going to rise in
value. The more formal definition is that a call option gives you the right to
buy a defined amount of the underlying asset at a certain price before a cer-
tain amount of time expires. You’re buying that opportunity when you buy
the call option. If you don’t buy the asset by the time the option expires, you
lose only the money that you spent on the call option. You can always sell
55
Chapter 4: Some Basic Concepts About Options on Futures
08_287224-ch04.qxp 5/27/08 10:56 PM Page 55

your option prior to expiration to avoid exercising it, to avoid further loss, or
to profit if it has risen in value. Call options usually rise in price when the
underlying asset rises in price.
When you buy a call option, you put up the option premium for the right to
exercise an option to buy the underlying asset before the call option expires.
Buying the call option gives you the right to exercise it. When you exercise a
call, you’re buying the underlying stock or asset at the strike price, the prede-
termined price at which an option will be delivered when it is exercised.
Puts
Put options are bets that the price of the underlying asset is going to fall. Puts
are excellent trading instruments when you’re trying to guard against losses
in stock, futures contracts, or commodities that you already own.
Buying a put option gives you the right to sell a specific quantity of the
underlying asset at a predetermined price, the strike price, during a certain
amount of time. When you exercise a put option, you are exercising your
right to sell the underlying asset at the strike price. Like calls, if you don’t
exercise a put option, your risk is limited to the option premium, or the price
you paid for it.
Puts are sometimes thought of as portfolio insurance because they give you
the option of selling a falling stock at a predetermined strike price.
Types of option traders
Option buyers are also known as holders, and option sellers are known as
writers.
Call option holders have the right to buy a stipulated quantity of the underly-
ing asset specified in the contract. Put option holders have the right to sell a
specified amount of the underlying asset in the contract. Call and put holders
can exercise those rights at the strike price.
Call option writers have the potential obligation to sell. Put option buyers
have the potential obligation to buy.
Breaking down the language barrier
You need to know several terms to be able to trade options. Most of this stuff
is fairly simple after you get the hang of it. But if you’re like me, it isn’t much
56
Part I: Understanding the Financial Markets
08_287224-ch04.qxp 5/27/08 10:56 PM Page 56

fun when you start. Still, if you’re going to trade options, you must dig in and
get a grasp on the lingo, including these terms:
Premium: This is the price that you pay for the option. For options that
you don’t exercise, this is the maximum risk.
Expiration date: This is the date on which your option expires. After
this date, your option is worthless.
Strike price: This is the predetermined price at which the underlying
asset is bought or sold.
In the money: A call option is said to be in the money whenever the
strike price is less than the market price of the underlying security. A
put option is in the money whenever the strike price is greater than the
market price of the underlying security.
At the money: Options are considered at the money when the strike
price and the market price are the same.
Out of the money: Calls are out of the money when the strike price is
greater than the market price of the underlying security. Puts are out of
the money if the strike price is less than the market price of the underly-
ing security.
Grappling with Greek
Options require you to pick up a bit of the Greek language. You only need to
know four words, but they’re all important. The Greeks, as they are com-
monly called, are measurements of risk that explain several variables that
influence option prices. They are delta, gamma, theta, and vega.
John Summa, who operates a Web site called OptionsNerd.com (www.options
nerd.com
), summarizes the four terms nicely in an article he wrote for
Investopedia.com. You can find it at www.investopedia.com/articles/
optioninvestor/02/120602.asp
.
But before actually getting into the Greek, you need to know the factors that
influence the change in the price of an option. After that, I tell you how it all
fits into the mix with the Greek terminology.
The three major price influences are
Amount of volatility: An increase in volatility usually is positive for put
and call options, if you’re long in the option. If you’re the writer of the
option, an increase in volatility is negative.
57
Chapter 4: Some Basic Concepts About Options on Futures
08_287224-ch04.qxp 5/27/08 10:56 PM Page 57

Changes in the time to expiration: The closer you get to the time of
expiration, the more negative the time factor becomes for a holder of
the option, and the less your potential for profit. Time value shrinks as
an option approaches expiration and is zero upon expiration of the
option.
Changes in the price of the underlying asset: An increase in the price of
the underlying asset usually is a positive influence on the price of a call
option. A decrease in the price of the underlying instrument usually is
positive for put options and vice versa.
Interest rates, a fourth influence, are less important most of the time. In gen-
eral, higher interest rates make call options more expensive and put options
less expensive. Now that you know the major and minor influences on price, I
can describe the Greeks.
Delta
Delta measures the effect of a change in the price of the underlying asset on
the option’s premium. Delta is best understood as the amount of change in
the price of an option for every one-point move in the underlying asset or the
percentage of the change in price of the underlying asset that is reflected in
the price of an option.
Delta values range from –100 to 0 for put options and from 0 to 100 for calls,
or –1 to 0 and 0 to 1 if you use the more commonly used expression in decimals.
Puts have a negative delta number because of their inverse or negative rela-
tionship to the underlying asset. Put premiums, or prices, fall when the
underlying asset rises in price, and they rise when the underlying asset falls.
Call options have a positive relationship to the underlying asset and thus a
positive delta number. As the price of the underlying asset goes up, so do call
premiums, unless other variables are changed, such as implied volatility, time
to expiration, and interest rates. Call premiums generally go down as the
price of the underlying asset falls, as long as no other influences are putting
undue pressure on the option.
An at-the-money call has a delta value of 0.5 or 50, which tells you that the
option’s premium will rise or fall by half a point with a one-point move in the
underlying asset. Say, for example, that an at-the-money call option for wheat
has a delta of 0.5. If the wheat futures contract associated with the option
goes up ten cents, the premium on the option will rise by approximately five
cents (0.5
×
10 = 5). The actual gain will be $250 because each cent in the pre-
mium is worth $50 in the contract.
58
Part I: Understanding the Financial Markets
08_287224-ch04.qxp 5/27/08 10:56 PM Page 58
The farther into the money the option premium advances, the closer the rela-
tionship between the price of the underlying asset and the price of the option
becomes. When delta approaches 1 for calls, or –1 for puts, the price of the
option and the underlying asset move the same, assuming all the other vari-
ables remain under control.
Key factors about delta to remember are that delta
Is about 0.5 when an option is at the money and moves toward 1.0 as the
option moves deeper into the money.
Tends to increase as you get closer to the expiration date for near or at-
the-money options.
Is not a constant because the effect of gamma is a measure of the rate of
change of delta in relation to the underlying asset.
Is affected by changes in implied volatility. (See the section
“Understanding Volatility: The Las Vega Syndrome,” later in this chapter,
for a full discussion of implied volatility.)
Gamma
Gamma measures the rate of change of delta in relation to the change in the
price of the underlying asset. It enables you to predict how much you’re
going to make or lose based on the movement of the underlying position.
The best way to understand this concept is to look at an example like the one
in Figure 4-1, which shows the changes in delta and gamma as the underlying
asset changes in price. The example features a short position in the S&P 500
September $930 call option as it rises in price from $925 on the left to $934 on
the right and is based on John Summa’s explanation of the Greeks. The chart
was prepared by using OptionVue 5 Options Analytical Software, which is
available from www.optionvue.com.
P/L
Delta
Gamma
Theta
Vega
425
–48.36
–0.80
45.01
–96.30
300
–49.16
–0.80
45.11
–96.49
175
–49.96
–0.80
45.20
–96.65
50
–50.76
–0.80
45.28
–96.78
–75
–51.55
–0.79
45.35
–96.87
–200
–52.34
–0.79
45.40
–96.94
–325
–53.13
–0.79
45.44
–96.98
–475
–53.92
–0.79
45.47
–96.99
–600
–54.70
–0.78
45.48
–96.96
–750
–55.49
–0.78
45.48
–96.91
Figure 4-1:
Summary
of risk
measures
for the short
December
S&P 500 930
call option.
59
Chapter 4: Some Basic Concepts About Options on Futures
08_287224-ch04.qxp 5/27/08 10:56 PM Page 59

The farther out of the money that a call option declines, the smaller the delta,
because changes in the underlying asset cause only small changes in the
option premium. The delta gets larger as the call option advances closer to
the money, which is a result of an increase in the underlying asset’s price. In
this case, the more out-of-the-money the option is, the better it gets for the
short seller of the option.
Line 1 of Figure 4-1 is a calculation of the profit or loss for the S&P 500 Index
futures 930 call option — $930 is the strike price of the S&P 500 Index futures
option that expires in September (as featured in Figure 4-3). The –200 line is
the at-the-money strike of the 930 call option, and each column represents a
one-point change in the underlying asset.
The at-the-money gamma of the underlying asset for the 930 option is –0.79,
and the delta is –52.34. What this tells you is that for every one-point move in
the depicted futures contract, delta will increase by exactly 0.79.
The position depicts a short call position that is losing money. The P/L line is
measuring Profit/Loss. The more negative the P/L numbers become, the more
in the red the position is. Note also that delta is increasingly negative as the
price of the option rises.
Finally, with delta being at –52.34, the position is expected to lose 0.5234
points in price with the next one-point rise in the underlying futures contract.
If you move one column to the right in Figure 4-3, you see the delta changes
to –53.13, which is an increase of 0.79 from –52.34.
Other important aspects of gamma are that it
Is smallest for deep out-of-the-money and in-the-money options.
Is highest when the option gets near the money.
Is positive for long options and negative for short options.
Theta
Theta is not often used by traders, but it is important because it measures
the effect of time on options. More specifically, theta measures the rate of
decline of the time premium (the effect on the option’s price of the time
remaining until option expiration). Understanding premium erosion due to
the passage of time is critical to being successful at trading options. Often the
effects of theta will offset the effects of delta, resulting in the trader being
right about the direction of the move and still losing money.
As time passes and option expiration grows near, the value of the time pre-
mium decreases, and the amount of decrease grows faster as option expira-
tion nears.
60
Part I: Understanding the Financial Markets
08_287224-ch04.qxp 5/27/08 10:56 PM Page 60
The following minitable shows the theta values for the featured example of
the short S&P 500 Index futures 930 call option.
=
T + 0
T +6 T + 13
T+ 19
Theta
45.4 51.85
93.3
The concept of how theta affects the price of an option can best be summa-
rized by looking in the fourth column of the table, where the figure for T + 19
measures theta six days before the option’s expiration. The value 93.3 tells
you that the option is losing $93.30 per day, a major increase in time-influ-
enced loss of value compared with the figure for T + 0, where the option’s
loss of value attributed to time alone was only $45.40 per day.
Theta rises sharply during the last few weeks of trading and can do a consid-
erable amount of damage to a long holder’s position, which is made worse
when the option’s implied volatility is falling at the same time.
Understanding Volatility:
The Las Vega Syndrome
Vega measures risk exposure to changes in implied volatility and tells traders
how much an option’s price will rise or fall as the volatility of the option
varies.
Vega is expressed as a value and can be found in the fifth row of Figure 4-1,
where the example cited in the figure shows that the short call option has a
negative vega value — which tells you that the position will gain in price if
the implied volatility falls. The value of vega tells you how much the position
will gain in this case. For example, if the at-the-money value for vega is –96.94,
you know that for each percentage-point drop in implied volatility, a short
call position will gain $96.94.
Volatility is a measure of how fast and how much prices of the underlying
asset move and is key to understanding why option prices fluctuate and act
the way they do. In fact, volatility is the most important concept in options
trading, but it also can be difficult to grasp unless taken in small bites.
Fortunately, trading software programs provide a great deal of the informa-
tion needed to keep track of volatility. Nevertheless, you need to keep in
mind these two kinds of volatility:
61
Chapter 4: Some Basic Concepts About Options on Futures
08_287224-ch04.qxp 5/27/08 10:56 PM Page 61
Implied volatility (IV), which is the estimated volatility of a security’s
price in real time, or as the option trades. Values for IV come from for-
mulas that measure the options market’s expectations, offering a predic-
tion of the volatility of the underlying asset over the life of the option. It
usually rises when the markets are in downtrends and falls when the
markets are in uptrends. Mark Powers, in Starting Out In Futures Trading
(McGraw-Hill), describes IV as an “up-to-date reading of how current
market participants view what is likely to happen.”
Historical volatility (HV), which also is known as statistical volatility
(SV), is a measurement of the movement of the price of a financial asset
over time. It is calculated by figuring out the average deviation from the
average price of the asset in the given time period. Standard deviation is
the most common way to calculate historical volatility. HV measures
how fast prices of the underlying asset have been changing. It is stated
as a percentage and summarizes the recent movements in price.
HV is always changing and has to be calculated on a daily basis. Because it
can be very erratic, traders smooth out the numbers by using a moving aver-
age of the daily numbers. Moving averages are explained in detail in Chapter
7, which is about technical analysis. In general, though, the bigger the HV, the
more an option is worth. HV is used to calculate the probability of a price
movement occurring.
Whereas HV measures the rate of movement in the price of the underlying
asset, IV measures the price movement of the option itself.
Most of the time, IV is computed using a formula based on something called
the Black-Scholes model, which was introduced in 1973 (see the next sec-
tion). The goal of the Black-Scholes model, which is highly theoretical for
actual trading, is to calculate a fair market value of an option by incorporat-
ing multiple variables such as historical volatility, time premium, and strike
price. I’ll let you in on a little secret here: The Black-Scholes formula alone
isn’t very practical as a trading tool because trading software automatically
calculates the necessary measurements; however, the number it produces, IV,
is central to options trading.
HV and IV are often different numbers. That may sound simple, but there’s
more to it than meets the eye.
In a perfect world, HV and IV should be fairly close together, given the fact
that they’re supposed to be measures of two financial assets that are intrinsi-
cally related to one another, the underlying asset and its option. In fact,
sometimes IV and HV actually are very close together. Yet the differences in
these numbers at different stages of the market cycle can provide excellent
trading opportunities. This concept is called options mispricing, and if you
can understand how to use it, options mispricing can help you make better
trading decisions.
62
Part I: Understanding the Financial Markets
08_287224-ch04.qxp 5/27/08 10:56 PM Page 62

When HV and IV are far apart, the price of the option is not reflecting the
actual volatility of the underlying asset. For example, if IV rises dramatically
and HV is very low, the underlying stock may be a possible candidate for a
takeover. Under those circumstances, the stock probably has been stuck in a
trading range as the market awaits news. At the same time, option premiums
may remain high because of the potential for sudden changes with regard to
the deal.
The bottom line is that HV and IV are useful tools in trading options. Most
software programs will graph out these two variables. When they are
charted, big spreads become easy to spot, and that enables you to look for
trading opportunities.
Options screening software helps you cut through the clutter. For more
sophisticated analysis than the bare-bones type provided by free software,
you have to spend some money.
Many good options-trading programs are available. Among the most popular
programs is OptionVue 5 Options Analysis Software. This program has been
around since 1982, and it has just about everything anyone could want to
analyze options and find trades. Many traders use OptionsVue and consider
it the benchmark program.
Most programs on the market are good enough to generate decent data. You
want to find the one that’s easiest for you to use and in the right price range.
Technical Analysis of Stocks & Commodities magazine, www.traders.com,
has excellent software reviews, and it conducts an annual readers’ poll to
determine which programs its readers think are the best. This magazine/Web
site is a good place to do your homework.
Some Practical Stuff
In the preceding sections, I tell you about the nuts and bolts of options. In
this section, I give you a brief summary of some, but certainly not all, situa-
tions in which you might want to use options.
There are two basic reasons to choose options as a trading vehicle. One is
that you have limited amounts of money and want to trade. And the other is
that you are looking to combine leverage while limiting your risk. The second
choice is the most sensible of the two, as it takes a lot of talent to turn a little
money into a large amount by using options, although it can be done if you’re
clever and talented. But if you could do that, you wouldn’t likely be reading
this book.
63
Chapter 4: Some Basic Concepts About Options on Futures
08_287224-ch04.qxp 5/27/08 10:56 PM Page 63
The simplest options strategy is buying call options, as the upside
potential is theoretically limitless, while the downside risk is your option
premium. This is usually the first strategy that beginners use when they
enter this sector and is best used when you are expecting the underlying
asset to rally.
A second use of call options is option writing. In this case, you are look-
ing to protect a long position by selling a call option to someone and col-
lecting the premium. This works better in markets that are falling or
moving sideways. In this case you’re hoping that the underlying market
goes mostly nowhere and that the option expires worthless, while you
pocket the premium.
Put option strategies are generally useful in falling markets, but tend to
be more risky than call related strategies.
Other, more complex strategies, such as straddles, strangles, and
spreads, involve two or more options, sometimes involve more than one
asset class, such as stock index options being paired with bond options,
and are beyond the scope of this chapter. See the section at the end of
the chapter titled “Useful information sources.”
General rules of success
Become familiar with the underlying futures contract before you trade the
options, and look at the two instruments simultaneously.
The following example, adapted from an article written by John Summa
(optionsnerd.com), covers the S&P 500 stock index futures and related
options. (If you’re going to trade soybean options, become familiar with the
rules and vagaries of the soybean sector, and so on.)
Figure 4-2 summarizes the facts about the S&P 500 futures contract. Figure 4-3
shows you the settlement prices for three S&P 500 futures prices as they set-
tled on June 12, 2002, and Figure 4-4 shows the closing prices of correspond-
ing options on the same day.
Futures
Contract
S&P 500
Type of
Settlement
Cash
Contract Value
$250 × price of S&P
500
Tick Size
.10 (a “dime”)=
$25
Delivery Months
March, June, Sept.,
and Dec.
Last Trading Day
Thursday prior to the third Friday
of the contract month
Figure 4-2:
S&P 500
futures
contract
specifi-
cations.
64
Part I: Understanding the Financial Markets
08_287224-ch04.qxp 5/27/08 10:56 PM Page 64
Here’s what’s important: The June S&P futures contract in Figure 4-3 settled
at 1020.20 on June 12. The contract gained 6.00 points, which is equivalent to
a gain of $1,500 per single contract (6
×
$250 = $1,500).
Looking at the options, note in Figure 4-4 that because the price of the con-
tract rose, the price of the call options rose, and the price of the puts fell.
Note also that the delta is positive for calls and negative for puts, and that
the higher the delta value, the more the price of the underlying futures
affects the option’s price change. The reverse applies to the put options, as
the figure shows.
If you understand these rules, you can then apply them to your option strate-
gies, which are of three basic types: buying puts or calls, selling (writing)
puts or calls, or setting up more sophisticated strategies, such as spreads,
strangles, and straddles.
Strike
June Puts
1000*
Settlement
7.50
Point Change
–2.40
$ Change
Delta
975
3.40
–1.70
950
1.60
–1.20
925
.85
–.90
–$600
–$425
–$300
–$255
–.30
–.15
–.07
–.04
June Calls
1025*
11.90
+
1.70
+
$425
.40
1050
3.60
+
1.70
+
$125
.20
1075
.95
+
1.70
+
$50
.06
1100
.35
+
1.70
+
$12.50
.02
(*Near-the-money options)
Figure 4-4:
S&P 500
options
prices at
settlement
on June 12,
2002.
Contract
June ‘02
Sept. ‘02
Dec. ‘02
High
1022.80
1023.80
1025.00
Low
1002.50
1003.50
1007.00
Settlement
1020.20
1021.20
1023.00
Point Change
+6.00
+6.00
+6.00
Figure 4-3:
S&P 500
futures
contract
settlement
prices June
12, 2002.
65
Chapter 4: Some Basic Concepts About Options on Futures
08_287224-ch04.qxp 5/27/08 10:56 PM Page 65

The following tips are the best advice I can give you when it comes to
options, or any kind of investment or trading in the futures markets:
Work out the kinks of your strategies on paper before you proceed.
Avail yourself of the best possible software and quote system possible
for whatever you’re trading.
If you’re well prepared and you have good equipment and data, your chances
of success will be much higher.
Useful information sources
Finally, here are some other places to get more details about options:
High-Powered Investing All-in-One For Dummies (Wiley). Check out Book III,
focusing on futures and options, by yours truly.
Trading Options For Dummies by George A. Fontanills (Wiley).
Options as a Strategic Investment by Lawrence G. McMillan (New York
Institute of Finance)
Options Made Easy, 2nd Edition, by Guy Cohen (Financial Times Trading
and Investing)
The CBOE Web site (www.cboe.com)
66
Part I: Understanding the Financial Markets
08_287224-ch04.qxp 5/27/08 10:56 PM Page 66

Chapter 5
Trading Futures Through
the Side Door
In This Chapter
Getting the lowdown on exchange-traded funds (ETFs)
Trading stock indexes with ETFs
Speculating on commodities like energy and metals
Seeing the value in currency ETFs
Gaining insight from real-life examples
W
ith exchange-traded funds (ETFs), the world of the futures markets
has opened to traders whose fears of the unknown previously limited
their prospects. When you understand ETFs and how to make them work suc-
cessfully, you can trade just about anything.
This chapter helps you get your feet wet in futures trading through ETFs,
which means you can trade without worrying about margin and when to roll
over a contract.
Using the information and techniques in this chapter, you can participate in
the general trends of the futures markets, including the agricultural, energy,
bond, currency, and stock index futures contracts, with less threatening
instruments. In other words, ETFs are instruments that let you take advan-
tage of the overall profit potential of the futures markets without having to
open a separate account for your trades.
Here are some of the things that I like best about ETFs:
I can trade the trend, up or down, without having to research individual
stocks. Thus, I can participate in what’s happening as I make more
detailed decisions about further trades.
I can trade them through my online account with a click of my mouse,
just as if I am buying individual stocks.
09_287224-ch05.qxp 5/27/08 10:57 PM Page 67
I can trade anything from stock indexes to commodities, bonds, oil, nat-
ural gas, currencies, or very specific sectors in the stock market.
The basic trading techniques are also applicable to the more familiar
futures markets, such as bonds, commodities, oil, and natural gas. In
other words, when conditions are right to buy an oil ETF, they are also
right for buying oil futures. So after you master the techniques required
to trade these ETFs, you can use them as a basis to trade futures
directly.
Just remember, this chapter is not meant to give you a false sense of security.
ETFs that use futures and commodities as their underlying assets tend to
follow the same basic trends of those markets. Thus, the same risks and
potential for volatility apply.
For a comprehensive listing of ETFs, visit the American Stock Exchange’s
Web site, www.amex.com. A great place to find commodity ETF information is
the Deutsche Bank Web site for commodity ETFs, www.dbfunds.db.com/
index.aspx
. Also see Exchange-Traded Funds For Dummies by Russell Wild
(Wiley) for lots of good pearls on ETFs.
Introducing Exchange-Traded Funds
ETFs are mutual funds that trade like stocks. These clever and useful
instruments
Trade during the entire trading day and during extended market
hours. This property lets you trade these vehicles when and where you
want to. They’re even suitable for day trading. Mutual funds, on the
other hand, can usually be bought at the end of the day and can’t be
sold until the close of the market on the next day.
Have specific qualities. For example, the Powershares Nasdaq 100 ETF
(QQQQ) can be bought or sold for 15 minutes after the stock market
closes. These ETFs resume trading after a brief period of time in the
after-hours session.
Behave similarly to the index, commodity, or portfolio that they’re
patterned after. For example, the U.S. Oil Fund (USO) has a similar trad-
ing pattern and follows the same general price trend as crude oil.
Offer both the opportunity to go long or go short the market, without
having to sell shares of stock or of an ETF short, although you can sell
68
Part I: Understanding the Financial Markets
09_287224-ch05.qxp 5/27/08 10:57 PM Page 68
shares of any individual ETF short. See next bullet. For example, you
can go long the Nasdaq 100 index by owning the QQQQ ETF. To short the
Nasdaq 100, you can just buy shares of the Ultrashort QQQ Proshares
(QID) or a similar fund. See “Stocking Up on Stock Index Future ETFs,”
later in this chapter.
Can be individually sold short. If you prefer to sell short directly, you
can sell any ETF short as you would any stock by borrowing shares from
your broker in a margin account. Although that’s possible, I recommend
shorting the market by buying an ETF that sells short rather than short-
ing an ETF that goes long.
Offer options trading similar to stocks and futures. You can trade ETF
options as you would trade stock options. In some ways, long-term
options (LEAPS) are well suited for ETFs. LEAPS let you bet on the long-
term price of an underlying instrument, such as a stock. See Trading
Options For Dummies by George A. Fontanills (Wiley) for full details on
LEAPS and other options.
However, not all ETFs are created equal. Reading the fine print about how an
ETF goes about its business is important. The Macroshare Funds for trading
crude oil are an example. These funds use derivative formulas based on the
bond market to mimic the action in the oil market. See “Comfort via
Commodity ETFs,” later in this chapter for more details.
Margin in the stock market is different than margin in the futures markets.
The margin rules for the stock market are the margin rules that govern ETFs.
See Chapters 3 and 4 to review margin rules.
The management fee extracted by the ETF sponsor company affects the price
of the ETF and its overall performance. In other words, your ETF isn’t likely
to match its underlying index or its stated performance goals perfectly. Also
keep in mind that ETFs pay dividends, and this may have some tax conse-
quences, as well as affecting the price of the fund. Read the prospectus and
consult your financial advisor if necessary before you invest in any ETF.
Read the fine print on the prospectus or the online description of all ETFs.
For example, Amex.com notes the following in its description of “The Short
S&P 500 Proshares (SH)” investment objective: “The Fund employs leveraged
investment techniques to achieve its investment objective, which may
expose the Fund to potentially dramatic changes (losses) in the value of its
portfolio holdings and imperfect correlation to the index underlying the
Fund’s benchmark.” See “Stocking Up on Stock Index Future ETFs” in the next
section for more details.
69
Chapter 5: Trading Futures Through the Side Door
09_287224-ch05.qxp 5/27/08 10:57 PM Page 69

Stocking Up on Stock Index Future ETFs
You can trade just about every single stock index by using an exchange-
traded fund. But for the sake of simplicity, I concentrate on the big ones
because a big part of your success here depends on liquidity and ease of
trading as well as your own recognition of what you’re trading. The indexes
in the following sections all have corresponding futures contracts. After you
get the hang of working with these, you can expand your horizons.
Futures are meant to be traded both short and long, so I list any short-selling
funds that are available for any particular futures market in this section. If no
fund is listed, it’s because no ETF that specialized in short selling that partic-
ular market or index was available at the time. Also, due to space limitations,
I limit my discussion to the most liquid ETFs.
In the following sections, I discuss the most liquid and actively traded major
stock indexes and their corresponding futures contracts.
The S&P 500 (SPX)
The S&P 500 and its ETFs are important because the action in these ETFs
closely matches that of the S&P 500 index futures, at least in their general
direction and the size of the moves.
SPDR S&P 500 (SPY): This highly recognizable and well-advertised ETF
is the most commonly traded S&P 500 ETF. Also known as the S&P 500
“Spyders,” it is among the most liquid of all ETFs. SPY trades at one-
tenth the value of the S&P 500 cash index. That means that if the S&P
500 is at 1,400, SPY trades at 140. SPY works well when you want to
trade the overall trend of the broad stock market.
Ultra S&P 500 Shares (SSO): This is a leveraged ETF which rises and falls
twofold the daily performance of the S&P 500. It’s an excellent fund when
the market is starting to come out of a significant decline. The potential
risk of losing twice the drop of the S&P 500 on any given day, though,
makes it a tough one to use until a rising trend is clearly in progress.
Short S&P 500 ProShares (SH): This ETF is a way to sell the S&P 500
short without selling SPY short. SH is structured to work opposite to the
S&P 500, without any leverage. In other words, if the S&P 500 was to lose
1 percent at any given time, SH would rise close to 1 percent.
UltraShort S&P 500 ProShares (SDS): This is my favorite way to sell the
stock market short because it follows the trend of the S&P 500 quite
closely, and it gives me the opportunity to leverage my gains. The invest-
ment goal of this fund is to deliver twice the opposite performance of
the S&P 500 (200percent), before fees and expenses. I use it when I get
70
Part I: Understanding the Financial Markets
09_287224-ch05.qxp 5/27/08 10:57 PM Page 70

sell signals for the stock market. See Chapter 12 for more detail on stock-
ing up on indexes. See “Using ETFs in Real Trading” at the end of this
chapter for a real-life trading example.
The Nasdaq 100 Index (NDX)
The Nasdaq 100 Index is a basket of large technology stocks including famil-
iar names such as Intel and Apple. The index often moves in a big way, both
up and down, offering great opportunities for active trading.
PowerShares Trust (QQQQ): This highly popular and liquid ETF con-
tains the largest 100 stocks that trade on the Nasdaq. It works well as a
proxy for the Nasdaq 100 futures and the E-mini Nasdaq futures, which
are both very popular contracts.
Ultra QQQ Proshares (QLD): This ETF is designed to double the returns
of the Nasdaq 100 Index twofold. It’s a good vehicle to use when you’re
expecting a significant rally and want to get more bang for your buck.
Just remember that what goes up twofold also falls twofold.
Short QQQ Proshares (PSQ): This ETF shorts the Nasdaq 100 Index on a
one-to-one basis, such that a 1 percent drop in the index leads roughly
to a 1 percent rise in the price of PSQ. This fund is ideal if you want to
sell NDX short but aren’t willing to get too leveraged.
UltraShort QQQ ProShares (QID): As with all “Ultra” funds, this one
gives you a twofold return on the trend of the index that it mirrors. In
this case, QID rises twice the amount of the Nasdaq 100 when the index
falls. This is an excellent fund to use when large technology stocks are
having difficulties and you’re looking to leverage your short positions.
The Dow Jones Industrial Average
The Dow Jones Industrial Average is the most widely followed stock index in
the world. Its corresponding ETFs are great trading tools, and they have an
excellent correlation to the Dow Jones Industrial Average futures.
Diamond Shares (DIA): This is the way to trade the general trend of the
Dow Jones Industrial Average. Its value is roughly one-tenth of the Dow
Jones Industrial Average.
DDM, DOG, and DXD: Ultra Dow30 Proshares (DDM), Short Dow30
Proshares (DOG) and UltraShort Dow30 Proshares (DXD) round out the
quartet of highly liquid Dow Jones Industrial average–based ETFs. As
with other Ultra ETFs, the ones corresponding to the Dow Jones
Industrial Average are leveraged. To short the Dow Jones Industrial
Average on a one-to-one basis, use the Short Dow30 Proshares (DOG).
71
Chapter 5: Trading Futures Through the Side Door
09_287224-ch05.qxp 5/27/08 10:57 PM Page 71

Comfort via Commodity ETFs
Commodities, at least as of February 2008, seem to be in the midst of a multi-
year, and perhaps a multidecade, bull market. Indeed, even dummies (like us)
can trade oil, natural gas, commodities like wheat and soybeans, and bonds
with little trouble as long as we have online stock trading accounts.
Still, it’s a good idea to check out Chapter 10 for information on trading
bonds, see Chapter 13 to get a good idea as to what’s involved in trading
energy, and review Chapter 16 to get the lay of the land on agricultural com-
modities before you jump in with both feet. Other chapters that are likely to
be helpful in trading ETFs include Chapter 7 (on technical analysis), Chapter
14 (on trading metals) and Chapter 17 (on setting up your trading plan).
Energizing your ETF Trades
The energy markets captured the spotlight for the last seven years, since oil
began its climb before topping out at $110 in March 2008. Whether that’s the
final top or not remains to be seen, but one thing is certain: The energy mar-
kets offer great trading opportunities, and there are plenty of ETFs that you
can use to participate.
The U.S. Oil Fund (USO): This was the first ETF introduced to allow the
actual trade of crude oil futures without owning futures contracts. It
remains the most liquid, although it has some competitors. The key to
success is to remember that USO follows the general price trend of
crude oil, but the price is not the same as the leading crude oil futures.
As Russell Wild points out in Exchange-Traded Funds For Dummies
(Wiley), USO is a commodity pool. It doesn’t invest in oil companies, but
rather in crude oil futures. Thus, it’s a risky and volatile fund, whose
value is based on the value of the futures contracts owned by the man-
agement company that runs the fund.
Wild goes to great lengths to give you the negative aspects of the ETF,
and they’re worth reading so you get the whole picture. But for my
money, the fund, which has been around since 2006, is very liquid and
serves my purposes as it follows the trend of crude oil futures closely.
When oil prices are rising, I want to own shares in USO.
The PowerShares DB Energy Fund (DBE): This fund lets you trade West
Texas Light Sweet Crude oil, Brent Crude, RBOB gasoline, heating oil,
and natural gas under one banner. The problem with the fund is that
there is no guarantee that all five energy components will be in bullish
72
Part I: Understanding the Financial Markets
09_287224-ch05.qxp 5/27/08 10:57 PM Page 72

or bearish trends at the same time. As a result, this ETF may lag a single
commodity fund such as USO or UNG. Still, if the energy sector is firing
on all cylinders, this one is a good one. Both crude grades get a 22.5 per-
cent weighing here, as do gasoline and heating oil. The more volatile nat-
ural gas component gets a 10 percent weighing.
Macroshares Oil Down Tradeable shares (DCR): This ETF has not been
very successful given its inability to track the price of crude oil, either in
price itself or in percentage terms. Much of the problem has been the
illiquidity of the product. On some days, only a few hundred shares
trade hands, in contrast with USO, where hundreds of thousands of
shares trade daily.
The problem with Macroshares DCR is that the fund is not invested in
the short sale of oil or oil futures; rather, it’s invested in treasury bonds,
which in turn are worked into a formula that’s supposed to generally
track the trend of crude oil. If this fund worked correctly, it would rise in
price when crude oil prices fall. But it doesn’t always work that way. In
fact, on January 17, 2007, the price of crude oil fell and DCR shares fell.
Aside from embarrassing the issuer of the fund at the time (Claymore
Advisors), the incident raised questions about whether this fund would
be viable.
Nevertheless, knowing about it is worthwhile, assuming it stays around.
As of February 2008, the fund was still available. And if oil ever falls for
any extended period of time, this might be a good way to try to make
money from the event, after careful scrutiny of how the fund is function-
ing at the time.
The United States Gas Fund (UNG): UNG actually works pretty well at
moving along with the fortunes of natural gas. It correlates with the rises
and falls of the price of the underlying futures. The major problem with
UNG is the fact that natural gas is hugely volatile. So even in an ETF you
could experience big intraday volatility. I have traded this fund many
times and have had a difficult time making money, due to the nature of
the underlying asset. Yet, if natural gas ever hits a bull market like crude
oil has had since 2001, this would be a good way to play it.
The PowerShares DB Commodity Index Tracking Fund (DBC): This
fund tracks a diversified commodity portfolio, including crude oil, heat-
ing oil, aluminum, corn, wheat, and gold. It generally tracks the overall
price of the commodities it houses, but is heavily weighted toward
energy with crude oil (35 percent) and heating oil (25 percent) making
up over half of the asset allocation. Aluminum accounts for 12.5 percent,
while corn, wheat, and gold make up the rest of the fund. Make no mis-
take about it, though; despite the diversification, this is no wallflower
of an ETF.
73
Chapter 5: Trading Futures Through the Side Door
09_287224-ch05.qxp 5/27/08 10:57 PM Page 73

The PowerShares DB Agriculture Fund (DBA): This is a good play on
the agricultural commodities. It’s designed to track, before fees and
expenses, the Deutsche Bank Liquid Commodity Index — Optimum Yield
Agriculture Excess Return. DBA tracks the price of corn, wheat, soy-
beans, and sugar with each commodity getting a 25 percent weighing in
the ETF. It functions similarly to DBC, but is more volatile since it con-
centrates its assets on agriculture. Both DBA and DBC were doing well in
early 2008, as commodities were rising in price due to higher demand
for goods in China and other emerging markets. Both DBA and DBC are
direct commodity pools.
The golden touch — metal ETFs
Precious metal ETFs are fairly liquid and trend with the price of the underly-
ing commodity quite well. Several fairly liquid gold funds exist, but the most
liquid and most popular is Streettracks Gold Shares (GLD). This fund offers
access to gold bullion without having to trade futures or take custody of bul-
lion bars. It also saves transaction fees.
Other gold and silver ETFs are
PowerShares DB Precious Metals (DBP), which houses both gold and
silver futures. Gold makes up 80 percent of the portfolio, with silver car-
rying 20 percent of the load. This makes sense, given the volatility of the
silver market.
PowerShares DB Gold Fund (DGL) and iShares DB Silver Trust (SLV)
are self-explanatory.
The PowerShares DB Base Metals Fund (DBB) lets you trade aluminum,
zinc, and copper. Each represents 33.3 percent of the portfolio. This is a
good fund when the global economy is booming and demand for indus-
trial metals is high.
Getting Current with Currency ETFs
Foreign currencies are an excellent way to profit from global market volatility,
political instability, and other crises. At the same time, they’re excellent trad-
ing vehicles when interest rates change.
A good general rule is that higher interest rates and a strong economy tend
to favor a country’s currency. And while there isn’t a 100 percent correlation
74
Part I: Understanding the Financial Markets
09_287224-ch05.qxp 5/27/08 10:57 PM Page 74
between any one variable and a currency’s price, if you know how to trade
with the trend, currencies are an excellent vehicle. For the whole story on
currencies, read Chapter 11. In this section, I provide a good list of currency
ETFs. All of them trade along the same trends as their underlying currencies.
In the world of currency trading, not only can you trade dollars versus other
currencies, but you can also engage in what is known as cross trading, or
trading of Yen versus Swiss francs, euros versus Australian dollars, and so
on. In this section, though, I concentrate only on ETFs that feature the dollar
versus other currencies.
There are plenty of opportunities to trade currencies via ETFs:
You can bet on a rising U.S. dollar with the PowerShares DB U.S. Dollar
Bullish Fund (UUP). This ETF has relatively low volatility and is not the
best way to trade the dollar when the trend is sideways because it gen-
erally rises and falls with the U.S. Dollar Index, a slow-moving composite
of the dollar against ten global currencies.
The same can be said about the PowerShares DB U.S. Dollar Bearish
Fund (UDN). This would be a good way to trade the dollar in a very long-
term downtrend, but it has fairly low volatility and is not as good a vehi-
cle for trading as are the individual currency funds that I describe in the
next two bullets.
The Currency Shares EuroTrust (FXE) has an excellent correlation to the
exchange rate between the euro and the U.S. dollar.
The Currency Shares Swiss Franc Trust (FXF), the Currency Shares
Australian Dollar Trust (FXA), the Currency Shares Yen Trust (FXY), the
Currency Shares Swedish Krona (FXS), the Currency Shares Canadian
Dollar Trust (FXC), the Currency Shares Mexican Peso Trust (FXM), and
the Currency Shares British Pound Trust (FXB) round out the ETF offer-
ings for the currency markets.
For more information on these ETFs, visit www.currencyshares.com.
Using ETFs in Real Trading
In this final section I describe a real trade that I recommended at www.
joe-duarte.com
, and that I made in my own portfolio at the same time.
In order to illustrate both the concept of trading futures and how to use an
ETF in the process, I chose a sale in which I shorted the UltraShort S&P 500
ProShares (SDS).
75
Chapter 5: Trading Futures Through the Side Door
09_287224-ch05.qxp 5/27/08 10:57 PM Page 75
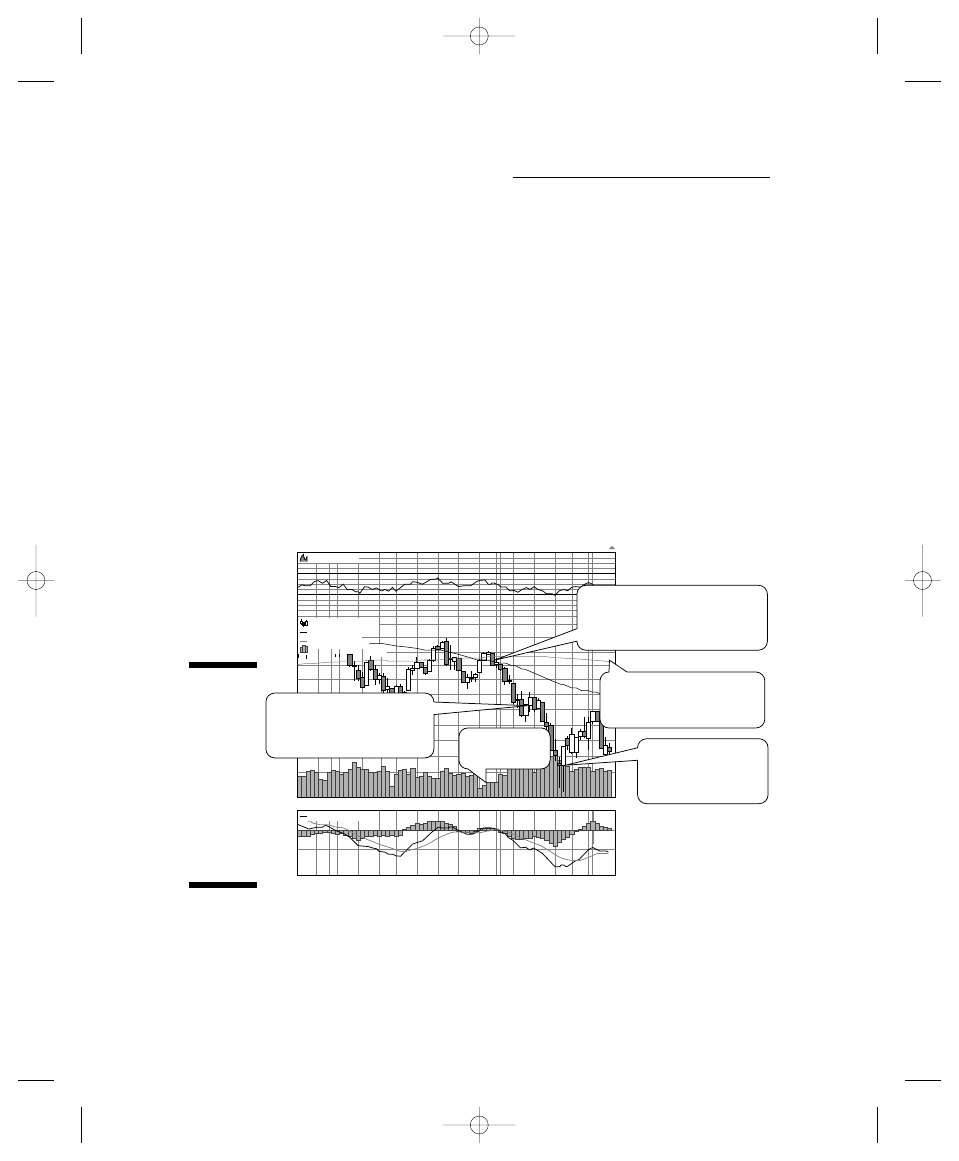
The market had been acting fairly poorly since the start of January, but by
January 15, (2008) things were getting pretty dicey. On December 26, 2007, on
Joe-Duarte.com
I recommended the purchase of S&P 500 SPDRs (SPY),
which was triggered at 149.53. The trade moved mostly sideways, which is
rare for the week between Christmas and New Year’s Eve. Traditionally, the
holiday week is one of the best trading weeks of the year, as portfolio managers
tend to “window dress” their portfolios by adding more shares of winners and
making their results look better. Figure 5-1 shows the uncharacteristically flat
market during the holiday period in 2007 and the subsequent decline as well
as the catalysts of the decline in early 2008.
On January 4, 2008, I recommended the purchase of SDS on a price above
60.05, as the S&P 500, which had crossed below its 200-day moving average at
the end of 2007, looked to weaken once again. (See Chapter 7 for more on the
200-day moving average.) The market stayed that way until January 10, when
it rallied briefly and again tried to stabilize. Figure 5-2 shows the entry and
exit points for the trade.
MA(200) 1480.73
Volume 3,328,554,752
29Nov
12
RSI (14) 39.89
SCS (Daily) 1331.29
MA(50) 1421.32
8-Feb-2008
Close 133.29 Volume 3.3B Chg -5.62 (-0.42%)
© StockCharts.com
SDS (ProShares Ultra Short S&P 500) AMEX
19 26
10
17
24
7
14
22 28
Dec
2008
Feb
29Nov
12
19 26
10
17
24
7
14
22 28
Dec
2008
0
–20
1275
1300
1325
1350
1375
1400
1425
1450
1475
1500
50
70
90
Feb
MACD(12,26,9) -21.841,
-23.068, 1.227
1-14-08: Apple news hits
stocks hard during the
trading day.
Low Volume
200-day moving average
1-23-08: Intraday
upside reversal
triggers sell signal.
12-28-07: The S&P 500 closes
below its 200-day moving
average.
Figure 5-1:
The S&P
500 failing to
rally and
finally
breaking
down during
the
traditionally
bullish
holiday
period.
76
Part I: Understanding the Financial Markets
09_287224-ch05.qxp 5/27/08 10:57 PM Page 76
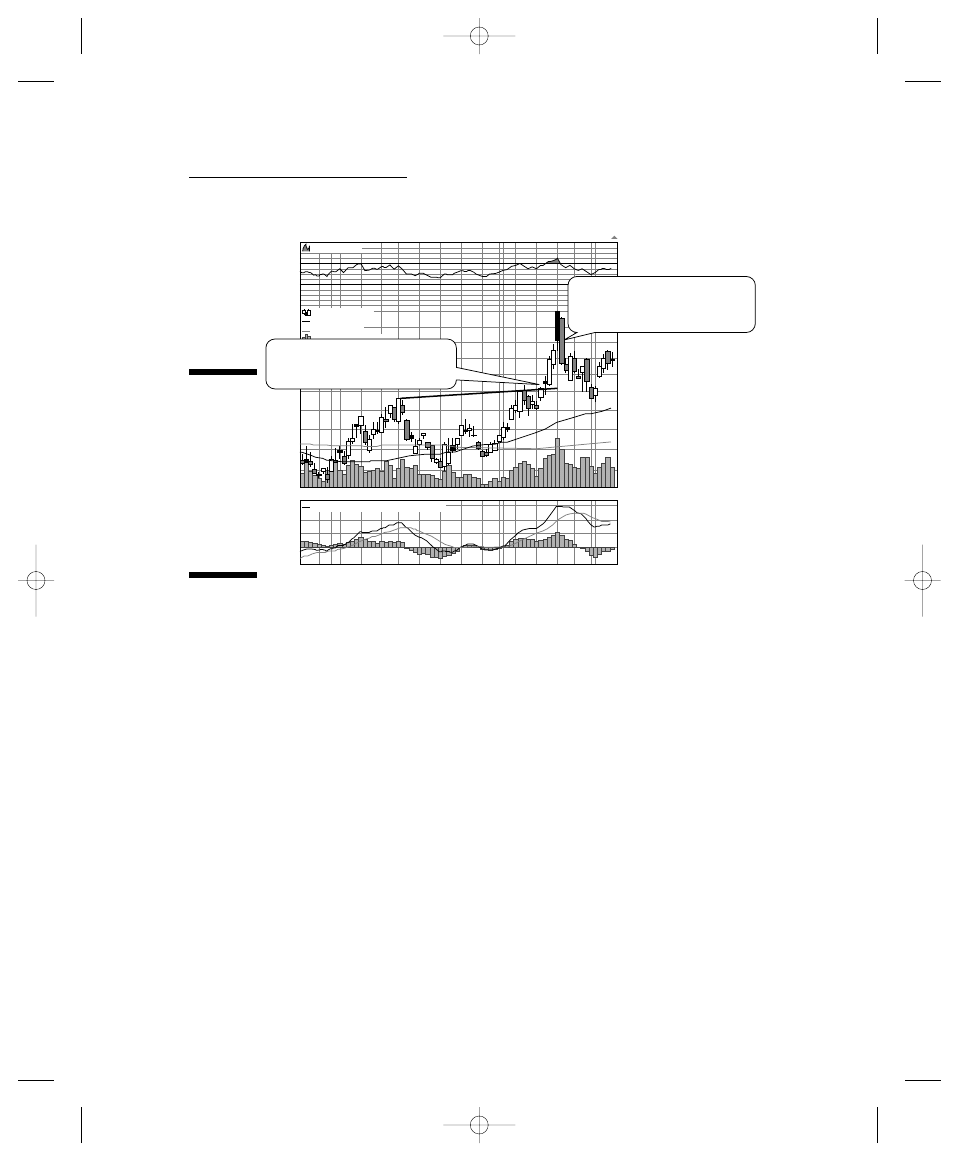
But the stabilization process of the S&P 500 (refer to Figure 5-1) looked weak,
as volume dried up on each day thereafter. Weaker volume on a rally is usu-
ally a sign of poor conviction. As I saw this phenomenon and noted that the
market was still trading below its 200-day moving average, the dividing line
between bullish and bearish trends, I recommended entering SDS on a price
above 60.05.
The entry point on SDS was triggered on January 15, when the market started
selling off during the middle of the day. This was due to several announce-
ments made by Apple Inc.’s CEO Steve Jobs during a news conference. The
news did not sit well with traders, who were already jittery about the general
state of affairs.
The stock market drifted off for the rest of the day, and all hell broke loose
after the bell when Intel’s earnings announcement again disappointed the
street. The S&P 500 started a five-session decline that finally stopped on
January 23. The position was stopped out that day at 66.23, pocketing a 10.29
percent gain in an eight-day period.
MA(200) 53.39
Volume 3,328,554,752
1-15-08: SDS was bought as it
broke out.
29Nov
12
RSI (14) 58.75
SCS (Daily) 64.77
MA(50) 57.66
8-Feb-2008
Close 64.77 Volume 24.3M Chg +0.55 (+0.86%)
© StockCharts.com
SDS (ProShares Ultra Short S&P 500) AMEX
19 26
10
17
24
7
14
22 28
Dec
2008
Feb
29Nov
12
19 26
10
17
24
7
14
22 28
Dec
2008
0
1
2
3
50.0
52.5
55.0
57.5
60.0
62.5
65.0
67.5
50
70
90
Feb
1-23-08: SDS was sold as
it reversed course.
MACD(12,26,9) -21.841, -23.068, 1.227
Figure 5-2:
ProShares
Ultrashort
S&P 500 ETF
entry and
exit points
during a
short-term
trade via
the short-
selling ETF.
77
Chapter 5: Trading Futures Through the Side Door
09_287224-ch05.qxp 5/27/08 10:57 PM Page 77

Here are some other important things to note on Figures 5-1 and 5-2:
Note the generally inverse nature of the charts. This makes perfect
sense as SDS is supposed to move in the opposite direction of SPX. It’s
important for an ETF to do what it’s designed to do. In this case, SDS
acted perfectly, as it rallied when the S & P 500 fell.
Note also that when SPX fell below its 200-day moving average, SDS
moved above its 200-day line.
Next, look at the sideways action until the January 14 break in SPX,
which corresponded to the breakout in SDS.
In other words, the key to this trade was to watch what happened in the
S&P 500 and to be ready to pull the trigger on SDS.
To be sure, there is more to this trade than just watching the two instruments
and the 200-day moving average. Yet, the key concept is that if you match an
ETF to an index and you’re careful as well as decisive, you can make a nice
profit over a relatively short period of time.
Other things to note:
It helps to be patient and to keep an eye on the overall trend of the mar-
kets. In this case, it was clearly down. It took this trade 11 days to mate-
rialize. I recommended the entry point of 60.05 on January 4, and waited
until January 15 for the right circumstances to develop before the trade
was actually triggered.
Next, it always pays to watch how the market responds to news. Steve
Jobs (Apple’s CEO) didn’t really say anything too horrible during his
keynote address at MacWorld; yet, the market sold off during his speech.
When good news leads to selling, the market is weak and you should be
looking to either get out or sell short.
Finally, you have to be disciplined when you sell as well as when you
buy. When the market started to rally on January 23, it was time to sell,
and we did.
78
Part I: Understanding the Financial Markets
09_287224-ch05.qxp 5/27/08 10:57 PM Page 78
Part II
Analyzing the
Markets
10_287224-pp02.qxp 5/27/08 10:57 PM Page 79

In this part . . .
P
art II of this book is about cutting through jargon and
getting comfortable with trading concepts. This sec-
tion gives you the tools you need to wade through trader
talk and use economic reports effectively to make money.
I also tell you about the world of technical analysis, showing
you the basics of reading price charts and using key techni-
cal indicators. You get effective tips on trading techniques,
how to spot key market turning points by using market sen-
timent, and knowing when to trade against the grain.
10_287224-pp02.qxp 5/27/08 10:57 PM Page 80

Chapter 6
Understanding the Fundamentals
of the Economy
In This Chapter
Understanding the U.S. economy
Getting to know the major economic reports
Staying awake for the leading economic indicators
Trading the big reports
T
o the beginner, the financial markets and reality seem to often be discon-
nected. That lack of connection, most often associated with stock trad-
ing, is not as often visible in the futures markets. This is especially so in the
case of commodities, such as grains and the energy complex, because price
changes in the markets often move through the system fairly rapidly and can
be seen at the grocery store.
When I started trading, I was overwhelmed by the amount of data that was
available, and I had a hard time correlating how that data was related to the
movement of prices. To be honest, I thought that the whole thing was random.
My first reaction was to ignore the data and concentrate on the charts. And
although chart-watching worked well for a while, it wasn’t good enough to get
me in and out of trades fast enough or to prevent getting taken out of posi-
tions only to see them turn around and go in the direction that I expected
them to go in the first place. I knew I needed something else, so I began
watching how the market moved in response to economic data.
To be sure, this is not the only approach to trading, as there are purists on
both sides of the aisle: those who propose charting as the best method, and
those who swear by the fundamentals. But rather than confuse you with a
bunch of jargon and useless justifications on either side, I can tell you that
you’ll decide what works best for you, and that for me, the best method is to
use charts as well as to keep my hands on the pulse of the economy.
11_287224-ch06.qxp 5/27/08 10:57 PM Page 81

It’s also fair to say that my problem in my early trading career was one of a lack
of experience. This could have been remedied by a much finer use of different
charting methods, as well as a better use of charts with different time frames.
See Chapter 7 for more on technical analysis.
Just remember that the more experience you get, the more insight you’ll gain
into what works best for you. Think of this book as a great place to get started.
Achieving a balance among what I want to know about the economy, what I
need to know, and what I can use took time. So, after considerable trial and
error, I’ve reached a comfortable middle ground: I am both an avid chartist, or
someone who studies price charts and uses technical analysis of the financial
markets to make trades, and also an avid follower of trends in the economy,
although not in as much depth as you’d expect from a Nobel Prize–winning
economist.
For me, the bottom line is this: Like many other successful traders, I under-
stand how the markets and the monthly economic indicators can morph into
a nice, reliable trading method. And so this chapter focuses on the effects of
important economic indicators on the bond markets, stock indexes, and cur-
rency markets.
When I write, my goal is to make the examples not only as current as possi-
ble, but also universal, so that you can use them for an extended period of
time. Most markets behave similarly, but certainly not identically, over time,
so you have to be flexible in your interpretation of real-time trading. When I
provide examples, my goal is to give you as classic a set of parameters as
possible.
I purposely chose examples from April 2005 of how economic reports can
affect the market for two major reasons. First, I wanted to show you that the
concepts that I describe in the chapter are relevant to recent history, where
the big event is the global economy during a controversial period in U.S. his-
tory — the post-September 11, 2001, era. And second, the period of time
chosen had just about anything that a futures trader could ask for in the way
of data that can move the markets, especially a significant amount of activity
in the oil market, a booming housing market, and a Federal Reserve that was
just hitting its stride in a major cycle of interest-rate hikes.
If you fast forward to 2007 or beyond, you will likely see different things
happen, depending on the overall economy and how the market perceives
the situation at the time. Yet, in the current world, the primary set of rules
and circumstances that govern trading are no longer exclusive to the U.S.
economy and its effect on the world. As a trader you also have to be keenly
aware of the effect of China and other emerging markets on the macro-market,
that linked beast that was unleashed in the stock market crash of 1987.
82
Part II: Analyzing the Markets
11_287224-ch06.qxp 5/27/08 10:57 PM Page 82

Understanding the U.S. Economy:
A Balancing Act
Market experts and those well versed in economic theory, along with politi-
cians and pundits, like to muddle things up when it comes to interpreting
data and formulating working summaries of economic activity. That’s how
they keep their jobs — by confusing the public when it comes to what’s really
happening with the economy.
But understanding how the economy works and making it fit your trading
approach doesn’t have to be that complicated. Simply stated, the U. S. econ-
omy, the largest in the world, is dependent upon a series of delicately inter-
twined relationships, so keep these factors in mind:
Consumers drive the U.S. economy.
Consumers need jobs to be able to buy things and keep the economy
going.
The ebb and flow between the degree of joblessness and full employ-
ment, how easy or difficult it is to get credit, and how much the supply
of goods and services is in demand drive economic activity up or down.
As a rule, steady job growth, easy-enough credit, and a balance between
supply and demand are what the Board of Governors of the Federal Reserve
(the Fed) like to see in the economy. When one or more of these factors is out
of kilter (teeters off balance), the Fed has to act by raising or lowering inter-
est rates to
Tighten or loosen the consumer’s ability to obtain credit
Rein in a too-high level of joblessness
Increase or decrease the supply side to bring it in line with demand, or
vice versa
Several government agencies and private companies monitor the economy
and produce monthly or quarterly reports. These reports, in turn, are released
on a regularly scheduled basis throughout the year. They provide futures
traders with a major portion of the road map they need to decide which way
the general direction of prices in their respective markets are headed.
Trading, in turn, is highly influenced by the government and private-agency
reports and how the markets respond. Businesses are just the pawns of the
Fed and the markets, and their reaction to changes in trend usually takes
some time to be noticed.
83
Chapter 6: Understanding the Fundamentals of the Economy
11_287224-ch06.qxp 5/27/08 10:57 PM Page 83

The overall focus of the markets is on only one thing: What the Federal
Reserve is going to do to interest rates in response to the report(s) of the day
(see Chapter 1). Based on how traders (buyers and sellers) perceive their
markets before the Fed makes its move and their reactions after the Fed’s
response to economic conditions is announced, prices move in one direction
or the other.
As a futures trader, you need to understand how each of these important
reports can make your particular markets move and how to prepare yourself
for the possibilities of making money based on the relationship between all
the individual components of the market and economic equation. Given these
basic truths about the U.S. economy, I discuss the most important sets of
data released by key reporting agencies and how to use the information to
make trades.
Getting a General Handle on the Reports
Economic reports are important tools in all markets, but they’re a way of life
for futures traders.
Each individual market has its own set of reports to which traders pay spe-
cial attention. But some key reports are among the prime catalysts for fluctu-
ations in the prices not only of all markets, but especially in the bond, stock,
and currency markets, which form the centerpiece of the trading universe
and are linked to one another. Traders wait patiently for their release and act
with lightning speed as the data hit the wires.
Some reports are more important during certain market cycles than they are
in others, and you have no way of predicting which of them will be the report
of the month, the quarter, or the year. Nevertheless, Gross Domestic Product,
the consumer and producer price indexes, the monthly employment reports,
and the Fed’s Beige Book, which summarizes the economic activity as surveyed
by the Fed’s regional banks, are usually important and highly scrutinized.
The Institute for Supply Management (ISM) report (formerly the national pur-
chasing manager’s report) also is important, and so is the Chicago purchas-
ing manager’s report, which usually is released one or two days prior to the
ISM report. Many traders believe that the Chicago report is a good prelude to
the national report, and the day of its release can often lead to big market
moves, both up and down.
Consumer confidence numbers from the University of Michigan and the
Conference Board usually are market movers, with bond, stock, and currency
traders paying special attention to them. These reports are especially important
84
Part II: Analyzing the Markets
11_287224-ch06.qxp 5/27/08 10:57 PM Page 84

when the market is particularly keen on what the Federal Reserve is expected
to change the trend of interest rates as the Fed looks at consumer spending,
which is related to consumer confidence as a major influence on the economy.
Sometimes weekly employment claims data can move the market if they
come in far above or below expectations. Retail sales numbers, especially
from major retailers, such as Wal-Mart, can move the markets, and so can the
budget deficit or surplus numbers. Consumer credit data can sometimes
move the market as well.
Cable news outlets, major financial Web sites, and business radio networks —
CNBC and Bloomberg are two that I follow — broadcast every major report
as it is released, and the wire services send out alerts regarding the reports
to all major financial publishers not already covering the releases. The gov-
ernment agencies and companies that are responsible for the reports also
post them on their respective Web sites immediately at the announced time.
Exploring how economic reports are used
From a public policy standpoint, economic reports find their way into politi-
cal speeches in the House of Representatives and on the Senate floor. The
president and his advisors, other politicians, bureaucrats, and spin doctors
quote data from these reports widely and often, using them to suit their cur-
rent purposes.
From a trader’s point of view, you can best use them as
Sources of new information: No one should ever have access to the
data in economic reports prior to their release — other than the press,
which receives it expressly under embargoed conditions with instruc-
tions not to release the data prior to the proper time, and key members
of the U.S. government, such as the Fed and the president. Anyone else
who has the data before the release can be prosecuted if they leak it to
anyone else.
Risk management tools: You can place your money at risk if you ignore
any of the reports. Each has the potential for providing important infor-
mation that can create key turning points in the market.
Harbingers of more important information: Individual headlines about
economic reports are only part of the important data. The markets
explore more data beyond what’s contained in the initial release.
Sometimes data hidden deep within a report become more important
than the initial knee-jerk reaction characterized within the headlines and
cause the market to reverse its course. In other words, sometimes it’s
85
Chapter 6: Understanding the Fundamentals of the Economy
11_287224-ch06.qxp 5/27/08 10:57 PM Page 85

best to wait a few minutes or even longer before making trading deci-
sions based on trading reports.
Trend-setters: Current reports may not always be what matters. The trend
of the data from reports during the last few months, quarters, or years, in
addition to expectations for the future, also can be powerful information
that moves the markets up or down. When looking through these reports,
keep in mind what the prior reports have said, and pay attention to the
revisions by the releasing agency that are included in the current report.
Planning tools: Trading solely on economic reports can be very risky
and requires experience and thorough planning on your part. Make the
reports part of your strategy, not the center of your strategy. How the
market responds to the reports is what really matters.
Gaming the calendar
As a trader, your world is highly dependent on the economic calendar, the
listing of when reports will be released for the current month.
Each month a steady flow of economic data is generated and released by the
U.S. government and the private sector. These reports are
A major influence on how the futures and the financial markets move in
general
A source of the cyclicality, or repetitive nature, of market movements
You can get access to the calendar in many places. Most futures brokers post
the calendar on their Web sites and can mail you a copy along with key infor-
mation on their margin and commission rates — pretty convenient, eh?
Customer service in the futures market actually is quite awesome if you can
handle the greasy guys that you sometimes have to talk to.
The Wall Street Journal, Marketwatch.com, and other major news outlets also
publish the calendar, either fully posted for the month or for that particular
day or week.
The reports follow a familiar pattern, usually following each other in similar
sequence from one month to the next.
Exploring Specific Economic Reports
Some reports are more important than others, but at some point, they all have
the potential to influence the market. The reports that consistently carry the
86
Part II: Analyzing the Markets
11_287224-ch06.qxp 5/27/08 10:57 PM Page 86
most weight and result in the biggest shifts in the markets tend to be the
employment report, the Producer Price Index (PPI), the Consumer Price
Index (CPI), and two reports on consumer confidence. Other economic data
that have an important bearing on the markets include the Purchasing
Manager’s report from the Institute for Supply Management (ISM), Beige Book
reports produced eight times a year by the Federal Reserve, housing starts
compiled by the U.S. Department of Commerce, and of course, the grand-
daddy of all, the Index of Leading Economic Indicators, which the Fed also
produces.
In addition to these major economic releases, each individual market has its
own set of key reports. For example, the cattle markets (Chapter 15) aren’t
likely to be moved by data in the Purchasing Manager’s Report, but may be
moved by grain storage prices. I highlight key reports that affect each individ-
ual market in the chapters that deal specifically with those markets.
Working the employment report
The U.S. Department of Labor’s employment report is the first piece of major
economic data released each month. It’s released on the first Friday of every
month and is formally known as the Employment Situation Report. Bond,
stock index, and currency futures are keyed upon the release of the new jobs
and the unemployment rate numbers at 8:30 a.m. eastern time. See the
Remember icon directly ahead for more.
The release of the employment data usually is followed by frenzied trading
that can last from a few minutes to an entire day, depending on what the data
shows and what the market was expecting. The report is so important that it
can set the trend for overall trading in the entire arena of the financial mar-
kets for several weeks after its release.
When consecutive reports show that a dominant trend is in place, the trend
of the overall market tends to remain in the same direction for extended peri-
ods of time. The reversal of such a dominant trend can often be interpreted
as a signal that bonds, stock indexes, and currencies are going to change
course.
The employment report is most important when the economy is shifting
gears, similar to the way it did after the events of September 11, 2001, and
during the 2004 presidential election. During the election, the markets not
only bet on the economic consequences of the report, but they also bet on
how the number of new jobs would affect the outcome of the election.
Traders use the employment report as one of several important clues to pre-
dict the future of interest rates.
87
Chapter 6: Understanding the Fundamentals of the Economy
11_287224-ch06.qxp 5/27/08 10:57 PM Page 87
For trading purposes, the major components of the employment report are
The number of new jobs created: This number tends to predict which
way the strength of the economy is headed. Large numbers of new jobs
usually mean that the economy is growing. When the number of new
jobs begins to fall, it’s usually a sign that the economy is slowing. More
important, weakness in the employment report often leads the Federal
Reserve to lower interest rates, while rising strength may lead the Fed to
stop lowering rates, and even raise them if the report is seen as poten-
tially creating inflation.
The unemployment rate: The rate of unemployment is more difficult to
interpret, but the trend in the rate is more important than the actual
monthly number. A workforce that is considered to be fully employed
usually is a sign that interest rates are going to rise, so the markets
begin to factor that into the equation.
Other subsections of the employment report have their moments in the sun.
For example, the household survey, which uses interviews from people that
work at home, was heavily scrutinized during the 2004 election season. The
numbers of self-employed people became more important as the election neared,
because the market began to price in an economic recovery based on adding
together the data from both the traditional establishment survey, which mea-
sures the people who work for companies, with the household survey.
Be ready to make trades based on the reaction of the markets to the report
and not necessarily what the report says.
Probing the Producer Price Index (PPI)
The PPI is an important report, but it doesn’t usually cause market moves as
big as those effected by the CPI and the employment report.
The PPI measures prices at the producer level. In other words, it’s a measure-
ment of the cost of raw materials to companies that produce goods. The
market is interested in two things contained in this report:
How fast these prices are rising: If a rise in PPI is significantly large in
comparison to previous months, the market checks to see where it’s
coming from.
For example, the May 2005 PPI report pegged prices at the producer level
as rising 0.6 percent in April, following a 0.7 percent increase in March and
a 0.4 percent hike in February. At first glance, the market viewed the April
increase (compared to the previous two months) as a negative number.
However, market makers discovered a note deeper in the report, indicating
that if you didn’t measure food and energy — in this case (especially) oil
prices — producer prices at the so-called core level rose only 0.3 percent.
88
Part II: Analyzing the Markets
11_287224-ch06.qxp 5/27/08 10:57 PM Page 88

The market looked at the core level, and bonds rallied. You and I know
that food and energy are important expenses, and that if they are more
expensive, we pay more. But futures traders live in a different world
when they’re in the trading pits and in front of their trading screens,
meaning that they trade on their perceptions of the data and not what
you and I find intuitive.
Whether producers are passing along any price hikes to their con-
sumers: If prices at the core level are tame, as they seemed to be in the
April 2005 report, traders will conduct business based on the informa-
tion they have in hand, at least until the CPI is released — usually one or
two days after the PPI is released. In this case, based only on the PPI,
inflation at the core producer level was tame, so traders wagered that
producers were not passing any added costs on to the consumer.
Browsing in the Consumer
Price Index (CPI)
The CPI is the main inflation report for the futures and financial markets.
Unexpected rises in this indicator usually lead to falling bond prices, rising
interest rates, and increased market volatility.
Consumer prices are important because consumer buying drives the U.S.
economy. No consumer demand at the retail level means no demand for prod-
ucts along the other steps in the chain of manufacturers, wholesalers, and
retailers.
Here are some key factors that govern consumer prices and the inflation that
they measure:
Prices at the consumer level are not as sensitive to supply and
demand as they are to the ability of retailers to pass their own costs
on to consumers. For example, clothing retailers can’t always or imme-
diately pass their wholesale costs for fabric components or labor to con-
sumers, because they’ll start buying discount clothing if premium
apparel is too expensive. Much of this volatility has to do with the fact
that a large amount of retail merchandise is made in Asia, where labor is
cheap and competition is stiff.
Supply tends to be more important in many cases than demand. When
enough of something is available, prices tend to stay down. Scarcities,
however, don’t necessarily mean inflation (but they certainly can accom-
pany it).
Inflation is not a price phenomenon but rather a monetary phe-
nomenon. When too much money is chasing too few goods, inflation
appears.
89
Chapter 6: Understanding the Fundamentals of the Economy
11_287224-ch06.qxp 5/27/08 10:57 PM Page 89
Inflationary expectations and consumer prices are related. This factor
is true because inflationary expectations are built into the cost of bor-
rowing money.
By the time prices begin to rise at the consumer level, the supply-and-
demand equation, price discovery, and pressure on the system have
been ongoing at other levels of the price chain for some time.
Understanding the relationship between prices and interest rates is key to
developing an intuitive feeling for futures trading.
The true return on an investment is the percentage of the investment that
you gain after accounting for inflation. If your portfolio gains 20 percent for
five years and inflation is running at 10 percent during that period, you actu-
ally gained only 10 percent per year.
The release of the CPI usually moves the markets for interest-rate, currency,
and stock-index futures. As with the PPI, traders want to know what the core
CPI number is — that is, prices at the consumer level without food and
energy factored in. The April 2005 CPI was a classic report. The initial line
from the Labor Department quoted consumer prices as rising 0.7 percent, a
number that, if it stood alone, would have caused a big sell-off in the bond
market. However, as the report revealed that the core number was unchanged,
bonds and stock futures had a big rally, which spilled over into the stock
market that day.
Managing the ISM and purchasing
manager’s reports
The Institute for Supply Management’s (ISM’s) Report on Business usually
moves the markets, or is a market mover, however you want to say it. It mea-
sures the health of the manufacturing sector in the United States. This report
is based on the input of purchasing managers surveyed across the United
States and is compiled by the ISM.
The Report on Business is different from the regional purchasing manager’s
reports, although some regional reports, such as the Chicago-area report,
often serve as good predictors of the national data. You also need to know,
however, that the regional reports are not used as a basis for the national
report.
The report addresses 11 categories, including the widely watched headline,
the PMI index. Here is how to look at the ISM report:
90
Part II: Analyzing the Markets
11_287224-ch06.qxp 5/27/08 10:57 PM Page 90
A number above 50 on the PMI means that the economy is growing.
You want to find out whether the main index and the subsectors are
above or below 50.
Just as important is whether the pace of growth is slowing or picking up
speed. The report, which is available at the ISM Web site at www.ism.ws,
clearly states whether each individual sector is growing or not growing,
and whether it is doing so because its pace is slowing or picking up speed.
The data for the entire report is included with a summary of the econ-
omy’s current state and pace near the headline of the report.
The April 2005 report concluded that the economy had been growing for 42
straight months and that the manufacturing sector had been growing for 23
straight months. The report concluded that although prices paid by manufac-
turers were on the rise and inventories were low, both the economy and the
manufacturing sector were still growing, but the growth rate was slowing.
The bond market rallied. The dollar strengthened. And stocks had a moder-
ate gain.
This particular ISM report had something for everybody, especially when you
compare it to the economic trends around the world in which Europe had
flat-to-lower growth rates and China had a robust but also moderating growth
rate. A U.S. economy that is growing is good. But one that is growing too fast
can lead to inflation, so the bond markets also liked the report. Steady
growth with low production costs is good for company earnings, so the stock
markets liked it. Economic growth is likely to keep interest rates steady or
slightly higher, so the currency markets — which like to see steady to higher
interest rates — liked the report, too.
Considering consumer confidence
The report that measures consumer confidence is a big report that comes
from two sources that publish separate reports: the Conference Board, a pri-
vate research group, and the University of Michigan.
The Conference Board Survey
The Conference Board, Inc., publishes a monthly report based on survey inter-
views of 5,000 consumers. Key components of the Conference Board Survey are
The monthly index
Current conditions
Consumers’ outlook for the next six months
91
Chapter 6: Understanding the Fundamentals of the Economy
11_287224-ch06.qxp 5/27/08 10:57 PM Page 91

In April 2005, the monthly index fell, and so did the current condition and
outlook portions of the survey. The result: Bonds rallied, stocks rallied, and
the dollar remained steady. The report became another piece of the eco-
nomic puzzle at a key time in the U.S. economy. The way the market looked at
the data, following eight straight Federal Reserve interest-rate increases,
showed that the economy was starting to slow. To a layman, a slowing
economy would be bad news, but to a futures trader, the data meant that
the Fed was nearing the end of its rate hikes (or that interest rates were
leveling off).
The University of Michigan Survey
The University of Michigan conducts its own survey of consumer confidence,
and it publishes several preliminary reports and one final report per month.
Key components of the University of Michigan Survey are
The Index of Consumer Confidence
The Index of Consumer Expectations
The Index of Current Economic conditions
In April 2005, the University of Michigan reported that “Consumer confidence
sank in April, marking the fourth consecutive monthly decline, with the
Sentiment Index falling to its lowest level since September 2003.” The report
cited rising gas prices and a poor job outlook as reasons for the sag in con-
sumer confidence and the increasingly negative data for consumer expecta-
tions. The impact on the markets was predictable. Bonds rallied and so
eventually did stocks — after an initial dip.
Again, the key to the report was that consumer confidence was falling. When
consumers are less confident, the Fed is less likely to continue to raise inter-
est rates.
Perusing the Beige Book
The Beige Book, one of my favorite reports, is a key report from the Federal
Reserve that is released eight times per year. In each tome, the Fed produces
a summary of current economic activity in each of its districts, based on
anecdotal information from Fed bank presidents, key businesses, economists,
and market experts, among other sources.
The 12 Federal Reserve District Banks are located in Boston, New York,
Philadelphia, Cleveland, Richmond, Atlanta, Chicago, St. Louis, Minneapolis,
Kansas City, Dallas, and San Francisco.
92
Part II: Analyzing the Markets
11_287224-ch06.qxp 5/27/08 10:57 PM Page 92

The Federal Reserve produces the Summary of Commentary on Current
Economic Conditions, otherwise known as the Beige Book. In it, the Fed sum-
marizes anecdotal reports on the economy by district and sector and pack-
ages it into a comprehensive summary of the 12 district reports. Each Beige
Book is prepared by a designated Federal Reserve Bank on a rotating basis.
The Beige Book is released to the members of the Federal Open Market
Committee (FOMC) before each of its meetings on interest rates, so it’s an
important source of information for the committee members when they’re
deciding in what direction they’ll vote to take interest rates.
On April 20, 2005, the Federal Reserve district in Dallas had its turn to pub-
lish the Beige Book and summarized its findings as follows:
“Eleventh District economic activity expanded moderately in March and
early April. The manufacturing sector continued to rebound, while activ-
ity in financial and business services continued to expand at the same
pace reported in the last Beige Book (the one released March 9, 2005).
Retailers said they were disappointed with recent sales growth. Residential
construction continued to cool from last year’s strong pace, amid signs
that commercial real estate markets were slowly improving. The energy
industry strengthened further, and contacts said exploration activity was
expanding on the belief that energy prices would remain high. Agricultural
conditions remained generally positive. While activity was strong in some
industries, in many sectors contacts reported slightly less optimism about
the strength of activity for the rest of the year, largely because demand has
not been picking up as quickly as they had hoped.”
Traders look for any mention of labor shortages and wage pressures in the
Beige Book. If any such trends are mentioned, bonds may sell off, as rising
wage pressures are taken as a sign of building inflation in the pipeline. In this
edition, the book noted that banking and accounting were seeing some price
competition caused by a shortage of qualified workers but added that “most
industries said there was little or no wage pressure.”
Here’s a good habit to get into so you can capitalize on knowledge from one
area of the market as you apply it to another: After checking out the initial
headlines and market reactions, read through the report on the Internet. You
can find links to it on the Fed’s Web site, www.federalreserve.gov, or you
can do a Google or Yahoo! search for “Beige Book.”
What I look for when I scan the full text on the Web is what the Beige Book
says about individual sectors of the economy. Under manufacturing in April
2005, the Beige Book said that although little pickup was reported in the
growth for electronics, slightly rising demand was noted for networking
switches and other related products in telecommunications.
93
Chapter 6: Understanding the Fundamentals of the Economy
11_287224-ch06.qxp 5/27/08 10:57 PM Page 93
If you see something like that, you can start looking at the action of key
stocks in that sector. Interestingly, the stock of Cisco Systems, the leader in
switches and related products, made a good bottom in the month of April,
and on April 21, a day after the Beige Book was released, it began to rally. By
May 20, the stock was up over 10 percent.
The Beige Book usually is released in the afternoon, one or two hours before
the stock market closes. The overall trend of all markets can reverse late in
the day when the data in the report surprise traders.
For example, the Federal Reserve’s Beige Book released on October 17, 2007,
summarized the U.S. economy as one that was expanding “in all Districts in
September and early October.” Yet, in the next sentence, the Fed noted “but
the pace of growth decelerated since August.”
That was enough to end a nice rally in the stock market. The Beige Book was
released at 2 p.m. eastern time, and by the close the market was already not
acting too well. Over the next couple of days, the market started to drift
lower. And on October 19, the 20th anniversary of the Crash of 1987, the Dow
Jones Industrial average dropped 366 points, as the market began to worry
about the prospects for the economy.
By the same token, as expected, the bond market staged a nice rally.
Homing in on housing starts
Bond and stock traders like housing starts, because housing is a central por-
tion of the U.S. economy, given its dependence on credit and the fact that it
uses raw materials and provides employment for a significant number of
people in related industries, such as banking, the mortgage sector, construc-
tion, manufacturing, and real-estate brokerage.
Big moves often occur in the bond market after the numbers for housing
starts are released.
Released every month, housing starts are compiled by the U.S. Commerce
Department and reported in three parts:
Building permits
Housing starts
Housing completions
The markets focus on the percentage of rise or fall in the numbers from the
previous month for each component.
94
Part II: Analyzing the Markets
11_287224-ch06.qxp 5/27/08 10:57 PM Page 94
For example, the April 2005 report showed a 5.3 percent growth in the
number of building permits, an 11 percent growth in housing starts (with a
6.3 percent growth in single-family homes), and a 3.4 percent growth rate in
housing completions.
By contrast, the housing start numbers in the years 2006 and 2007 were
dismal, as the housing boom contracted. These reports were closely corre-
lated to the fall in the housing sector in the United States.
A volatile series of numbers, this data can be greatly affected by weather, so
it is also seasonally adjusted and includes a significant amount of revised
data within each of the internal components. For example, when winter
arrives, snow storms and cold weather tend to halt or slow new and ongoing
construction projects, so housing permits and housing starts can start to
decline. If you don’t know that, you can make trading mistakes by betting that
interest rates are going to fall.
The problem comes when the weather clears, the projects get underway,
and the numbers swell. Markets look at the seasonally adjusted numbers,
which are smoothed out by statistical formulas used by the U.S. Department
of Commerce.
Even then, this set of numbers is tricky. The Commerce Department dis-
claimer notes that it can take up to four months of data to come up with a
reliable set of indicators.
Staying Awake for the Index of
Leading Economic Indicators
The Conference Board looks at ten key indicators in calculating its Index of
Leading Economic Indicators. Included are the
Index of consumer expectations
Real money supply
Interest-rate spread
Stock prices
Vendor performance
Average weekly initial claims for unemployment insurance
Building permits
Average weekly manufacturing hours
95
Chapter 6: Understanding the Fundamentals of the Economy
11_287224-ch06.qxp 5/27/08 10:57 PM Page 95

Manufacturers’ new orders for nondefense capital goods
Manufacturers’ new orders for consumer goods and materials
In April 2005, the overall index dropped and so did much of the economic
data for that month. At the same time, the trend of economic growth
remained up, once again confirming the notion that interest rate increases
ordered by the Federal Reserve were starting to slow down the economy, but
they weren’t dragging it into a recession.
The Index of Leading Economic Indicators is another lukewarm indicator that
sometimes moves the markets and other times doesn’t. It is more likely to
move the markets whenever it clearly is divergent from data provided by
other indicators. For example, if in April the leading indicators were showing
a drastic decline, the markets would start worrying about a recession loom-
ing on the horizon. That, in turn, may be a catalyst to knock down stock and
commodity prices and the value of the dollar, but on the other hand, it may
bring about a huge rally in the bond markets.
Grossing out with Gross Domestic
Product (GDP)
The report on Gross Domestic Product (GDP) measures the sum of all the
goods and services produced in the United States. Although GDP can yield
confusing and mixed results on the trading floor, it sometimes is a big market
mover whenever it’s far above or below what the markets are expecting it
to be. At other times, GDP is not much of a mover. Multiple revisions of
previous GDP data accompany the monthly release of the GDP and tend to
dampen the effect of the report. Although the GDP is not a report to ignore
by any means, it usually isn’t as important as the PPI and CPI and the employ-
ment report.
GDP has a component called the deflator, which is a measure of inflation.
The deflator can be the prime mover whenever it is above or below market
expectations.
Getting slick with oil supply data
Oil supply data became a central report outside of the oil markets in 2004
and 2005 as the price of crude oil soared to record highs during the war in
Iraq. The Energy Information Agency (EIA), a part of the U.S. Department of
96
Part II: Analyzing the Markets
11_287224-ch06.qxp 5/27/08 10:57 PM Page 96

Energy, and the American Petroleum Institute (API) release oil supply data for
the previous week at 10:30 a.m. eastern time every Wednesday.
Traders want to know the following:
Crude oil supply
Gasoline supply
Distillate supply
A build is when the stockpiles of crude oil in storage are increasing. Such
increases are considered bearish or negative for the market, because large
stockpiles generally mean lower prices at the pump. A drawdown, on the
other hand, is when the supply shrinks. Traders like drawdown situations,
because prices tend to rise after the news is released.
Every week, oil experts and commentators guess what the number will be.
Although they almost never are right in their predictions, the fact that they’re
wrong sets the market up for more volatility when the number comes out and
gives you a trading opportunity if you’re set up to take advantage of it.
Although crude oil supply is self-explanatory as the basis for the oil markets
and is important year-round, two other supply factors are affected by these
seasonal tendencies:
Distillate supply figures are more important in winter, because they
essentially represent a measure of the supply of heating oil.
Gasoline supplies are more important as the summer driving season
approaches.
Other holidays sometimes can affect oil supply numbers. The market tends
to factor their effect into the numbers, though, so for other holidays to have
a big effect on trading, the surprises have to be very big.
The market has changed, however, because of problems with refinery capac-
ity in the United States and the aftereffects of two major hurricanes (Katrina
and Rita) in 2005 in the Gulf of Mexico region. Volatility in the markets and
supply numbers will evolve over the next few years. See Chapter 13 for a full
rundown of the energy markets.
CNBC covers the oil supply release number live. Sometimes, the reporter gets
the gist of the data wrong, and the market can be increasingly volatile
because of it. Although this scenario is not frequent, I’ve seen it happen, and I
have seen it have an effect on trading.
97
Chapter 6: Understanding the Fundamentals of the Economy
11_287224-ch06.qxp 5/27/08 10:57 PM Page 97
Enduring sales, income, production,
and balance of trade reports
The hodgepodge of data that trickle out of the woodwork throughout the
month about retail sales, personal income, industrial production, and the bal-
ance of trade sometimes causes a bit of commotion in the futures markets,
but these individual reports mostly cause only a few daily ripples, unless, of
course, the effect of the data is dramatic.
As a futures trader, you need to know that these reports are coming, but a
good portion of the time, they come and go without fanfare or trouble, unless
the economy is at a critical turning point and one of these reports happens to
be the missing piece to the puzzle.
Of these four reports, the one most likely to get the most press, is the bal-
ance of trade report. Because the Chinese economy is getting so much atten-
tion these days, the currency and bond markets may move dramatically
whenever the balance of trade report shows a much greater than expected
trade deficit or trade surplus. If several consecutive reports show that the
United States is reversing its trend toward more imports than exports, you
may see a major set of moves in the futures markets.
The prices for imports also are an important factor in the trade data that can
be a sign of inflation and, again, can affect how the Federal Reserve moves on
interest rates.
Trading the Big Reports
The greatest effect that each of the reports highlighted in this chapter can
have is on the futures markets associated with bonds, stock indexes, and cur-
rencies. Thus, the best strategies for trading based on these reports are
found in those markets.
Any report can make the market move up or down if the market finds some-
thing in the report to justify the move, but some general tendencies to keep
in mind include the following:
Reports that show a strengthening economy are less friendly to the bond
market and tend to be friendlier toward stock-index futures and the dollar.
Although this isn’t a hard and fast rule, as always, trade what’s happening,
not what you think ought to happen (see Chapters 10, 11, and 12).
Signs of slowing growth or a weak economy tend to be bullish, or posi-
tive, for bonds and less friendly toward stock indexes and the dollar.
98
Part II: Analyzing the Markets
11_287224-ch06.qxp 5/27/08 10:57 PM Page 98

Short-term interest-rate futures, such as in Eurodollars (see Chapter 10),
may move in the opposite direction of the 10-year Treasury note (T-note)
or long-term (30-year) bond futures.
Gold, silver, and oil markets may respond aggressively to these reports.
(To find out more about the markets in these commodities, see Chapters
13 and 14.)
The Federal Reserve may make comments that accelerate or reverse the
reactions and responses to economic reports.
Keeping It Simple
Futures traders can set up complicated strategies in advance of the release of
a big economic report, but you can make trading these reports simple by
keeping your eye on the trend before the report is released.
Say the trend is up in the stock market, and you are long a position in the
S&P 500 stock index futures. You also know that the market is waiting for
the employment report, and that it anticipates the number of new jobs to
decrease.
A small number of new jobs usually means that the market is expecting the
economy to weaken, which could mean that the stock market will rise or fall,
depending on which way the market handicaps the response of the Federal
Reserve.
If you are cautious and have a nice profit on your S&P 500 futures, you could
offset it, take your profits, and wait to see what happens with the report.
Another approach is to hedge your bets in the stock market by using the
bond market. Economic weakness usually leads to higher bond prices. That
means that you can establish a long position in the U.S. Ten Year note futures
one or two days before the employment report in hopes that if the report
comes in weak, you can profit from a rally in the bond market, and thus pro-
tect any gains that you have in your stock position.
The market will respond when the report is released. If the number is weak,
watch what happens in bonds and stocks in response. You can watch it on
your computer, or you can watch the response on CNBC.
If things are not going your way, you can offset either one position or both of
them depending on what’s happening at the time. If both the stock and bond
market like the report, you can hold both positions and offset them later,
either based on your price targets or if the trend turns against them.
99
Chapter 6: Understanding the Fundamentals of the Economy
11_287224-ch06.qxp 5/27/08 10:57 PM Page 99

100
Part II: Analyzing the Markets
11_287224-ch06.qxp 5/27/08 10:57 PM Page 100

Chapter 7
Getting Technical Without
Getting Tense
In This Chapter
Embracing the purpose and uses of technical analysis
Choosing a good charting service
Adopting specific charts and interpreting chart patterns
I
’m a visual person, and my first experience with trading came from read-
ing a chart in 1988, right before Memorial Day weekend, when I made my
first stock trade: 100 shares of Quanex Corp. (NYSE:NX), a steel pipe and tube
maker. I bought the stock for around $12 and sold it at essentially the same
price a few days later, at which point it hadn’t done much of anything. I was
most unhappy with the commissions I had to pay and the fact that the stock
didn’t do what I had expected it to do — rise substantially in price.
I bought the stock based on a chart that exhibited a cup-and-handle pattern,
a chart pattern made famous by Investor’s Business Daily founder William
O’Neil. This pattern isn’t very useful in futures trading, but it can be helpful in
trading stocks. It shows up when a stock forms a rounded base and then
trades sideways in a narrow range, giving the appearance or impression of a
cup and a handle.
In my first trade, I identified such a pattern from an Investor’s Business Daily
chart. I was lucky. My first stock trade cost me only a hundred bucks, and I
had enough money left to keep on trading. But that failure within my small
account — breaking even and paying a $50 commission on the purchase and
the sale — is what prompted me to find out more about charts and how they
work together with the fundamentals of the markets.
What I didn’t realize at the time was that Quanex had only recently come out of
some major difficulties and was restructuring. A longer-term view of the chart
would’ve revealed that trading was volatile and that the stock was, in fact,
stuck in a trading range and not in a significant up, down, or breakout trend.
12_287224-ch07.qxp 5/27/08 10:58 PM Page 101

I also discovered that I didn’t know anything about the state of the steel indus-
try at the time, the company’s management, or its plans for the future. All are
important when trading futures, options, and their underlying equities.
My mistake was that the cup-and-handle pattern, although genuine, was only
a snapshot of the trading action over a few months. Had I known better — as I
do now — I would’ve looked at a multiyear chart, and put the cup-and-handle
pattern from the newspaper in its proper context.
The major lesson that I brought home during that relatively traumatic experi-
ence was that a chart pattern is only a beginning — a tool that leads you
toward exploring more information about why the pattern suggests that you
need to buy, sell, or sell short the underlying instrument.
In this chapter, I introduce you to the basics of recognizing interesting chart
patterns that can lead you either to more study of the situation or to plug in
what you already know about a market that is giving you a visual signal. See
Chapters 8 and 12 for speculating strategies and using technical analysis for
trading stock index futures.
Picturing a Thousand Ticks: The Purpose
of Technical Analysis
I like to think of stock or futures charts as summaries of the collective opin-
ions of all the participants in a market. In essence, a chart is a tick-by-tick his-
tory of those opinions as they evolve over time, factoring in everything that
market participants know, think they know, and expect to happen with regard
to the asset for which the chart was compiled.
And although a picture is worth a thousand words to most people, to a trader,
a chart is worth a chance to make some money. Technical analysis, or the use
of price charts, moving averages, trend lines, volume relationships, and indi-
cators for identifying trends and trading opportunities in underlying financial
instruments, is the key to success in the futures market. The more you know
about reading charts, the better your trading results are likely to be.
After you become better acquainted with the basic drivers and influences of
a particular market and how that information — key market moving reports,
the major players involved, and the general fundamentals of supply and
demand — fits into the big picture of the marketplace in general, the next log-
ical step is to become acquainted with how the fundamentals are combined
with the data that is compiled in price charts.
102
Part II: Analyzing the Markets
12_287224-ch07.qxp 5/27/08 10:58 PM Page 102
By becoming proficient at reading the charts of various security prices, you
gain quick access to significant amounts of information, such as prices, gen-
eral trends, and info about whether a market is sold out and ready to rally or
overbought, meaning few buyers are left and prices can fall. By combining
your knowledge of the markets and trading experiences with excellent chart-
ing skills, you vastly improve your market reaction time and your ability to
make informed trades.
Technical analysis takes into account so much data and methodology that I
can’t possibly cover everything about it in only one chapter. So here are a
few recommendations of excellent books in which you can find useful infor-
mation as you progress with chart reading and trading. This list by no means
is comprehensive, but these references serve as great supplements to this
chapter. The books are not named in any particular order, because each has
something good to offer and can serve you in different ways at different times:
Technical Analysis For Dummies by Barbara Rockefeller (Wiley)
Trading For Dummies by Michael Griffis and Lita Epstein (Wiley)
Technical Analysis of the Financial Markets by John J. Murphy (New York
Institute of Finance)
Candlestick Charting Explained: Timeless Techniques for Trading Stocks
and Futures by Gregory L. Morris (McGraw-Hill)
By reading the information in this book and the books in the preceding list,
you can build a foundation for technical analysis. However, as you gain trad-
ing experience, technical analysis will become more of an individualized
endeavor for you because you’ll find that you gravitate to some areas more
than others.
My own experience is that the simpler the analysis, the better, so my analyti-
cal style relies on moving averages, trend lines, and a few oscillators and indi-
cators. Your style will develop as you gain experience.
These guidelines can help organize your expectations about reading charts:
Charting, in my opinion, isn’t meant to replace fundamental analysis. In
my trading, charts are meant to complement and enhance it, enabling
you to make better decisions. That’s not to say that there aren’t those
very talented people out there who make millions as pure chartists,
because there are. Just keep an open mind on this.
Understanding the fundamentals of supply and demand in your par-
ticular segment of the futures market is necessary for you to be able
to trade futures based on charted technical signals. Knowing both the
103
Chapter 7: Getting Technical Without Getting Tense
12_287224-ch07.qxp 5/27/08 10:58 PM Page 103

fundamentals of what you are trading and combining the knowledge
with technical analysis makes investing your hard-earned money easier.
You have to be flexible, so becoming familiar with more than one set of
indicators and being able to combine them gives you more than one per-
spective from which to view the markets. I use different combinations of
indicators for different types of trading to find more ways of looking at
the markets. Narrow-minded traders don’t go too far.
Mastering the basics of following moving averages, identifying trend
reversals, and drawing trend lines is important so you can add new
layers of analysis, such as moving average crossover systems, and other
more sophisticated techniques as you gain more experience.
Continuing to expand your knowledge of technical analysis is important.
You can do so by reading magazines like Technical Analysis of Stocks &
Commodities (www.traders.com), Futures (www.futuresmag.com),
and Active Trader (www.activetradermag.com) magazines, which
are excellent sources of interesting articles. Investor’s Business Daily
(www.investors.com), is a chart reader’s paradise for stock and
futures traders.
Exercising care so that you avoid clutter in your charts, even as you
become more sophisticated in your approach to trading futures, is
important. The simpler your charts, the better the picture you get and
the better your decisions will be.
First Things First: Getting a
Good Charting Service
You need a reliable charting service — a provider of quotes, charts, and
market data — either one that your broker provides or an independent one
such as Barchart (www.barchart.com), and you need a reliable set of soft-
ware tools to be able to trade well. Many such services, programs, and com-
binations of the two are available.
Some online trading houses offer a range of services on their respective Web
sites. Software and charting services are available as on websites, down-
loads, or as individually boxed packages that are Web-ready. They range from
the bare minimum with basic charts and indicators to very complex systems
used by professionals. A good way to start is with a bare-bones charting
system or the next step up. You can move up to progressively more elaborate
systems as your trading skills become more sophisticated.
Some brokers charge you extra for using their in-house, more sophisticated
charting and software services, but others let you use them as part of a package
104
Part II: Analyzing the Markets
12_287224-ch07.qxp 5/27/08 10:58 PM Page 104

deal, especially if you’re an active trader placing trades through the sponsoring
trading house. Extra charges vary, but a difference of $30 to $40 per month or
more between the low- and the high-end packages is not uncommon. You need
to check with each individual service before deciding on a charting service.
No matter what, you’re obligated to pay exchange fees to get real-time quotes
from the exchanges, and those fees can add up to hundreds of dollars per
month, depending on the number of exchanges from which you get quotes.
Here are the characteristics that a charting service/online brokerage must have:
Reliability: The service must be up and running when you want to place
trades, and the data it provides must be accurate. If your service tells
you to come back later because it’s unavailable anytime when the mar-
kets are open — in other words, during peak trading times — you need
to quit the unreliable service, demand a refund, and find another more-
reliable service. A good way to find out whether a service is reliable is to
locate users’ groups, either online, where you can read their bulletin
boards, or in your town, where you can attend a meeting or two and
listen to any complaints. You also need to sign up for a trial period so
you can see how you like the system before you pay for it. Most services
offer free trials.
Accessibility: The service needs to be available to you virtually any-
where, either online or by the use of a convenient online interface. You
need to be able to check your quotes, open positions, and make your
decisions from home, work, or elsewhere — even on your laptop, PDA,
or smart phone at the airport, or at your favorite hangout that has Wi-Fi.
Support: Make sure the service offers both a toll-free telephone number
to call for support and online support. The toll-free number may or may
not be better than the online support, so you need to try both of them
out to see which works better. Call the toll-free number, log in to the sup-
port chat room, or e-mail customer support before you purchase the
software, just to test the availability and level of support that you’ll be
getting. If your software or charting service malfunctions and you have
to wait 30 minutes before anyone responds to your query, think about
what effect that kind of delay may have on your investments, especially
if you’re trying to place a trade when a big economic release is moving
the markets.
Charting tools: The charts provided by your charting service must be
easy to read and user-friendly. You shouldn’t have to punch five or ten
keys or toggle your mouse for ten minutes to make your chart look right.
Sure, you can expect a learning curve with most programs, but if you
can’t make the software do what you want (and what the provider says
it will do) after a few days, it isn’t the right setup for you, and you need
to consider getting a new program.
105
Chapter 7: Getting Technical Without Getting Tense
12_287224-ch07.qxp 5/27/08 10:58 PM Page 105
Real-time quotes: Trading futures without real-time quotes is a sure path
down the road to ruin. Real-time quotes are up-to-the-minute market
prices, as they happen. They provide you with up-to-the-minute pricing
for your particular security, futures contract, or option, thus enabling
you to make timely decisions. Without them, the prices you get from
your charting service may be subject to a standard 20-minute delay,
during which markets can move to their limits (or even reverse course),
leaving you faced with a margin call or a big loss.
Live charts: If you’re going to trade, you need access to live charts that
actually change with every tick (up or down movement) of the market.
You can set them up to update the bars or candlesticks in your charts
over a broad range of different time frames. The key: You want your chart
to be updated to reflect the direction in which the market is trading.
Time-frame analysis: Make sure your charting service enables you to
produce intraday charts. You want to be able to look at different time
frames simultaneously. For example, if the long-term trend in the S&P
futures is headed up on a six-month chart, but you see that a top is
building on your intraday chart, your strategy for your S&P 500 Index
fund may not be affected. But if you have two S&P 500 long contracts
open and a few call options, you may need to adjust the strategies on
your futures positions. For example, you may want to consider moving a
sell stop closer to the current price if you’re concerned about remaining
in the position. Or you may want to sell the position outright.
Multiple indicators: Make sure the service to which you subscribe lets
you plot price charts and multiple indicators at the same time. A standard
page may include prices, a combination of moving averages, stochastics,
and MACD and RSI oscillators. I go into more details on these indicators
and how to use them in Chapter 8. Chapter 13 features a great example
of how to use RSI in the energy markets. But for now, you need to con-
centrate on the charting information you need for technical analysis.
Also important is the amount of data that you can get on one chart and
having the ability to save it as a template. Set up your charts the way
you like them when the market is closed, and then save them as your
favorites. Most services will let you set up different sets of charts. That
way when you start trading you won’t waste time setting up your indica-
tors when you should be pulling the trigger on your trade.
Some charting services offer access on hand-held electronic devices. This
feature may be attractive to you if you’re on the road and have open posi-
tions. Don’t trade and drive, though.
You can get a pretty good preview of a good, basic, real-time charting pro-
gram online at currency and futures brokerages optionsXpress.com or FX
charts.com (http://www.fx-charts.com/pgs/toolbox_livecharts.
php
)(www.Xpresstrade.com). These pages gives you free access to both
basic tutorials, as well as real-time quotes in the currency markets — while
providing a good overview of several levels of charting that are available. You
106
Part II: Analyzing the Markets
12_287224-ch07.qxp 5/27/08 10:58 PM Page 106
can scroll through many free currency real-time charts on these sites, which
also offers trading software. In general, these are good places to get your feet
wet and to make use of some of the concepts in this chapter as they apply to
the currency markets. The basic charting principles that you discover in one
market are easily applicable to other markets.
Stockcharts.com (www.stockcharts.com) has an excellent free Java chart-
ing system on which you can practice drawing trend lines and analyzing
charts. These are not real-time charts, but they are a good place to practice
your craft after the market closes.
Deciding What Types of Charts to Use
Security analysis relies on these four basic types of charts: line charts, bar
charts, candlestick charts, and point-and-figure charts. Line charts almost
never are used in trading. Bar and candlestick charts commonly are used in
stocks and futures trading, and point-and-figure charts have a smaller but
loyal following as trading tools.
I don’t use point-and-figure charts, so I won’t include them in this discussion.
However, for a nice short overview of point-and-figure charting, check out
Technical Analysis For Dummies (Wiley). If you like what you read there and
want even more information about it, I also recommend John Murphy’s
Technical Analysis of the Financial Markets (New York Institute of Finance).
In general, I concentrate on bar and candlestick charting, but the bulk of my
explanation in this chapter is based on candlestick charts, because they’re
the most commonly used charts in futures trading. They offer the best infor-
mation for shorter holding periods (like the ones common to day trading) or
for longer trading periods where you have open positions that you may stay
with for a few days.
Confused? Don’t be. Both types of price charts are useful, and you’ll develop
your own style and preferences for the ones that work best for you. At this
point, however, you merely need to be aware of what these charts are, how to
recognize them, and how you can start thinking about putting them to use.
Both sets of charts offer the same basic kind of information — price, volume,
and general direction of the market.
Bar charts are made up of thin single bars that define the movement of a price
over a period of time. You can use one for analyzing a longer period of the
market. I like them for this purpose because they’re a bit less cluttered.
Candlestick charts, on the other hand, are made up of thin- and thick-bodied
candles, such as in Figure 7-1, which shows how they basically look like can-
dles with wicks at both ends. Figure 7-3 shows how you can incorporate can-
dlestick patterns with key indicators, such as moving averages and oscillators.
107
Chapter 7: Getting Technical Without Getting Tense
12_287224-ch07.qxp 5/27/08 10:58 PM Page 107

Stacking up bar charts
Bar charts used to be the most commonly displayed charts on most trading
software programs. The bars displayed low and high prices for the specific
time frame of the chart, with the body of the bar representing the range of
trading action during that time frame. The time frame of a bar chart can be
set according to whatever time period the user wants to use, regardless of
whether it’s for part of a day, a day, a week, a month, a year, or longer.
No hard-and-fast rules govern whether one type of chart is better than another.
For example, bar charts and candlestick charts can be used for trading during
any time span that you like, whether day trading or trading intermediate-term
positions in which you stay with the underlying asset as long as the trend
remains in your favor.
I prefer to use candlestick charts for intraday charts, because the color tells
me what I want to know rapidly. For longer-term charts from which I just
want to get the big picture about whether I want to buy or sell the underlying
asset, I tend to use bar charts. The best thing to do is work with both kinds of
charts when you are a beginner and develop your own tendencies.
Bar charts are useful when
You’re looking for a quick snapshot of a particular instrument, sector, or
market, or when you’re doing basic trend analysis.
You’re trading individual stocks or mutual funds, and you’re looking at a
long-term chart, such as a five-year time span.
Weighing the benefits
of candlestick charts
Candlestick charts provide the same sort of information as bar charts, but
they’re better for making trading decisions because they take the guesswork
out of the overall trend in the underlying contract by the use of color-coding.
They’re especially suited for the short-term trading that’s common in the
futures markets.
Candlestick charts can be broken down into several parts, including the
following:
Real body: The real body is the box between the opening and closing
prices depicted by the candlestick. The body can be white or black. White
bodies are bullish, meaning that the price depicted is rising. Black bodies
are bearish, meaning that the price depicted by the candlestick is falling.
108
Part II: Analyzing the Markets
12_287224-ch07.qxp 5/27/08 10:58 PM Page 108
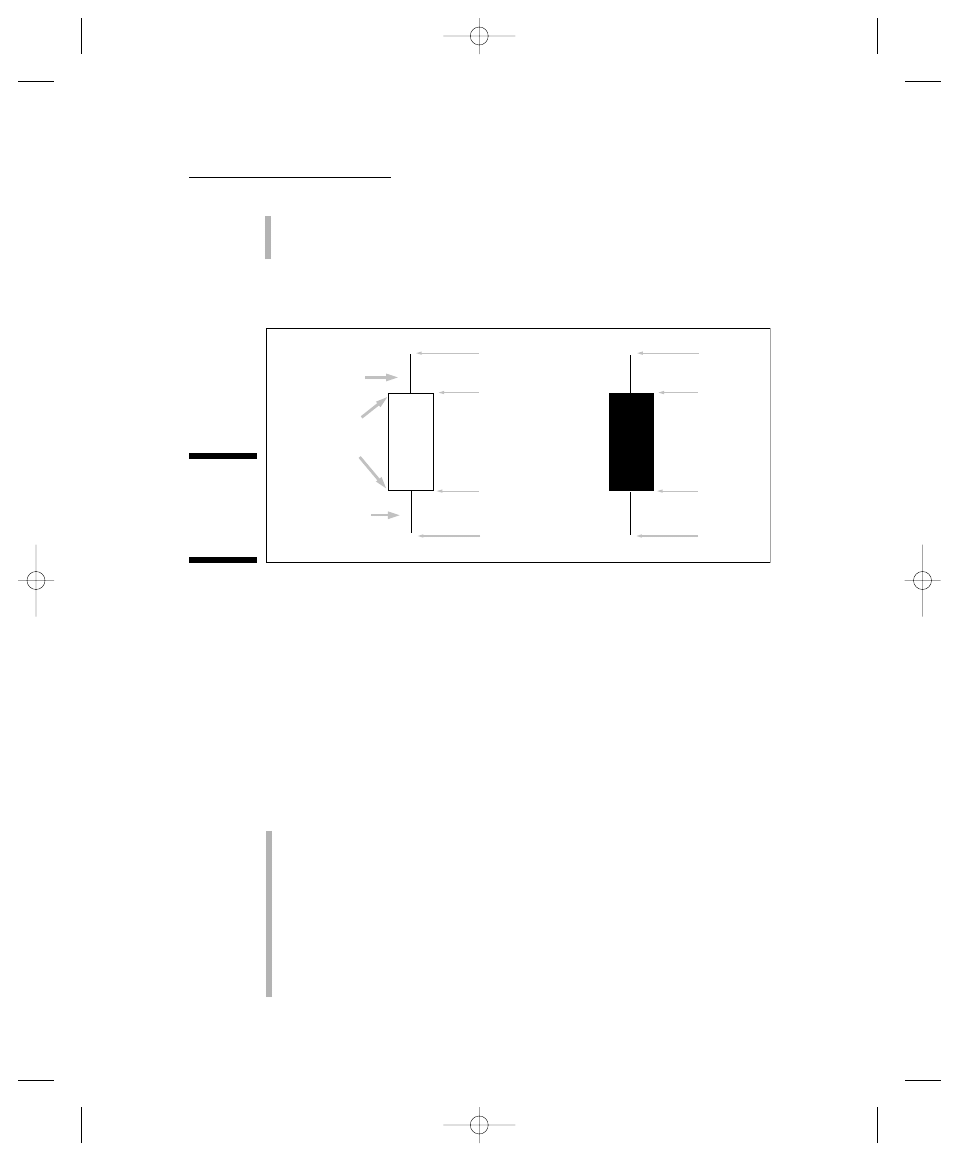
Lower and upper shadows: The thin lines that extend above and below
the real body (the candlewicks) are the lower and upper shadows. The
shadows, or wicks, extend to the high and low prices for the time frame.
Figure 7-1 summarizes the basic anatomy of candlestick charting.
Although bearish candlesticks traditionally are solid black, many software
programs and charting services have replaced the black color with red to
correspond with the standard method of displaying falling prices on quote
systems. They’ve also replaced normally white bullish candlesticks with
green ones, again to conform to the quote systems standards. In fact, many
software programs will even let you decide which color you want to use for
bullish or bearish charts. In this chapter, though, green and white refer to
bullish conditions, and red and black mean bearish.
When a candlestick has no body but only vertical and horizontal shadows,
meaning that it is a line with no box, it forms what is known as a doji pattern.
Doji patterns are a sign of indecision in the market. The three types of doji
patterns (see Figure 7-2) are
Plain: A plain doji looks like a cross and may just be a sign of a short-
term pause. Other kinds of doji bars can be important signs of a trend
reversal.
Dragonfly: A dragonfly doji has a long lower shadow, or single-line body —
the dragonfly appears to be flying upward. If you see this kind of pattern,
it means that sellers were not successful in closing the contract at the
lows of the day. When that happens as the price is bottoming out, it can
mean that buyers are gaining an upper hand. If a dragonfly doji occurs
after a big rally, it can mean that buyers are not able to take prices any
higher.
UPPER
SHADOW
REAL
BODY
LOWER
SHADOW
HIGH
HIGH
CLOSE
CLOSE
OPEN
OPEN
LOW
LOW
Figure 7-1:
The
anatomy
of a
candlestick.
109
Chapter 7: Getting Technical Without Getting Tense
12_287224-ch07.qxp 5/27/08 10:58 PM Page 109
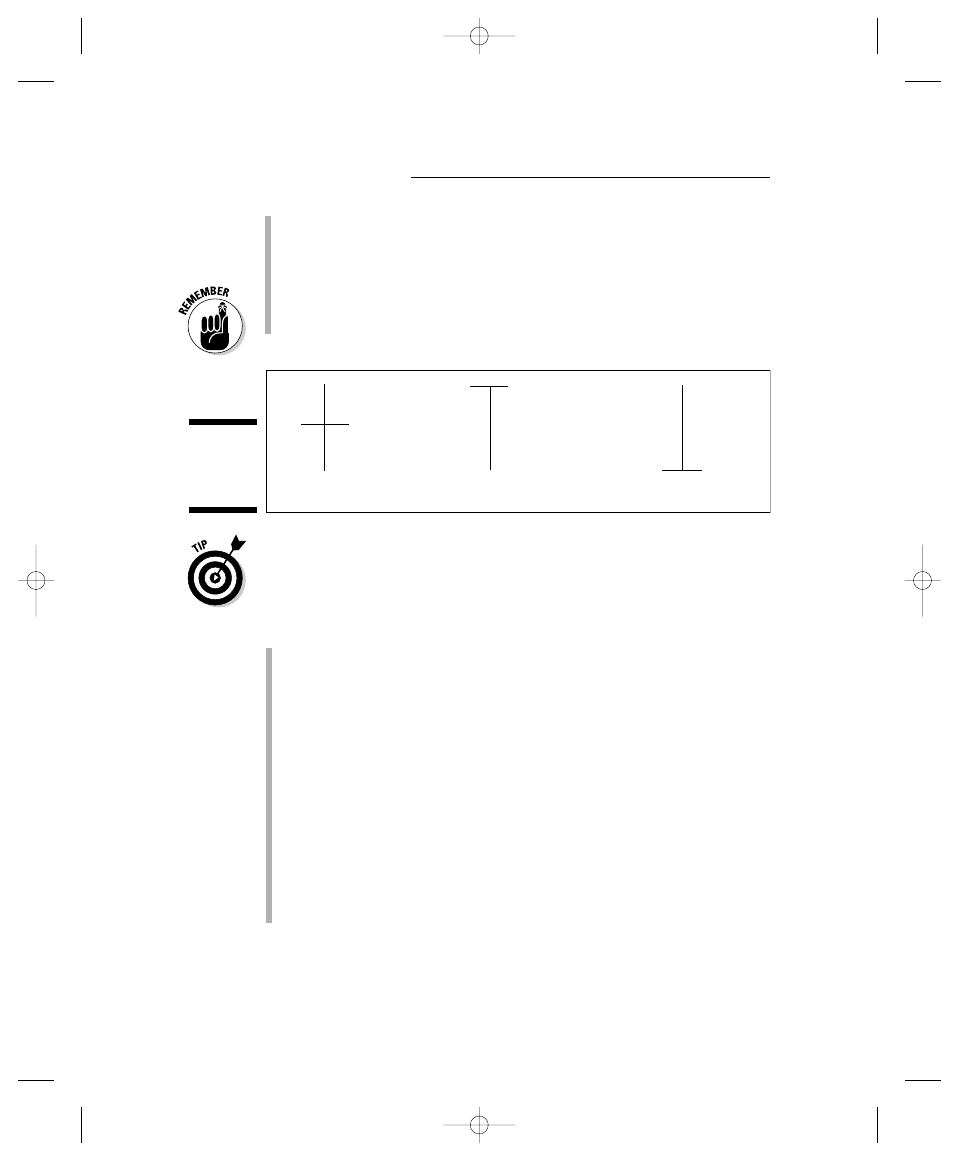
Gravestone: A gravestone doji looks like an upside-down dragonfly, with
a longer upper shadow — the dragonfly appears to be flying downward.
Gravestone dojis occur when buyers push prices higher but can’t get
prices to close at those higher levels. If a gravestone doji appears after a
rally, it can signal that a reversal is coming.
On the other hand, a gravestone doji in a downtrend may mean that a
bottom is forming.
Barbara Rockefeller points out in Technical Analysis For Dummies (Wiley) that
a doji is best interpreted in the context of the pattern that you see in the pre-
ceding candlesticks.
Candlesticks can be superior to bar charts for the following reasons:
Trends are easier to spot. For example, a sea of rising green (or white),
meaning a large grouping of bullish candles on a candlestick chart, is
hard to mistake for anything other than a strong uptrend. Because can-
dlesticks tend to have a body in most cases, the overall trend of the
market often is easier to identify.
Trend changes are easier to spot. Candlestick patterns can be dramatic
and can help you identify trend changes before you can recognize them
on bar charts. Some candlestick patterns are reliable at predicting future
prices.
Shifts in momentum are easy to spot. Conditions in which a security is
oversold and overbought, along with trends and other kinds of indica-
tors, may be easier to spot on candlestick charts than on bar charts
because of the presence of doji candles and color. For example, an
engulfing pattern (see Figures 7-3 and 7-6 and the section “Engulfing the
trend,” later in this chapter), which can be either negative or positive, is
easier to spot in a candlestick chart.
PLAIN DOJI
DRAGONFLY DOJI
GRAVESTONE DOJI
Figure 7-2:
The three
basic doji
bars.
110
Part II: Analyzing the Markets
12_287224-ch07.qxp 5/27/08 10:58 PM Page 110
Candlestick bars that are changing in size, especially at the end of a market
run in a single direction, often signal that traders have reached a transition
point in how they’re looking at the market, and that an important change in
the trend may have been reached. For example, a long green (white) bar after
a big rally often means that buyers are out of gas, and that’s when you need
to start paying attention to other signs of weakness. The same can be said
after a long red (black) bar that follows a major bout of selling — you can
start looking for signs of strength.
Getting the Hang of Basic
Charting Patterns
Charting patterns can get out of control if you’re not careful, so I like to keep
it simple. That means that if you understand the basic tenets of charting and
the most important, easy-to-spot patterns, you can make solid trading deci-
sions as long as you remember that charting is most useful to you when you
couple it with fundamental and situational analysis of the markets.
So before you start looking for patterns, follow this three-step rule:
1. Get the feel for whether the basic trend is up or down.
Just look at the chart. If the price starts low and rises, it’s an uptrend. If
the opposite is true, it’s a downtrend.
2. Gauge how long that trend has been in place.
Using longer-term charts sometimes can help you spot just how long the
trend has been in place.
3. Consider the potential for a reversal.
The longer the trend has been in place, the higher the chance that it can
turn the other way.
After you get comfortable with this process, you can advance to looking for
the charting patterns that I describe in the sections that follow.
Analyzing textbook base patterns
Bases, whether tops or bottoms, are sideways patterns on price charts; they’re
pauses in the uptrends or downtrends in security prices. Bases are formed as
111
Chapter 7: Getting Technical Without Getting Tense
12_287224-ch07.qxp 5/27/08 10:58 PM Page 111
some traders take profits and other traders establish new positions in the
other direction.
In futures markets, someone always buys, and someone always sells. So a
base is what happens when the number of buyers and sellers is in fairly good
balance and prices remain steady.
Bases, in general, are points in the pricing of a security at which the market
takes a break before deciding what to do next. A base can come before the
market turns up or down, and it can last for a long time, even years. If, after it
forms a base, the market decides that more selling is called for, a new down-
turn, or falling prices, can start on a candlestick chart, despite the fact that
the market has based after a decline. When the base forms after a rally, it can
either resolve as a top, and the market can fall, or indicate only a pause in a
continuing uptrend. You can’t, however, predict with full certainty which way
the markets will break after they pause (in either direction).
Figure 7-4 (later in this chapter) shows some key technical terms, including
price tops and bottoms and basing patterns.
A base and a bottom accomplish the same thing, except that they can occur
at different places. A base can be seen after the market climbs, after the
market falls, or even during an uptrend or downtrend. A bottom usually is
seen in retrospect, after the market rallies from the basing pattern. Similarly,
a top usually is seen in retrospect, after the market declines from a basing
pattern.
Although you can’t predict tops and bottoms with 100 percent certainty, some
reliable indicators can help you make better guesses. These indicators are
Specific patterns seen in price oscillators, such as when the RSI and
MACD indicators move in different directions than the price of the
security (see Chapters 8 and 13).
Major turns in market sentiment (see Chapter 9).
Key price movements above and below important price areas, such as
resistance or support points (see Figure 7-4 and the section “Using lines
of resistance and support to place buy and sell orders,” later in the
chapter).
Downtrends
Here are some important factors to remember about a base at the bottom of
a downtrend:
A good trading bottom usually comes when everyone thinks that the
market will never rise again.
112
Part II: Analyzing the Markets
12_287224-ch07.qxp 5/27/08 10:58 PM Page 112

Downtrends can die in two ways: in a major selling frenzy or over a long
period of time in which a base forms.
At some point, all markets become oversold, and they bounce. Any such
bounce can be the beginning of a new bullish uptrend in the market.
After a long time of falling prices, you have to be ready to trade all turns
in the market, even if you get taken out as the downtrend reasserts itself.
The most important area of a chart that is making a bottom is known as sup-
port. Support is a chart point, or series of points, that puts a floor under
prices. That’s where the buyers come in.
Uptrends
Here are some important factors to remember about a base at the top of an
uptrend:
Most participants at the top in the market are bullish, which is why
three or four failures often occur before the market breaks toward the
downside.
Downturns that follow long-term rallies tend to spiral downward for a
long time. That’s exactly what happened with the multiyear chart of the
dollar index shown in Figure 7-5, later in the chapter.
Tops are more likely to lead to reflex rallies, meaning that long-term
downtrends are likely to be more volatile than are uptrends. For short
sellers, it’s a very rough ride, no matter which market you’re trading.
The most important area of a chart that is making a top is known as resis-
tance. Resistance is a chart point, or series of points, that puts a ceiling above
prices. That’s where sellers come in.
Using lines of resistance and support
to place buy and sell orders
Drawing lines of resistance and support for a particular market or security (see
Figure 7-4) can help you maintain your focus when placing your buy, sell, and
short-sell orders. Buy orders usually are placed above resistance lines, and sell
orders and sell-short orders are placed below support levels. One thing you can
count on in the futures markets is the disciplined way by which traders respond
to the signals. That’s what makes technical analysis ideal for futures trading.
Support and resistance lines define a trading range. In Figure 7-4 (later in the
chapter), the trading range is called a basing pattern, because it precedes a
breakout.
113
Chapter 7: Getting Technical Without Getting Tense
12_287224-ch07.qxp 5/27/08 10:58 PM Page 113
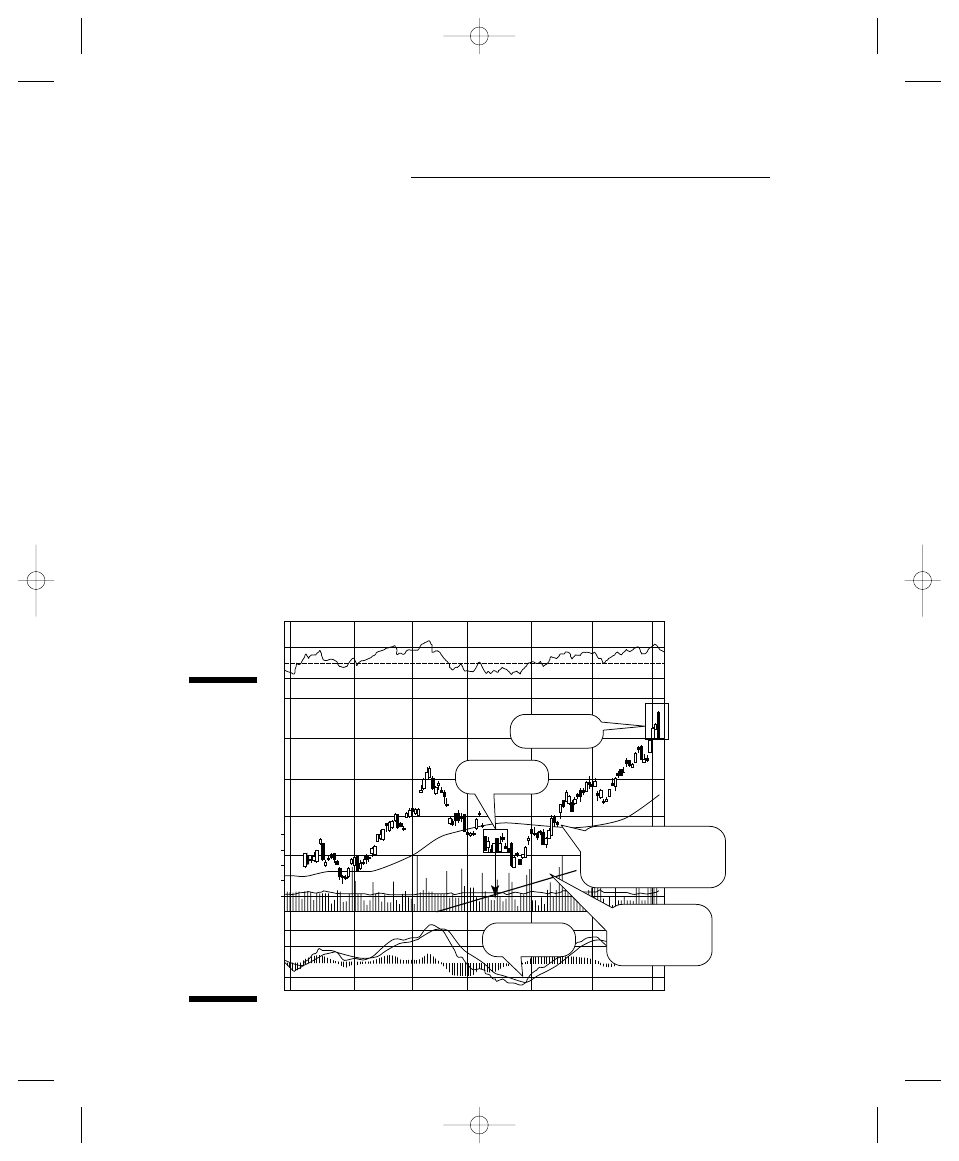
Support and resistance levels can be fluid, flowing up and down within the
trading range. When combined with a moving average (see the next section),
they provide a useful tool that indicates how market exit and entry points are
progressing in relationship to the price of the security.
Moving your average
Moving averages are lines that are formed by a series of consecutive points
that smooth out the general price trend. Moving averages are a form of a
trend line.
In terms of a security’s closing price, for example, a 50-day moving average is
a line of points that represent the average of the closing prices of the security
during each of the previous 50 days of trading.
Figure 7-3 shows two classic moving averages that are frequently used in
technical analysis, the 50-day and 200-day moving averages. This particular
figure shows a bullish long-term trend in which the bond fund is trading
above the 200-day moving average and a crossover in which the price of the
bond fund began trading above the 50-day moving average, a sign that prices
were moving higher.
TLT Daily
MA(50) 91.43
MA(200) 88.29
3-Jun-2005 0:96.90 H:97.00 L:95.20 C:95.25 V:5.6M Chg:-0.79
Engulfing
50-day moving average
and bullish cross-over
200-day
moving average
Harami
RSI(14) 66.9
MACD(12.28.9) 1.11
Dec
2005
Feb
Mar
Apr
May
Jun
EMA(60)
70
50
30
-.50
85.0
5M
4M
3M
2M
1M
95.0
92.5
90.0
MACD
Figure 7-3:
Moving
averages
point to a
bullish trend
in 20-year
T-bonds,
while
engulfing
and harami
patterns
point to
trend
changes.
The MACD
indicator
confirms
the shift.
114
Part II: Analyzing the Markets
12_287224-ch07.qxp 5/27/08 10:58 PM Page 114
Moving averages come in many different types, but for illustrative purposes, I
use these four:
20 days: The 20-day moving average traditionally is thought of as a
short-term indicator.
50 days: The 50-day moving average is considered a measure of the
intermediate-term trend of the market.
100 days: More pros are starting to use the 100-day average. The 100-
day average gives the pros an edge over the public, as most people tend
to follow the 20- and 50-day lines. The 100-day average gives you a
chance to participate in the market’s action sandwiched between the
very long-term trend measured by the 200-day average and the shorter
term periods measured by the 20- and 50-day lines.
200 days: The 200-day moving average is considered the dividing line
between long-term bull and bear markets. Use this average to make very
long-term decisions about the trend of the market.
As a general rule, when a market trades above its 200-day moving average,
the path of least resistance is toward higher prices; however, no hard-and-fast
rules exist. Some traders prefer to use a 21-day moving averagerather than
the 20-day average, while others think moving averages are useless altogether.
I personally like using them to define dominant trends in the markets but not
necessarily as guides to placing buy or sell stops.
Short-term charts, such as the charts used for day trading, where one price
bar can equal as short a period of time as 15 minutes, have moving averages
that measure minutes rather than days. The same decision rules apply, though.
The exception for me is when a market has been in a major uptrend or down-
trend for an extended period, and it suddenly breaks below or above the 200-
day average. This can signal that the long-term trend in that market has made
a drastic change in the opposite direction.
Most trading software programs offer moving averages as part of their default
charting systems. You may have to adjust these moving averages to your par-
ticular trading style or delete them if you decide that you don’t like them.
Also, remember that the averages I describe here are good places to start. As
you gain experience, you’ll find that shaving off or adding a day or two to the
commonly used moving averages may give your trading a slight edge at
times. The important thing is to remember the main concept first, and then
you can start to add your own wrinkles.
The moving averages that you use in futures trading more than likely will be
defined in terms of minutes or hours rather than days or weeks — depending,
of course, on the time frame you use to make your trades. Nevertheless,
knowing the longer-term trends of the markets in which you’re trading is
essential for knowing when to make trades with the trend rather than against
it. The basic rules are the same.
115
Chapter 7: Getting Technical Without Getting Tense
12_287224-ch07.qxp 5/27/08 10:58 PM Page 115
You can give your position more room to maneuver by using longer-term
moving averages. In the futures markets, however, that strategy is not always
the best, because some markets are more volatile than others. If you’re using
moving-average trading methods, your best bet is to back test several differ-
ent combinations of moving averages for each specific market.
Back testing is a trading method by which you review or test your proposed
strategy over a period of time by using historic charts. For example, if you
want to see how a market relates to its 20-day moving average, you can look at
a five-year chart that includes the 20-day moving average and gauge what
prices do when that market is priced above or below that average. When back
testing, you’re better off looking at many different indicators and combinations
of them. You usually can find a combination that works best for any particular
market. When you back test your strategy, you improve your chances of finding
the best combination of indicators to keep you on the right side of the trend.
Breaking out
A breakout happens when buyers overwhelm sellers and prices begin to rise.
Breakouts usually follow some kind of basing pattern or sideways movement
in the market. A good rule is that the longer the base, the higher the likelihood
of a good move after the underlying security breaks out of its trading range.
Figure 7-4 shows a great example of a chart breakout coming out of a head-
and-shoulders pattern, a basic and easy-to-find pattern that can be found in
all markets. Notice the almost perfect head-and-shoulders bottom in the
crude oil contract marked H for the head and S for the left and right shoul-
ders, as it forms the basing pattern that precedes the crude-oil price breakout
in textbook fashion.
Some of the characteristics of a head-and-shoulders base are that it
Is a common but not always reliable technical pattern. It doesn’t always
point to a breakout the way it does in Figure 7-4.
Always is shaped like a head and shoulders. Arrows in Figure 7-4 illus-
trate how the volume drops off as the shoulders are being formed, a
textbook characteristic of the head-and-shoulders bottom. Head-and-
shoulder tops are the same formation turned upside down. When they
happen, they can lead to a breakdown in the underlying asset.
Indicates that any resulting breakout will take out the resistance at the
neckline of the head-and-shoulders pattern.
Results in an increase in share volume as the price breaks out above the
head-and-shoulders bottom (see the five-pointed star in Figure 7-4). The
volume increase is another important characteristic of a chart breakout.
It indicates that many buyers are interested in the security and that
prices are likely to go higher.
116
Part II: Analyzing the Markets
12_287224-ch07.qxp 5/27/08 10:58 PM Page 116
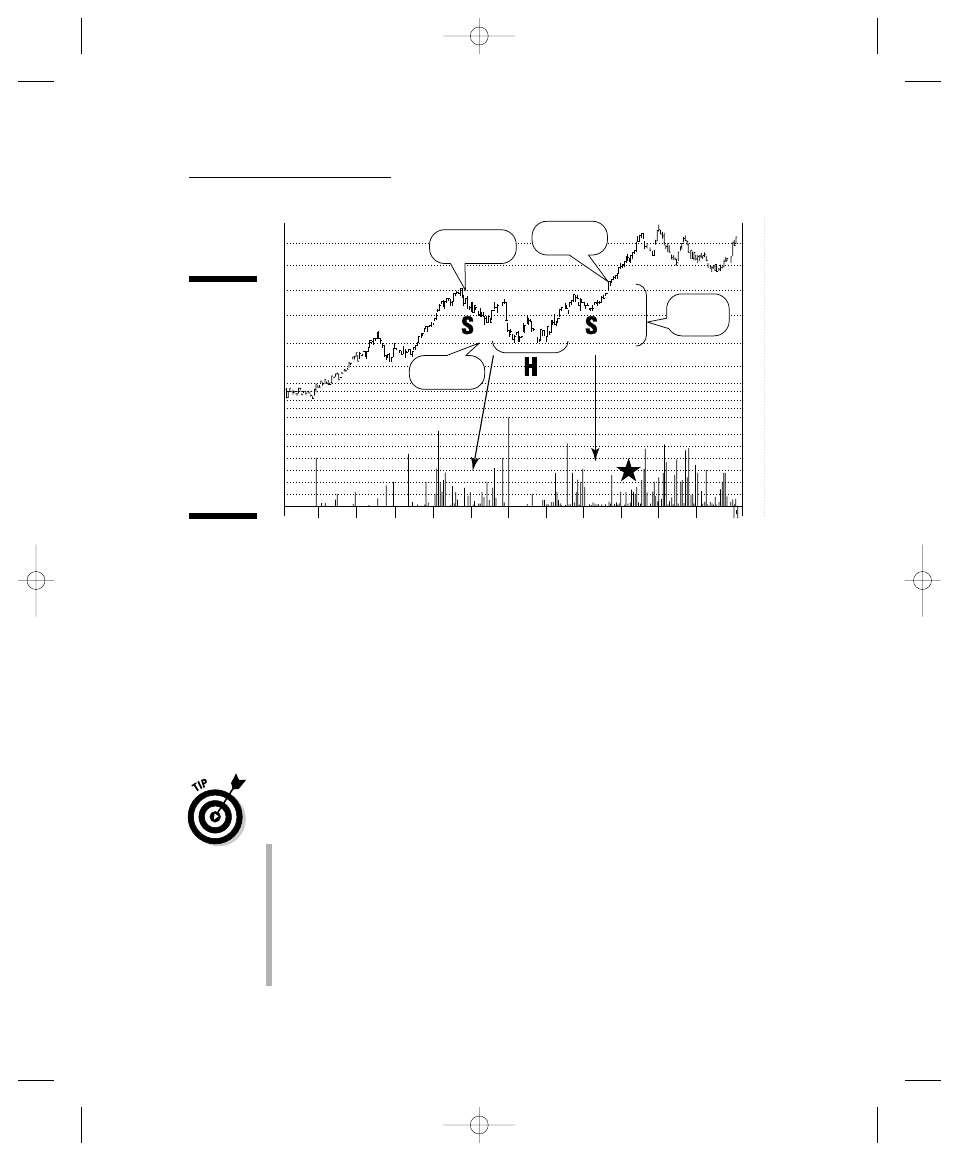
Using trading ranges to establish
entry and exit points
Markets often trade in channels. As is what happens when a market trades up
or down within defined borders. It is sort of a trading range, except usually
trading ranges are defined as markets that move sideways, which are in fact
horizontal channels. Don’t get too bogged down in the finer points, though.
Just remember that markets tend to move within upper and lower limits.
Sometimes the upper and lower limits are horizontal (trading ranges) and
sometimes the upper and lower limits slant (channels.) Figure 7-5 shows a
rising or uptrending channel. The upper line defines the top of the channel,
and the lower line defines the bottom of the channel.
Regardless of whether the trend is up or down, channel lines can point to
great places to set trading entry and exit points for these reasons:
The longer the channel holds in place, the more important a break
above or below it becomes for a particular market or security.
Channel lines can indicate a multiyear bear market if the breakout
occurs below the rising channel. (That’s what happened to the dollar in
the late 1990s in Figure 7-5.)
Channel lines can indicate that a major bottom is in place and that a
bear market has come to an end if a downtrend line is broken. (That’s
what happened to the dollar in 1985 and 2005 in Figure 7-5.)
56
52
48
44
40
37
35
34
33
32
1826
1500
1250
1000
750
500
250
56
52
48
44
40
37
35
34
33
32
1826
1500
1250
1000
750
500
250
Jul
Jun
Aug
Sep
Oct
Nov
Dec
Jan
Feb
Mar
Apr
May
Resistance
Breakout
Support
Basing
pattern
Figure 7-4:
Here’s a
good look at
lines of
resistance
and support,
a breakout,
a base
pattern, and
a classic
head-and-
shoulders
pattern.
117
Chapter 7: Getting Technical Without Getting Tense
12_287224-ch07.qxp 5/27/08 10:58 PM Page 117
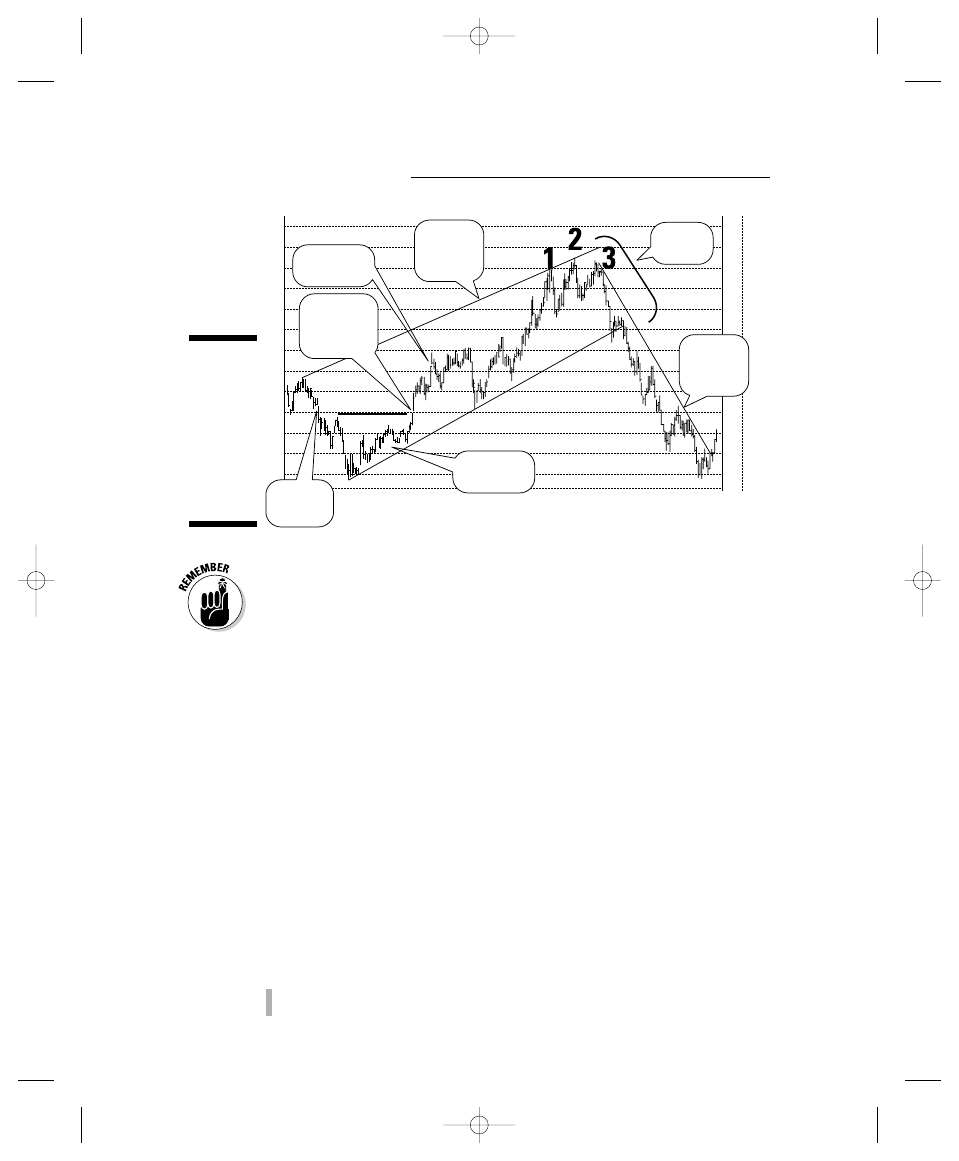
Resistance is the opposite of support, because it’s a price point on a chart
above which prices cannot move higher. It’s also the place where sellers are
lurking and a place where breakdowns ultimately occur. A breakdown is a
point in the market when sellers overwhelm buyers and prices begin to fall.
A breakdown usually comes after a market forms a top. Figure 7-5 shows the
U.S. Dollar Index making a multiyear top. In this case, the top actually is indi-
cated by a triple top formation, because the dollar failed to move higher in
three separate attempts. (The numbers 1, 2, and 3 correspond to the three
tops, or failures, before the breakdown began in Figure 7-5.)
As with most definitive bases at the top of an uptrend, the crucial signal is
the failure to make a new high for the move. Note how the number 3 top is
lower than the number 2 top and then is followed by fast and furious selling.
Seeing gaps and forming triangles
Gaps and triangles are two of the more common occurrences on price charts.
Each has its own meaning and importance.
Triangles, or wedge formations, can predict future price actions more reliably
than gaps, but gaps can also be useful.
The three basic triangle shapes found on price charts are
Ascending triangles: These triangles point upward and can be good
signs of a price pattern with an upward bias (refer to Figure 7-5). In that
1990s
2000s
128
124
120
116
112
108
104
100
96
92
88
84
81
128
124
120
116
112
108
104
100
96
92
88
84
81
79
Runaway
gap
Ascending
triangle
Down
trend
line
Rising
channel
Upper
channel
line
Exhaustion
gap
Bullish
breakaway
gap
Figure 7-5:
Gaps,
channels,
trend lines,
triangles,
and other
basic
technical
analysis
patterns.
118
Part II: Analyzing the Markets
12_287224-ch07.qxp 5/27/08 10:58 PM Page 118

example, the Dollar Index uses the lower rising channel line as support
to build an ascending triangle. A horizontal line (above the triangle)
marks the resistance point that completes the triangle.
Descending triangles: These triangles point downward and are the
opposite of ascending triangles, usually coming before downtrends.
Symmetrical triangles: These triangles are symmetrical in that they
show neither an upward nor downward trend and thus are unpre-
dictable price formations.
Gaps, on the other hand, are unfilled points on price charts. They are more
frequently visible and therefore less important in the price charts of thinly
traded instruments, such as obscure futures contracts and some small
stocks. However, when they occur in more common contracts and more
heavily traded stocks, they can be much more important and have the follow-
ing effects (Figure 7-5 shows all three such gaps):
Breakaway gap: This gap happens when an underlying security gets out
of the gate very strongly at the start of the trading day. Breakaway gaps
often come after the release of economic indicators, such as the
monthly employment report. They are signs of a strong market.
Breakaway gaps are more meaningful when they are bigger than the
usual trading range of a security. For example, if you know that a futures
contract usually trades within a range of three point ticks and it opens
ten ticks higher or lower, the result is a major breakaway gap.
Runaway gap: This gap occurs when a second gap appears on a price
chart in the same direction as a breakaway gap. Runaway gaps are signs
of continuing and accelerating price trends.
Exhaustion gap: This gap is a sign that a market has run out of buyers or
sellers and indicates almost a last gasp in the market before the trend is
reversed. Some exhaustion gaps may have telltale candlestick patterns
associated with them, such as a doji, cross, or hanging man (see the sec-
tion “Hammering and hanging for traders, not carpenters” later in this
chapter).
Seeing through the Haze: Common
Candlestick Patterns
Even though candlestick patterns are not 100 percent reliable, they certainly
are worth paying attention to. As you gain more and more experience, you’ll
come to know many different patterns. In this section, I concentrate on the
more common and meaningful patterns that can serve as signals that a
market is starting to reverse course.
119
Chapter 7: Getting Technical Without Getting Tense
12_287224-ch07.qxp 5/27/08 10:58 PM Page 119
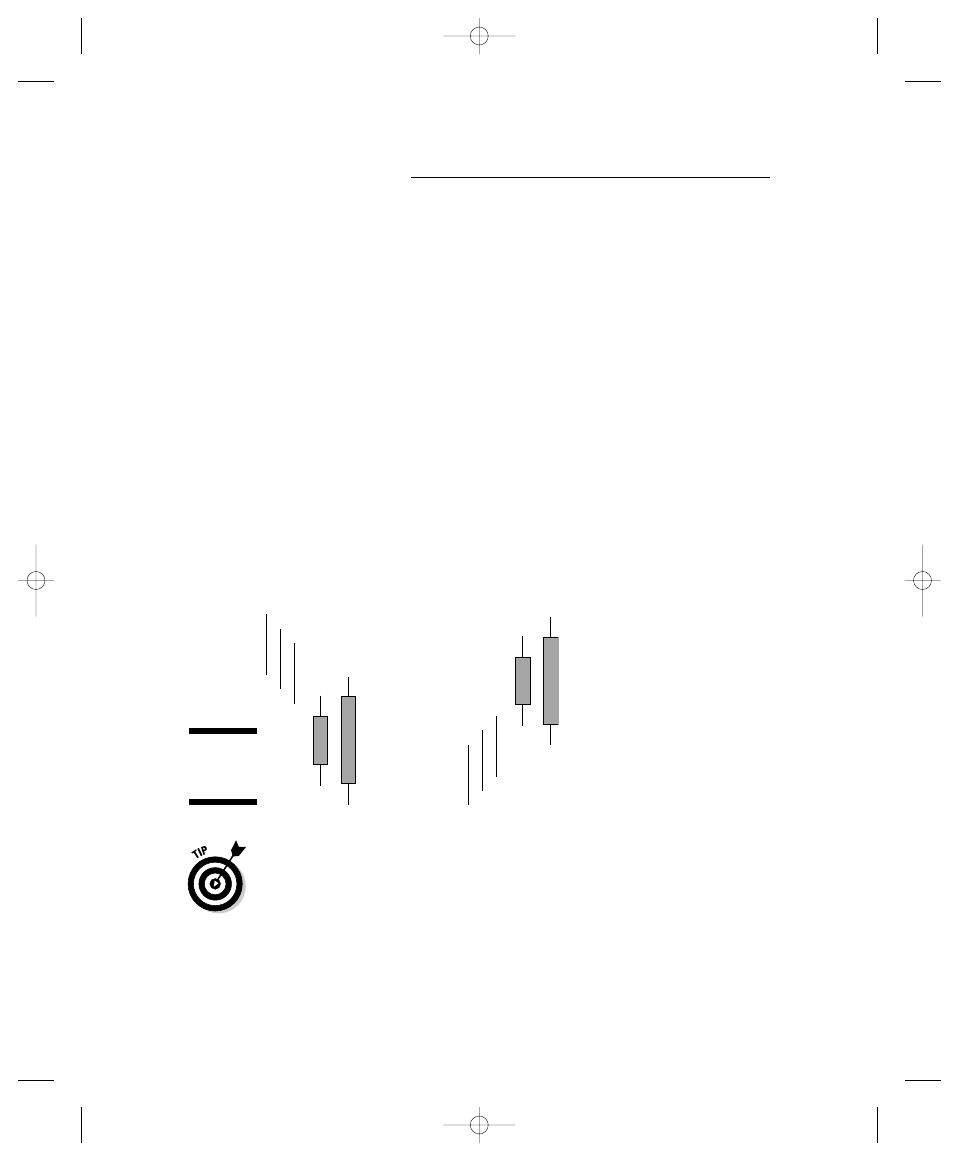
Engulfing the trend
An engulfing pattern is what you see when the second (or next) day’s
real body, or candlestick, completely covers the prior day’s candlestick.
An engulfing pattern signals a potential reversal. Figure 7-6 shows a
schematic of bullish and bearish engulfing patterns, and Figure 7-3 shows
a real-time engulfing pattern. Note that the body of the second candle is
larger than the first candle and that it predicts a change of the trend. The
bullish engulfing pattern predicts a trading bottom, and the bearish engulfing
pattern, a top. Action on the third day often is key to whether the pattern
will hold.
Engulfing patterns are characterized by a second-day candlestick that is
larger than, or engulfs, the first day’s candlestick. The larger candlestick
predicts a potential change in the trend of the underlying security’s price.
For example, a bullish engulfing pattern usually appears at or near a trading
bottom and predicts an upturn in prices, while a bearish engulfing pattern
appears at or near the trading top and predicts a downturn in prices.
In Candlestick Charting Explained (McGraw-Hill), Greg Morris, a mutual fund
manager (PMFM funds), software designer, and an early proponent of candle-
stick charting, offers several important rules of recognition for engulfing
patterns:
Engulfing
Bullish
Bearish
Figure 7-6:
The engulfing
pattern.
120
Part II: Analyzing the Markets
12_287224-ch07.qxp 5/27/08 10:58 PM Page 120
A definite trend must be underway.
The second-day candlestick’s body must completely engulf the prior
day’s candle. In other words, the high and low prices of the second-day
candlestick must be higher and lower than the respective high and low
for the previous day. Morris points out the subtleties of engulfing pat-
terns by indicating that if the tops and bottoms of both candlesticks are
identical, the pattern isn’t engulfing, but if one or the other is equal and
the second-day candle still engulfs the previous day’s candle on the
other end, the pattern is valid.
The color of the first day’s candle must reflect the trend. So if prices
are trending upward, and the first candle is red, the pattern doesn’t hold.
The second day’s candle must be the opposite color of the prevailing
trend. This rule is the corollary to the preceding rule. If the first day’s
candle is red or black, showing a downtrend in prices, the second day’s
candle must be green or white.
Figure 7-3 (earlier in the chapter) offers a great example of a real-life engulfing
pattern that meets all criteria. Notice the following:
The bar started out at a higher opening price, but clearly closed at a
lower level, a sign of a clear reversal.
The engulfing bar was huge compared to the prior day.
Hammering and hanging for traders,
not carpenters
The hammer and the hanging man also are common patterns. A hammer is a
small white candlestick with a long shadow, while a hanging man is a small
black candlestick with a long shadow (see Figure 7-7).
Making sense of these patterns is difficult, because they can appear virtually
anywhere on just about any chart. They are best used after a long series of bars
of the same color and are most reliable as indicators of a possible reversal.
A white-body hammer that follows a long series of black bars in a downtrend
usually means that a reversal is coming. A black hanging man pattern that
appears after several white bars in an uptrend usually means that some sell-
ing and a downturn is on the way.
121
Chapter 7: Getting Technical Without Getting Tense
12_287224-ch07.qxp 5/27/08 10:58 PM Page 121
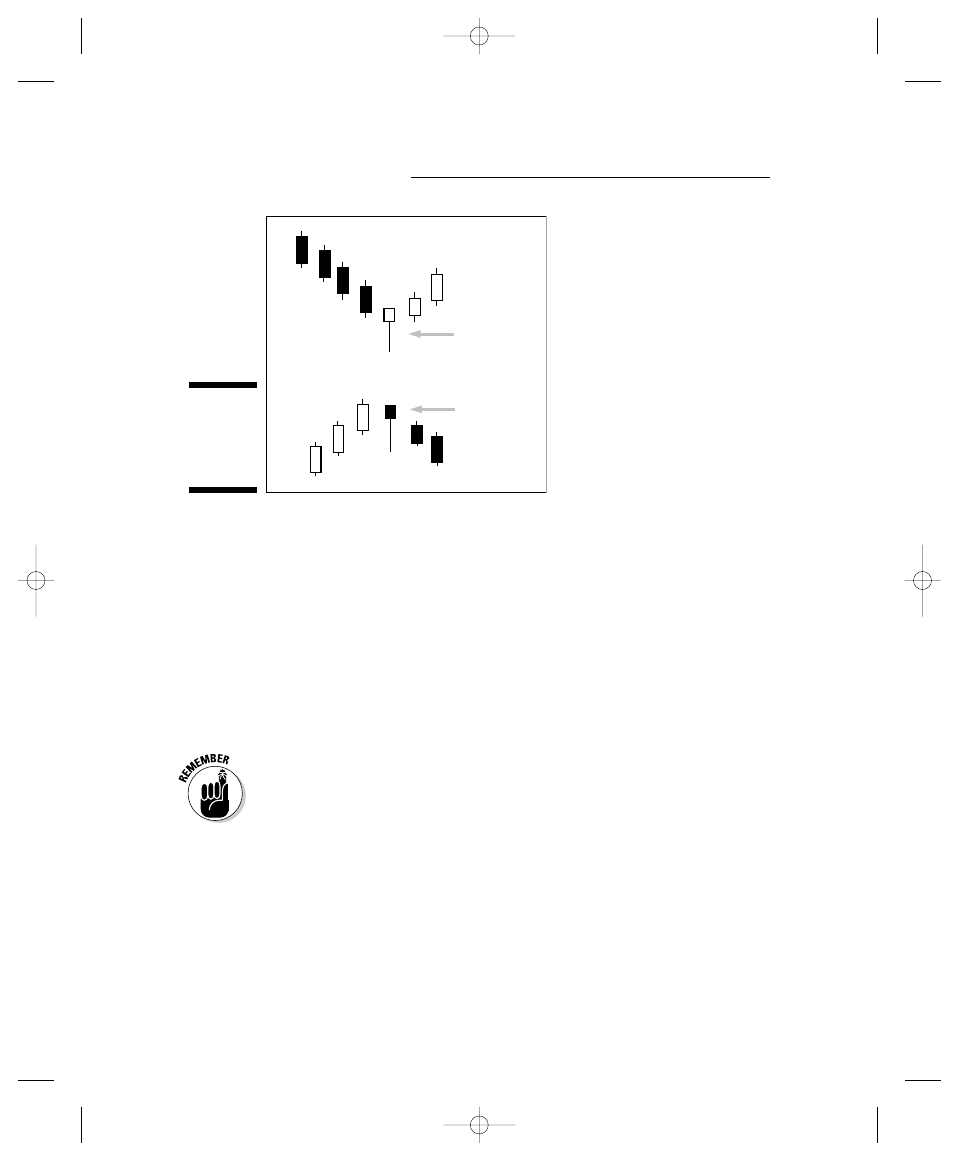
Seeing the harami pattern
A harami pattern is an excellent example of a reversal pattern. It forms when
a long candlestick of one color is followed by a smaller candlestick of another
color. The color of the second candle indicates which way the market is likely
to go. You can see it in a real-world example back in Figure 7-3.
The harami is an excellent pattern for indicating a trend change or pause.
The stock needs to be in a strong trend, and for the harami to be a valid pat-
tern, the second real body must form completely inside the first. The color of
the second candle needs to be the opposite of the first. Confirmation of this
pattern is recommended.
A harami pattern is most useful when a trend has been in place for some
time, like the six-week downtrend in Figure 7-3, but you need to keep close
tabs on the volume along with the candlesticks (the way I explain in the next
few paragraphs).
Say, for example, that you’ve been selling bonds (I use the exchange traded
fund TLT in this example, but it is equally applicable to bond futures) short for
several days and suppose that you’re starting to get comfortable with a
downtrend when you spot a long red (black) candle on your chart. Your initial
response, especially if you’re using bar charts, is to think that the downtrend
is extending and that you’re going to make more money in the next few days.
HAMMER
HANGING
MAN
Figure 7-7:
Hammer
and hanging
man
patterns.
122
Part II: Analyzing the Markets
12_287224-ch07.qxp 5/27/08 10:58 PM Page 122
However, on the next day, prices reverse and close higher after other short
sellers have covered their short positions.
Although the bar for the second day is green (white), it’s nevertheless
smaller as new short sellers come into the market at the end of the day.
They’re thinking that the downtrending security is a good opportunity to
initiate new short sales after missing out on the last move.
You gain a more accurate picture of the situation by looking at the volume
on the two days, as shown by the down-pointing arrow in Figure 7-3. Average
volume on the long black day followed by higher volume on the short white
day suggests that the trend is about to change, and you indeed have a harami
pattern.
The action on day three tells you whether the harami pattern will hold true
and send prices higher.
Figure 7-3 shows real-time candlestick patterns that defined the trend in the
bond market in 2005. The chart is of the Long-Term Bond Exchange-Traded
fund (TLT). The TLT is closely related to the U.S. 10-year Treasury note and
the U.S. Long Bond (30-year) futures contracts. The TLT can be traded both
long and short, and offers a good trading vehicle for investors who want to
participate in the overall trend of futures markets without actually opening
an account with a futures broker. The commission and the effort spent trad-
ing the TLT is the same as with trading any stock.
123
Chapter 7: Getting Technical Without Getting Tense
Bears, bulls, and a bunch of crazy names
According to John Murphy’s
Technical Analysis
of the Financial Markets (New York Institute of
Finance), 68 different candlestick patterns are
commonly used by futures traders. Murphy lists
8 bullish continuation patterns, 8 bearish con-
tinuation patterns, and 26 bullish and bearish
reversal patterns. Some candlestick patterns
are composed of two, three, four, and five can-
dlesticks. Some of my favorite names for pat-
terns are
Abandoned baby
Dark cloud cover
Concealing swallow
Three white soldiers
Three black crows
12_287224-ch07.qxp 5/27/08 10:58 PM Page 123

Several important technical-analysis-related points to get out of the harami
pattern in Figure 7-3 include
The arrow shows the close correlation between the low-volume red or
down day and the higher volume up day and clearly conforms to the
rules laid out by Morris where a low-volume down day is followed by a
higher volume up day.
Day three is an up day, confirming the trend change.
The harami was followed by more selling until the market hit a lower
bottom.
The MACD indicator also correctly correlated the bottom by crossing
over a few days after the harami pattern occurred.
This is a perfect example of how you can use candlestick charts and standard
indicators together to form accurate buy and sell signals.
124
Part II: Analyzing the Markets
12_287224-ch07.qxp 5/27/08 10:58 PM Page 124

Chapter 8
Speculating Strategies That Use
Advanced Technical Analysis
In This Chapter
Understanding one market’s effects on other markets
Using moving averages, oscillators, and trend lines to understand your market
Aligning technical indicators to make a trade
I
nexperienced investors tend to ignore the value of a good understanding
of technical analysis. That ignorance, on the part of those who ignore
charting, is, of course, bliss for traders like you (and me), because it gives
you an advantage, albeit a small one, in light of the fact that the big guys with
the big money are all chartists, and most of them are excellent at the craft.
Bob Woodward, in his book about Alan Greenspan, aptly entitled Maestro
(Simon & Schuster), describes how the former chairman of the Federal
Reserve had one of the best technical charting data arrays in the world and
was an avid watcher of the financial markets, using charts during his time at
the Federal Reserve.
The truth is that any good speculator with an ounce of honesty will tell you
that they rely as much on their charts as they do on information gathered by
other means. The true money-making trader uses both fundamental and tech-
nical analyses. To be sure, analyzing the futures markets is both an art and a
science and just a little bit of cooking, like when you add that extra salt and
pepper to a pot of chili.
The bottom line is that your trading will be enhanced when you apply what
you know about the economy and the markets to your charts. And in this
chapter, I put together several topics from the fundamental and technical
worlds to help you do just that.
13_287224-ch08.qxp 5/27/08 10:58 PM Page 125
Using Indicators to Make
Good Trading Decisions
Indicators are instruments that help you confirm what you see when you look
at a chart. They are an intrinsic part of trading if you use technical analysis.
Graphs produced by the indicators are displayed along with the prices of the
underlying asset on the same chart. The indicators are derived from formulas
whose components include the prices of the underlying asset.
The more common indicators are known as moving averages, oscillators,
channels (of which there are several kinds), and trend lines. These indicators
are part of most price charts in the futures markets (see Figure 8-1).
Making good use of moving averages
A moving average is a series of points that enable you to determine which
way a major trend is moving within a market and whether your trade is with
or against the trend (see Chapter 7). Long-term charts use days and weeks
for moving averages. Short-term, intraday (within the same trading day)
charts use minutes to create moving averages. Generally speaking, moving
averages are useful tools because
Markets trade higher when prices are consistently above the moving
average.
When markets cross over a moving average in one direction or the other
(above or below), you need to be mindful of a potential change or shift
in the existing trend.
The longer the moving average, the more important the trend and trend
reversals become. For example, when the dollar crosses above its 200-
day moving average, the chance that the trend has changed from a
falling market to one that’s about to rise is greater than when it crosses
a 50-day moving average.
Trading by using only moving averages is risky business. Market prices can
jump above and below them many times before actually starting a new trend or
continuing an old one. Prices repeatedly jumping above or below a moving aver-
age during a short period of time are a great example of a whipsaw. Whipsaws
can occur when you use extremely short-term moving averages or even when
you use long-term moving averages (like the 200-day moving average).
126
Part II: Analyzing the Markets
13_287224-ch08.qxp 5/27/08 10:58 PM Page 126
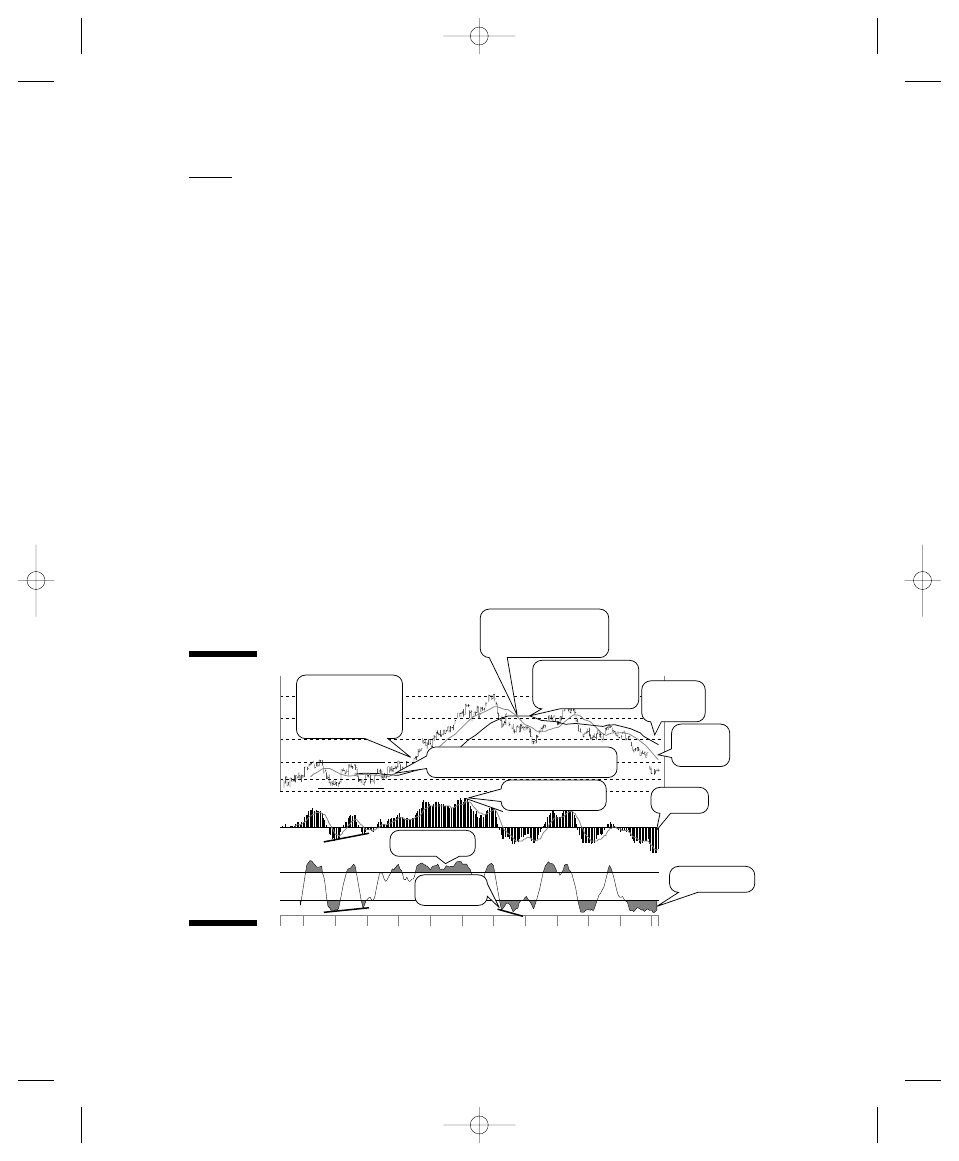
Comparing multiple moving averages of varying lengths (20, 50, 100 and 200
days) with the daily price for an instrument enables traders to find important
breakout and crossover points that they use to formulate their trading plans.
Figure 8-1 compares these key data from June 2004 to June 2005 with that of
the euro currency. Note how in October 2004 the value of the euro rallied
above its 20- and 50-day moving averages and how the 20-day moving average
of the euro moved above its 50-day moving average, creating a bullish
crossover. A bullish crossover is an episode in which a shorter-length moving
average crosses above a longer-term moving average, which usually is good
confirmation of a rising trend and a signal to buy the underlying asset. A bear-
ish crossover is the opposite, when a shorter-length moving average falls
below a longer-term moving average. It usually confirms a falling trend. Figure
8--1 highlights a bearish crossover.
A good trading technique is to buy a small stake in a market when a bullish
crossover occurs. That’s what you see labeled as “buy point 1” in Figure 8-1.
You can see that the euro moved sideways for a bit longer and then broke
out; that’s “buy point 2” in Figure 8-1.
The buy signal held true, and the euro’s rally stayed alive until the bearish
crossover occurred and the euro fell below both its 20-day and 50-day
moving averages in January 2005.
Jun
Jul
Aug
Sep
Oct
Nov
Dec
Jan
Feb
Mar
Apr
May
J
Oversold
MACD rollover.
20 day
M.A
119
121
124
128
132
136
6/8/05 22.85 EURO INDEX PHLX (ECUX) 1 Year Log Moving Average 20-50-200
Stochastics 14-5
Bearish crossover.
Sell.
Buying The
Breakout. Buy
point 2.
50 day Moving
average (M.A.)
200 day
M.A.
MACD
Stochastics
Overbought
Bullish Crossover Buy point 1
Figure 8-1:
Two buying
points —
Buy point 1,
when you
can
establish
your
position,
and Buy
point 2,
when you
can add
to your
position.
127
Chapter 8: Speculating Strategies That Use Advanced Technical Analysis
13_287224-ch08.qxp 5/27/08 10:58 PM Page 127

Figure 8-1 is important because the chart points to a significant amount of
information about the value of the euro, including the following:
Downtrends: When the euro traded below its 20-, 50-, and 200-day
moving averages, it progressed through short-, intermediate-, and long-
term downtrends.
A negative crossover: When both the 20- and 50-day moving averages
crossed below the 200-day moving average, the resulting negative
crossover confirmed a long-term downtrend.
A positive crossover: When the 20-day moving average crossed above
the 50-day moving average, the resulting positive crossover confirmed
an uptrend.
A sustained uptrend: The rally in the euro that followed the positive
crossover points to a sustained uptrend.
Understanding and using oscillators
Oscillators are mathematical equations that are graphed onto price charts
so you can more easily decide whether the price action is a correction in an
ongoing trend or a change in the overall trend. Oscillators usually are graphed
above or below the price charts.
Traders commonly use several oscillators. In this section, I show you two of
them, the MACD and stochastic oscillators, in detail. Discovering the basics
of these two oscillators will enable you to easily understand the rest of them,
because they all share the same characteristics.
Biting into a Big Mac without special sauce: MACD
The Moving Average Convergence Divergence (MACD) is the result of a formula
that’s based on three moving averages derived from the price of the underly-
ing asset. When applied to the asset prices, the MACD formula smoothes out
fluctuations of that asset. For example, in Figure 8-1, the MACD is smoothing
out three moving averages based on the price of the euro. The software pro-
vided by your charting service will help you to display MACD oscillators
based either on your own trading criteria or the software’s default criteria.
The MACD data shown in Figure 8-1 are displayed as a histogram. A MACD
oscillator that’s moving up usually is considered a bullish development, con-
firming that an uptrend has been well established when it actually crosses
above the zero line.
On the left side of the MACD oscillator chart, note how the line under the MACD
slopes higher, while the line under the price of the euro on the index chart
above it is flat. The sloping MACD means the oscillator established a higher
low, even though the price remained flat, which is called positive divergence.
128
Part II: Analyzing the Markets
13_287224-ch08.qxp 5/27/08 10:58 PM Page 128

Although prices did not rise, the positive divergence points to selling momen-
tum that is less than it was during the previous low on the MACD oscillator,
and that’s a signal that prices may be getting ready to rise. In Figure 8-1, the
MACD oscillator was right.
In November, however, a turnaround occurred as the MACD histogram rolled
over. The price of the euro continued to rise, but the MACD provided a non-
confirmation signal, meaning that its overall direction was now lower. Note
how the line above prices is on the rise from late November through early
January, but the second peak on the MACD is lower than the first. This diver-
gence is a sign that buyers are getting tired and that prices may be getting
ready to fall. And again, Figure 8-1 shows that the MACD was right.
Taking stock with stochastics
Stochastic oscillators indicate classic overbought and oversold situations in
the markets. An overbought market occurs when prices have been in a rising
trend for a long time and buyers are starting to get tired. An oversold market
is just the opposite; sellers are getting tired as prices are trending down.
Whenever either of these situations occurs, as a trader, you need to know
whether your position is in danger of getting caught in a trend change.
Markets can remain in overbought or oversold conditions for short or long
periods of time before the trend changes. A four-month rally in the euro
during the fall of 2004 was overbought for a long time based on stochastic
oscillator analysis. So if you had sold based on this indicator alone, you
would’ve missed out on making a lot of money. In fact, looking at Figure 8-1,
you can see that the stochastic indicator showed that the market was over-
bought when the breakout occurred at buy point 2. Without the crossover
and MACD indicators for backup, you would’ve sold way too early.
Thus, like any indicator, stochastics need to be used in combination with
other indicators. Figure 8-1 shows how you can combine MACD, stochastics,
and moving-average crossovers to execute your trading plan most efficiently.
I use stochastic indicators as an early warning system. When stochastics signal
overbought or oversold markets, I take it to mean that I should start paying
close attention to my other indicators, such as MACD and moving averages.
Note in Figure 8-1 that before the rally, the second low on the stochastic indi-
cator was higher than the first, just like the pair of lows on the MACD, thus
providing confirmation of the MACD data by the stochastics, which also ulti-
mately turned out to be correct.
The trend became clear in January when the stochastic oscillator indicated
that the market was oversold. The second low was lower than the first, cor-
rectly indicating a negative situation in which the euro fell to a lower low
soon after the lower low was reached on the stochastic oscillator.
129
Chapter 8: Speculating Strategies That Use Advanced Technical Analysis
13_287224-ch08.qxp 5/27/08 10:58 PM Page 129
By using moving averages and two simple oscillators, you could’ve easily
traded those profitable moves in the euro on the long and the short sides.
When watching moving averages and oscillators together, use minute-based
moving averages for shorter-term trading. The method is the same except
that you’re reading the pricing data in a different, shorter, time frame. You
may want to give yourself another layer of information to confirm the
shorter-term data by looking for key reversal patterns on candlestick charts.
Getting relative (Not Jiggy) with RSI
The RSI (Relative Strength Indicator) was developed by Welles Wilder and
was introduced in 1978. I once got a letter from Wilder about an indicator
that I developed in my early days in the business. I still have the letter and
look at it once in a while. It was a nice thing for a well-known person in the
business to do for someone who was just getting started. But more than
stroke my ego, the letter got me interested in RSI.
RSI is a very useful tool, by itself or in combination with other oscillators. RSI
uses a mathematical formula to measure price momentum and calculate the
relative strength of current prices compared to previous prices. Like stochas-
tic indicators, RSI’s strength is that it’s good at telling when the market is
overbought or oversold (see the preceding section).
I like to use RSI in markets that tend to stay in a particular trend for an
extended period. Energy markets are an example. See Chapter 13 for a classic
example of how to use RSI. The key to RSI, like other oscillators, is to put it in
the proper context of the market that you are trading. It can give early signals
that take a while to come true, so you have to bide your time well. A good
rule to remember is that when RSI, or any other oscillator, gives you a signal
that the trend is changing, it’s a good time for you to be watching the market
closer and to be ready to make decisions about your positions.
Seeing how trading bands stretch
As your use of technical analysis grows more sophisticated, you’ll want to
know the potential price limits of certain trades. This information helps you
ponder when to enter and exit trades and when markets may stall and
reverse trend. A good tool for those purposes is a trading band.
Trading bands also are known as trading envelopes, because they surround
prices, thus providing visual cues about where price support and resistance
levels are at any given time. I like to think of trading bands as variable chan-
nels. Chapter 7 shows you trading channels that are defined by trend lines
that you draw. Trading bands are similar to trend channels in that they pro-
vide you a visual framework of a trading range. The only difference is that
trading bands are more dynamic, because they change with every tick in the
price of the underlying asset.
130
Part II: Analyzing the Markets
13_287224-ch08.qxp 5/27/08 10:58 PM Page 130

Don’t get confused here. Trading bands are, in fact, trading channels that
change with every tick. In other words, trend channels, which are drawn by
hand or with software, are straight lines, pointed either up or down, connect-
ing the high and low points of the top or the bottom of the price range. When
you look at trading channels, you’re getting a visual representation of the
trading range.
Trading bands go farther by giving you both the parameters of the trading
range along with clues as to where the trading range may be heading in the
future.
Introducing Bollinger bands
The most commonly used trading bands are Bollinger bands, which were
introduced and made famous by John Bollinger, a pioneering technical ana-
lyst and television commentator. Bollinger bands essentially mark flexible
trading channels that fluctuate by two standard deviations above and below
a moving average. The bands are helpful in defining trading ranges and telling
you when a change in the trend is coming. Bollinger introduced the bands
with the 20-day moving average, but you can set them up for use with any
moving average, and they’ll work the same way.
In terms of the market, a standard deviation is a statistical expression of the
potential variability of prices, or the potential trading range. The two-standard
deviation method is a default used by most software programs because it
catches most intermediate term trends. That means when you punch up
Bollinger bands on your trading software, you’ll see bands defining the trad-
ing range that are two standard deviations above and two standard devia-
tions below the market price.
As you progress and become more experienced, you may want to use smaller
or larger standard deviations. If you want more frequent signals, you shorten
or use less standard deviation. For longer-term trading, you use larger or
more standard deviation.
Don’t get too hung up in the statistical language. The important concept to
remember is that the market tends to follow some semblance of order, nonlin-
ear order, which is predictably unpredictable.
The Bollinger bands are good at displaying the order for you. And here’s how.
Figure 8-2 shows you how to apply Bollinger bands to a trading situation that
involves the price of the euro during the same period of time highlighted in
Figure 8-1.
When using Bollinger bands to analyze the markets, you need to
Watch the general direction of the bands. If the bands are rising, then
the market is in an uptrend. If they’re falling, the market is in a downtrend.
131
Chapter 8: Speculating Strategies That Use Advanced Technical Analysis
13_287224-ch08.qxp 5/27/08 10:58 PM Page 131
Watch the width between the upper and lower bands. Shrinking
Bollinger bands — where the distance between the upper and lower
bands is narrowing — signal a decrease in volatility and indicate that a
big move is on the way. I like to call this a squeeze. Arrows in Figure 8-2
point to a nice squeeze in the bands that preceded a false breakout and
a clear downturn, or breakdown. Here’s another good squeeze: Notice
how the bands tightened around prices before the euro broke out and
headed higher. Decreasing price volatility is usually a prelude to a big
move. Widening bands usually are a signal that the trend has changed
and that the general tendency of prices is likely to continue in the direc-
tion of the new trend.
Futures traders work in a time frame of a gnat, and a breakdown can be
two hours of falling prices if you’re using charts featuring five-minute
bars (see Chapter 7 for more about charting).
The direction of a move signaled by a squeeze of the Bollinger Bands is
not always certain, though, so you need to wait until the market moves,
and catch the move as early as possible.
Bollinger bands also are excellent for staying with the trend. Watch for prices
to be
Walking the bands. Markets that move along either of the (upper or
lower) bands for an extended time are interpreted as a signal that the
current trend is going to continue for some time. The bracket from
September to November shows a nice example of how the euro walked
the band for a good while during its late 2004 rally.
I realize that reference to “some time” can be frustrating and may be
confusing to readers who require certainty in their trading and more
precise time frames. But when you’re trading, all you can do is under-
stand the possibilities and monitor your trades accordingly until the
market tells you that the trend has changed. That’s one of the reasons
that you should never rely on a single indicator without using others as
backups. In Figure 8-2, the “some time” turned out to be three months.
By monitoring your trade closely, you could’ve followed this market
movement for the entire period.
Breaking outside the bands. When a market’s price breaks outside the
bands around a moving average, it usually means you can expect rever-
sal in the market — a trip to the opposite band. Breakouts don’t always
indicate a shift in the market, but if the market goes outside the bands
enough times, the price eventually makes a trip in the opposite direction.
When the market touches either of the bands, it’s only a matter of time
before it eventually touches the other band; however, the specific
amount of time it takes for this kind of reversal to occur is not as
predictable.
132
Part II: Analyzing the Markets
13_287224-ch08.qxp 5/27/08 10:58 PM Page 132
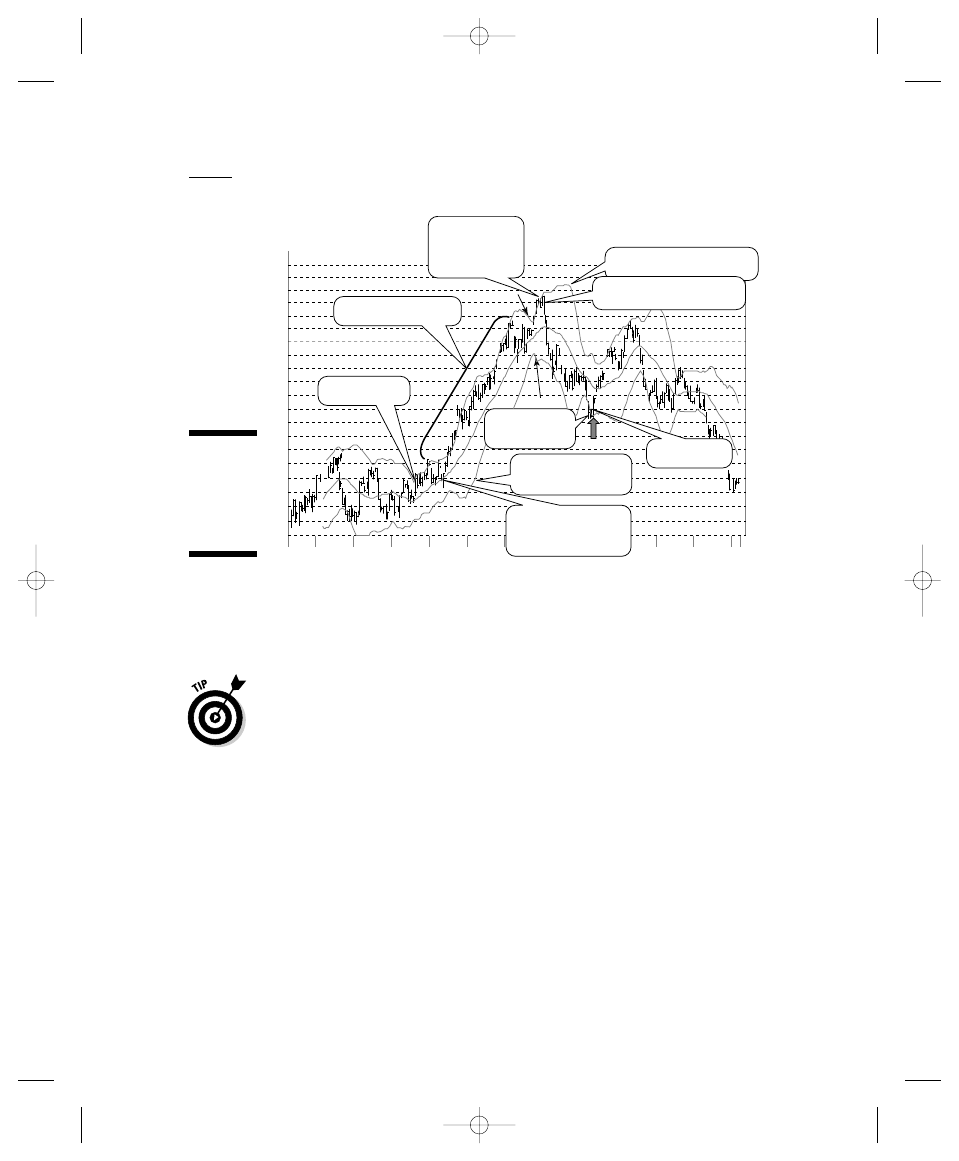
The block arrow in February in Figure 8-2 points to a great example of how
the lower band can serve as a launching pad for a bounce back up to the
upper band. The euro not only touched the band, but spent several days just
outside of it.
An easy way to remember how Bollinger bands work is to think of them as
tight rubber bands that stretch and contract around a magnet, and the
moving average as a magnet. When the rubber bands get stretched too far,
the magnet pulls the market back into a more normal state, inside the bands.
Trading with Bollinger bands
Bollinger bands can be used alone, but they work much better when used in
combination with oscillators and other moving averages. As with any indica-
tor, Bollinger bands are not perfect. Sometimes, the price of the underlying
asset rises above the upper band, and you think that a trip to the lower band
is possible, thus prompting you to sell. Sometimes, you’ll be right. At other
times, however, prices fall back inside the band, stay there a couple of days,
and rally right back up, continuing to walk along the upper band. That’s
when other indicators, such as MACD and stochastic oscillators and moving-
average crossovers, come in handy as checks and balances.
You can visualize a good example of Bollinger bands being used in conjunction
with other indicators by viewing Figures 8-1 and 8-2 together. The squeezing
119.0
120.0
121.0
122.0
123.0
124.0
125.0
126.0
127.0
128.0
129.0
130.0
131.0
132.0
133.0
134.0
135.0
136.0
137.0
138.0
139.0
119.0
120.0
121.0
122.0
123.0
124.0
125.0
126.0
127.0
128.0
129.0
130.0
131.0
132.0
133.0
134.0
135.0
136.0
137.0
138.0
139.0
Jun
Jul
Aug
Sep
Oct
Nov
Dec
Jan
Feb
Mar
Apr
May
J
Walking the band
Take profits
outside the
band.
Squeeze 1
Upper Bollinger Band
Lower Bollinger
Band
Take short
sale profits.
Sell or sell short point.
Moving Average
Buy point.
Buy point.
Figure 8-2:
The Euro
Currency
And
Bollinger
Bands.
133
Chapter 8: Speculating Strategies That Use Advanced Technical Analysis
13_287224-ch08.qxp 5/27/08 10:58 PM Page 133

Bollinger bands in Figure 8-2 occurred at the same time that the MACD oscillator
failed to confirm the higher high in the euro currency. The combination of the
two — the bands signaling that a big move was in the offing and the negative
divergence in the MACD — was confirmed when the euro began a downtrend.
I use Bollinger bands on all my trades, regardless of whether I’m looking at
intraday 15-minute candlestick charts or longer-term daily or weekly bar
charts. And I always use a 20-period chart marked with candlesticks at
15-minute intervals for my intraday charting. Using short-term charts, I can
tell what the market is doing much better than I can when using longer-term
charts. You’ll figure out what works best for you when you gain more trading
experience. Only one rule applies when it comes to charting: Use the parame-
ters that you’re comfortable with and that make you money.
You can use Bollinger bands, oscillators, and moving averages as guidelines
when placing your trades. Here’s how:
When looking to go long (see Chapters 7 and 20), you can set your buy
points just above the lower Bollinger band so that you catch the bounce
when prices bounce back into the band, and a new uptrend starts.
When looking to go short, you’re selling high; thus you put your sell-
short entry point — as soon as it clear that the market is breaking, and it
comes back inside the upper band. In this case, you’re looking for prices
to break and to profit from the break, which is why you’re selling short.
When taking profits, you can use the moving average to set your sell
points to take profits based, of course, on where other indicators show
the market is headed when market prices reach those points.
When adding to your position (buying), you can use the moving aver-
age to establish new buy points to bolster your position. When prices
fall back to the moving average and hold, you can add to positions there.
When the market breaks outside the upper band, on the way up, you
can sell your position there if you’re long. See the “Take profits” sign in
Figure 8-2. As the market moves back into the band, you can then
change your tactics to short selling.
When the market drops below the lower band, you can take profits on
short positions and go long at the lower band.
Trading with trend lines
Trend lines are much like Bollinger bands but without so much flexibility. Trend
lines directly reflect the overall trend of the market, but they’re static because
134
Part II: Analyzing the Markets
13_287224-ch08.qxp 5/27/08 10:58 PM Page 134

you draw them on your charts with the drawing tool in your software package.
This tool is best used for spotting a key change in the overall direction of the
underlying market.
Trend lines are just lines on charts, such as the ones shown in Figure 8-3 (num-
bered 1 through 4). The correct way to draw a trend line is to connect at least
two points in the price chart without crossing through any other price areas.
If you can draw the trend through more than two points, it can become more
accurate; however, trend lines are another tool that needs to be used with
other indicators.
You can use trend lines for both short- and long-term trading, and in both
cases they tell you the same thing, the overall trend of the market. The
important trend-line concept to remember is that rising prices remain in a
rising trend as long as they’re above the trend line. Likewise, falling prices
remain in a downtrend as long as they’re below the falling trend line. Breaks
above or below the trend lines signal that the trend has changed. Correctly
drawn trend lines (see preceding paragraph) help you stay on the right side
of the market as follows:
In uptrends, trend lines connect the lowest low to the next low that pre-
cedes a new high without passing through any other points. Two uptrend
lines, number 2 and number 3, are shown in Figure 8-3, a long-term chart
covering five years of trading in the U.S. Dollar Index. The price break
above trend line 1 shows you when to buy right after a downtrend line is
broken. Trend line 3 shows you how to add to your position as the price
holds above the trend line.
In downtrends, trend lines connect the highest high to the next high
that precedes a new low without passing through any other points. Two
downtrend lines in Figure 8-3 include an intermediate-term trend line, on
the far left that lasts for months, (trend line 1), and a long-term trend
line, trend line 4 (far right) that lasts for years. Trend line 1 shows you
how to remain in a short position as long as the price remains below the
falling trend. Trend line 4 shows you that you need to be buying the
dollar when the price of the dollar breaks above the multiyear trend.
Needless to say, as long as prices stayed below trend line 4, the primary
trading direction was to be short the dollar.
Short-term trend-line trading
When trading futures, at times you can easily get caught up in the jargon.
Short-term trading should never be confused with short selling. Short selling
means you’re betting that prices will fall. Short-term trading means you’re
not interested in holding a position for longer than a few hours or days
at most.
135
Chapter 8: Speculating Strategies That Use Advanced Technical Analysis
13_287224-ch08.qxp 5/27/08 10:58 PM Page 135
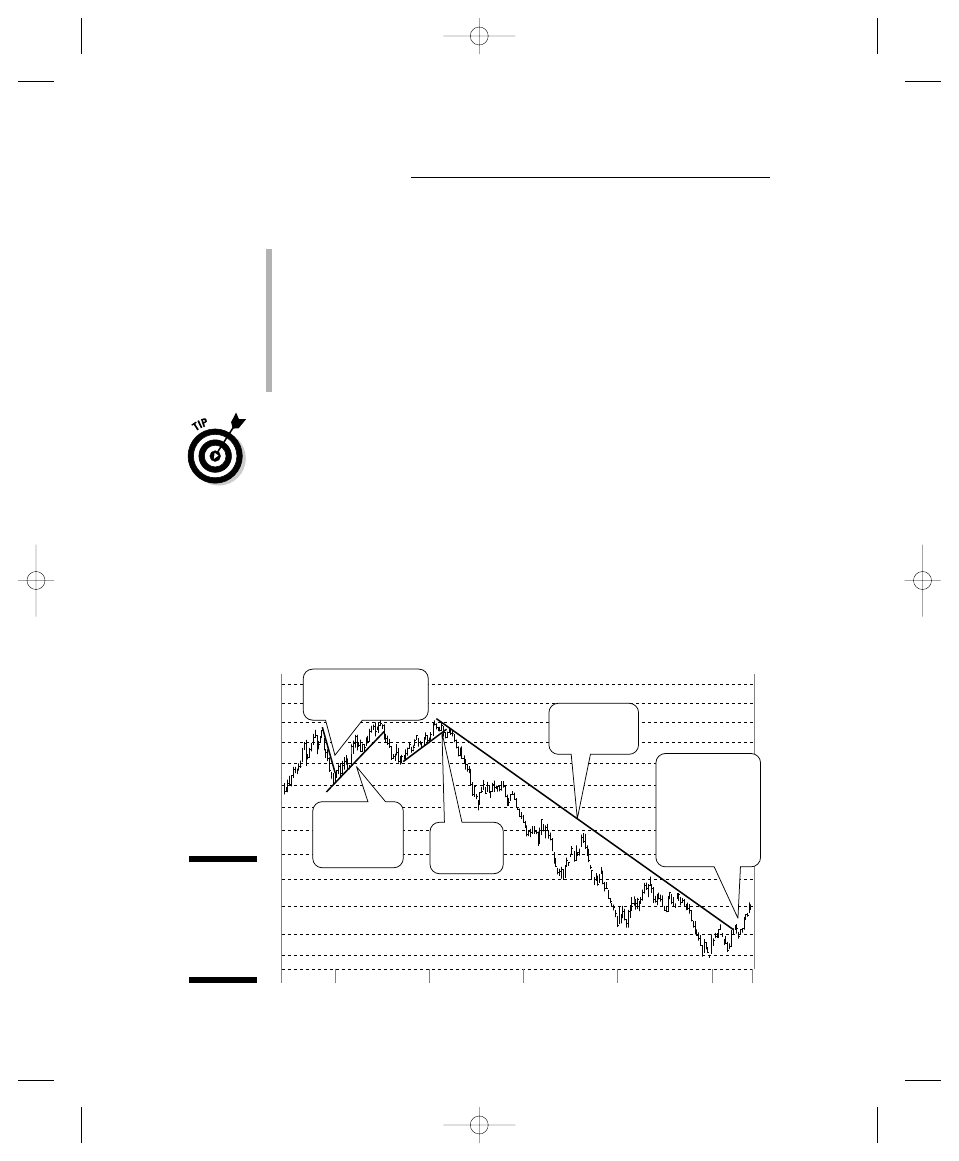
To trade the long side (or buy by using trend lines), you can
Buy a portion of your position when a downtrend that you’ve been fol-
lowing, or shorting, is broken (see Figure 8-3).
Draw your trend line as the market is developing an uptrend and then
buy when the market touches the uptrending line for the third time with-
out breaking below it.
Supplement trend lines with oscillators and moving averages to make
sure that the odds of a winning trade are increased. You should never
rely on only one indicator to make your trades.
I find it easier to trade after a trend line is initially broken. Sometimes I use
successful tests, or price moves back to the trend line without breaking the
line, to add to my position (see next section). This strategy works well in the
oil markets and with the dollar.
Long-term trend-line trading
Say you’ve been short selling a downtrend in the value of the U.S. dollar for
several weeks, but you’re not sure how much longer the position will do well.
Aside from using moving averages, Bollinger bands, and a few oscillators, a
good trend line can be the best indicator for the job. Figure 8-3, a five-year
chart of the value of the U.S. dollar, provides a great example of how drawing
trend lines on long-term charts can help you spot a meaningful change in a
long-term trend.
79
2001
81
84
88
92
96
100
104
108
112
116
120
124
128
79
81
84
88
92
96
100
104
108
112
116
120
124
128
2002
2003
2004
2005
2000
1. Buy on the break
of the down trend
4. Long-term
Trend line
5. Long term
buy signal
when prices
break above
long term down
trend line
2. Buy on the
third touch
of the line
3. Sell on
the break
Figure 8-3:
Using trend
lines to stay
on the right
side of the
market.
136
Part II: Analyzing the Markets
13_287224-ch08.qxp 5/27/08 10:58 PM Page 136
A meaningful break in a long-standing trend often means that the trend is
changing directions. You can see in Figure 8-3 that at least a meaningful inter-
mediate-term advance in the dollar began in 2005 and lasted for several
months following a break in a long-term downtrend.
If you’re drawing trend lines, then it’s a good bet that big-money players are
drawing them, too. As Barbara Rockefeller points out in Technical Analysis
For Dummies (Wiley), big traders sometimes sell their positions long enough
to find out what happens when market prices touch the trend line. In essence,
that means trend lines can encounter points of high volatility, and you can
get shaken out of a position more than once if you’re not careful, especially
when you base your trades only on trend lines. Instead of relying on only one
indicator, don’t hesitate to use trend lines in conjunction with other indica-
tors, just to make sure that the odds of success are as much on your side
as possible.
Lining Up the Dots: Trading with
the Technicals
Technical analysis is like solving puzzles — kind of like connecting the dots.
You start with a price chart, and you start adding lines, bands, oscillators,
and indicators.
As you go along, things can grow cluttered, and you can lose your way. The
good thing is that trading software has “Clear” buttons, which means you can
wipe out all the lines and squiggles on your charts and start over anytime
things get out of control. Save your work first, though, in case you need to
refer back to it.
In the next section, I deal with chart clutter by focusing on staying with the
trend.
Identifying trends
Trading is not only about swimming with the tide; it’s also about knowing
when the tide is going to turn against you. Good traders figure out which way
the trend is moving before they risk their money. It really is as simple as that.
However, you also need to remember that several time frames are involved in
price activity, and that knowing which ways the short-, intermediate-, and
long-term trends are headed in your markets is equally important.
137
Chapter 8: Speculating Strategies That Use Advanced Technical Analysis
13_287224-ch08.qxp 5/27/08 10:58 PM Page 137

Finding the trends is easy; you simply look at price charts for multiple time
frames every day. Daily, weekly, and monthly charts, spanning months,
weeks, and even years, are the best way to go. Checking them all before you
look at your intraday price charts will enable you to be on the right side of
the market for the time frame in which you plan your trades.
If, for example, you’re day trading in wheat, you at least want to know where
the market has been during the last few weeks or months, because intraday
prices of wheat are likely to be guided by that overall trend.
You can also use long-term price charts as the basis for spotting key long-
term support and resistance points and for identifying those same points on
your shorter-term charts.
Thereafter, you can use the trend lines in conjunction with moving averages
and oscillators to help identify the dominant trend before you trade.
Think of short-term charts like the zoom lens on your camera. They help you
zoom in for a closer look at the long-term action.
Before making a trade, make sure that you know the dominant trends. Keep a
trading log so you can write them down on a daily basis before hitting the
daily action.
Getting to know setups
As a trader, you’re a hunter, and good hunters appreciate high levels of activ-
ity and the quiet periods in between. Remember, only three things can
happen in a market. Prices can rise, fall, or move sideways for an extended
period of time.
As a trader/hunter, your job is to look through all your charts for setups, or
chart formations that signal when a change is about to occur in the market
you’re studying and want to trade in. As you look for trading opportunities,
watch for the following:
Constricting Bollinger bands, which point to the potential for a big
move getting closer
Sideways price movements following advances and declines, which
indicate volatility is easing as traders try to decide what to do next
Breakouts that occur when prices break above or cross over key sup-
port or resistance levels, trend lines, oscillators, moving averages, or
other market indicators
After you find them, setups call for careful observation in which you apply
the principles of the indicators explained earlier in this chapter.
138
Part II: Analyzing the Markets
13_287224-ch08.qxp 5/27/08 10:58 PM Page 138
A good rule to follow is to place your entry and exit points right above or
below the setup in the direction of the dominant trend.
Buying the breakout
Breakouts are exciting. Prices suddenly burst out of a basing pattern. Volume
can swell, and suddenly your trading screens are flashing my favorite trading
color, green, as buyers come into the market.
A breakout is a signal for you to go to work. Because it can come at virtually
any time, you need to be prepared to react.
Figure 8-1 (earlier in this chapter) shows you a classic example of a nice
setup, a breakout, and the right outcome. The euro formed a 4
1
⁄
2
-month base
and then delivered a nice breakout in mid-October, after testing resistance
levels in July, August, and twice in September. Important features to notice
about this classic basing pattern are that the euro found support twice
during the basing period, and its value did not retreat to the bottom of the
trading range after September.
These two factors together indicated that buyers slowly were starting to take
the upper hand. In addition, higher lows indicated by the MACD oscillator
and positive basing action (see Chapter 7) predicted the breakout.
The ideal entry point for buying the breakout (labeled in the figure) is after
the price clears all the previous resistance and begins moving higher — in
a hurry.
Don’t be too concrete here. Setups are setups. They look the same on long-
term charts as they do on short-term charts. For example, if you’re using a
chart to cover one day’s trading, say around 6 hours, your bars or candle-
sticks may be anywhere from 5 to 15 minutes, meaning that by the end of a
few hours, your chart will be full. You can use the same indicators on these
charts. Bollinger bands shrink just the same. Prices will rise and fall above
nine-minute moving averages. And MACD and stochastic oscillators will be
just as applicable. The key is that the principles stay the same, no matter
the time frame.
Swinging for dollars
Swing trading enables you to take advantage of markets that are stuck in trad-
ing ranges, whether they are moving sideways, rising, or falling within trading
channels. The euro in Figure 8-1 was in a narrow trading range before it broke
out in October, and offered opportunities for short-term swing trading before
its breakout.
139
Chapter 8: Speculating Strategies That Use Advanced Technical Analysis
13_287224-ch08.qxp 5/27/08 10:58 PM Page 139
To be able to make profitable trades in markets that are within trading
ranges, swing traders rely on trend lines, Fibonacci levels, and moving aver-
ages to identify the levels of support and resistance that they use to establish
price points at which they buy, sell, and sell short their investments. When
prices reach support and resistance levels, swing traders take action, in gen-
eral buying on weakness at the bottom of the trading range and selling on
weakness at the top of the trading range. In other words, swing traders set
targets for their trades and anticipate trend changes when the market
reaches those targets based on their analysis of their respective markets.
You can combine support and resistance lines with Bollinger bands and sto-
chastic oscillators to become an effective swing trader. The euro provided
plenty of opportunities for swing trades in the 4
1
⁄
2
months before its October
breakout — shown in Figures 8-1 and 8-2. Note how the support and resis-
tance lines, the market action close to the Bollinger bands, and overbought
and oversold readings on the stochastic oscillator all worked together as the
euro reached the tops and bottoms of its multimonth trading range.
Swing trading, however, is risky business, the same as any other form of trad-
ing. In the Figure 8-1 example, you could’ve lost significant amounts of money
if you happened to use the 200-day moving average to set up a swing trade in
late April and May. The key: The MACD oscillator failed to confirm the
attempted bottom above the moving average.
The bible of swing trading is Alan Farley’s The Master Swing Trader (McGraw-
Hill). Farley explains how to utilize a system based on what he calls pattern
cycles — shifting market stages that repeat in an orderly, predictable process
through all price charts and time frames.
Selling and shorting the breakout
in a downtrend
Regardless of whether you’re a momentum trader buying on breakouts or a
swing trader setting up and knocking down targets, changing trends are the
trader’s bread and butter. And one of the hardest things for a trader to do is
get up the guts to sell an instrument short. Fortunately, the complexities of
the market, the popular psychology that shorting is immoral, and the high
risk of losing large sums of money serve as three major deterrents against the
practice.
And yet, if you keep close tabs on trend lines, oscillators, and moving aver-
ages to spot changes in a market’s price trends, and watch Bollinger bands
and Fibonacci retracement levels to predict when important shifts in the
140
Part II: Analyzing the Markets
13_287224-ch08.qxp 5/27/08 10:58 PM Page 140
markets are likely, you can manage your risk and make some money selling
short. You also need to use protective stops, just in case you’re wrong.
Selling short is a different animal. It’s essentially the practice of turning the
world upside down and making money from someone else’s miscues,
whether political, corporate, or otherwise.
The two basic strategies for short selling are swing trading (see the preced-
ing section) and selling into the breakdown of prices.
When you’re selling into the breakdown, you have to wait for bad things to
happen. A good rule of thumb is to consider that a market is worthy of short-
selling consideration when it has been going up for an extended period of
time. It can be weeks, months, or years.
When selling short, or shorting, you can do the following:
Anticipate the breakdown by looking at the Bollinger bands and
• Watching for the bands to constrict and the market to stop walk-
ing the band. If trend lines are broken toward the downside, you
can short an instrument. Be sure to place a stop just above the
trend line.
• Watching for the market action near the moving average inside the
bands, which can signal support.
Monitor your short sales positions carefully at all times but especially
in markets that respond to news and at times of high political tension.
Bonds and currencies are especially susceptible to news and political
tensions.
Give your short sales positions room to move. Setting your exit stops
too tightly can get you whipsawed. Different markets have different
inherent ranges. Before you sell an instrument short, you need to
become aware of its normal price movements and adjust your position
accordingly.
You can count several trading periods and get an idea of the average number
of days that a particular market moves along rising or falling Bollinger bands.
This time frame won’t be exact, but you want to have a good idea neverthe-
less. Shares of Starbucks, for example, usually hug the lower Bollinger band
anywhere from four to ten days before they bounce up. Although knowing
that time frame doesn’t guarantee that the bounce will last, you still can be
on the lookout for increased activity that can affect your trades during that
period of time in the market you’re trading and in other markets. Technical
Analysis For Dummies offers a fairly detailed introduction to these topics.
141
Chapter 8: Speculating Strategies That Use Advanced Technical Analysis
13_287224-ch08.qxp 5/27/08 10:58 PM Page 141

Setting your entry and exit points
Where you set entry and exit points — whether mentally or automatically on
your trading platform — can make a big difference in your trading perfor-
mance. Although no hard-and-fast rules determine where to set these points,
some fairly reliable guidelines are available. Here’s a quick lineup:
Tailoring the strategy to the market: Get to know how fast your market
moves and how volatile trading can be before you ever start trading. It’s
a good idea to do this through paper trading, a way to practice trading
without assuming the financial risk. Most online futures brokers will
have practice trading available on their Web sites. Use this technique to
become familiar with each market you trade.
Knowing your risk tolerance: If you know wheat moves too fast for your
liking, try the U.S. Dollar Index, which moves more slowly.
Giving a fast-moving market more room to maneuver than a slower
one: As a general rule, you need to give fast-moving markets a bit more
room to maneuver. (Note: This bears repeating.) I usually give myself a
few ticks above or below the support or resistance area that I’m using as
my line in the sand so I avoid getting whipsawed.
Setting sell stops: Where you set your sell stops depends not only on your
experience, but also on the market’s volatility and your risk tolerance.
Using trailing stops: You can reset these manually; use prices or per-
centages as a guide. Again, much depends on the inherent volatility and
general tendencies of each individual market, which is why you need to
exercise care and be aware of how all contracts that you trade fluctuate
before committing any money to a trade.
Hurrying gets you nowhere: Never be in a hurry when trading. Some
traders like to give markets an extra day before selling or buying. For
example, if you spot a trend change on the S&P 500 futures chart on
Tuesday, you may want to wait until Wednesday before you make your
decision.
Using technical analysis to establish market entry and exit points:
Fibonacci levels, moving averages, trend lines, and support and resis-
tance points provide you with plenty of references for where to place
entry and exit points. The figures in this chapter offer a good foundation
for beginning strategies.
Expanding your strategies: As you gain more trading experience, you
can find out more about the Fibonacci theory, Eliott waves, and Gann
strategies by reading more about them and other approaches to trading.
Technical Analysis For Dummies offers a fairly detailed introduction to
those topics.
142
Part II: Analyzing the Markets
13_287224-ch08.qxp 5/27/08 10:58 PM Page 142

Chapter 9
Trading with Feeling Now!
In This Chapter
Thinking in a contrary fashion
Reacting to changes in volume
Knowing how to benefit from open interest info
Using put/call ratios
Watching for signs of soft sentiment
A
s a contrarian thinker, my first real-life experience with contrarian
market analysis was in 1990. Sure, I’d read the books and articles that
tell stories about how stocks need to be sold when the shoeshine boy starts
recommending stocks to you as he polishes your shoes at the airport. But,
for me, 1990 was the literal proof in the pudding.
At some point in August 1990, stocks were failing in the U.S. markets, and the
price of crude oil was testing the $40-per-barrel resistance level. At the time,
$40-per-barrel oil was an extremely high price, even though it’s cheap com-
pared to the $105 prices to which it eventually soared in February 2008.
Both times the rise in the price of oil to what was then a record high was
caused by a war in Iraq, at least initially. The situation in 2008 was slightly
different, although there were still U.S. troops in Iraq.
As I discuss in detail in Chapter 13, we live in a world full of conflict, and it’s
important to keep in mind that wars and other world events affect how the
psyches of investors work. As an investor, it’s important to be aware of how
news items impact the market.
During the latter stages of the oil rally in 1990, a picture of an Arab man
holding a gun was on the cover of BusinessWeek magazine with the headline
of headlines above it: “Hostage to Oil.” That caught my eye. And sure as
shootin’ that cover story appeared only a few weeks before the price of oil
topped out and actually collapsed when the United States invaded Iraq a few
months later.
14_287224-ch09.qxp 5/27/08 10:58 PM Page 143

My contrarian stance was reinforced once again by the markets in 1991.
That’s when the first U.S. invasion of Iraq touched off a decade-long bull
market in the U.S. stock market.
In this chapter, I take you through the major aspects of contrarian thinking
and explain how to know when to use it and how to make it part of your
trading arsenal.
The Essence of Contrarian Thinking
Contrarians trade against the grain at key turning points when shifts in
market sentiment become noticeable. The most important aspect of contrar-
ian thinking, though, is to be able to spot those important turning points that
can lead to profitable trades. For example, a contrarian may
Start looking for reasons to sell when everyone else is bullish
Think a good time to buy is when pessimism about the markets is so
thick that you can cut it with a knife
More can be made of contrarian trading than just using the prevailing senti-
ment in the market, because sentiment trading is inexact and can lead to
losses whenever you pull the trigger too early during the cycle.
The bullish extremes reached during the buildup of the Internet bubble were
unprecedented. Although traders who sold early were vindicated, they never-
theless lost a great deal of money by getting out too early. Another extreme
is when the bear market in stocks ended in 2002. Traders who got into stocks
during the seven-month period from June 2002 to March 2003 were whip-
sawed, or shaken out of positions with losses and tortured by the extremes in
volatility that can happen as the final bottom of the mega bear market finally
formed.
Throughout the three-year period during which the bear market in stocks
unfolded, plenty of opportunities opened up to trade on the long side, mean-
ing to buy stocks based on sentiment. But most of them proved false until the
final bottom was reached.
Simply put, sentiment analysis is an inexact science and is only part of what
you need to know to be a better trader. It is also a part that works better
when combined with technical analysis.
This chapter helps you combine sentiment and technical analyses within
your trading arsenal to lead you to better decision making.
144
Part II: Analyzing the Markets
14_287224-ch09.qxp 5/27/08 10:58 PM Page 144
Bull Market Dynamics
To understand sentiment and when it is most useful as a guide to trading,
brushing up on the dynamics of a bull market is helpful. Because most people
can identify with a bull market in stocks best, I use it as an example. Yet, the
basic principles apply to just about any bull market in any commodity or
financial asset.
The first stage of any bull market is when the market is sold out, and you
see short covering, or the offsetting of short positions, which is based on
the realization by the pessimists that the bulls are starting to charge. Still,
because it’s early in the new bull market, the bears tend to hang on, usually
buying put options — options that are betting on lower prices — even as
they short cover. This in turn creates a nice climate of pessimism, which is
reflected in an indicator known as the put/call ratio (I discuss this later in
the section “Putting Put/Call Ratios to Good Use”).
This rise in pessimism, even though the bottom has been put in place, is
known collectively as the “wall of worry.” The wall of worry can last a few
days or a few weeks. What’s important is that at some point, if indeed the
rally is strong enough to have launched a new bull run, the bears finally
throw in the towel and the put/call ratios, which have risen mostly due to
put option buying, start to trail off. It is at that time, when the wall of worry
melts away, that the market becomes vulnerable.
Sentiment is most useful as an indicator at market bottoms because the crazy
times at market tops can last for very long periods of time and you can miss
big moves if you sell too early. See chapter 8 for how to spot market tops by
using Bollinger bands.
Survey Says: Trust Your Feelings
Two popular sentiment surveys affect the futures markets: Market Vane and
Consensus, Inc.
Consensus, Inc., www.consensus-inc.com, is based in Kansas City and it
publishes Consensus weekly as a newspaper that you get in the mail or as an
Internet publication. Consensus offers sentiment data on the following:
Precious metals: Silver, gold, copper, and platinum
Financial instruments: Eurodollars, U.S. dollars, Treasury bills (T-bills),
and Treasury bonds (T-bonds)
Currencies: The U.S. dollar, Euro FX, British pound, Deutschemark,
Swiss franc, Canadian dollar, and the Japanese yen
145
Chapter 9: Trading with Feeling Now!
14_287224-ch09.qxp 5/27/08 10:58 PM Page 145
Soybean complex: Soybeans, soybean oil, and soybean meal
Meats: Pork bellies, hogs, cattle, and feeder cattle
Grains: Wheat and corn
Stock indexes: The S&P 500 and NASDAQ 100 stock indexes
Foods: Citrus fruits, sugar, cocoa, and coffee
Fibers: Cotton and lumber
Energy complex: Crude oil, natural gas, gasoline, and heating oil
Market Vane, www.marketvane.net, offers a similar set of measures under
the name Bullish Consensus. Of the two sentiment surveys, Market Vane’s
is better known, and according to its Web site, Bullish Consensus has been
published on a weekly basis since 1964 and on a daily basis since 1988.
Snapshots of both surveys for stocks, bonds, eurodollars, and euro currency
are available weekly in Barron’s magazine, under the Market Laboratory
section or at Barron’s Online, www.barrons.com.
What you find when reading Barron’s or another of these publications are
percentages of market sentiment, such as oil being 75 percent bulls, or bull-
ish, which simply means that 75 percent of the opinions surveyed by the
editors of Bullish Consensus or Consensus are bullish on oil. Usually such sen-
timent is interpreted as a sign of caution, but not necessarily as a sign of an
impending top.
After you find out the market sentiment, technical analysis kicks in. A high
bullish reading in terms of sentiment should alert you to start looking for
technical signs that a top is in place, checking whether key support levels or
trend lines have been breached, or checking whether the market is struggling
to make new highs. See Chapters 7 and 8 for more details on technical
analysis.
Sentiment surveys are popular tools used mostly by professional traders to
gauge when a particular market is at an extreme point with either too much
bullishness or too much bearishness. Their major weakness is that they’re
now so popular that their ability to truly mark major turning points is not as
good as it was even in the late 1980s or early 1990s. Still, when used within
the context of good technical and fundamental analysis, sentiment surveys
can be useful.
Other particulars that describe the sentiment surveys are that they are
Based on advisor polls that are conducted either by reading the latest
publications sent to the survey editors or by telephone polling of a
group of advisors.
Indirect measures of public opinion about the individual markets.
146
Part II: Analyzing the Markets
14_287224-ch09.qxp 5/27/08 10:58 PM Page 146
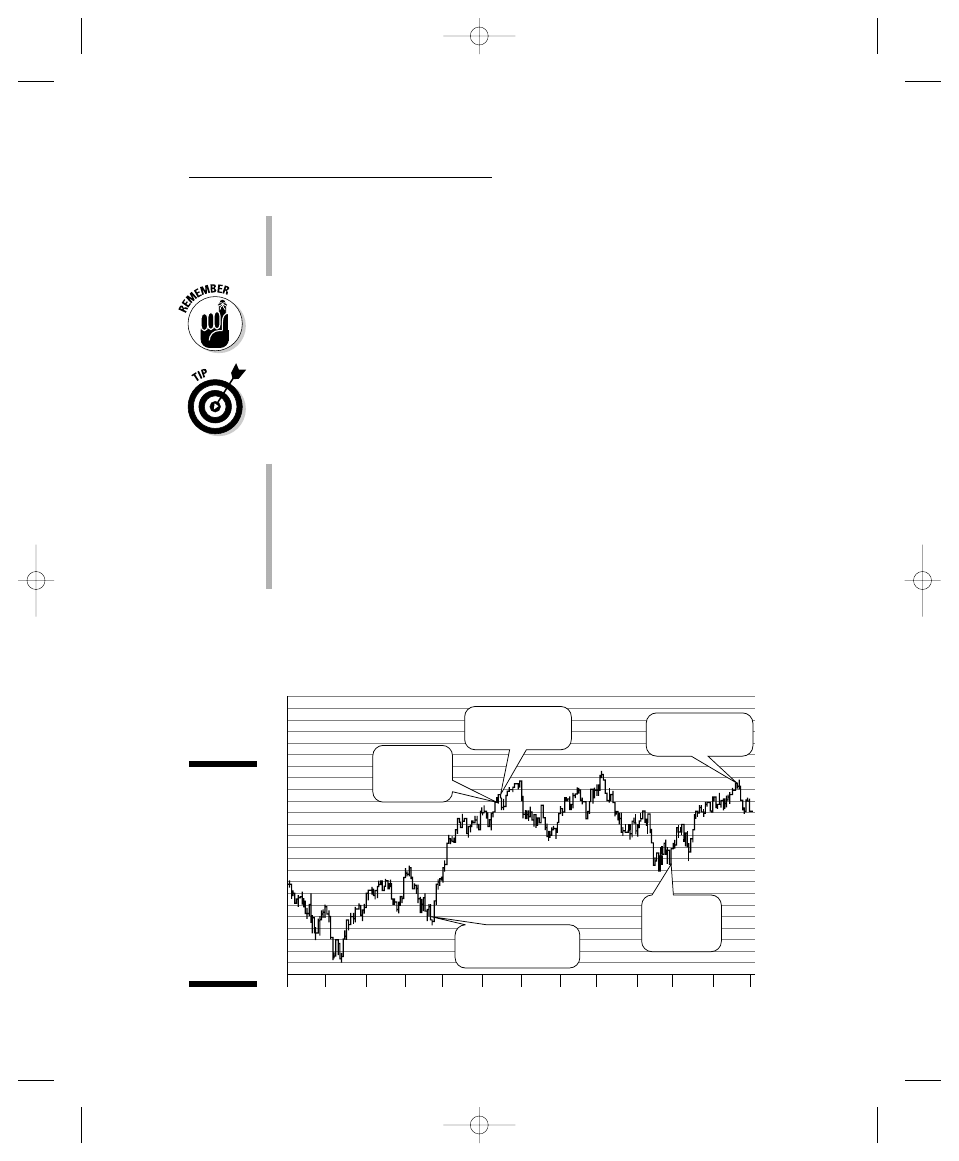
Interpreted as a measure of public opinion because they’re based on
advisory opinions usually subscribed to by the public. However, market
professionals traditionally considered the public to be wrong, especially
at market turning points.
Sentiment survey readings must be at extreme levels to be useful. In other
words, sentiments below 35 to 40 percent for any given category usually are
considered bullish, because few advisors are left to recommend selling.
You can use sentiment surveys as trend-following systems. A market that hits
a new high as sentiment is rising along with it — without hitting any caution-
ary points on the charts — can be taken as a sign that more upside potential
exists. Even so, when using sentiment to help guide your decision making,
always
Check your charts and other indicators to confirm what the surveys are
saying.
Avoid trading on sentiment data alone, because doing so is too risky.
Check sentiment tendencies against technical and fundamental analyses,
even though it may make you a little late in executing your entry or exit
trades. Making sure is better than missing a significant part of an
advance if you’re long or a decline if you’re short.
Even though the sentiment surveys are not giving you textbook numbers,
they nevertheless can be useful. Figure 9-1 highlights a set of key market
turning points in the 2004–2005 time period.
1270
1260
1290
1280
1250
1240
1230
1220
1210
1200
1190
1180
1170
1160
1150
1140
1130
1120
1110
1100
1090
1080
1070
1060
1050
Jul
Sep
Nov
Oct
Dec
Jan
Feb
Mar
Apr
May
Jun
Aug
12/13/04
Consensus
75% Bulls
10/20/04 Consensus
24% Bulls
4/15/2005
Consensus
35% Bulls
12/14/04 Market
Vane 69% Bulls
6/24/05 Market
Vane 70% Bulls
Figure 9-1:
Key tops
and bottoms
in the S&P
500 from
July 2004 to
June 2005
were
correctly
called by
sentiment
surveys.
147
Chapter 9: Trading with Feeling Now!
14_287224-ch09.qxp 5/27/08 10:58 PM Page 147
Figure 9-1 shows a good set of tops and bottoms in the stock market in
2004 and 2005. These were nearly textbook examples of how sentiment can
be useful.
But, it’s not always that clear. Consider this example. The stock market began
a rally in August of 2007, although Consensus had a 63 percent bullish per-
centage and Market Vane had a 56 percent bullish percentage near the time
when the market bottomed. Usually, long-lasting bull markets are spawned by
much lower readings in the sentiment surveys. These are usually near or
below 40 percent bullish percentages, and are known as sentiment washouts,
meaning that there aren’t enough bears around to keep prices down. Markets
always follow the path of least resistance, and thus you get a rally.
The rally moved strongly into October, but by October 12, the bullish num-
bers were at 75 percent and 69 percent respectively. The following week saw
the market start to stumble; on October 19, on the 20th anniversary of the
Crash of 1987, the Dow Jones Industrial average fell over 300 points.
In fact, the market sentiment numbers in October were correct as that
proved to be the top for that rally. For a stock investor with a 12- to 18-month
time horizon, the 300-point down day may be seen as a long-term buying
opportunity. Yet, as a futures trader, your time frame will more likely be two
hours to two weeks. Had you owned stock index futures during this period,
you might have taken a big loss if you hadn’t been watching a wide array of
indicators, including the sentiment surveys.
Keep tabs on Consensus and Market Vane. Watch how low the numbers get
with market bottoms. Look for the washout as a sign that the rallies have a
chance of lasting longer than a few weeks. And always look to your charts,
volume (see the next section), and your other indicators and oscillators as
backup.
Considering Volume (And How
the Market Feels About It)
Trading volume is a direct, real-time sentiment indicator. As a general rule,
high trading volume is a sign that the current trend is likely to continue. But
consider that advice as only a guideline. Good volume analysis takes other
market indicators into account. Figure 9-2, which shows the S&P 500 e-mini
futures contract for September 2005, portrays an interesting relationship
between volume, sentiment, and other indicators.
148
Part II: Analyzing the Markets
14_287224-ch09.qxp 5/27/08 10:58 PM Page 148
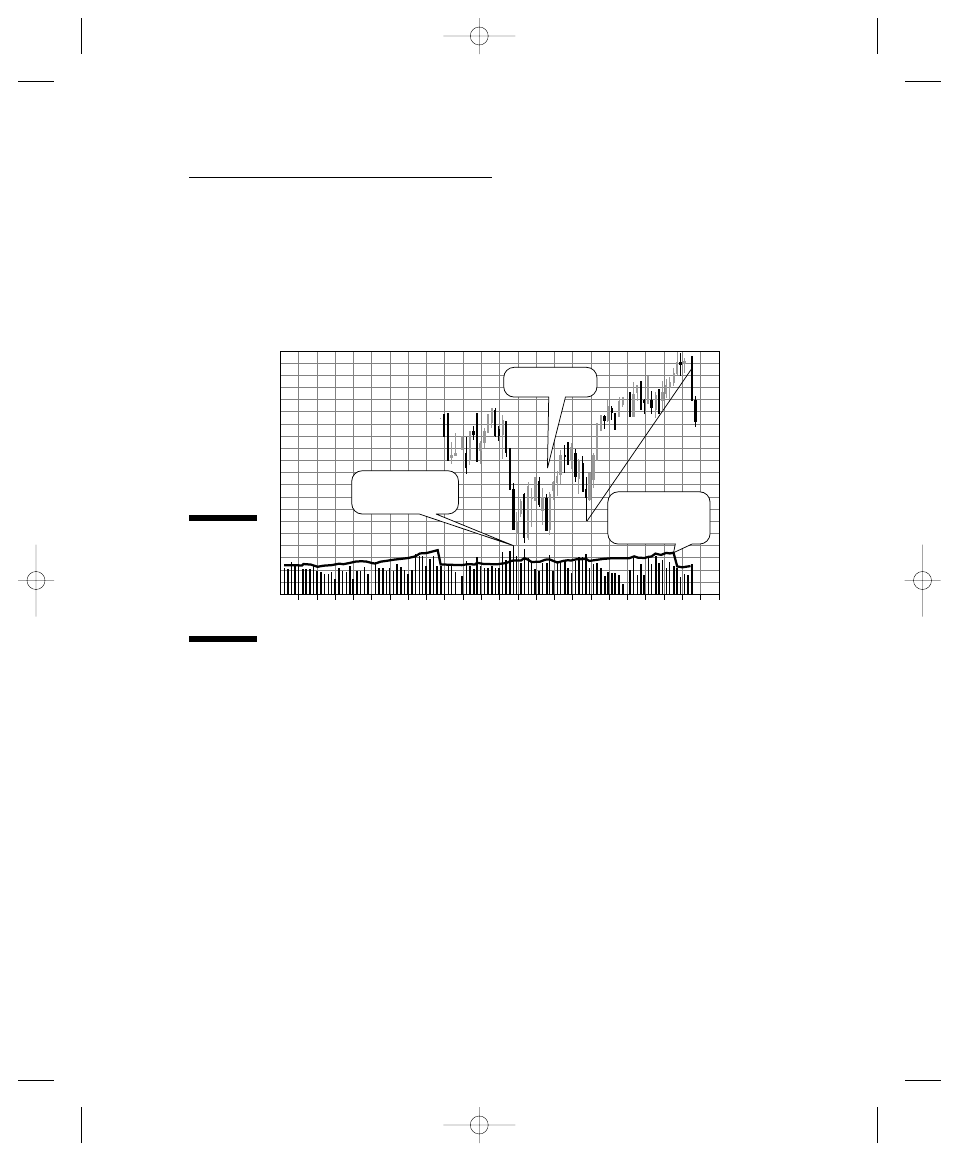
In April, the market made a textbook bottom. Notice how the volume bars
at the bottom of the chart rose as the market was reaching a selling climax,
as signified by the three large candlesticks, or trading bars. This combination
of signals — large price moves and large volumes when the market is
falling — is often the prelude to a classic market bottom, because traders
are panicking and selling at any price just to get out of their positions.
Notice how the volume trailed off as the market consolidated, or started
moving sideways, making a complex bottom that took almost two weeks to
form. Consolidation is what happens when buyers and sellers are in balance.
When markets consolidate, they’re catching their breath and getting set up
for their next move. Consolidation phases are unpredictable and can last for
short periods of time, such as hours or days, or longer periods, even months
to years.
A third important volume signal occurred in late May and early June as the
market rallied. Notice how volume faded as the market continued to rise.
Eventually, the market fell and moved significantly lower as it broke below
key trend-line support.
Finally, note in Figure 9-2 that open interest (see the section “Out in the Open
with Open Interest,” later in this chapter) fell during the last stage of the rally
in late June, which usually is a sign that more weakness is likely. This is
because fewer contracts remain open, suggesting that traders are getting
exhausted and are less willing to hold on to open positions.
24
JAN-05
As of 06/24/05
MAR
APR
JUL
1225.2
JUN
MAY
FEB
7
21
7
21
4
18
2
16
30
13
27
1214.6
1204.1
1193.5
1183
1172.4
1161.8
1151.3
1140.7
Cntrcts
713054
0
Climactic selling
volume
Open interest
breaks before
market falls
Consolidation
Figure 9-2:
Volume and
the e-mini
S&P 500
September
2005 futures.
149
Chapter 9: Trading with Feeling Now!
14_287224-ch09.qxp 5/27/08 10:58 PM Page 149
Using volume indicators in the futures markets has limitations. The example
in Figure 9-2 needs to be viewed within the context of these limitations:
The release of volume figures in the futures market is delayed by
one day.
Higher volume levels steadily migrate toward the closest delivery month,
or the month in which the contract is settled and delivery of the under-
lying asset takes place. That migration is important for traders, because
the chance of getting a better price for your trade is higher when volume
is better. In June, for example, the trading volume is higher in the S&P
500 futures for the September contract than for other months, because
September is the next delivery month. Volume for the delivery-month
contract increases for a while as traders move their positions to the
front month, or the commonly quoted (price) contract at the time. Say,
for example, that the volume data for June 24, 2005, shows 36,717 con-
tracts traded in the September 2005 contract, 170 in the December 2005
contract, and 21 in the March 2006 contract. None of the other listed
contracts had any volume on that day.
Limit days (especially limit up days), or days in which a particular con-
tract makes a big move in a short period of time, can have very high
volume, thus skewing your analysis. A limit up day, when the market
rises to the limit in a short period of time, usually is a signal of strength
in the market. Limit up or limit down days tend to happen in response to
a single or related series of events, external or internal, such as a very
surprising report. When markets crash, you can see limit down moves
that then trigger trading collars (periods when the market trades but
prices don’t change) or complete stoppages of trading.
The opposite is true when you have a big move on low volume, such as
the first of the last two bars pictured in Figure 9-2. On the day of the first
break of the rising trend line, volume was lower than in the prior few
days. On the second day of selling, volume rose, suggesting that more
trouble was coming.
When analyzing volume, be sure that you
Put the current volume trends in the proper context with relationship
to the market in which you’re trading, instead of thinking about hard-
and-fast rules. It’s important to note that trends tend to either start
or end with a volume spike climax (typically twice the 20- or 50-day
moving average of daily volume).
Remember the differences in the way that volume is reported and
interpreted in the futures market compared with the stock market.
Check other indicators to confirm what volume is telling you.
150
Part II: Analyzing the Markets
14_287224-ch09.qxp 5/27/08 10:58 PM Page 150
Ask yourself whether the market is vulnerable to a trend change.
Consider key support and resistance levels.
Protect your portfolio by being prepared to make necessary changes.
Out in the Open with Open Interest
Open interest is the number of active contracts for any given security during
any trading period. It is the most useful tool for analyzing potential trend
reversals in futures markets.
A more formal definition is this: Open interest is the total number of con-
tracts entered into during a specified period of time that have not been liqui-
dated either by offsetting transactions or by actual delivery. Open interest
applies to futures and options but not to stocks.
Open interest
Measures the total number of short and long positions (shorts and
longs)
Varies based on the number of new traders entering the market and the
number of traders leaving the market
Rises by one whenever one new buyer and one new seller enter the
market, thus marking the creation of one new contract
Falls by one when a long trader closes out a position with a trader who
already has an open short position
In the futures markets, the number of longs always equals the number of
shorts. So when a new buyer buys from an old buyer who is cashing in, no
change occurs in open interest.
The exchanges publish open-interest figures daily, but the numbers are
delayed by one day. Therefore, the volume and open-interest figures on
today’s quotes are only estimates.
Charting open interest on a daily basis in conjunction with a price chart
helps you keep track of the trends in open interest and how they relate to
market prices. Barchart.com (www.barchart.com) offers excellent free
futures charts that give you a good look at open interest.
Open interest is one of the most useful tools you can have when trading
futures. Even though the figures are released with a one-day delay, they still
are useful when you evaluate the longer trend of the market.
151
Chapter 9: Trading with Feeling Now!
14_287224-ch09.qxp 5/27/08 10:58 PM Page 151
Rising markets
In a rising trend, open interest is fairly straightforward:
Bullish open interest: When open interest rises along with prices, it
signals that an uptrend is in place and can be sustained. This bullish
sign also means that new money is moving into the market.
Extremely high open interest in a bull market usually is a danger signal.
Bearish open interest: Rising prices combined with falling open interest
signal a short-covering rally in which short sellers are reversing their
positions so that their buying actually is pushing prices higher. In this
case, higher prices are not likely to last, because no new buyers are
entering the market.
Bearish leveling or decline: A leveling off or decrease in open interest
in a rising market often is an early warning sign that a top may be
nearing.
Sideways markets
In a sideways market, open interest gets trickier, so you need to watch for the
following:
Rising open interest during periods when the market is moving sideways
(or in a narrow trading range; see Chapter 8) because they usually lead
to an intense move after prices break out of the trading range — up or
down.
When dealing with sideways markets, be sure to confirm open-interest
signals by checking them against other market indicators.
Down-trending price breakouts (breakdowns). Some futures traders use
breakouts on the downside to set up short positions, just like commer-
cial and professional traders, thus leaving the public wide open for a
major sell-off.
Falling open interest in a trader’s market. When it happens, traders with
weak positions are throwing in the towel, and the pros are covering their
short positions and setting up for a market rally.
Falling markets
In falling markets, open-interest signals also are a bit more complicated to
decipher:
152
Part II: Analyzing the Markets
14_287224-ch09.qxp 5/27/08 10:58 PM Page 152
Bearish open interest: Falling prices combined with a rise in open inter-
est indicate that a downtrend is in place and that it’s being fueled by
new money coming in from short sellers.
Bullish open interest: Falling prices combined with falling open interest
is a sign that traders who had not sold their positions as the market
broke — hoping the market would bounce back — are giving up. In this
case, you need to start anticipating, or even expecting, a trend reversal
toward higher prices after this give-up phase ends.
Neutral: If prices rise or fall, but open interest remains flat, it means that
a trend reversal is possible. You can think of these periods as preludes
to an eventual change in the existing trend. Neutral open-interest
situations are good times to be especially alert.
Trending down: A market trend that has shifted downward at the same
time open interest is reaching high levels can be a sign that more selling
is coming. Traders who bought into the market right before it topped
out are now liquidating losing positions to cut their losses.
Flat open interest when prices are rising or falling means that a trend reversal
is possible.
Putting Put/Call Ratios to Good Use
The put/call ratio is the most commonly used sentiment indicator for trading
stocks, but it can also be useful in trading stock index futures, because with it
you can pinpoint major inflection points in trader sentiment. Put/call ratios,
when at extremes, can be signs of excessive fear (a high level of put buying
relative to call buying) and excessive greed (a high level of call buying rela-
tive to put buying). However, these indicators are not as useful as they once
were because of more sophisticated hedging strategies that are now often
used in the markets.
As a futures trader, put/call ratios can help you make several important
decisions about
Tightening your stops on open positions
Setting new entry points if you’ve been out of the market
Setting up hedges
Taking profits
Put/call ratios are best used in conjunction with technical analysis, so you
need to look at your charts and take inventory of your own positions during
the time frame in which you’re trading futures contracts. In other words, a
good time to check the put/call ratio is when you have a long position in
153
Chapter 9: Trading with Feeling Now!
14_287224-ch09.qxp 5/27/08 10:58 PM Page 153

S&P 500 Index futures and the stock market has been rising for several weeks,
but it’s running up against a tough long-term resistance level that it’s failed
to penetrate a few times during the last few weeks. From your read of the
put/call ratio, you can consider which of the four strategies in the previous
list you need to use. You can turn this scenario around for a falling market in
which you have either a short position or hold put options.
The Chicago Board Options Exchange (CBOE) updates the ratio throughout
the day at its Web site, www.cboe.com/data/IntraDayVol.aspx, and
provides final figures for the day after the market closes.
The sections that follow describe two important ratios with which you need
to become familiar when trading stock index futures.
Total put/call ratio
The total put/call ratio is the original indicator introduced by Martin Zweig,
a prominent money manager and author who was one of the few traders who
sidestepped the market crash of October 1987 and made money by buying
put options. The put/call ratio is calculated by using the following equation:
total put options purchased ÷ total call options purchased
The total ratio includes options on stocks, indexes, and long-term options
bought by traders on the CBOE. Although you can make sense of this ratio in
multiple ways, I’ve found it useful when the ratio rises above 1.0 and when it
falls below 0.5. When the ratio rises above 1.0, it usually means too much fear
is in the air and that the market is trying to make a bottom. Readings below
0.5, however, usually mean that too much bullishness is in the air and that
the market may fall.
Index put/call ratio
The index put/call ratio is a good measure of what futures and options play-
ers, institutions, and hedge-fund managers are up to. When this indicator is
above 2.0, it traditionally is a bullish sign, but when it falls below 0.9, it
becomes bearish and traditionally signals that some kind of correction is
coming. Because these numbers are not as reliable in the traditional sense as
they used to be, please consider them only as reference points, and never
base any trades on them alone. Don’t forget that put/call ratios need to be
correlated with chart patterns.
154
Part II: Analyzing the Markets
14_287224-ch09.qxp 5/27/08 10:58 PM Page 154
In June 2005, the CBOE index put/call ratio was high during the period from
June 17–23, which included an options expiration week. During those five
trading sessions, three readings of the index put/option ratio were above
2.00; the highest reading of 2.75 occurred on June 21. If you had taken these
numbers at face value, you probably would have gone aggressively long,
expecting a likely rise in stock index futures. Unfortunately, you would have
been wrong!
On June 23 and 24, the Dow Jones Industrial Average lost more than 290
points, and the rest of the market got clobbered, too. Hindsight obviously
tells you that in this case, the rising put/call ratio was a signal that some-
body, or a group of people somewhere, was aware of information that
something interesting might happen that could shake the markets.
Common knowledge tells you that many people with lots of money have
access to information to which you and I would never be privy and that
we’d never be able to gather. The job of the trader is to look for signs that
something may be brewing.
And there it was — on Thursday, June 23, China’s third largest oil company,
CNOOC, bid $18 billion to purchase American oil company Unocal. The politi-
cal firestorm kicked off by this event certainly gave players a reason to sell
stocks.
Put/call ratios, like all sentiment indicators, are best used as alert mecha-
nisms for potential trend changes, not so much as the primary indicators on
which you base key decisions. Traditionally, high ratios tend to signal that a
great deal of pessimism exists in the markets and that the markets should
move higher. However, the truth is that in current markets, where hedge
funds and large institutions always are running complex derivative strategies,
high put/call ratios can be misleading.
Don’t ignore abnormal put/call ratio readings. Doing so can cost you signifi-
cant amounts of money in a hurry. As a result, take the following actions
apart from your daily routine:
Check the put/call ratios after the market closes. The CBOE usually
updates the numbers by 5 p.m. central time.
Favor thoughts of dramatic market reactions over thoughts of where
the market is headed when you see abnormally high or low put/call
ratios. Be ready to handle dramatic changes.
Immediately look for weak spots in your portfolio whenever abnor-
mal activity occurs in the options market. Abnormal activity should
trigger ideas about hedging.
155
Chapter 9: Trading with Feeling Now!
14_287224-ch09.qxp 5/27/08 10:58 PM Page 155
When you see abnormal put/call ratio numbers, consider the following:
Tightening stops on your open stock index futures positions.
Look for ways to hedge your portfolio. Some hedges include option
strategies, while others include buying or selling short positions in other
markets, such as bonds, energy, or metals.
Reversing positions. If you have a short position in the market, make
sure that you’re ready to reverse and go long or vice versa if you have a
long position.
Understanding the Relationship Between
Open Interest and Volume
Table 9-1 summarizes the relationship between volume and open interest.
Figure 9-2 (earlier in this chapter) shows a great example of how to combine
open interest and volume to predict a trend change.
Volume and open interest go hand in hand in futures trading. Generally,
volume and open interest need to be heading in the same direction as the
market. When the market starts rising, for example, you want to see volume
and open interest expanding. A rising market with shrinking volume and
falling open interest usually is one that is heading for a correction.
Table 9-1
The Relationship Between Volume and Open Interest
Price
Volume
Open Interest
Market
Rising
Up
Up
Strong
Rising
Down
Down
Weak
Declining
Up
Up
Weak
Declining
Down
Down
Strong
Note in Figure 9-2 how the market started to rally in early June. Both volume
and open interest (the line coursing above the volume bars) moved up. This
chart confirmed the rising trend in the E-mini S&P futures.
After June 13, however, the market started going sideways. Volume began to
fade, and open interest began to flatten out. Three days before the June 24
break, open interest fell precipitously, signaling that the rally was running
156
Part II: Analyzing the Markets
14_287224-ch09.qxp 5/27/08 10:58 PM Page 156

out of gas. Fading volume provided a great example of how smart money was
taking profits and being replaced by new, weaker buyers. Likewise, falling
open interest not only confirmed an impending downturn, but it also revealed
that traders with weak short positions were bailing out. The market thus was
losing buyers and sellers and its liquidity, which, in turn, made it vulnerable
to external events, such as the CNOOC/Unocal news.
When you plugged in rising put/call ratios with falling open interest in stock
futures, the result was a sign that the smart money sensed a rising risk in the
market. It was preparing itself by buying portfolio insurance in the form of
put options, which rise in price during falling markets. Smart money refers to
large institutions, hedge funds, or individuals. They have better access to
information than the market at times, and they tend to act ahead of the
crowd. Sometimes they’re correct, and other times they’re wrong. In this
example, they were correct.
Using Soft Sentiment Signs
Soft sentiment signs usually are out of the mainstream and are subtle, non-
quantitative factors that most people tend to ignore. They can be anything
from the shoeshine boy giving stock tips or a wild magazine cover (classic
signs of a top) to people jumping out of windows during a market crash
(a classic sign of the other extreme). These signs can be anywhere from dra-
matic to humorous, and they can be quite useful. By no means should you
make them a mainstay of your trading strategy. But they can at times be
helpful.
Scanning magazine covers
and Web site headlines
Based on my 1990 experience with BusinessWeek and the top in oil prices,
every time crude oil rallies, I start looking for crazy headlines, especially on
the Drudge Report. The Drudge Report (www.drudgereport.com) is a Web
site that can be, in my opinion, somewhat sensational, but still the old-school
indicators found there can be useful.
Look for clearly sensational headlines, such as those depicting the potential
end of an era, and so on. Some of the ones that appeared on Drudge in March
2008, as oil made all time highs were:‘“Bush: US Must “Get Off Oil”’ from
Reuters and “Swarm of Bay Area gas price records” from the San Francisco
Chronicle.
157
Chapter 9: Trading with Feeling Now!
14_287224-ch09.qxp 5/27/08 10:58 PM Page 157
When crude oil reached a then all-time high on June 17, 2005, I scanned
the covers of Time, Newsweek, and BusinessWeek. Time’s cover featured the
late Mao TseTung, BusinessWeek had senior citizens, and Newsweek had
dinosaurs. None of them even mentioned oil — a good soft sentiment sign
that the oil market still had some room to rise.
Monitoring congressional investigations
and activist protests
Another soft sign that a top may be near is what politicians and activists say
or do in relation to how the markets move. So, as oil made a new high in 2005,
I scanned the news for signs of senators and other members of Congress or
of activists who were calling for investigations or alleging that the oil compa-
nies were price gouging.
It took a while, but by the end of June, with Congress in full swing, the
attempted takeover of Unocal mobilized both sides of the aisle. Letters to
President Bush were written. Hearings were held at which Fed Chairman Alan
Greenspan and Treasury Secretary John Snow argued about China’s newly
found role as a world power and what the circumstances would likely be. The
markets worried about protectionism, as well they should — the last depres-
sion in the United States came as a result of Congress and President Herbert
Hoover concocting the Smoot-Hawley tariff.
As a contrarian, you must understand that the public going wild over an issue
can be a sign that a major turning point is on the way in the market.
Politicians and activists are no different these days, except that their lives
usually are not touched by reality the same way yours and mine are. They
start talking about something that you and I have experienced for months
only after they’ve read a new poll or received lots of letters and phone calls
from their constituents about the subject.
Political activity and outrage are no accident. They usually mean that the
public is interested in the current set of developments. The thing is, when
politicians and activists finally pick up the chant, they do so because
they see some kind of advantage for their cause or their chances of being
reelected. And that’s usually a sign that things are at a fever pitch, and the
trend can change, possibly in a hurry.
Don’t hurry. Just because your initial scan of the news fails to reveal key find-
ings doesn’t mean that those events are not on the way. People in Washington
sometimes take days to catch on to what’s going on elsewhere. Keep looking,
especially when the market is moving in the same direction.
158
Part II: Analyzing the Markets
14_287224-ch09.qxp 5/27/08 10:58 PM Page 158

Developing Your Own
Sentiment Indicators
A hot market eventually changes trends. It gets cold. No one knows when
that’s going to happen. By using sentiment indicators and confirming one
with another, you can get early warnings of pending changes.When any
market makes a new high, I usually go to the Drudge Report and look for the
headline. If it’s sensational enough, I start being careful about that particular
area of the market. Here are my favorite personal indicators:
If I start bragging to my wife about how much money I’m making in the
markets, I look for reasons to sell.
When my mother tells me that I need to start watching the NASDAQ the
way she did in the summer of 1999, I start to shake in my boots.
When everybody starts giving me tips, I run for the door. You can develop
your own private set of indicators by monitoring your own excitement level.
If you start feeling invincible, as if you’re the best trader in the world, being
a little more careful is a good idea. Make a mental checklist. I always check
my gut when I trade. If I’m all tied up in knots, I’m less concerned than if I’m
happy as a lark, because if I’m worried, I’m awake. Mind you, don’t make
yourself sick over it. If you can’t stand what you’re doing, then it isn’t for you.
The key is to search for some kind of balance within yourself by keeping your
eyes open, doing your homework, and comparing what’s going on in the
charts with what you’re reading and hearing from others.
159
Chapter 9: Trading with Feeling Now!
14_287224-ch09.qxp 5/27/08 10:58 PM Page 159

160
Part II: Analyzing the Markets
14_287224-ch09.qxp 5/27/08 10:58 PM Page 160
Part III
Financial Futures
15_287224-pp03.qxp 5/27/08 10:59 PM Page 161

In this part . . .
T
his part is where you get into the big money, starting
with interest-rate futures, going international with the
currency markets, and taking stock of stock index futures.
These three markets are the focal point of all trading, and
they often set the tone for the trading day in all markets
because they form a hub for the global financial system.
What’s good about these markets is that they’re great
places for you to get started in futures trading, so I provide
you with tips for doing just that.
15_287224-pp03.qxp 5/27/08 10:59 PM Page 162
Chapter 10
Wagging the Dog: Interest
Rate Futures
In This Chapter
Centering on bonds
Comparing the full spectrum of interest rates
Managing price risks by trading interest-rate futures
Trading short-term interest in Eurodollars and T-bills
Trading longer-term interest-rate futures
T
he bond market rules the world. Everything that anyone does in the
financial markets anymore is built upon interest-rate analysis. When
interest rates are on the rise, at some point, doing business becomes difficult,
and when interest rates fall, eventually economic growth is energized.
That relationship between rising and falling interest rates makes the markets
in interest-rate futures, Eurodollars, and Treasuries (bills, notes, and bonds)
important for all consumers, speculators, economists, bureaucrats, and
politicians.
This chapter provides you with a detailed and useful introduction to a
snapshot of how you can structure your analysis and trading in these major
instruments, but it isn’t meant to be an all-inclusive treatise on interest
rates and trading techniques.
Globalization is here to stay. At the center of the globalization phenomenon
is the entity known as the bond market. As a futures trader, you are likely
to deal mostly, but not exclusively, with the U.S. Treasury bond futures.
However, over the next 10 or 20 years, or perhaps sooner, the European
bond market, and more than likely bond markets in Dubai and China, will
play significant roles in the global economy. (See “Globalizing the markets,”
later in this chapter.)
16_287224-ch10.qxp 5/27/08 11:00 PM Page 163

Bonding with the Universe
At the center of the world’s financial universe is the bond market. And at the
center of the bond market is its relationship with the United States Federal
Reserve (the Fed) and the way the Fed conducts interest-rate policies.
By law, the Fed’s two main functions are
Creating and maintaining conditions that keep inflation in check
Maintaining full employment
Full employment is viewed by some as being potentially inflationary
because it creates a scenario of too much money chasing too few goods and
services — a primal definition of inflation that’s not far from also defining
capitalism.
Inflation decreases the return on bondholders’ investments, acting the way
sunlight does to a vampire. When you buy a bond, you get a fixed return, as
long as you hold that bond until it matures or, in the case of some corporate
or municipal bonds, until it’s called in. If you’re getting a 5 percent return
on your bond investment and inflation is growing at a 6 percent clip, you’re
already 1 percent in the hole, which is why bond traders hate inflation.
The connection between the bond market, the Federal Reserve, and the rest
of the financial markets is fundamental to understanding how to trade futures
and how to invest in general. In the next section, I discuss the most impor-
tant aspects of how it all works together.
Looking at the Fed and bond-market roles
The Fed cannot directly control the long-term bond rates that determine how
easy (or difficult) it is to borrow money to buy a new home or to finance long-
term business projects. What the Fed can and does do is adjust short-term
interest rates, such as the interest rate on Fed funds, the overnight lending
rate used by banks to square their books, and the discount rate, or the rate at
which the Fed loans money to banks to which no one else will lend money.
As the Fed senses that inflationary pressures are rising through analyzing key
economic reports, such as consumer prices, producer prices, the employ-
ment report, and its own Beige Book (see Chapter 6), it starts to raise interest
rates. The Fed usually raises the Fed funds target rate, which focuses on
overnight deposits between banks. Occasionally, when the Fed wants to make
a point that it’s in a hurry to make rates rise, it also raises the discount rate,
the rate that the Fed charges banks to borrow at its discount window, which
usually is a loan of last resort for banks and a signal to the Fed that the
Part III: Financial Futures
164
16_287224-ch10.qxp 5/27/08 11:00 PM Page 164

individual bank is in trouble. When the Fed raises the Fed funds and/or the
discount rates, banks usually raise the prime rate, the rate that targets their
best customers. At the same time, credit-card companies raise their rates.
As the bond market senses inflationary pressures are rising, bond traders
sell bonds and market interest rates rise. Rising market interest rates usually
trigger rate increases for mortgages and car loans, which usually are tied to a
bond market benchmark rate. For example, most 30-year mortgages are tied
to the interest rate for the U.S. one-year Treasury note. I know that sounds
confusing, but that’s the way these things are structured.
When it comes down to recognizing when inflation is lurking, sometimes the
bond market takes action ahead of the Fed, but other times the Fed is ahead
of the market. Sometimes the bond market senses inflation before the Fed
does. When that happens, bond prices fall, market rates rise (such as the
yield on the U.S. ten-year T-note), and the Fed raises rates if its indicators
agree with the bond market’s analysis. Whenever the Fed disagrees with the
markets, it signals those disagreements usually through speeches from Fed
governors or even the chairman of the Fed. Interest rates are a two-way
street: The bond market sometimes disagrees with the Fed, and the Fed
sometimes disagrees with the market.
Disagreements between the Fed and the bond market usually occur at the
beginning or at the end of a trend in interest rates. Say, for example, that the
Fed continually raises interest rates for an extended period of time. At some
point, long-term rates, which are controlled by the bond market, begin to
drop, even though short-term rates are on the rise. Falling long-term bond
rates usually are a sign from the bond market to the Fed that the Fed needs
to consider pausing its interest-rate increases. The opposite also is true:
When the Fed goes too far in lowering short-term rates, bond yields begin
to creep up and signal the need for the Fed to consider a pause in its lowering
of the rates.
The Federal Reserve lowers interest rates in response to signs of a slowing
economy. Two dramatic examples came in the period after the 9/11 attacks
on the World Trade Center, when the central bank lowered interest rates dra-
matically. The first one came immediately after the attacks when the Federal
Reserve lowered interest rates aggressively starting on September 17, 2001,
with the Fed Funds rate reaching an all time low at 1 percent.
Another example, one in which the Fed acted with some nuance, came in
2007. The nuance came in the Fed’s clear delineation between its use of the
discount rate and the Fed Funds rate, something that the central bank had
not done in recent times to any extent.
In this case, the Fed used the discount rate, which is meant to target the
banking sector rather than the consumer sector. In August 2007, the Fed
lowered the discount rate alone, as it was trying to encourage banks to
borrow from the discount window during the subprime mortgage crisis.
165
Chapter 10: Wagging the Dog: Interest Rate Futures
16_287224-ch10.qxp 5/27/08 11:00 PM Page 165

The Fed then lowered the Fed Funds rate and the discount rate a second time
on September 18 and continued to lower them into 2008 as the U.S. economy
continued to show signs of slowing. In January and February 2008, the U.S.
employment report actually showed job losses, usually a sign of major
trouble in the economy. See chapter 6 for more on the importance of the
employment report in the U.S.
The Fed aimed its August discount rate cut by saying that the purpose of
the change in the rate was to “promote the restoration of orderly conditions
in financial markets, to which end the Federal Reserve Board approved
temporary changes to its primary credit discount window facility.”
In the statement announcing the Fed Funds rate and the second discount rate
cut, the Fed noted, “Today’s action is intended to help forestall some of the
adverse effects on the broader economy that might otherwise arise from the
disruptions in financial markets and to promote moderate growth over time.”
The bond market responded to the Fed’s initial discount rate move with a
nice rally. But the second move, because it came with a Fed Funds rate
cut, led to a decline in the bond market, raising interest rates. By October,
though, the bond market had started to rally again, as signs of a weakening
economy, and thus the potential for a decline in inflation, began to surface.
Hedging in general terms
In general, hedging is taking a position in the market that’s in the opposite
direction of a trading position you’ve already established; it’s a form of
insurance against a reversal of trends. You need to know what the opposition
is doing anyway so that you’re better able to make your market move. In the
world of short-term interest rates, aside from speculators, the big money
comes from money-market funds and corporations.
Generally, money-market fund managers and corporate traders go long or
short in the direction that’s opposite their borrowing or lending. Borrowers
generally want to hedge against rising interest rates, so they tend to short
the market. That way, if interest rates rise, they either reduce their future
interest-rate costs or actually profit from the situation.
Money-market funds and corporations borrow and lend millions of dollars on
a daily basis, so the short-term interest-rate market, especially in Eurodollars
and related contracts, is the way they hedge their exposure. Here’s how
hedging works for the various participants:
Lenders: Banks and other lending institutions want to hedge against
falling interest rates, so they tend to be long on the market. They know
that they’ll be lending money to someone in the future, and if interest
Part III: Financial Futures
166
16_287224-ch10.qxp 5/27/08 11:00 PM Page 166

rates continue to fall, their profits will be reduced accordingly. By using
futures strategies, they lessen the impact of having to charge less
interest and thus help curtail potential future losses.
Institutions decrease their risk when they sense that rates are going to
fall by establishing long positions in bonds, T-bills, or Eurodollar futures
contracts in order to protect their future earnings. The money that
they make when they sell their contracts goes to the bank’s bottom line,
balancing revenue lost from lending to customers at lower interest
rates. This strategy is by no means perfect, but if the institution does
it correctly, it at least cushions the blow.
Corporate treasurers: These big-money institutions use sophisticated
formulas based on the need to protect their cash flow and future
expenses. They also hedge against the risk of adverse international and
geopolitical events and against nonpayment by high-risk customers by
using the short- and long-term interest-rate futures markets.
For example, say you’re the chief financial officer at an international
paper products company that has multiple risks, such as the price of
lumber and pulp to make paper and related products and a large cus-
tomer base in Latin America, meaning that political instability is a major
factor you must consider when running your business. By using lumber
futures and currency hedges and by varying your strategies based on
market conditions and analysis, you can decrease the risk of material
shortages and political instability to your company’s earnings.
Speculators: Traders just like you and me always want to trade with the
trend, which is why technical analysis (see Chapter 7) is so helpful in
futures trading. By the time a tick is printed on a chart, it’s as good of a
snapshot as there is for all hedging and speculating that has taken place
up to that instant in time.
Speculators generally trade on the long side when a particular market is
rising and then go short when the market is falling. Speculative hedging tech-
niques often involve setting up option strategies that are the opposite of
established trading positions, such as buying stock index put options on the
S&P 500 to hedge a long S&P position.
The same is true when you have a short position. In that case, speculators
may buy call options on the S&P 500 or other stock index futures such as
the E-mini.
In a flat market, a speculator can write S&P 500 calls to hedge the same long
position. And you can use intermarket trades. I discuss the basics of the
options markets in Chapter 4. For example, if you have a long dollar position
and you’re not sure that the market is topping out, but you’re not quite ready
to sell your position, you can consider buying a gold call option because gold
tends to rise when the dollar falls. (For more about speculating strategies,
see Chapter 8.)
167
Chapter 10: Wagging the Dog: Interest Rate Futures
16_287224-ch10.qxp 5/27/08 11:00 PM Page 167

Globalizing the markets
Globalization, or essentially the spread of capitalism around the world, has
increased the number of short-term interest-rate contracts that trade at the
Chicago Mercantile Exchange (CME) and around the world. Although details
of market globalization are not the focus of this chapter, you nevertheless
need to know that these contracts exist and that the volume of trades at
times is just as heavy in Eurodollars as it is in T-bills.
In fact, just about every country in the world with a convertible currency
has some kind of bond or bond futures contract that trades on an exchange
somewhere around the world. The following are not complete lists, but they
offer snapshots of some of the more liquid contracts.
Short-term global plays include the following:
Fed funds futures: Fed funds futures trade on the CME and are an
almost pure bet on what the Federal Reserve is expected to do with
future interest rates. Fed funds measure interest rates that private banks
charge each other for overnight loans of excess reserves. These inter-
bank loans usually are intended to square or balance the books of the
banks involved. The rates often are quoted in the media. Each Fed funds
contract lets you control $5 million and is cash settled. The tick size as
described by the Chicago Board of Trade (CBOT) is “$20.835 per
1
⁄
2
of
one basis point (
1
⁄
2
of
1
⁄
100
of 1 percent of $5 million on a 30-day basis
rounded up to the nearest cent).” Margins are variable, depending on
the tier in which you trade, and they range from $304 to $1350 and $225
to $1000 respectively, for initial and maintenance margins. A tier is just a
time frame. The longer the time frame before expiration, the higher the
margin. For full information, you can visit the CBOT’s margin page at
www.cbot.com/cbot/pub/page/0,3181,2142,00.html#1b
. Fed
funds contracts are quoted in terms of the rate that the market is specu-
lating on by the time the contract expires, and they’re based on the
formula found at the CBOT: “100 minus the average daily Fed funds
overnight rate for the delivery month (for example, a 7.25 percent rate
equals 92.75).”
LIBOR futures: These futures are one-month, interest-rate contracts
based on the London Interbank-Offered Rate (LIBOR), the interest rate
charged between commercial banks. LIBOR futures have 12 monthly
listings. Each contract is worth $3 million. The role of LIBOR futures is
to offer professionals a way to hedge their interest portfolio in a similar
fashion to that offered by Eurodollars. The minimum increment of
price movement is “0.0025 (
1
⁄
4
tick = $6.25) for all contracts. The major
difference: Margin requirements are less for LIBOR, at $743 for initial
and $550 for margin maintenance, compared with margins of $-1013 and
$750 for respective Eurodollar contracts. A good way for a new trader
Part III: Financial Futures
168
16_287224-ch10.qxp 5/27/08 11:00 PM Page 168
to decide between the highly liquid and popular Eurodollar and
LIBOR contracts — which offer essentially the same type of trading
opportunities — is to paper trade both contracts after doing some
homework on how each contract trades.
The LIBOR contract was very important for traders and hedgers in
2007, as the initial liquidity problems from the subprime mortgage
crisis occurred in Europe. Because of the LIBOR contract, both sides —
hedgers and speculators — were able to profit or to some degree
protect their own side of the ledger.
It’s easy to be put off by the large amounts of money that are held
in futures contracts, such as the $3 million in a LIBOR contract. No
matter what contract you trade, though, you need to think in terms of
short holding periods, especially if the position is moving against you.
Consider how much you may actually have to pay up (if you’re long) if
you don’t sell before the contract rolls over (the amount specified by
the contract — $3 million). Small traders usually trade Eurodollars,
while pros with large sums and more experience tend to trade LIBOR.
See the section “Playing the Short End of the Curve: Eurodollars &
T-Bills,” later in this chapter.
Euroyen contracts: These contracts represent Japanese yen deposits
held outside of Japan. Open positions in these contracts can be held at
CME or at the SIMEX exchange in Singapore. Euroyen contracts are
listed quarterly, trade monthly, and offer expiration dates as far out as
three years. That long-term time frame can be useful to professional
hedgers with specific expectations about the future.
CETES futures: These 28-day and 91-day futures contracts are based on
Mexican Treasury bills. These instruments are denominated and paid
in Mexican pesos, and they reflect the corresponding benchmark rates
of interest rates in Mexico.
Longer-term global plays include Eurobond futures. The Eurobond market is
composed of bonds issued by the Federal Republic of Germany and the Swiss
Confederation that usually are the second most traded bond futures con-
tracts in volume after the U.S. Treasury bonds. On some days, however, they
can trade larger volumes than U.S. Treasuries.
Eurobonds come in four different categories: Euro Schatz, Euro Bobl, Euro
Bund, and Euro Buxl. The duration on each respective category is 1.75 years,
4.5 to 5.5 years, 8.5 to 10.5 years, and 24 to 35 years. The contract size is for
100,000 euros or 100,000 Swiss francs, depending on the issuer. Eurobonds
can be traded in the United States. The basic strategies are similar to U.S.
bonds because they trade on economic fundamentals and inflationary expec-
tations, and they respond to European economic reports similar to the way
U.S. bonds respond to U.S. reports.
169
Chapter 10: Wagging the Dog: Interest Rate Futures
16_287224-ch10.qxp 5/27/08 11:00 PM Page 169
Some particulars about Eurobond futures:
Foreigners hold half of all Euro Bunds.
Euro Bunds are the most active Eurobond contract traded at the totally
electronic Eurex Exchange in Frankfurt.
Both Euro-Schatz and Euro-Bobl contracts rank in the top ten of all
futures contracts in global trading volume.
Yielding to the Curve
The yield curve is a representation on a graph that compares the entire spec-
trum of interest rates available to investors. Figures 10-1 and 10-2, respec-
tively, are excellent illustrations of the U.S. Treasury yield curve and rate
structure at a time when inflationary expectations are under control and the
economy is growing steadily. The curve and the table are from July 1, 2005,
just 2 days after the Federal Reserve raised interest rates for the ninth
consecutive time in a 12-month period.
Figure 10-2 depicts a standard, table-style snapshot of all market maturities
for the U.S. Treasury. You can view a good yield curve daily in Investor’s
Business Daily, either in its digital newspaper or the newsstand version.
As you review Figures 10-1 and 10-2, notice the following:
The longer the maturity, the higher the yield: That relationship is
normal for interest-paying securities, because you’re lending your
money to someone for an extended period of time, and you want them
to pay you a premium for the extra risk.
The yield on all securities rose: Starting with the 3-month Treasury
bill (T-bill) and ending with the 30-year bond, all yields rose, compared
with the previous week and month, after the Fed raised interest rates.
That’s because the Federal Open Market Committee (FOMC), in remarks
made after announcing the most recent rate increase in the Fed funds
rate, told the market that inflation was controlled, but economic growth
still warranted a “measured” pace of continuing interest-rate increases.
To a bond trader, that meant that the Fed would continue raising inter-
est rates until it otherwise saw fit, and it meant that the economic
perceptions of the bond market and the Fed were in agreement.
Had the bond market disagreed with the Fed, yields for longer-term maturi-
ties would have fallen, because the bond market would be signaling to the
Fed that the economy was starting to slow and that it (the Fed) needed to
consider taking a pause or even ending its rate hikes.
Part III: Financial Futures
170
16_287224-ch10.qxp 5/27/08 11:00 PM Page 170
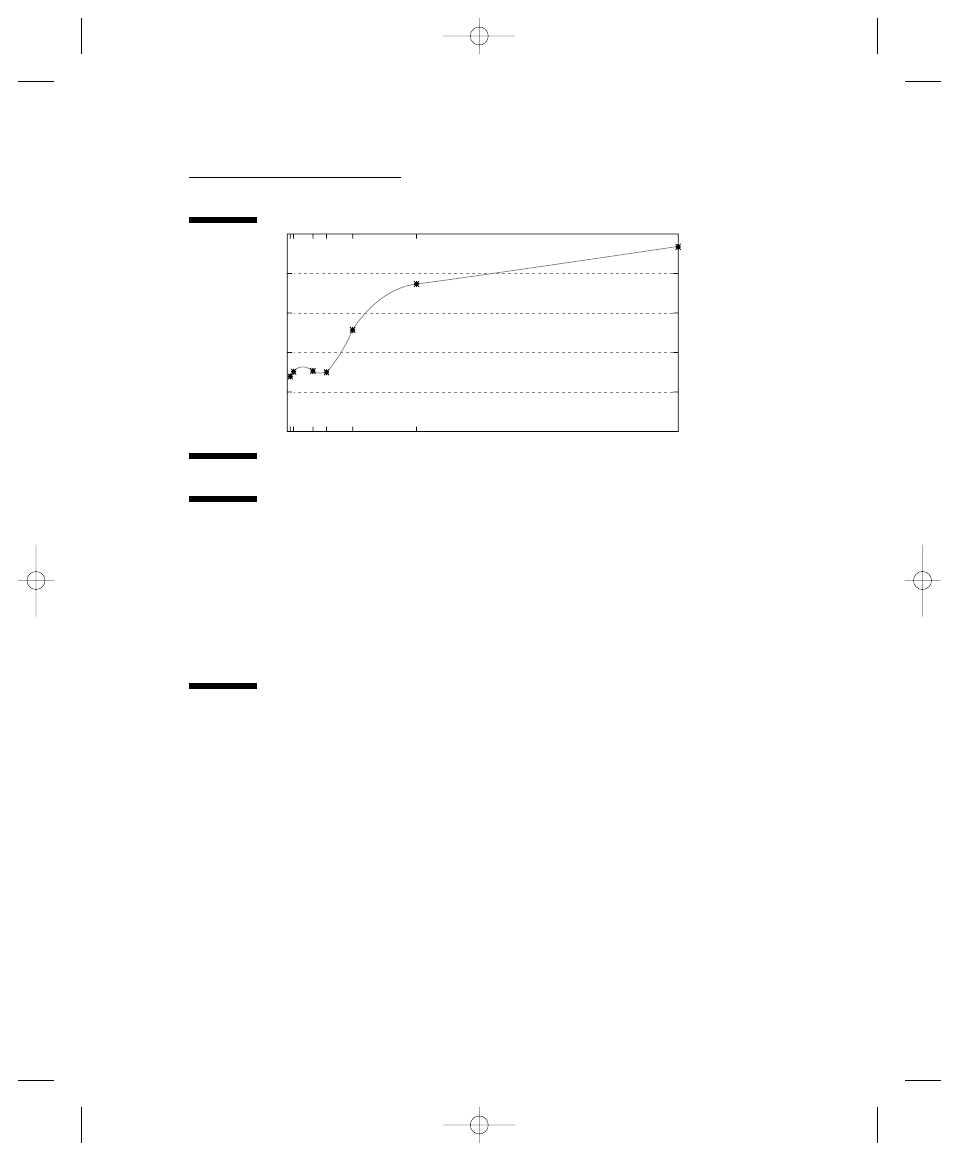
Deciding Your Time Frame
From a trader’s standpoint, you want to consider trading the short term, the
intermediate term, or the long term.
Each position has its own time, place, and reasoning, ranging from how much
money you have to trade to your individual risk tolerance, and whether your
analysis leads you to think that the particular area of the curve can move
during any particular period of time.
A quick-and-dirty rule of thumb is that the longer the maturity, the greater
the potential reaction to good or bad news on inflation. In other words, the
farther out you go on the curve, the greater the chance for volatility.
US Treasury Bonds
Maturity
3 Month
6 Month
2 Year
3 Year
5 Year
10 Year
30 Year
Yield
1.35
1.48
1.50
1.46
2.42
3.52
4.54
Yesterday
1.27
1.52
1.50
1.46
2.46
3.58
4.56
Last Week
1.71
1.71
1.62
1.60
2.47
3.51
4.40
Last Month
2.00
2.02
1.95
1.93
2.66
3.60
4.36
Figure 10-2:
A U.S.
Treasury
summary
shows all
the common
maturity
listings and
the price
changes.
3m
0%
1%
2%
3%
4%
3y
5y
U.S. Treasury Yield Curve
08–Mar–2008
10y
30y
Figure 10-1:
A U.S.
Treasury
yield curve
describes
the interest-
rate
differential
between
long- and
short-term
interest
rates.
171
Chapter 10: Wagging the Dog: Interest Rate Futures
16_287224-ch10.qxp 5/27/08 11:00 PM Page 171

Eurodollars are the best instrument for trading the short term, because they
are liquid investments, meaning that they’re easy to buy and sell because the
market has a large number of participants. The opposite of a liquid market is
a thin market, in which the number of participants tends to be smaller, the
spread between bid and offer prices tends to be farther apart, and the poten-
tial for volatility is larger. Grain markets can be thin markets (see Chapter
16). For long- and intermediate-term trading, you can use the 10-year T-note
and 30-year T-bond futures.
Eurodollars are well suited for small traders, because margin requirements
tend to be smaller, and the movements can be less volatile; however, don’t
consider those attractive factors a guarantee of success by any means. Any
futures contract can be a quick road to ruin if you become careless.
Ten-year T-note and T-bond futures can be quite volatile, because large
traders and institutions usually use them for direct trading and for compli-
cated hedging strategies.
You can use options and exchange-traded mutual funds (ETFs) for trading all
of these interest-rate products by applying the basic options and ETF rules
and strategies described in Chapters 4 and 5.
Shaping the curve
Several informative shapes can be seen on the yield curve. Three important
ones are
Normal curves: The normal curve rises to the right, and short-term
interest rates are lower than long-term interest rates. Pretty simple, eh?
Economists usually look at this kind of movement as a sign of normal
economic activity, where growth is ongoing and investors are being
rewarded for taking more risks by being given extra yield in longer-term
maturities.
Flat curves: A flat curve is when short-term yields are equal or close
to long-term yields. This type of graph can be a sign that the economy
is slowing down, or that the Federal Reserve has been raising short-
term rates.
Inverted curves: An inverted curve shows long-term rates falling below
short-term rates, which can happen when the market is betting on a
slowing of the economy or during a financial crisis when traders are
flocking to the safety of long-term U.S. Treasury bonds.
Part III: Financial Futures
172
16_287224-ch10.qxp 5/27/08 11:00 PM Page 172

Checking out the yield curve
By keeping track of the yield curve, you’re achieving several goals that Mark
Powers describes in Starting Out In Futures Trading (Probus Publishing). By
checking out the yield curve, you can
Focus on the cash markets. Doing so enables you to put activity in the
futures markets in perspective and provides clues to the relationships
among prices in the futures markets.
Watch for prices rising or falling below the yield curve, indications that
can be good opportunities to buy or sell a security.
Know that prices above the yield curve point to a relatively underpriced
market.
Know that prices below the curve point to a relatively overpriced
market.
Getting the Ground Rules
of Interest-Rate Trading
Interest-rate futures serve one major function. They enable large institutions
to neutralize or manage their price risks.
As an investor or speculator who trades interest-rate futures, you look at the
markets differently than banks and other commercial borrowers. The inter-
est-rate market is a way for them to hedge their risk, but for you, it’s a way to
make money based on the system’s inefficiencies, which often are created by
the current relationships among large hedgers, the Fed, and other major play-
ers, such as foreign governments.
A perfect example of an inefficient market is when a large corporation wants
to sell a big bundle of bonds but can’t seem to find buyers. When this hap-
pens, the corporation is forced to offer a higher yield for its paper. This situa-
tion can spread into the treasury markets, as the lack of interest for the
corporate offering raises the yields on the corporate bond package. At some
point the yield may become attractive enough to attract buyers. Yet, in some
instances treasury prices may fall and yields rise as some players sell treas-
ury bonds to raise money to buy the corporate bonds because they offer a
higher interest rate.
That kind of situation arises occasionally and can create volatility in both the
corporate and treasury bond markets. Sometimes, these short-term gyrations
can offer entry points into the treasury futures bond market on the long or
173
Chapter 10: Wagging the Dog: Interest Rate Futures
16_287224-ch10.qxp 5/27/08 11:00 PM Page 173
the short side, depending, of course, on the prevailing market and the price
trends at the time.
Generally, you want to watch for the following:
Opportunities to trade the long-term issues when interest rates are
falling
Opportunities to sell bonds short when the prevailing tone is toward
higher interest rates
Nevertheless, regardless of rules or general tendencies of markets, focusing
on what’s happening at the moment and trading what you see are important
guidelines to follow.
When trading international interest-rate contracts, you must consider the
effects of currency conversion. If you just made a 10 percent profit trading
Eurobunds but the euro fell 10 percent, your purchasing power has not
grown.
When getting ready to trade, make sure that you do the following:
Calculate your margin requirements. Doing so enables you to know how
much of a cushion for potential losses you have available before you get
a margin call and are required to put up more money to keep a position
open. Never put yourself in a position to receive a margin call.
Price in how much of your account’s equity you plan to risk before you
make your trade.
Canvass your charts so that you know support and resistance levels on
each of the markets that you plan to trade, and then you can set your
entry points above or below those levels, depending, of course, on
which way the market breaks.
Be ready for trend reversals. Although you need to trade with the trend,
you also must be ready for reversals, especially when the market
appears to be comfortable with its current trend.
Understand what the economic calendar has in store on any given day.
Knowing the potential for economic indicators of the day to move the
market in either direction prepares you for the major volatility that can
occur on the day they’re released.
Pick your entry and exit points, including your worst-loss scenario —
the possibility of taking a margin call.
Decide what your options are if your trade goes well and you have
a significant profit to deal with.
Part III: Financial Futures
174
16_287224-ch10.qxp 5/27/08 11:00 PM Page 174
Playing the Short End of the
Curve: Eurodollars & T-Bills
When you trade the short end of the curve, you’re using Eurodollars, T-bills,
LIBOR, or short-term Eurobond futures as your trading vehicle.
Treasury bills and Eurodollars are not the same thing, although they are
expressions of short-term interest rates and trade in the same direction. You
can lose money trading T-bill futures, just as you can when you trade
Eurodollar futures.
Eurodollar basics
A Eurodollar is a dollar-denominated deposit held in a non-U.S. bank. A
Eurodollar contract gives you control of $1 million Eurodollars and is a
reflection of the LIBOR rate for a three-month, $1-million offshore deposit.
Eurodollars are popular trading instruments that have been around since
1981. Following are some facts about Eurodollars that you need to know:
A tick is the unit of movement for all futures contracts, but in the case of
Eurodollars, a point = one tick = 0.1 = $25. If you own a Eurodollar con-
tract, and it falls or rises four ticks, or 0.4, you either lose or gain $100,
respectively. Eurodollars can trade in
1
⁄
4
or
1
⁄
2
points, which are worth
$6.25 and $12.50, respectively.
Eurodollar prices are a central rate in global business and are quoted in
terms of an index. For example, if the price on the futures contract is
$9,200, the yield is 8 percent.
Eurodollars trade on the CME with contract listings in March, June,
September, and December. Different Eurodollar futures contracts suit dif-
ferent time frames. Some enable you to trade more than two years from
the current date. This kind of long-term betting on short-term interest
rates is rare, but sometimes large corporations use it. For full details, it’s
always good to check with your broker about which contracts are avail-
able, or go to the CME Web site.
Trading hours for Eurodollars are from 7:20 a.m. to 2:00 p.m. central time
on the trading floor, but they can be traded almost 24/7 on Globex, the
electronic trading home of a large variety of futures contracts. For
Eurodollars, Globex is shut down only between 4 and 5 p.m. nightly.
The initial maintenance margins for trading Eurodollars in March 2008
would be $1,013 and $750, respectively.
175
Chapter 10: Wagging the Dog: Interest Rate Futures
16_287224-ch10.qxp 5/27/08 11:00 PM Page 175

Trading Eurodollars
Eurodollars are the most popular futures trading contract in the world,
because they offer reasonably low margins and the potential for fairly good
return in a short period of time.
You want to trade Eurodollars when events are occurring that are likely to
influence interest rates. If you grasp the concept of trading Eurodollars,
you’re also set to trade other types of interest-rate futures, as long as you
understand that each individual contract is going to have its own special
quirks and idiosyncrasies. The CME has an excellent education section on its
Web site at
www.cme.com/edu/
.
If you trade interest-rate futures, here are some basic factors to keep in mind:
Check the overall trend of the market.
Consider whether the market is oversold or overbought.
Decide how much you’re willing to risk before you enter the trade.
Look at the overall background for the trade you’re going to execute
before doing so.
Picking your spot to trade
A good opportunity for trading Eurodollars futures was the week ending July
1, 2005, when the economic calendar was heavy in terms of the number of
releases and their importance regarding what the Fed was likely to do next
with interest rates. Included on the calendar, the Fed had a two-day meeting
scheduled at which it was widely expected to raise interest rates.
Aside from the Fed’s announcement on interest rates the afternoon of June
30, the economic calendar featured two particularly tradable reports on July
1: the University of Michigan Consumer Sentiment Index and the Institute for
Supply Management (ISM — purchasing manager’s) report. Each is a key
barometer of activity for a major cog in the economic food chain.
The Fed raised interest rates on June 30 and told the markets that they could
expect them to be raising rates again in the future. Economic reports all
showed signs of a strengthening economy. And the markets were poised for
such a set of developments.
Figure 10-3 shows three months’ worth of trading in the July 2005 Eurodollar
contract. Note that the price break below the moving average on the far right,
correctly predicted a fall in prices. Also note the overall downtrend in the
Eurodollar during the three-month period, which is a sign of rising interest
rates. The implied (interest) rate for this contract at the close on July 1 was
3.6175 percent, up from 3.40 in May. You can calculate the implied rate by
subtracting the contract price from 100, as described in the earlier
“Globalizing the markets” section.
Part III: Financial Futures
176
16_287224-ch10.qxp 5/27/08 11:00 PM Page 176
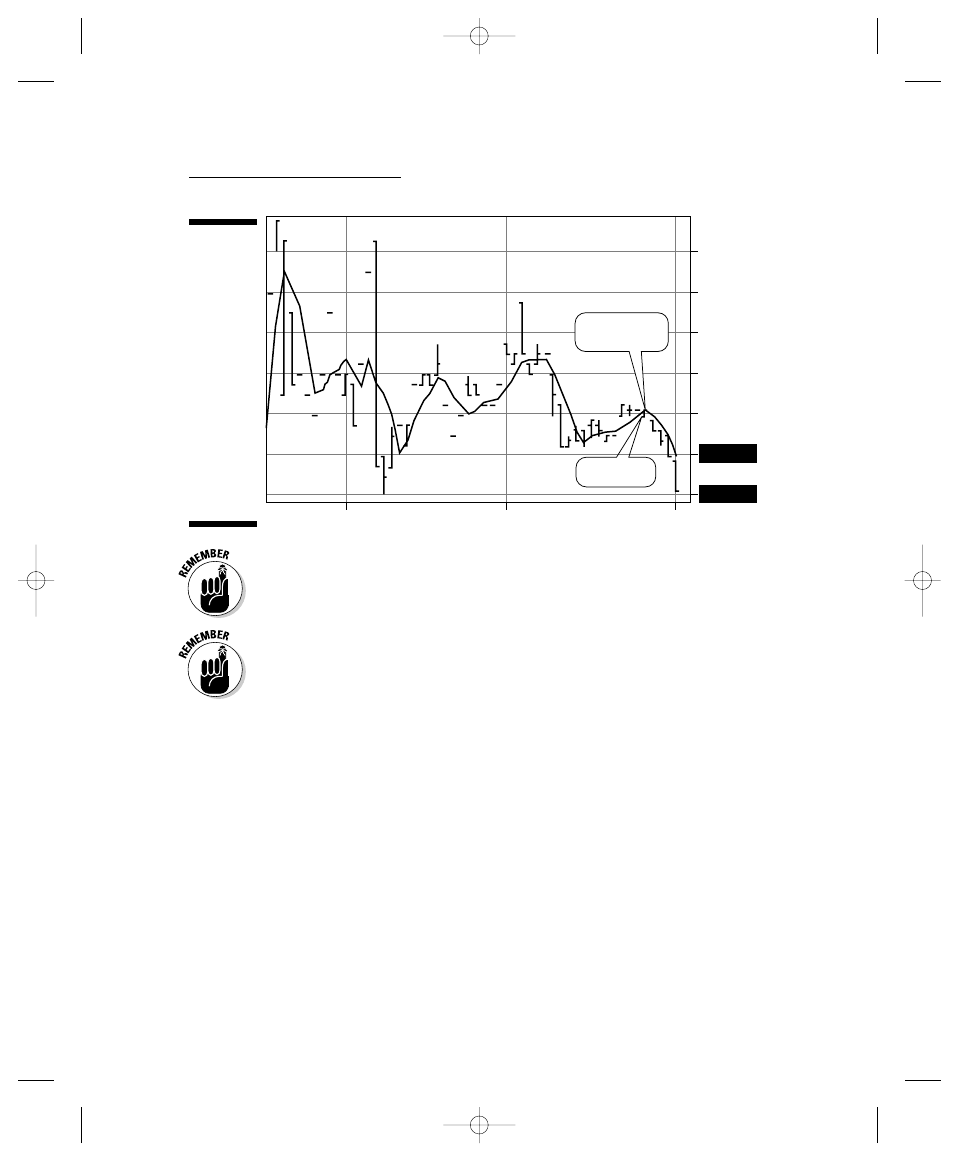
You want to trade with the trend, so the path of least resistance in this
trade was to go short. (See Chapters 7, 8, and 19 for more information about
going short.)
Eurodollars trade almost around the clock, so great gains from a good
intraday session can be wiped out or significantly reduced if a major event
happens overnight. All futures that trade on Globex or other electronic
round-the-clock systems are affected in the same way.
Managing your trade
Assume for a moment that you shorted one contract when the price slipped
below the four-day moving average on June 27 so that your order was filled at
the close of the regular session at 9642. To protect yourself and cover your
short position, you put a buy stop five ticks above the moving average, at
9647, thus limiting your loss to $125 above the crossover price. Thereafter,
you adjust the stop on a daily basis to protect your gains based on your risk
tolerance. In this example, I use broad numbers, but you need to set your
stop in a way that you don’t risk a margin call if the trade goes against you. In
other words, in this trade, your losses need to be limited to no more than
$245 (roughly a ten-tick loss), because a $245 loss will get you a margin call if
all you have to start with is the minimum margin of $945 (your account
equity would have dropped to $700).
Setting your stop a good distance from the margin call is a good idea, though,
to allow some leeway in case the market moves fast against you. The more
room between your stop and the margin call, the better off you are. The more
you trade, the more you’ll develop a sense of what your risk tolerance is.
May
Jun
Jul
9650.0000
9648.0000
9649.0000
9644.0000
9642.0000
9638.2500
9640.0625
Put protective
stop here
Short here
Figure 10-3:
A chart
of the
Eurodollar’s
July 2005
contract
illustrates a
good oppor-
tunity to sell
short and
how to
calculate
implied con-
tract inter-
est rates
based on
prices.
177
Chapter 10: Wagging the Dog: Interest Rate Futures
16_287224-ch10.qxp 5/27/08 11:00 PM Page 177
A stop is not a guarantee that you’ll get out of a position at the point speci-
fied by your stop-loss order. Sometimes you get the closest price to the stop,
depending on market conditions. See Chapter 3 for a review of different types
of orders.
The trade that I describe in this section is a high-risk and purely hypothetical
trade that’s intended only to illustrate how to manage your margin and how
the Eurodollar market works. You should never trade any futures contract
unless you have enough equity in your account to do so, which in this case
you don’t.
As a general rule, you should never risk any more than 5 percent of your
equity on any one trade with a small account. The bare minimum require-
ment for trading futures as an individual small speculator is widely accepted
to be no less than $20,000, although $5,000–10,000 may be good enough if
you’re very good at managing your risk and develop a keen sense of timing
and discipline. See Chapters 17, 18, and 19 to review trading plans and
strategies.
By the close of trading July 1, after a five-day holding period, the gain on the
hypothetical trade was $93.75. A good move then would have been to move
your stop down to 9642 so that a gain would not turn into a loss if the market
turned against you. You should also continue to change your stop as the
market continues to gain roughly in equal increments to the gains that you’re
getting from the trade.
During this trade, your margin never fell to $700, because you set your stop
to get you out before you got a margin call.
A ten-point move in the July Eurodollar contract (Figure 10-3) is worth $250
per contract, $25 per point.
If you happened to be short, or betting on falling Eurodollar prices, like in
the example, a fall of this size would make you a good profit, as long as you
continued to trade with the overall trend and continued to adjust your stop.
If you were long, or betting on higher prices, you’d lose. In a small account,
even a $250 loss could be significant, but if you used good risk-management
techniques, such as a trailing stop like the one described in the example that
accompanies Figure 10-3, you wouldn’t let the Eurodollar contract move
against you that far. See Chapter 17 for more about trading plans.
At this point, the example trade has earned a nice profit of 3.75 ticks, or
$93.75 per contract over five days. Your account started at $945 and rose to
$1,038.75. So right before a three-day July 4th holiday weekend, when the
Group of Eight was meeting in London with large numbers of demonstrators
present and a nine-country rock concert was planned to raise awareness for
the famine in Africa, you could have
Part III: Financial Futures
178
16_287224-ch10.qxp 5/27/08 11:00 PM Page 178
Closed the position and taken your profits, less commissions.
Tightened your short covering stop by setting it at 9641.05, just above
the closing price (9640.0625); refer to Figure 10-3.
Sold a portion of your position if you had more than one contract, taking
a part of your profits and adjusting the remaining position by tightening
your stop.
Considered establishing option strategies. In this case, because you’re
short, a call option would be the correct move. A put option would be
the correct choice if you were long, because a put option generally rises
in price when the market falls. (See Chapter 4 for the basics of options
trading.)
By now, you’re probably wondering what to do if you’re the subject of a
margin call. For starters, you need to follow a good rule of thumb used by
professionals: Never risk more than 50 percent of your total account equity
when trading. For example, if you had followed that rule, you never would
have bought the one Eurodollar contract in the example above, because you
had only $945 in your account. Assuming that you had more money, and
you made a good trade, in the future, you’d still buy one Eurodollar contract
and keep 50 percent of your equity in your account.
If you do get a margin call, you can
Liquidate your position to meet the call and then take a break for a few
days until you get your wits back together.
Sell some of your position to meet the call.
Deposit new money into your account to meet the call.
Plan your trades so that you never get a margin call. That’s the best way. Do
it by carefully following the rules outlined in this section, having enough
money in your account, never risking more than 10 percent of your equity on
any one position (5 percent if your account’s small), and calculating your
maximum risk while keeping it below the amount that results in a margin call.
Trading Treasury-bill futures
A 13-week T-bill contract is considered a risk-free obligation of the U.S. gov-
ernment. In the cash market, T-bills are sold in $10,000 increments, such that
if you paid $9,600 for a T-bill in the cash market, an annualized interest rate
yield of 4 percent is implied. At the end of the 3 months (13 weeks), you’d get
$10,000 in return.
179
Chapter 10: Wagging the Dog: Interest Rate Futures
16_287224-ch10.qxp 5/27/08 11:00 PM Page 179
Risk free means that if you buy the T-bills, you’re assured of getting paid by
the U.S. government. Trading T-bill futures, on the other hand, is not risk free.
Instead, T-bill futures trades essentially are governed by the same sort of risk
rules that govern Eurodollar trades. T-bill futures
Are 3-month (13-week) contracts based on $10,000 U.S. Treasury bills.
Have a face value at maturity of $1,000,000.
Move in
1
⁄
2
-point increments (
1
⁄
2
point = 0.005 = $12.50) with trading
months of March, June, September, and December.
Trading Bonds and Treasury Notes
The 10-year U.S. Treasury note has been the accepted benchmark for long-
term interest rates since the United States stopped issuing the long bond
(30-year U.S. Treasury bond) in October 2001. Thirty-year bond futures and
30-year T-bonds (issued before 2001) still are actively traded, and the U.S.
Treasury issued new 30 year T-bonds in February 2006.
Ten-year T-note yields are the key for setting long-term mortgage rates. By
watching this interest rate, you can pinpoint the best entry times for remort-
gaging, relocating, or buying rental property, and you can keep tabs on
whether your broker is quoting you a good rate.
What you’re getting into
Bond and note futures are big-time trading vehicles that move fast. Each
tick or price quote, especially when you hold more than one contract and
the market is moving fast, can be worth several hundred dollars. Some
other facts about 10- and 30-year interest-rate futures that you need to know
include that they are
Traded under the symbols TY for pit trading and ZN for electronic
trading in the 10-year contract.
Valued at $100,000 per contract, the same as for a 30-year bond contract
(which is traded under the symbol US for pit trading and ZB for elec-
tronic trading).
Longer-term debt futures that have higher margin requirements than
Eurodollars. As of February 2008, the initial margin for 10-year and
30-year note and bond contracts, respectively, were $-1620 and $2295.
Maintenance margins, respectively, were $1200 and $1700 per contract.
Part III: Financial Futures
180
16_287224-ch10.qxp 5/27/08 11:00 PM Page 180
Quoted in terms of 32nds and that one point is $1,000 and one tick must
be at least
•
1
⁄
2
of
1
⁄
32
or $15.625, for a ten-year issue
•
1
⁄
32
, or $31.25, for a 30-year issue
When a price quote is “84-16,” it means the price of the contract is 84
and
16
⁄
32
for both, and the value is $84,500.
Bonds are traded on the CBOT from 7:20 a.m. to 2:00 p.m. central time
Monday through Friday. Electronic trades can be made from 7 a.m. to 4
p.m. central time Sunday through Friday.
Trading in expiring contracts closes at noon central time (Chicago time)
on the last trading day, which is the seventh business day before the last
business day of the delivery month.
U.S. note and bond futures have no price limits.
What you get if you take delivery
If you take delivery, your contract is wired to you on the last business day of
the delivery month via the Federal Reserve book-entry wire-transfer system.
What you get delivered is a series of U.S. Treasury bonds that either cannot
be retired for at least 15 years from the first day of the delivery month or
that are not callable with a maturity of at least 15 years from the first day of
the delivery month. The invoice price, or the amount that you have to tender,
equals the futures settlement price multiplied by a conversion factor with
accrued interest added. The conversion factor used is the price of the
delivered bond ($1 par value) to yield 6 percent.
Bonds that are not callable remain in circulation until full maturity, which
means that the holder receives all the interest payments until the bond
expires, when the principal is returned. Callable bonds put the holder at risk
of receiving less interest because of an earlier retirement of the bond than
the holder had planned.
For T-notes, you’d receive a package of U.S. Treasury notes that mature from
6
1
⁄
2
to 10 years from the first day of the delivery month. The price is calcu-
lated by using a formula that you can find on the CBOE Web site. As a small
speculator, your chances of getting a delivery are nil.
Figures 10-4 and 10-5 show the ten-year U.S. T-note futures for December
2005. Figure 10-4 shows a good example of a moving-average trading system
during the same time period featured in the Eurodollar sections earlier.
181
Chapter 10: Wagging the Dog: Interest Rate Futures
16_287224-ch10.qxp 5/27/08 11:00 PM Page 181
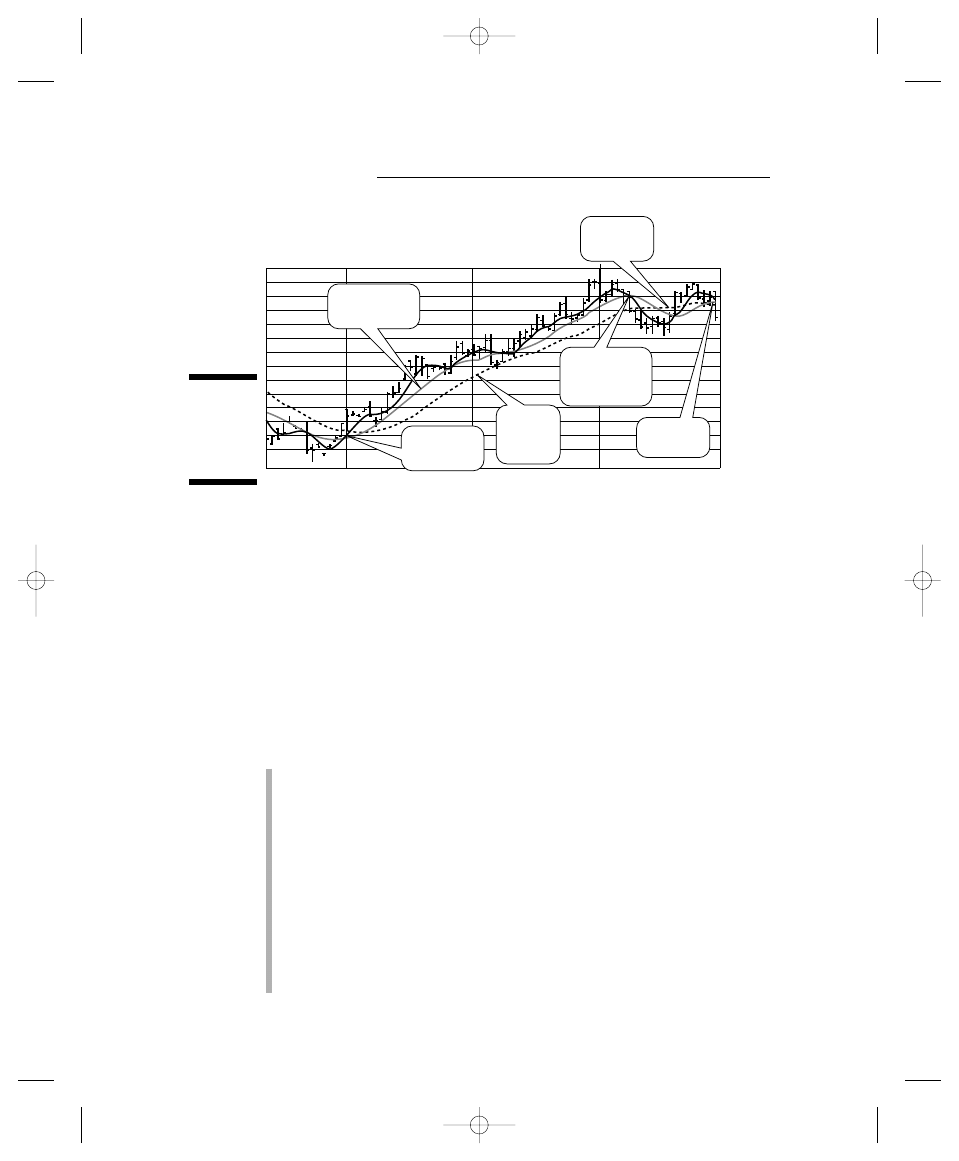
During the time frame shown in Figure 10-4, even as Eurodollars and short-
term instruments fell in price, longer-term instruments rallied because the
market continued to believe that higher short-term interest rates eventually
would slow down the economy. Elsewhere in the mix were pressures from
hedge funds, foreign governments, and big traders setting up huge derivative
trades in the options market. The overall effect, however, was to keep long-
term interest rates going down and bond prices rising on the long end of
the curve.
In June, after the ninth interest rate increase by the Fed, the market decided
that the economy was likely to keep strengthening and that the Fed would
keep raising rates. According to bond trader rules, rate increases in a strong
economy spell a strong sign of inflation and a reason to sell bonds. Other
factors that are evident in Figures 10-4 and 10-5 include the following:
T-note futures rose during the period of interest rate increases until the
month of June, when the contract began to struggle. In the cash bond
market, long-term rates had been falling until the same time period when
they became volatile.
The trend was above the trio of moving averages — the 5-day, the 20-day,
and the 10-day — much of the time.
An excellent entry point is found in April in Figure 10-4 where the 5-day
moving average crosses over the 10-day and the 20-day moving averages.
Buying a portion of your position at the first crossover is a common prac-
tice when using the moving average crossover as a trading method. You
then buy the second portion of the position at the second crossover. You
could have bought as the 5-day average crossed over the 10-day average,
and again when the 10-day average crossed over the 20-day average.
Apr
May
Jun
Daily
108'00.0
108'16.0
109'00.0
109'16.0
110'00.0
110'16.0
111'00.0
111'16.0
112'00.0
112'16.0
112'24.0
113'05.5
114'00.0
114'16.0
Buying the
crossover
20-day
moving
average
Sell a portion
and/or hedge
with puts
Selling the
break
Hedge the
long side
5-day moving
average
Figure 10-4:
A trade
featuring
the U.S. Ten
Year note.
Part III: Financial Futures
182
16_287224-ch10.qxp 5/27/08 11:00 PM Page 182
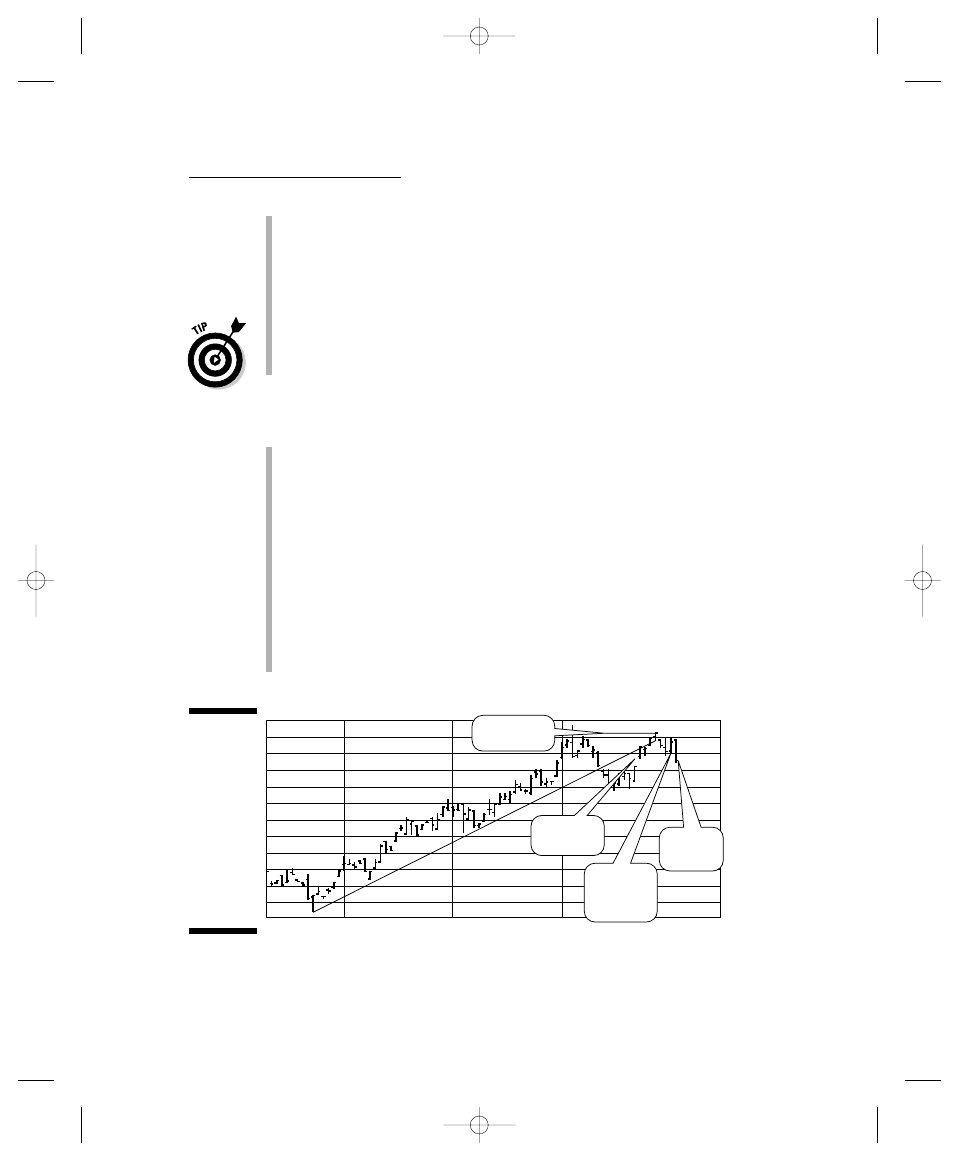
The uptrend stayed intact until June, so reversing the crossover is just
as easy as the chart points out. You can also hedge your position if
you’re unsure whether the crossover is temporary or you’re seeing a
significant top by buying a put option.
The break below all three moving averages was clear in late June, giving
you an opportunity to sell short.
You need to use trailing stops when trading all futures contracts so that
even when you aren’t sure whether a top was reached, you nevertheless
are stopped out when the price falls below the three moving averages.
Figure 10-5 highlights the use of good trend-line analysis. Take note of the
following:
A double top in bond prices and a key break below the rising trend
line. Note that when the Fed raised interest rates June 30, bond prices
failed to close above the previous day’s intraday high price, a signal that
the market was exhausted. Sure enough, it closed significantly lower
the next day.
The price on July 1. Closing within the gap is a good example of how
gaps become magnets for price reversals at some point in the future.
The 116 support level. Your next indicator to watch is when the market
tests the 116 key-support area. If you shorted the break in prices below
118, you’d be looking to cover at least some of your short position by
buying the contract back and specifying that you are doing so with
intent to cover the short position or buying some call options to hedge
your position near that area.
119'00
118'00
117'00
116'00
115'00
114'00
113'00
112'00
111'00
110'00
109'00
Apr
May
Jun
Daily
Double Top
Fed raises
interest
rates
116 is key
support
Gap being
filled
Figure 10-5:
U.S. Key
technical
aspects of
the U.S. Ten
Year note in
response
to an
interest-rate
increase by
the Federal
Reserve.
183
Chapter 10: Wagging the Dog: Interest Rate Futures
16_287224-ch10.qxp 5/27/08 11:00 PM Page 183

Part III: Financial Futures
184
16_287224-ch10.qxp 5/27/08 11:00 PM Page 184

Chapter 11
Rocking and Rolling: Speculating
with Currencies
In This Chapter
Exploring foreign exchange rates
Trading the spot market
Weighing in on the U.S. dollar index
Trading the euro, pound, yen, and Swiss franc
Maintaining your sanity in a 24-hour-a-day market
I
n a global economy, investors have come to realize that stocks and bonds
are not the only games in town. Currencies are among the fastest growing
segments of the capital markets.
Aside from the currency futures, foreign currencies trade in a busy spot
market. In fact, explaining how much of the action in currencies takes place
in the spot market takes up a good portion of this chapter.
The major goals of this chapter are to introduce you to the currency market,
provide a broad overview of the important role it plays in forging relationships
between other markets, and give you a good sound base from which to expand
your foreign exchange (or as it’s known in the business, forex) activities.
My first experience in the currency markets was with trading the U.S. dollar
index. I broke all the rules and lost some money, but I discovered some valu-
able lessons that have enabled me to make some profitable trades since then.
These days, because of time commitments and a general distaste for volatil-
ity, I still trade currencies, but I do so by using mutual funds and exchange-
traded funds (ETFs). On my Web site,
www.joe-duarte.com
, I provide
recommendations on both for my subscribers. This is a nice development in
the evolution of trading that enables me to participate in a market that I truly
love while not having to suffer the hair-raising action that can go along with
directly trading currencies and currency futures. That doesn’t mean you
17_287224-ch11.qxp 5/27/08 11:00 PM Page 185

Part III: Financial Futures
186
should fool yourself into thinking that by using ETFs and mutual funds you
can stop being careful and vigilant. These trading vehicles can be just as
treacherous as the real currencies if you’re not on the ball.
If participating in the currency markets indirectly sounds like your cup of tea,
be sure to check out the currency mutual-fund timing system that I explain on
my Web site, or check out Chapter 5, where I discuss trading futures and cur-
rencies by using ETFs. In this chapter, I deal mostly with the straight skinny
on trading currencies.
Understanding Foreign Exchange Rates
Internal and external factors influence foreign exchange rates. Internal factors
can be determined by something as simple as whether a country has specific
controls or limits on its currency. The most current example of a controlled
currency is the Chinese yuan, which the Chinese government maintains in a
narrow trading band. This has changed some since the Chinese government
began loosening the trading band on the yuan in July of 2005 by removing the
currency’s peg (link) the U.S. dollar.
Other global currencies, especially the ones coming from emerging markets
and less developed countries, also are controlled by their respective govern-
ments. External factors deal mostly with trade issues (disputes) or the
market’s perception of the political and economic situation in a given coun-
try. Of course, wars and natural disasters also qualify as potential market-
moving events.
The most important influences on currency values are
Interest rates: As a rule, higher interest rates lead to higher currency
prices.
Inflation rates: Higher inflation tends to lead to a weaker currency. This
general rule doesn’t apply when the rate of inflation is leading a coun-
try’s central bank to raise interest rates. In that case, despite higher
inflation, the markets are likely to bid up that country’s currency as they
expect interest rates there to continue to rise.
Current account status: Countries that tend to export more than they
import tend to have stronger currencies than countries that import
more than they export. This relationship is soft, however, because some
countries, such as Japan, purposely keep their respective currencies
weak by selling them in the open market just to keep their exports high.
These countries don’t export their currencies; instead, their central
banks sell them into the open market by making trades just like any
other trading desk. The net effect is to increase the amount of a country’s
currency that is floating in the markets, thus decreasing its value to
indirectly affect the balance of trade.
17_287224-ch11.qxp 5/27/08 11:00 PM Page 186

Budget status: Countries with budget surpluses, again, as a general rule,
tend to have stronger currencies than countries with budget deficits. This
rule also is soft, because it doesn’t hold up all the time. For example, the
United States has chronic budget and current-account deficits, but the U.S.
dollar experiences long rallies in which its strength is quite impressive.
Political stability: Along with interest rates and economic fundamentals,
politics are more than likely the most consistent determinants of the
exchange rates that are quoted on a regular basis. Despite a fairly strong
economy, an otherwise strong dollar during the Clinton administration
suffered during the Monica Lewinsky scandal.
Foreign policy: The U.S. dollar’s status as the world’s reserve currency
was damaged by the war in Iraq. In fact, the dollar was already weakening
before the war started as traders feared Bush administration policies,
such as lower taxes and the potential for increased government. The 9/11
attacks, with their negative effects on the U.S. economy and the spiraling
costs of the war indeed led to a series of U.S. budget deficits, and the
dollar continued to weaken into 2008.
Exploring Basic Spot-Market Trading
The spot market is where most of the currency trading is done. It’s operated
nearly exclusively by large banks and corporations. Here’s the lowdown on
the basics of the spot market:
Trades on the spot market are made continuously Monday through
Friday, starting in New Zealand and following the sun to Sydney, Tokyo,
Hong Kong, Singapore, Bahrain, Frankfurt, Geneva, Zurich, Paris,
London, New York, Chicago, and Los Angeles before starting again.
When big banks and institutions trade currencies on the spot market,
they are usually exchanging your currency with another individual party.
Both parties usually know and recognize each other.
One third of foreign exchange transactions in the world are done on an
over-the-counter basis in the spot forex market, with no exchange being
involved. Over-the-counter trades are made directly between two indi-
viduals or institutions, usually by phone.
The interbank market, where most of the transactions in the spot market
take place between banks and corporations, is a network of banks that
serve as intermediaries or market makers or wholesalers. Participants
buy and sell currencies in the interbank markets, where trades are settled
within two days. The two-day settlement is fair to both parties, allowing
plenty of time for money to change hands, considering the amount of time
it sometimes takes to gather large sums together in one place.
187
Chapter 11: Rocking and Rolling: Speculating with Currencies
17_287224-ch11.qxp 5/27/08 11:00 PM Page 187
The retail market is where the rest of the currency transactions take
place. Individual traders conduct these trades over the phone and via
the Internet by using brokers as intermediaries. Settlement on the retail
market is defined as the transaction day plus one day.
Dabbling in da forex lingo
Like anything else in life, foreign exchange (forex) has its own language, and
your currency trading skills grow faster when you get the terms right early
on; that is, before risking your money-making trades in this volatile but
mostly sensible market.
Foreign exchange transactions are exchanges between two pairings of currencies,
with each currency having its own International Standardization Organization
(ISO) code. The ISO code identifies the country and its currency, using three
letters. The pairing uses the ISO codes for each participating currency. For
example, USD/GBP pairs the U.S. dollar and the British pound. In this case,
the dollar is the base currency, and the pound is the secondary currency.
Displayed the other way, GBP/USD, the pound is the base currency, and the
dollar is secondary.
My favorite thing about currencies is the pip, the smallest move any currency
can make. It means the same thing as a tick for other futures and asset
classes. Incidentally, whether Gladys Knight trades currencies anywhere,
with or without The Pips, remains unknown.
The four major currency pairings are
EUR/USD = euro/U.S. dollar
GBP/USD = British pound sterling/U.S. dollar (also known as cable from
the days when a Trans-Atlantic cable was used to coordinate and com-
municate exchange rates between the dollar and the pound)
USD/JPY = U.S. dollar/Japanese yen
USD/CHF = U.S. dollar/Swiss franc
When you read an exchange rate that’s quoted on a screen, you’re reading how
much of one currency can be exchanged for another. If you see GBP/USD = 1.7550,
that means you can exchange one British pound for 1.7550 dollars. The base
currency is the pound; it’s the one that you’re either buying or selling.
When you trade currencies, you are, in effect, buying one currency and simul-
taneously selling another, or vice versa.
Part III: Financial Futures
188
17_287224-ch11.qxp 5/27/08 11:00 PM Page 188
When you view a trading screen, you see a frame with two prices. One side is
marked “sell” and gives you the selling price, and the other side is marked
“buy” and gives you the buying price. If you want to sell, you click on the sell
side. If you want to buy, you click on the buy side. To reverse or close out
your trade, you do the opposite of your current position.
Currency on the spot market is bought and sold in groups made up of 100,000
units of the base currency. On the spot market, buyer and seller are required
to deposit a margin, which usually is 1 to 5 percent of the entire value of the
trade. In other words, if you buy 100,000 GBP/USD at 1.7550, you put down
the appropriate margin in dollars, while the seller of sterling, who is buying
your dollars, reciprocates by putting down an appropriate margin in sterling.
Location, location, location
Some special currency trading issues are dependent upon where your dealer
is located. If you’re trading in the spot market and your dealer is in the
United States, you deposit your margin in dollars. If, however, you’re trading
through a foreign dealer or using a currency other than the one required by
the broker, you have to convert your capital and margin requirements to the
currency of the foreign dealer. Each situation is different, but you need to
check out all the variables before making any trades.
Here’s how it works: If you’re trading the USD/JPY (U.S. dollar/Japanese yen)
pair, the value of your trade will be calculated in yen, JPY. If your broker uses
the dollar as his home currency, then your profits and losses in this trade are
converted back to dollars at the relevant USD/JPY offer rate.
Although trading currencies may seem confusing, you can work it out by
carefully studying exchange rates and doing some practice trades. Most
online currency dealers will enable you to open a practice account so that
many of the nuances of trading currencies become self-evident with practice.
Don’t get cross over crossrates
Crossrates are the exchange rates between non-U.S. dollar currency pairings.
Andy Shearman of Trader House Network,
www.traderhouseglobal.net
,
offers a nice example of how crosses work, as well as other tutorials that you
may find helpful. An adaptation of his example follows to show the cross
between the pound sterling and the Swiss franc. Say your trading screen
shows the following crossrates:
EUR/USD = 1.0060/65
GBP/USD = 1.5847/52
USD/JPY = 120.25/30
USD/CHF = 1.4554/59
189
Chapter 11: Rocking and Rolling: Speculating with Currencies
17_287224-ch11.qxp 5/27/08 11:00 PM Page 189

These four pairings are key crossrates. For example, the GBP/USD pairing is
the bid (1.5847) and ask (1.5852) price for the British pound sterling and the
U.S. dollar exchange rate at the moment. The difference between them, 0.0005,
is the spread, which amounts to the commission that the dealer collects.
So to calculate the GBP/CHF (British pound for Swiss franc) crossrate, do the
following:
1. Find the GBP/USD exchange rate.
Bid: 1.5847 Offer (ask): 1.5852
2. Find the USD/CHF exchange rate.
Bid: 1.4554 Offer: 1.4559
3. Multiply the bid amount for the GBP/USD exchange rate by the bid
amount for the USD/CHF exchange rate, and then do the same with
the offer amounts.
1.5847
×
1.4554 = 2.3063 and 1.5852
×
1.4559 = 2.3079
4. Jot down the answers.
GBP/CHF = 2.3063/2.3079
The calculations work for all currencies if you follow these steps. Foreign
exchange quotation services and trading software also give you the amounts,
perhaps a little quicker.
Electronic spot trading
Aside from traditional phone-based trading, you can trade currencies in the
spot market electronically, but you need to be prepared to sit in front of your
screen and manage your trade actively. Otherwise, you risk losing large sums
rapidly.
You also need to know that you’ll pay more for trading currencies in the spot
market than the pros do. That’s because you’re a little guy, and they’re not.
That’s the way of the world, and you need to know that before you get into
trading anything.
Something else to keep in mind is that some foreign-currency Web sites and
brokers will tell you that trading on their site is commission free. That isn’t
true. They do collect a fee that amounts to the spread between the bid and
ask prices on the currency quotes. If you keep that in mind, you’ll save your-
self a lot of grief, and you can get on with trading.
Part III: Financial Futures
190
17_287224-ch11.qxp 5/27/08 11:00 PM Page 190

Getting your charts together before you trade
In order to trade forex, you need a good command of technical analysis. You
can apply the principles of technical analysis that I discuss in Chapter 7,
because the same general principles and indicators apply to foreign
exchange rates.
Some particulars about forex that you need to keep in mind are that currencies
tend to trend for a long time, usually months to even years. However, within
the major long-term trends (see Figure 11-1), counter-trend moves usually
occur, and a large degree of intraday volatility is common. Some other factors
common to long-term currency trends like the one shown in Figure 11-1 include
Long-term bull (and bear) markets can last for years. The bull market
for the euro shown in Figure 11-1 lasted at least eight years. Yet, there
are pauses and changes in the trend that often fool you into thinking
that the long term trend has ended. Figure 11-2 enlarges and displays
two periods in the multiyear bull market that are classic examples of
how long term bull markets can behave and how indicators can help you
make better trades.
Trend lines are especially useful. In Figure 11-1, you can see the very
big picture of the euro’s bull market. The three trend lines demarcate the
three stages of the bull market until 2008. The first trend line (up trend-
ing) shows the first multiyear run up in the euro, from 2001, after 9/11,
until 2005. The break below the uptrend line was a signal that the market
had entered a correction. The second trend line (down trending) covers
the period of the correction that started with the double top in 2004 and
lasted until 2006, when the downtrend line was broken and the next leg
in the bull market started.
Trend indicators work well in the currency markets. Note the interme-
diate-term tops (Figure 11-2) marked by the Relative Strength Indicator
(RSI stands for loss of momentum) and its nice correlation with the
MACD oscillator (MACD means change of trend). See Chapter 7 for more
about oscillators.
Likewise, note how the double-top failure marked on the chart corresponds
with the failure in the RSI and the break below the zero line on the MACD. A
momentum failure, coupled with major breaks in the trend indicators and a
break below a four-year rising trend line, was a clear sell signal that a change
in the up-trend was coming.
191
Chapter 11: Rocking and Rolling: Speculating with Currencies
17_287224-ch11.qxp 5/27/08 11:00 PM Page 191
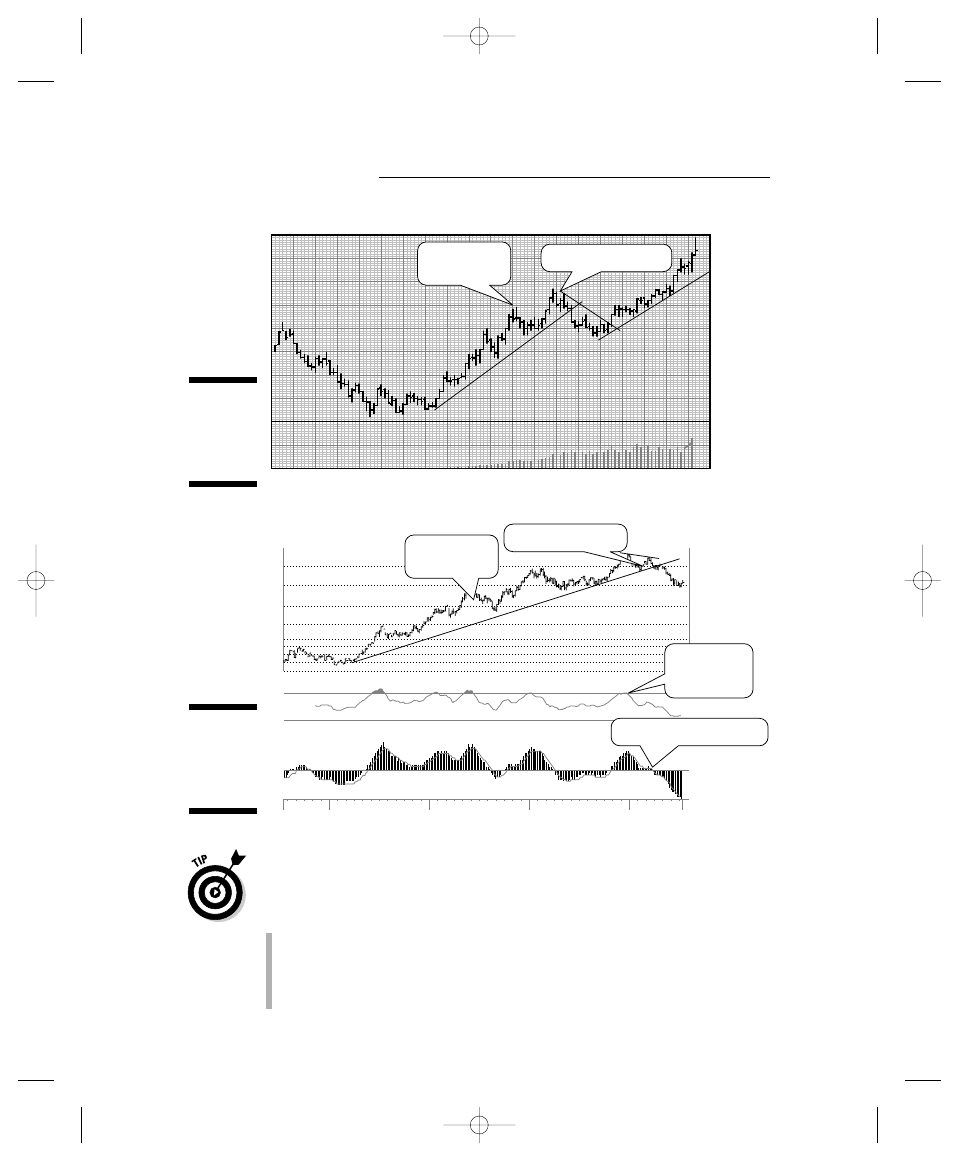
Using long-term charts to track currencies is a great way to trade forex instru-
ments. The long-term charts are your guides to the prevailing trend. However,
within a long-term trend, you can find significant counter-trend ebb and flow,
during which you can trade against the long-term trend by
Going long, or buying when the long-term chart is pointing up
Looking for opportunities to go short when the long-term trend is down
Using shorter-term charts to guide your shorter-term trades, both long
and short
84
Wilder RSI16-30
7/15/05 $120.88 EUROINDEXPHLX (ECUX4
MACD 100-50-20
87
90
93
96
102
110
120
130
84
87
90
93
96
102
110
2005
120
130
Intermediate
Term Top
Double Top Failure
RSI loss of
Momentum.
MACD – change of trend
2001
2002
2003
2004
Figure 11-2:
Intermediate-
term tops
marked by
RSI
.
98
99
00
01
02
03
04
05
06
07
08
0.80
0.90
1
1.10
1.20
1.30
1.40
1.50
1.60
EURO FX (E) NEAREST FUTURES . . monthly OHLC plot
0
Cntrcts
200000
Intermediate
Term Top
Double - Top Failure
Figure 11-1:
The multi-
year bull
market in
the Euro.
Part III: Financial Futures
192
17_287224-ch11.qxp 5/27/08 11:00 PM Page 192
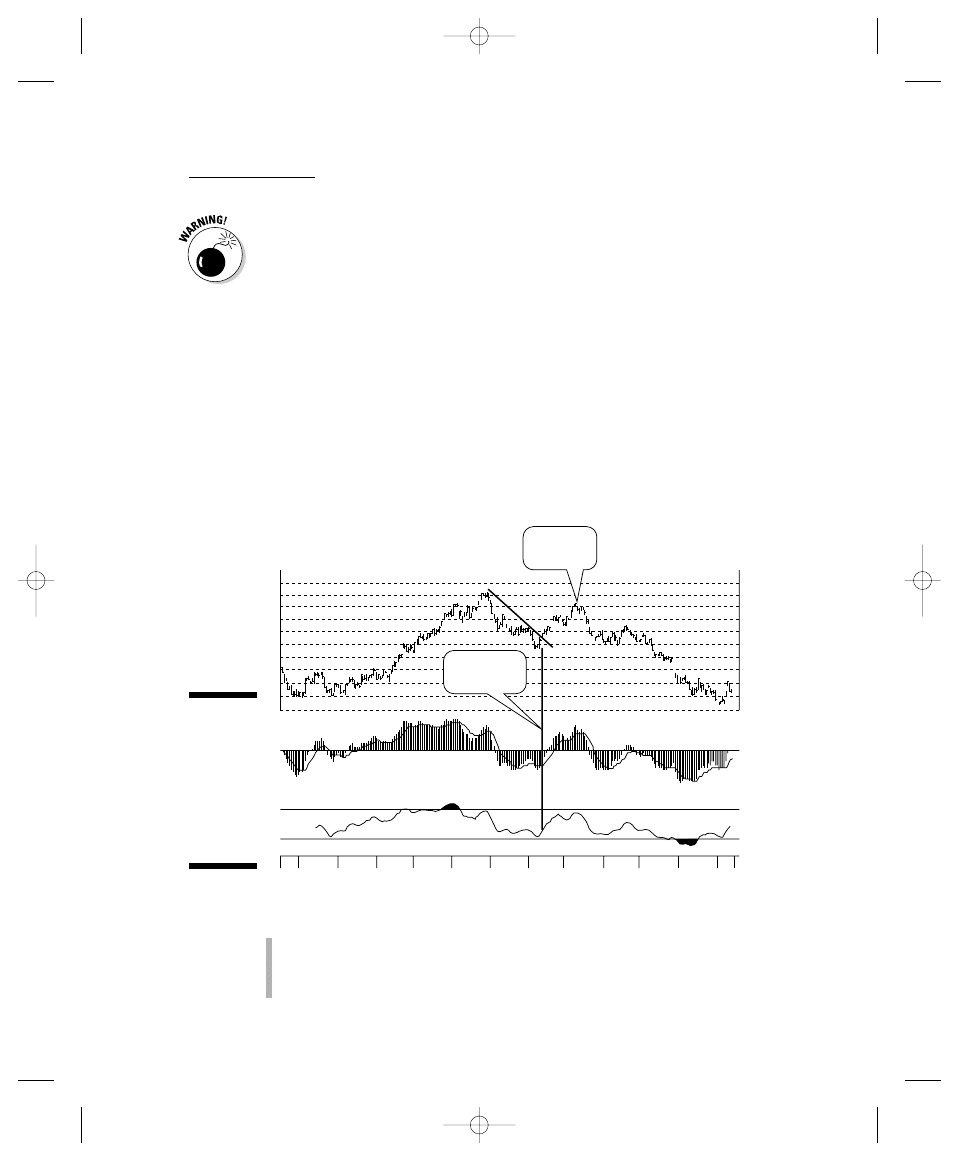
Counter-trend moves are an ever-present part of the market that require
adjustment. As such, you always need to keep the long-term trend in mind so
you don’t grow too comfortable trading in the wrong direction, or counter to
the long-term trend line.
When a currency breaks below a long-rising trend line, you must consider
that the long-term trend has changed direction. The trend may not change
every time this situation occurs. In fact, some markets return to the original
trend soon after a break. A counter-trend rally is another possible trading
scenario. In a counter-trend rally, the market remains in a long-term up- or
downtrend, but trades in the opposite direction for a short to intermediate
period of time that can last for days, weeks, or even months before returning
to the long-term trend.
You can see a counter-trend rally in Figure 11-3, which shows a one-year
chart of the euro that focuses on the period of trading labeled double top,
pictured in Figure 11-1.
The vertical line in the middle of the chart connects these three key points:
The reversal of the euro
A bottom in the RSI indicator
A bottom in the MACD indicator
Jul
Aug
Sep
Oct
Nov
Dec
Jan
Feb
Mar
Apr
May
Jun
Jul
138
130
132
134
136
122
120
118
128
124
126
138
130
132
134
136
122
120
118
128
124
126
Momentum
failure
Counter
trend rally
Figure 11-3:
This chart
shows a
perfect
example of
how a
counter-
trend rally
materializes.
193
Chapter 11: Rocking and Rolling: Speculating with Currencies
17_287224-ch11.qxp 5/27/08 11:00 PM Page 193
Long-term charts are best used for keeping an eye on the big picture. When
you see something that looks small on a long-term chart, use a short-term
chart to magnify the time frame. Figure 11-2 magnifies the double-top and
momentum failure in Figure 11-1, and Figure 11-3 highlights the counter-trend
rally that occurred as the double top was forming. When you look at the
shorter-term chart, the momentum failure looks much clearer, and your
decision making therefore is enhanced.
Take your long-term charts seriously, but remain flexible. If you’ve been trading
in a certain direction for weeks or months, you’re bound to get a fairly good
reversal. Any reversal can be big enough to change the long-term trend, so
you can play every reversal as one that may be the big one. Figures 11-1
through 11-3 show how the currency markets can have fairly long-term
moves in either direction, up or down, even though the dominant trend
remains constant.
Keep your time frames in perspective. Intraday charts are useful for short-
term trading. What looks like a major trend reversal on a three-day chart
using 15-minute candlesticks may not amount to much in the big picture. But
it’s enough of a shift for you to use your short-term strategy.
Understanding the nuances of each individual currency is also important. For
example, as well described in Currency Trading For Dummies by Mark Galant
(Wiley), the trading patterns in the British pound and the Swiss franc are dif-
ferent than those of the euro and the U.S. dollar. So as you get more advanced
in your trading, you can begin to factor in the specifics of each individual
currency and how they can affect your trading.
Setting up your trading rig
Currency trading is heavy metal. So like heavy-metal bands, you need some
serious hardware and software to keep your shirt on and your trousers dry.
Top on that list of needs is an electronic brokerage service that enables you
to do straight through processing (STP), where you trade directly with the
dealer through your computer by using integrated quotations and transac-
tional and administrative functionality. You can gain access to STP through
your online broker, and you can gain access to a decent system through
many online brokerage-services providers. You can find other online broker-
ages that offer STP by using your favorite online search engine.
You need to evaluate different brokers before deciding on one. A good elec-
tronic brokerage service gives you access to live, streaming data and enables
you to make direct trades through your broker’s Web site.
Most online brokers offer plenty of free goodies that you can look at to get a
feel for how the forex markets work. They also offer free real-time quotes and a
good basic charting service that you can use. Here are a couple of good ones:
Part III: Financial Futures
194
17_287224-ch11.qxp 5/27/08 11:00 PM Page 194

Electronic Brokering Services (EBS) at
www.icap.com
Nostradamus at
www.nostradamus.co.uk
I also maintain a good Web page with currency information on my Web site’s
directory:
www.joe-duarte.com/free/directory/software-forex.asp
.
Here are some other essentials for forex trading:
A reliable margin account broker. For details on margin and how to
choose a broker, see Chapters 3, 4, and 17.
A fast and reliable Internet connection. You need a good, reliable, broad-
band connection with your computer terminal dedicated to trading —
not instant messaging for your teenager or educational stuff for your
homeschooler.
A big-time computer system on which you can run several big programs
at the same time without crashing. You need as much memory and stor-
age as you can muster. A gigabyte of RAM (random access memory) is a
good start, but if you’re going to run multiple monitors, you may need
more, plus the setup for it. You need a good printer for printing your
statements and a good backup system. If you plan to take a break and
keep a position open, a good Wi-Fi setup for a laptop is a good idea. You
also need all the security — antivirus, firewall, and spyware protection —
that you can muster to keep your personal data from being stolen.
Good trading software on which you can open and manage positions and
conduct big-time technical analysis.
Separate computer monitors so you can
• Handle market data
• Submit dealing instructions
• Look at charts and indicators all at once to keep tabs on all your
open positions
• Adjust your stops and place other orders
• Keep an eye on how much money you have in your margin account
Two screens is a good number to get you started, but some traders may
need more, especially when they trade more than one market at a time.
Using the right orders for your forex trading goals
You can use market orders when trading forex futures and other instruments,
but because the forex markets move so fast, you need to set some automatic
exit and entry points to manage your risk as part of your armaments.
195
Chapter 11: Rocking and Rolling: Speculating with Currencies
17_287224-ch11.qxp 5/27/08 11:00 PM Page 195

A stop loss is the same kind of order in all markets: It gets you out either at
your specified price or the closest possible price depending on market condi-
tions. Same thing’s true of a limit order, which you use to set your entry point
at a predetermined price.
Some other useful orders for the forex market include
Take profit orders (TPO): A TPO enables you to get out of your position
at a price that you target before you enter the trade. This kind of order
specifies that a position needs to be closed out when the current
exchange rate crosses a given or set threshold. You can set up a TPO
above a long position and below a short position.
One cancels the other (OCO) orders: An OCO is an order that has two
parts; actually, it’s made up of two separate orders bundled into one
package. An OCO is made up of a stop-loss order and a limit order at
opposite ends of a spread. When one order is triggered, no matter which
direction the market is trending, the other is terminated. In effect, you
enter an entry point and protect your position by limiting your losses
immediately. Here’s how the OCO works:
• Going long: If you’re going long in the market, you set the stop loss
below the market spread and the limit-sell order above the market
spread. If the base currency rate breaches the limit-order thresh-
old, then your position automatically is sold at or near the price at
which you set the limit, and you no longer need the stop loss,
which then is canceled. Alternatively, if the rate falls to the stop-
loss trigger price, the position is closed out at or near the trigger
price and you no longer have any need for the limit order.
Going short: If you’re shorting the market, you set the stop loss
above the market spread and the limit order below — just the
opposite of the long position. If the exchange rate rises to the stop-
loss trigger price, the position is closed out, thus canceling the limit
order. If the exchange rate falls to the limit-order trigger price, the
limit order is activated, you buy back the position at the predeter-
mined limit-order price, and the stop-loss order is canceled.
Sampling the goods
Here’s a simple example of a trade in the spot market:
Say you buy a 100,000 lot of GBP/USD at the offer price of $1.7550.
The trade is valued at a total of $175,500.
You need to put your broker’s margin of 2 percent, or $3,510, in your
margin account. You get that amount by multiplying 0.02
×
$175,500.
You profit when your trade goes well and the GPB/USD exchange rate
rises to $1.760.
Your profit is $500, or 100,000
×
(1.760 – 1.7550), or a 14 percent yield.
Part III: Financial Futures
196
17_287224-ch11.qxp 5/27/08 11:00 PM Page 196
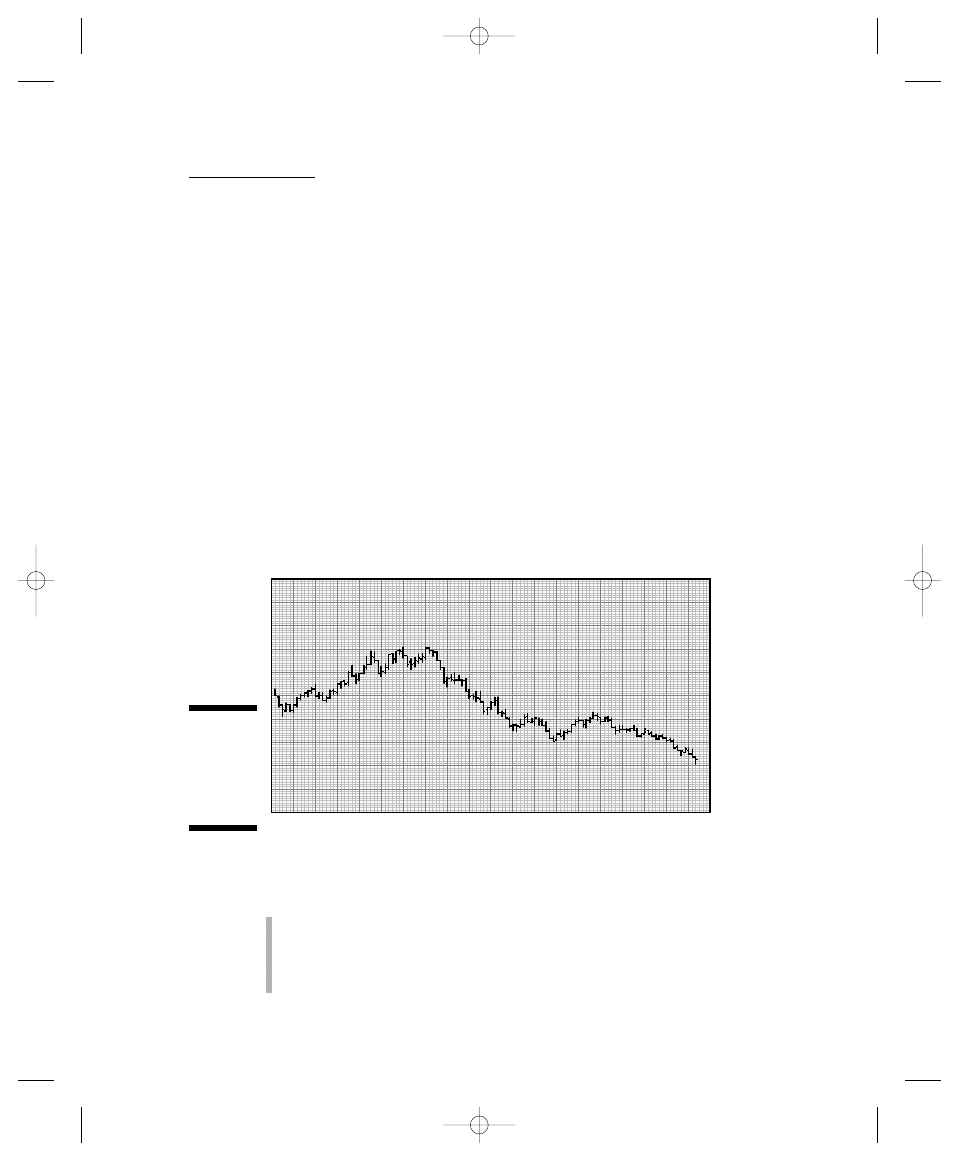
The U.S. Dollar Index
The Federal Reserve Board introduced the U.S. dollar index in March 2003.
The index was the result of the Smithsonian Agreement, which repealed the
Bretton Woods Agreement. What does that mean? The Bretton Woods agree-
ment fixed global currency rates 25 years earlier. The Smithsonian agree-
ment, which was viewed as a victory for proponents of free markets, enabled
global currencies to float based on market forces.
The U.S. dollar index is used by traders to get the big picture of the overall
trend of the dollar and is widely quoted in the press and on quote services. It
is similar to the Fed’s dollar index, which is a trade-weighted index, meaning
that the Fed gives value to each individual currency in the index based on
how much it trades within the United States. However, the value of each
index is different, and they shouldn’t be confused with one another.
The U.S. dollar index has traded as high as the 160s and as low as the 70s, with
the Trader’s Index making a new low in early 2008, as shown in Figure 11-4.
The U.S. dollar index trades on the Chicago Mercantile Exchange. Here are
the particulars of the index:
A minimum tick is 0.004 and is worth $5.
Futures contracts expire in March, June, September, and December.
The overall value of a contract is 1,000 times the value of the index in
dollars.
98
99
00
01
02
03
04
05
06
07
08
70
80
50
60
90
100
110
120
130
140
150
U.S. DOLLAR INDEX CASH . . monthly OHLC plot
Figure 11-4:
The long-
term bear
market in
the U.S.
dollar index.
197
Chapter 11: Rocking and Rolling: Speculating with Currencies
17_287224-ch11.qxp 5/27/08 11:00 PM Page 197

Delivery is physical, meaning that you receive dollars based on the value
of the index on the second business day prior to the third Wednesday
during the month of the expiring contract. On the last trading day, trad-
ing ceases at 10:16 a.m.
Delivery day is the third Wednesday of the contract month.
No trading limits are placed on the U.S. dollar index. Trading hours are
from 8:05 a.m. to 3:00 p.m., with overnight trading from 7 to 10 p.m.
The U.S. dollar index was modified at the inception of the euro and is
weighted in a way that’s similar to the Fed’s trade weighted index, as follows
(expressed in percentages):
Euro’s weight: 57.6 percent
Japanese yen: 13.6 percent
British pound: 11.9 percent
Canadian dollar: 9.1 percent
Swedish krona: 4.2 percent
Swiss franc: 3.6 percent
The U.S. dollar index is best used as an indicator of trends in the currency
markets.
The U.S. dollar index isn’t as good of a trading vehicle as the individual cur-
rencies. The best way to trade the index is by using currency mutual funds
or exchange-traded funds (ETFs). To trade the dollar’s uptrend use the
Powershares U.S. Dollar Bull ETF (UUP). For downtrends use the Powershares
U.S. Dollar Bear ETF (UDN). The Profunds Rising Dollar Fund (RDPIX) and
Falling Dollar Fund (FDPIX) are two mutual funds that follow the general trend
of the dollar. As a rule, though, I prefer to trade the individual currency ETFs.
See Chapter 5 or visit
www.joe-duarte.com
for more details on how to use
ETFs to trade currencies.
I know this book isn’t about trading mutual funds or ETFs, but one of the
secrets of trading success is understanding what kind of a person you are. If
you’re overwhelmed by the big expensive trading rig you need to make any
money in forex and upset (I know I am) because you can’t take a coffee or bath-
room break for fear the market will move against you and in the blink of an eye
you’ll end up with a margin call, then you need to consider using these funds.
By using the funds, you are, in essence, taking away a good portion of the prob-
lems that you can face by directly trading currencies. The funds are priced
only once a day. If you check the dollar index a few times during the day, then
you have a pretty good idea as to how your fund is going to close that day.
Part III: Financial Futures
198
17_287224-ch11.qxp 5/27/08 11:00 PM Page 198

Trading Foreign Currency
Trading currencies can be exciting and lucrative. For me, it’s a great market
because of the way politics affect the trends. Elections, strikes, and sudden
developments, both good and bad, can lead to significant trading profits — if
you stand ready to trade.
Trading the euro against the dollar
The euro is a convenient currency because it encompasses the policies and
the economic activity and political environment of a volatile but predictable
part of the world — Europe.
France, Italy, and Germany, the largest members of the European Union (EU),
normally operate under high budget deficits and tend to keep their interest
rates more stable than the United States, where the free-market approach and
a usually vigilant Federal Reserve make more frequent adjustments on inter-
est rates. The general tendency of the Fed is to make the dollar trend for very
long periods of time in one general direction.
Aside from the technical analysis, here are some general tendencies of the
euro on which you need to keep tabs:
The European Central Bank is almost fanatical about inflation, given
Germany’s history of hyperinflation in the first half of the 20th century
and the repercussions of that period, namely the rise of Hitler. That
means that the European Central Bank raises interest rates more easily
than it lowers them.
The European Central Bank’s actions become important when all other
factors are equal, meaning politics are equally stable or unstable in the
United States and Europe, and the two economies are growing. For
example, if the U.S. economy is slowing down, money slowly starts to
drift away from the dollar. In the past, that meant money would move
toward the Japanese yen; however, because the market knows that
Japan’s central bank will sell yen, the default currency when the dollar
weakens is often now the euro.
The flip side is that the market often sells the euro during political
problems in the region, especially when the European economy is slowing
and the economy in the United Kingdom (UK), which often moves along
with the U.S. economy, is showing signs of strength.
As usual, you want to closely monitor major currencies and the crossrates.
It’s okay to form an opinion and have some expectations, but the final and
only truth that should make you trade is what the charts are showing you.
The direction that counts is the one in which the market is heading.
199
Chapter 11: Rocking and Rolling: Speculating with Currencies
17_287224-ch11.qxp 5/27/08 11:00 PM Page 199

The UK pound sterling
The pound is active against the dollar and the euro, offering good opportuni-
ties to trade both pairs (GBP/USD and USD/GBP; see the section “Dabbling in
da forex lingo,” earlier in this chapter). The United Kingdom is a pivotal
nation because it bridges the economical, geographical, and ideological
divide between the United States and Europe.
Economically, the United Kingdom is more free-market oriented than Europe,
and it tends to share a more common set of views with the United States. At
the same time, the United Kingdom can’t totally disassociate itself from
Europe, given its history and its geography.
The upshot is a currency that is affected by politics at home and on the two
continents to which its destiny is so closely related.
Because the United Kingdom is an oil producer, the pound can be affected
more directly by oil prices than other currencies. The relationship between
oil and the pound is fading, however, because production in the United
Kingdom’s North Sea oil fields is steadily decreasing.
The Japanese yen
The Japanese yen is a manipulated currency, which basically means it is kept
low artificially by the Japanese government.
The combination of low interest rates, the lasting economic effects from the
bursting of the Japanese real-estate bubble, and the collapse of the stock
market and the banking system in Japan have forced its government to keep the
yen’s value low by selling it in the open market when it reaches a certain level.
The main purpose of maintaining a weak currency is to keep the Japanese
export machinery operational. Over the long term, however, a weaker cur-
rency will continue to hurt Japan’s chance of achieving a lasting recovery.
The most useful time to trade the yen is when political and potential military
problems are taking place in Asia. China’s rise as a global power can eventu-
ally lead to a major and uncontrolled weakening of the yen. The best way to
trade the yen is not against the dollar but rather to use crossrate analysis,
especially against the euro and the Swiss franc.
Part III: Financial Futures
200
17_287224-ch11.qxp 5/27/08 11:00 PM Page 200

The Swiss franc
The Swiss franc is considered a reserve currency, or one that is reliable and
tends to hold its value when others don’t. It also is a currency to which
traders and other investors flow during times of global crisis. Its strength is
based on three traditional expectations in the market:
Reliable economic fundamentals: Switzerland has a history of low infla-
tion and current account surpluses. It also is a country whose banking
system is well known for holding the deposits of extremely wealthy and
stable clients.
Gold reserves: The Swiss franc still is backed by gold, because
Switzerland’s gold reserves significantly exceed the amount of currency
it has placed in circulation. Switzerland has the fourth largest holding of
gold in the world. Relative to Gross Domestic Product (GDP), the level of
international reserves — with or without gold — is far ahead of all other
countries.
Little political influence: Switzerland’s political neutrality enables it to set
a monetary policy that operates (essentially) in a vacuum and thus enables
its central bank to concentrate its effort on price stability. In December
1999, the Swiss National Bank changed the way it manages monetary
policy, from one that traditionally targeted the money supply to one that
targets inflation. The bank’s goal is a 2 percent annual inflation rate.
The two major factors to keep an eye on when trading the franc are
Economic data: The franc can be affected by several key economic
reports, including
• The release of Swiss M3, the broadest measure of money supply
• The release of Swiss CPI
• Unemployment data
• Balance of payments, GDP, and industrial production
Crossrates: Changes in interest rates in the EU or the United Kingdom can
alter crossrates and have an effect on the U.S. dollar. For example, if the
euro or the pound rises and the Swiss franc weakens against them,
the franc also is likely to move with regards to the dollar, thus offering
traders like you three potential trading vehicles. The general tendency is
for a sudden move in EUR/USD — which can be triggered by a major fun-
damental factor, such as an unexpected change in government, a terror-
ist attack, or a major economic release — to cause an equally sharp
move in USD/CHF in the opposite direction.
201
Chapter 11: Rocking and Rolling: Speculating with Currencies
17_287224-ch11.qxp 5/27/08 11:00 PM Page 201
Arbitrage Opportunities and
Sanity Requirements
The 24-hour trading day in spot currency markets — and its potential for
activity whenever any major event occurs and develops — offers great
opportunities for arbitrage, or trading both on the long and short side by
using different currencies. Arbitrage is a sophisticated strategy that you can
use when you become experienced at trading.
Here are some basic arbitrage rules to keep in mind:
Currencies move in response to news events. Keeping a calendar of eco-
nomic releases for Europe, the United States, the United Kingdom, Japan,
and Switzerland is a good habit to get into. When a major economic
release is outside the realm of expectations, currencies will move, and
you can be poised in those situations to make large sums of money in
short periods of time.
Major events, such as September 11, 2001, hurricanes, and other
natural disasters also make the currencies move. I’m not trying to be
morbid, but trading on bad news is a fact of life. As a trader, you can
make bad-news decisions that are profitable if you’re watching for them.
Keep an eye on crossrates and bond markets. These areas move
together, and they often move in opposite directions. After you become
comfortable with currencies, you may want to consider setting up trades
in interest-rate futures and currencies, which can serve as either a hedge
or a profit-making opportunity.
Part III: Financial Futures
202
The panic response
The Swiss franc often is a financial instrument
of refuge for wealthy individuals, corporations,
and traders. After the events of September 11,
2001, and the July 2005 bombings in the London
Underground, the Swiss franc was the immedi-
ate beneficiary of the
flight to quality trade, as
traders acted on reflex, at least initially, and
moved money toward traditional safe havens.
The U.S. dollar used to be more of a safe haven
prior to September 11, 2001, but that distinction
has changed. The markets have adjusted their
expectations based on the fact that even though
no more major attacks have occurred in the
United States, the United States nevertheless
remains the primary target of Al-Qaeda.
Whenever a major terrorist attack occurs, the
markets always react as though the attack may
be followed by a strike on the United States.
Besides the Swiss franc, other safe havens
include U.S. Treasury Bonds, U.S. Treasury Bills,
and Eurodollars.
17_287224-ch11.qxp 5/27/08 11:00 PM Page 202
Research your opportunities in the options markets, and develop a
program that includes options. Currency and interest-rate futures offer
option opportunities. By using currency and/or interest-rate options,
you can protect your currency positions at a fraction of the cost of
owning the direct contract or lot.
Use the hypothetical trading systems. Available on the Internet, you can
use these Web tools to try different strategies or dissect new charting
setups.
ActionForex.com
has some good demos. Get comfortable with
the way the currency markets work first, however, before you risk any
large sums of money.
Beware of using mini accounts. Although mini accounts enable you to
trade forex for $300 or less, such trades are a good way to get hurt,
given the speed at which these markets can move. Instead, you need to
be well capitalized before you make your move into this trading arena.
Don’t give up your day job unless you’re a truly gifted trader. Most
people are not gifted traders, and they need to use the currency markets
only as part of an overall strategy to build wealth steadily and to protect
their overall investment program and goals.
Don’t try to trade around the clock. Much of the action in currencies takes
place overnight. Europe and Asian trading in currencies can be extremely
powerful, and any open position that was profitable when you went to bed
can be wiped out by morning. Use your stops wisely, and close out any posi-
tions that make you uncomfortable when you’re done for the day.
203
Chapter 11: Rocking and Rolling: Speculating with Currencies
17_287224-ch11.qxp 5/27/08 11:00 PM Page 203

Part III: Financial Futures
204
17_287224-ch11.qxp 5/27/08 11:00 PM Page 204

Chapter 12
Stocking Up on Indexes
In This Chapter
Finding out why you may want to trade stock-index futures
Establishing fair value for stock futures contracts
Discovering the S&P 500, the NASDAQ 100, and their mini counterparts
Making money while protecting your portfolio
Trading stock-index futures wisely and successfully
S
tock-index futures came of age October 19, 1987. That’s when a major
stock market crash was fueled by something known as portfolio insurance,
or the sale of futures contracts to protect losses in individual stock positions.
The most important and lasting influence of the 1987 crash was that the world
was awakened to a new era of investing — the era of the one market — in
which stock-index futures and the stock market became a single entity.
I remember October 19, 1987, vividly. I had no money and no investments at that
time. Boy, was I lucky. But market activity on that day and during the ensuing
months was responsible for turning me into a financial-market junky and enabling
me not only to save for my retirement but also to earn a living doing something
that is exciting and enjoyable — trading and teaching others how to trade.
My first real-life experience with money in a stock-market crash came in 1990,
when Saddam Hussein invaded Kuwait. My next experiences came in 1997
and 1998 when the Asian currency crisis hit the markets. Each step of the
way, I remember watching the relationship between the cash market and
stock-index futures. That interplay sets up the potential strategies for specu-
lation and for hedging that I describe to you in this chapter.
You don’t need to trade every major index contract in the world to be suc-
cessful; you just need to find one or two with which you’re comfortable —
the ones that enable you to implement your strategies. In this chapter, I focus
on the Standard & Poor’s 500 (S&P 500) Stock Index futures, a well-known
contract that is central to the markets. Any of the lessons that I describe with
respect to the S&P 500 can, however, be applied to just about any contract.
18_287224-ch12.qxp 5/27/08 11:00 PM Page 205
Part III: Financial Futures
206
Seeing What Stock-Index
Futures Have to Offer
Stock-index futures are futures contracts based on indexes that are composed
of stocks. For example, the S&P 500 futures contract is based on the popular
market benchmark of the same name — the S&P 500 Stock Index, a group of
500 commonly traded stocks (see the section “The S&P 500 futures [SP],” later
in this chapter).
When you trade stock-index futures, you’re betting on the direction of the con-
tract’s value, and not on the individual stocks that make up the index. In a
sense, by focusing on the value and general trend of the stocks as a group,
you’re blocking out a good deal of the noise that often is associated with the
daily gyrations in the prices of the individual stocks.
Stock-index futures are an integral part of the stock market’s daily activity.
Currently more than 70 stock-index futures contracts are traded on at least 20
exchanges around the world. As a percentage of the total number of futures
contracts traded, stock-index futures are by far the largest category of
futures contracts traded. That dominance clearly speaks of the major role
that stock-index futures play in risk management for the entire stock market.
I can think of several major reasons for trading stock-index futures. Here are
some of the more common ones:
Speculation: When you speculate, you’re making an educated guess
about the direction of a market. I hope you gather from reading this and
other chapters of this book that an educated guess is based on careful
examination of market history, trends, and key external events that can
affect the prices of financial assets. When you speculate, you can deliver
trading profits to your accounts by going long or short on index futures
or betting on prices rising or falling, respectively.
Hedging: A hedge is when you use stock-index futures and options to
protect either an individual security in your portfolio or, in some cases,
the entire portfolio from losing value. For example, if you own a large
number of blue-chip, dividend-paying stocks, and you’re getting some
nice income from them, you have to think long and hard about selling
them. Yet, in a bear market, your stock portfolio is going to decrease in
value. By using stock-index futures and options, you can sell the market
short and protect the overall value of your portfolio, while continuing to
receive your dividends.
18_287224-ch12.qxp 5/27/08 11:00 PM Page 206

Tax consequences: Gains in the futures markets are taxed at a lower rate
than stock-market capital gains. At the top rate, short-term gains
(because that’s what futures traders deal with, primarily) in stocks are
taxed at a 39.6 percent rate. Capital gains from successful futures trading
are blended by the IRS as follows:
• The IRS has a complex set of rules for taxing gains in the futures
markets with specific forms with which you must become familiar,
such as IRS Form 4797 Part II for securities or Form 6781 for com-
modities. I could devote at least a third of a chapter to tax rules,
but space restrictions won’t allow it, so that means that you need
to check with your accountant before you start trading.
• The flip side is that you can deduct your losses and get preferential
treatment on your gains if you form the right kind of corporation
and set up retirement plans and other kinds of shelters. These fac-
tors may vary depending on the state in which you reside, and
they may change over time as new tax laws are written. Again, be
sure to check with your accountant.
• The IRS also taxes stock-index futures at a different rate than com-
modities, such as soybeans. Short-term gains in the former are
taxed up to 35 percent, while short-term gains in the latter average
out to 23 percent.
For example, for every $10,000 you make in short-term gains as a
result of trading individual stocks, you may have to pay as much as
$3,960 in taxes, based on laws in effect in 2007, but when you trade
stock-index futures, every $10,000 short-term gain can be taxed for
only $2,784. The $2,784 is based on the blending formula used by
the IRS. Again, check with your accountant for the numbers that
apply to you and your tax bracket. Keeping abreast of tax changes
is important. When a new president and Congress take office in
2009, tax changes are almost certain to come, and investors who
got a nice ride from the Bush administration may again become
targets for the government’s never-ending appetite for money.
Lower commission rates: Many futures brokerages offer lower commission
rates. This practice is not as widespread as it was before online discount
brokers for stocks became a mainstay of the business. But you still can
find low commission rates in the futures markets, a factor that becomes
more important as you trade large blocks or quantities of stocks.
Time factors: If something happens overnight when the stock market is
closed, and you want to hedge your risk, you can trade futures on
Globex while Wall Street sleeps. Globex is a 24-hour electronic trading
system for a wide variety of futures contracts (see Chapter 3).
207
Chapter 12: Stocking Up on Indexes
18_287224-ch12.qxp 5/27/08 11:00 PM Page 207
Contracting with the Future:
Looking into Fair Value
Fair value is the theoretically correct value for a futures contract at a particu-
lar point in time. You calculate fair value by using a formula that includes the
current index level, index dividends, number of days to contract expiration,
and interest rates. Without getting caught up in the details, the important
thing for you to remember about fair value is that it’s a benchmark that can
be a helpful tool for your analysis of the markets.
For example, when a stock-index futures contract trades below its fair value, it’s
trading at a discount. When it trades above fair value, it’s trading at a premium.
Knowing the fair value is most helpful in gauging where the market is headed.
Because stock-index futures prices are related to spot-index prices, changes
in fair value can trigger price changes.
If the spread between the index and cash widens or shrinks far enough, you’ll
see a rise in activity from computer-trading programs. Here’s how it works:
If the futures contract is too far below fair value, the index (cash) is sold
and the futures contract is bought.
If the futures contract is too high versus above its fair value, the futures
contract is sold and the index (cash) is bought.
If enough sell programs hit the market hard enough over an extended
period of time, you can see a crash, a situation where market prices fall
dramatically.
If enough buy programs kick in, the market tends to rally.
Fair value is the number that the television stock analysts refer to when
discussing the action in futures before the market opens.
Major Stock-Index Futures Contracts
You can trade many different stock-index contracts, but they all share the
same basic characteristics. I describe many of these general issues in the sec-
tion that follows, and I address any particular differences with descriptions of
other individual contracts throughout the rest of this section.
Part III: Financial Futures
208
18_287224-ch12.qxp 5/27/08 11:00 PM Page 208

The S&P 500 futures (SP)
The biggest stock-index futures contract is the S&P 500, which trades on the
Chicago Mercantile Exchange (CME). This index is made up of the 500 largest
stocks in the United States. It’s a weighted index, which means that component
companies that have bigger market capitalizations, or market values, can have
a much larger impact on the movements of the index than components with
smaller market capitalizations. For example, a stock like IBM has a larger market
capitalization than the stock of a smaller company in the index, such as retailer
Costco.
Some of the particulars about the S&P 500 Index include the following:
Composition: The S&P 500 is made up of 400 industrial companies, 40
financial companies, 40 utilities, and 20 transportation companies, offering
a fairly diversified view of the U.S. economy.
Valuation: The S&P 500 Index is valued in ticks worth 0.1 index points
or $25.
Contracts: S&P 500 Index futures contracts are worth 250 times the
value of the index. That means that when the index value is at 1,250, a
contract is worth 250
×
$1,250, or $312,500. A move of a full point is
worth $250.
Trading times: Regular trading hours for S&P 500 Index futures are from
8:30 a.m. to 3:15 p.m., but S&P 500 Index futures contracts are another
example of how 24-hour-a-day trading enables traders to respond to eco-
nomic news and releases in the pre-market and aftermarket sessions.
The evening session starts 15 minutes after the close (at 3:30 p.m.) and
continues in the overnight until 8:15 a.m. on Globex.
Contract limits: Individual contract holders are limited to no more than
20,000 net long or short contracts at any one time.
Price limits: Price limits should not be confused with circuit breakers
(see next list item). Price limits halt trading above or below the price
specified by the limit. A price limit is how far the S&P 500 Index can rise
or fall in a single trading session. The limits are set on a quarterly basis.
If the index experiences major declines or increases beyond these limits,
a procedure is in place to halt trading. You can find the price limits
detailed on the CME’s Web site (
www.cme.com
).
Circuit breakers: Circuit breakers halt trading briefly in a coordinated
manner between exchanges. The limits that trigger circuit breakers are
calculated and agreed upon on a quarterly basis by the different
exchanges.
The collar rule addresses price swings related to program trades that
move the Dow Industrial Average more than 2 percent by requiring index
arbitrage orders, or orders that bet on the spread between the futures
and cash of stock indexes, to be stabilizing. That means that traders
209
Chapter 12: Stocking Up on Indexes
18_287224-ch12.qxp 5/27/08 11:00 PM Page 209
using these methods can’t pile on orders on the sell or the buy side in an
attempt to exaggerate the gains or losses for the market. In effect, what
this rule does is decrease the chance for huge gains or losses as a result
of futures trading. Details can be found at the Web site for the Securities
and Exchange Commission (SEC —
www.sec.gov
). For this overview
chapter, it’s good to know that the collar rule exists and that it can have
an effect on trading.
Final settlement: For all stock-index futures, settlement on the CME is
based on a Special Opening Quotations (SOQ) price, which is calculated
based on the opening prices for each of the stocks in an index on the
day that the contract expires. Don’t confuse the SOQ with the opening
index value, which is calculated right after the opening. Note: Some
stocks may take a while to establish opening prices.
Margin requirements: Margin values for S&P 500 Index contracts are
variable. In March 2008 the initial margin for the S&P 500 contract - was
$22,500, and the maintenance margin at $18,000.
Cash settlement: Stock-index futures are settled with cash, a practice
known as, you guessed it, cash settlement. That means if you hold your
contract until expiration, you have to either pay or receive the amount
of money the contract is worth as determined by the SOQ price (see the
previous “Final settlement” list item). Cash settlement applies to all
stock-index futures.
Overnight and pre-market trading can be thin and dangerous, especially
during slow seasons in the stock market, such as summer, fall, and around
the winter holidays.
The NASDAQ-100 Futures Index (ND)
The NASDAQ-100 Futures Index contract is similar to the S&P 500 Index
futures contract. Here’s what you need to know about it:
Composition: The NASDAQ-100 Stock Index is made up of the 100 largest
stocks traded on the NASDAQ system, including large technology and
biotech stocks.
Valuation: The ND is valued in minimum ticks of 0.25 that are worth $25.
Contract limits: No more than 10,000 net long or short contracts can be
held by any individual at any one time.
Margin requirements: Margins required for NASDAQ-100 Index futures are
similar to the S&P 500 Index futures. In March 2008, the initial margin for
the ND contract was $16,250, and the maintenance margin was $13,000.
Part III: Financial Futures
210
18_287224-ch12.qxp 5/27/08 11:00 PM Page 210
Minimizing your contract
The e-mini S&P 500 (ES) contract and the e-mini NASDAQ 100 (NQ) are among
the most popular stock-index futures contracts, because they enable you to
trade the market’s trend with only a fifth of the requirement. The e-mini S&P is
a favorite of day traders because of its high intraday volatility and major price
swings on a daily basis. The mini contracts are marketed to small investors,
and they offer some advantages. However, they also carry significant risks,
because they’re volatile and still have fairly high margin requirements.
The mini contract can be very volatile and can move even more aggressively
during extremely volatile market environments. Here are some particulars
about the e-mini contracts:
Composition: The ES and NQ e-mini contracts are based on the same
makeup as the respective S&P 500 and NASDAQ 100 index contracts.
Valuation: One tick on ES is 0.25 of an index point and is worth $12.50.
One tick on NQ is 0.50 of an index point and is worth $10.
Contracts: The value of an ES contract is $50 multiplied by the value of
the S&P 500 Index. The value of an NQ contract is $20 multiplied by the
value of the NASDAQ-100 Index.
Trading times: The e-mini contracts trade nearly 24 hours per day, with
a 30-minute maintenance break in trading from 4:30 to 5:00 p.m. daily.
Monthly identifiers: Monthly identifiers for both mini contracts are H
for March, M for June, U for September, and Z for December.
Margin requirements: Margins for the ES and NQ contracts are less than
for the normal-sized contracts. As of November 2007, the ES requires
$4,500 for initial margin and $3,600 for maintenance, and the NQ requires
$3,250 and $2,600, respectively.
The day-trading margin is less than the margin to hold an overnight position
in S&P 500 e-mini futures. Traders, though, are obligated to pay for the differ-
ence between the margins for entry and exit points, which means that if you
lose, you’re likely to pay up in a big way at the end of the day.
When you own normal-sized contracts and e-mini contracts in one or the
other of the underlying indexes, position limits apply to both positions,
meaning that each of the contracts is counted as an individual part of the
overall position, and the combined number of contracts can’t exceed the
20,000 contract limit for the S&P 500-based index and the 10,000 contract
limit for the NASDAQ-100-based index.
211
Chapter 12: Stocking Up on Indexes
18_287224-ch12.qxp 5/27/08 11:00 PM Page 211

Formulating Trading Strategies
Now that you know the basics of some of the futures contracts that you can
trade, the next step is to put this information to use in formulating strategies.
As with any other futures trading, you may want to try some of these in paper
trading or by using an online trading simulator. It’s always better to get the
feel of trading a contract before jumping in with real money.
You can apply every technique described in this book to trading stock-index
futures. Moving averages, RSI, MACD, the Swing Rule, pattern recognition,
support/resistance levels, and many others (see Chapter 8) — with or with-
out fundamental analysis — all work, and if you apply them properly, you’re
likely be fairly successful.
Using futures rather than stocks
At the beginning of this chapter, I note that stock-index futures can be used
for hedging or for speculating. Here is a good example of how you can use
them as a substitute for individual stocks.
Assume that you have a $500,000 portfolio of Treasury bonds (T-bonds) that
are paying you a fairly decent return of 5 percent to 6 percent. You aren’t
planning to sell any of them because you want to hold on to those decent
yields as long as possible. Based on your knowledge of technical analysis,
market sentiment, and your analysis of the economy (see Chapters 6, 7, and
9), suppose that you’re looking at a scenario which in the past has led to a
stock market rally, and you’d like to take advantage of that opportunity.
One way to do so is to sell $40,000 of your portfolio and split it in half. For
simplicity’s sake, assume that the margin, or the amount that you will have to
fork over for one S&P 500 futures contract, is $20,000. With that you buy one
S&P 500 futures contract, where the margin is roughly $20,000 (Amount 1),
while you keep the remaining $20,000 (Amount 2) in your margin account to
give you some flexibility, such as leveraging your position with options,
considering other strategies, and for protecting you if you’re wrong and get a
margin call.
Amount 1 ($20,000) should provide enough in your margin account for you to
buy one S&P contract, and at the July 15, 2005, closing price of 1230.80, it
would give you control of roughly $307,700.
With Amount 2 (the other $20,000), you can invest in and collect interest on
Treasury bills and look for other opportunities, perhaps in the options mar-
kets, as you look to either hedge your S&P 500 contract or to leverage it fur-
ther, depending on market conditions.
Part III: Financial Futures
212
18_287224-ch12.qxp 5/27/08 11:00 PM Page 212

This strategy isn’t without risk, but again, it isn’t irresponsible either, and it’s
sensible if your goal is to take advantage of what you think is a coming rally
in the stock market. By using stock indexes with a portion of your bond port-
folio, you are
Simplifying your exposure to stocks: You don’t have to go out and buy
10 or 15 individual stocks to diversify your stock portfolio by using the
stock indexes.
Still leaving most of your money in income-yielding T-bonds: In other
words, you’re still guaranteed a reliable rate of return.
Taking prudent risks: If you act responsibly, monitor your position, and
follow sound trading rules (see Chapter 17), including prudent profit
taking, position hedging, and cutting any sudden and unexpected losses,
your risks remain tolerable, even if the market goes against you.
Benefiting financially: The flip side of risk is that if you’re correct, you
may make a large sum of money in a relatively short period of time.
Protecting your stock portfolio
Another good hedge involves a well-diversified stock portfolio of dividend-
paying stocks and stock-index futures. Using the $500,000 example again,
assume your portfolio is made up of stocks rather than bonds.
You can see in Figure 12-1 that the S&P 500 Cash Index makes a new high in
March, but the relative strength indicator (RSI) fails to match it. That clear
divergence is enough cause for concern for you to start monitoring all your
high-yield, dividend-paying stocks. Even though you find that they’re actually
holding on pretty well, you’re still not sure what will happen if the market
starts selling off. You have no guarantee that even low-volatility stocks won’t
be sold in a significant price correction.
You have several possible decisions to make. You can
Take profits on your stock portfolio.
Sell call options or buy put options on each of your individual stocks. Call
options essentially are bets that the underlying stock is going higher.
Put options are bets that the underlying stock is going to fall. If you sell a
call option, you collect a premium that cushions any losses. If you buy
a put option, the appreciation of the value of the put (if your stock falls)
cushions any losses. See Chapter 4 for more about the basics of options.
Look to the futures market for a good way to hedge your stocks.
Option strategies on individual stocks may be a good way to go unless you
have 10 or 20 positions to hedge, which can take most of your time to moni-
tor and manage.
213
Chapter 12: Stocking Up on Indexes
18_287224-ch12.qxp 5/27/08 11:00 PM Page 213
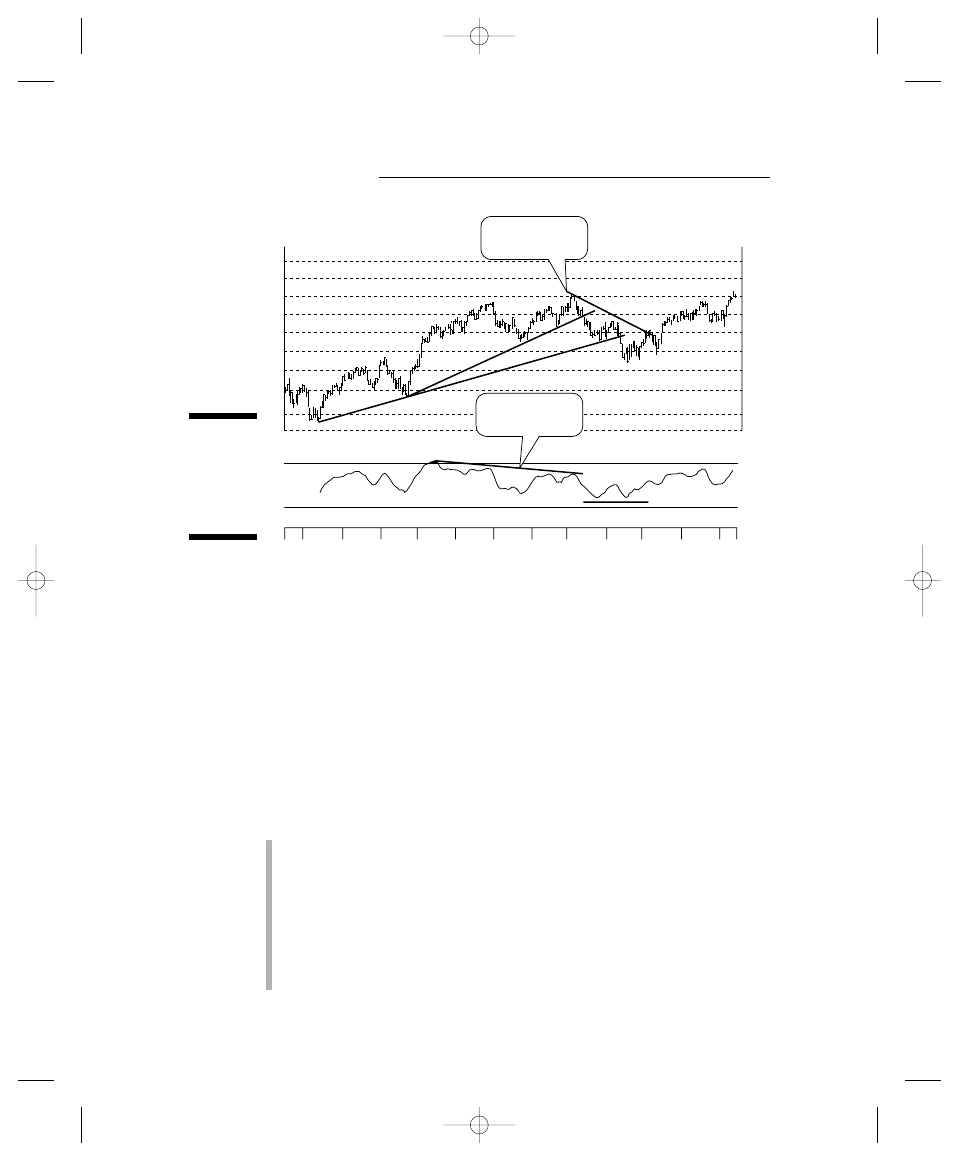
The idea is to understand that the futures and spot markets are linked, which
is what became widely known through the unfortunate circumstances sur-
rounding the market crash in 1987. Since then, this relationship has become
widely accepted.
In the example that follows, I look at two charts of the S&P 500. Figure 12-1 is
a chart of the S&P 500 Cash Index. Figure 12-2 is a chart of the S&P 500 Index
futures. Both are from the same date, July 15, 2005. The object is to find out
how futures and cash indexes work in tandem and how you can use this rela-
tionship to protect your stock portfolio. For better reference, you need to
realize that the futures chart offers a zoomed-in view of the time period.
Using the RSI and cash market in Figure 12-1 as your guide, here is the
anatomy of a hedge trade for your stock portfolio, using the S&P 500 Stock
Index futures:
The indicators: The RSI’s lack of confirmation in the cash market was a
caution signal and should have alerted you to a potential change in trend.
The trend-line analysis: The trend line on the cash index confirmed a
major market break. The break below Trend Line 1 by the S&P 500 Cash
Index in Figure 12-1 confirmed your expectations and was your signal to
do one of the following:
• Short one S&P futures contract
• Buy an S&P futures put option
Jul
Dec
Jan
Feb
Mar
Apr
1
2
May
Jun
1275
1250
1225
1200
1175
1150
1125
1100
1070
1050
1275
1250
1225
1200
1175
1150
1125
1100
1070
1050
Jul
Nov
Oct
Sep
Aug
New high not
confirmed by RSI
RSI momentum
failure
Figure 12-1:
The 12-
month S&P
500 Cash
Index and
RSI.
Part III: Financial Futures
214
18_287224-ch12.qxp 5/27/08 11:00 PM Page 214
Notice how RSI kept falling despite the attempted rally in the S&P 500. The
descending trend line above the S&P 500 exhibited resistance in the market,
and the failure at the trend line led to another leg down for the S&P 500.
Likewise, note how the RSI bottomed along with the market and how the S&P
in the cash and futures contracts broke back above the uptrend line. If you
played this trade correctly, you made some money and protected your
portfolio (or both).
And notice how the action in the S&P futures was closely mirroring the action
in the cash index. If you covered your futures short position in April, you
didn’t have to do much more to manage your stock portfolio because the
market rallied for another two months after that.
The tendency of most traders would be to stay too long in the trading position
that I just described — as the market was making a bottom in April. That’s what
the markets do to fool you. Futures traders don’t have the same amount of
time to make decisions as someone who’s trading only stocks. If you played
this trade correctly, you made money. If you weren’t sure about what to do,
you could have covered the risk to your short position in the futures contract
by setting up an options straddle so you could sell the put as the market
reversed and ride out the call as the market rallied.
A straddle is when you buy both a put and a call, and it’s best used when
you’re not sure which way the market will break. A successfully executed
straddle means that you must sell one side of the straddle (the put or the
call). Yet it’s not always obvious which side should be sold, as sometimes it’s
best to take profits on the winning side while you wait for the market to turn
around before you sell the losing side. Check out Chapter 4.
Swinging with the rule
A little-used strategy that you sometimes can use to help you know when to
take profits is called the swing rule. In the example used in the previous sec-
tion, the swing rule works well, but you need to take a close look at some six-
month indicators. Looking at Figure 12-2, which shows the S&P 500 Index
futures, note the “Swing line” label, right at the 1,200 level. A swing line is a
line that you can draw across the dome formed by the price changes in the
futures contract from February to March. As you can tell, the price made a
full swing (up and over) during that time frame, ending up right about where
it started before it rallied for a few weeks.
215
Chapter 12: Stocking Up on Indexes
18_287224-ch12.qxp 5/27/08 11:00 PM Page 215
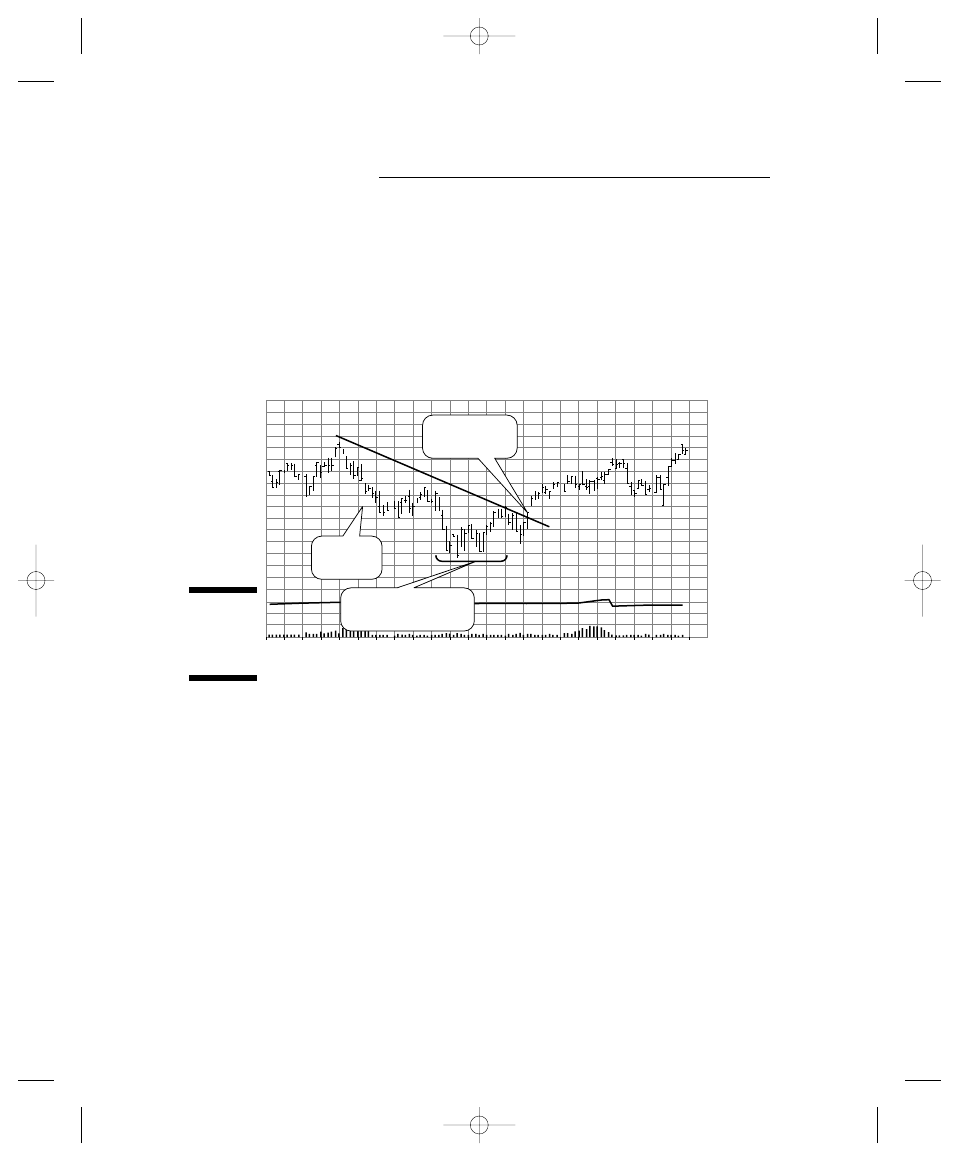
To calculate the swing rule, you take the top price of that dome, which is
roughly 1,240, and subtract the bottom, or the level across which you drew the
swing line (roughly 1,200) to get a 40-point swing. Swing lines serve as guides to
how much you can allow the market to fall before you consider taking at least
partial profits. Don’t get too bogged down on the exact numbers. This is not an
exact rule, but it does help you to get fairly close to good target approximations.
In this case, the swing rule works perfectly because the market bottoms near
1,160, just about 40 points below the swing line at 1,200.
Speculating with stock-index futures
Aside from hedging, you can simply speculate with futures contracts just by
using technical and fundamental analyses (see Chapters 6 and 7).
Stock-index futures are almost guaranteed to move in response to economic
indicators. You can set up positions with both futures and options as you
wait for the news to hit. In the last several years, the monthly employment
report, which is issued the first Friday of every month, has been an excellent
mover for stock-index futures.
Using Your Head to Be Successful
If you’re disciplined, you stand a much better chance of being more successful —
or even extremely successful. The following sections offer some suggestions for
keeping your head together.
14
FEB-05
As of 07/15/05
MAR
APR
MAY
JUN
JUL
28
14
28
11
25
9
23
6
20
4
18
1280
1260
1200
1220
1120
1140
0
1240
1160
1180
Cntrcts
500000
Trend reversal
Swing line
Use this period to take
profits on short sale.
Figure 12-2:
The S&P 500
September
futures.
Part III: Financial Futures
216
18_287224-ch12.qxp 5/27/08 11:00 PM Page 216

Get real
You can’t win every time, and you can’t have the same success as a pit trader.
Pit traders and retail investors use different time frames and strategies, so it’s
unrealistic to expect the same kinds of results.
Most pros will tell you that a large portion of their trades break even, lose a
little, or gain a little, and that they hit home runs only about 30 percent of the
time. So if you don’t develop a trading plan and prepare yourself for the real-
ity of the game, you’re not going to enjoy it.
Limit your risk
Professional traders rely on a few standards, and although the figures change
slightly, the principles of those standards remain firm:
Risk no more than 5 percent of your equity on any one trade.
Limit your losses to no more than 5 percent per trade. This is a dynamic
process. Adjust your 5 percent loss limit to your current equity level.
That means that as your equity rises, the amount risked also gets larger,
and as your equity falls, so does the amount risked. That’s how you stay
in the business, by letting your winners run and keeping a short leash on
your losers.
Become a contract specialist
The more you know about a particular type of contract, the better off you
are. Here are some actions you can take to become a specialist:
Figure out how many days a particular contract tends to spend rising
or falling along a Bollinger band. Bollinger bands are flexible bands of
price support and resistance levels described fully in Chapter 7. You can
use them to get an idea about when a contract is likely to turn around.
This tool is particularly useful when you’re swing trading near a top or
bottom. Although the Bollinger band trends won’t be exact, as long as
you know that the index usually turns five to ten days after moving along
the band, you can start to follow the index more closely and watch for
trading opportunities.
Try different sets and combinations of moving averages. Watching
various moving averages, one with the other, you can find out which
contracts trade better, for example, with a five-day exponential average,
and which ones work best with a nonexponential moving average.
217
Chapter 12: Stocking Up on Indexes
18_287224-ch12.qxp 5/27/08 11:00 PM Page 217

Try different oscillators and combinations of them. By trying them out,
you can find out which ones work best with each index that you trade.
The RSI oscillator works better with some futures contracts, while the
MACD and other oscillators work better with others.
Check out the charts from the past. Don’t be afraid to go back months
or even years to look at charts of what some indexes have done in the
past. Patterns shown in the charts tend to repeat time and again, which
is why pattern recognition becomes so useful.
Try different option parameters with your index trading. Find the
ones that tend to work best for you and your time frame. Experiment
with different strike prices, and consider paper trading with straddles
and with individual options. See Chapter 4 for more of the basics of
options. Also see Options For Dummies (Wiley).
Don’t trade when your mind is elsewhere
If you’re not up to trading on any given day, that’s fine. But if you turn on your
screen when your mind is in the clouds and you start making trades, you’re
going to get hurt. Trust me when I tell you that even if you have only a $5,000
account and you’re trading only one contract at a time, a $500 loss amounts to
about 10 percent of your entire account. In the futures market, that kind of pit-
fall can take all of about five minutes’ worth of action.
Never be afraid of selling too soon
If you set your targets and they get hit almost immediately after a news
release, follow your rules. Your objective got hit; take the money and run. By
the same token, don’t get greedy. If you’re looking at a nice profit, take it
before it turns into a loss.
Never let yourself get a margin call
I’ll probably get hit by my editor for saying this too many times, but you can’t
say it, read it, or hear it enough: Never let yourself get a margin call. Set loss
limits, no matter what. In the rare case that you do get a margin call even
though you’ve set up good stops, the markets must have done something
remarkable. Meet your margin call. Figure out why you got it. And keep an
eye on the market, because other opportunities may soon arise.
Part III: Financial Futures
218
18_287224-ch12.qxp 5/27/08 11:00 PM Page 218
Part IV
Commodity Futures
19_287224-pp04.qxp 5/27/08 11:01 PM Page 219

In this part . . .
I
discuss the increasingly important commodity markets
in this part. As China and India grow their economies,
these areas of the futures markets should continue to be
increasingly prominent. Supply rules the roost in all mar-
kets, but in these it is even more important. You jump right
in with the kings of the hill — oil and energy futures. Then
you get into some metal without the leather as you look at
gold, copper, and other precious and industrial metals.
Finally, I take you down on the farm to fill you in on live-
stock and agricultural futures.
19_287224-pp04.qxp 5/27/08 11:01 PM Page 220
Chapter 13
Getting Slick and Slimy:
Understanding Energy Futures
In This Chapter
Understanding the connection between energy (oil) and bond markets
Exploring the effects of peak oil and long-term bull markets in energy markets
Balancing energy supplies with demand
Timing the cyclical nature of the energy markets
Coming to grips with markets for crude oil, gasoline, heating oil, and natural gas
Measuring the effects of sentiment on the energy markets
I
never realized that I was going to become an expert in energy until I wrote a
book entitled Successful Energy Sector Investing (Prima-Random House, 2002).
I also never thought that crude oil would touch $100 per barrel in my lifetime
either. But on January 2, 2008, it did — briefly — and by February 7, 2008, the
price had moved to $105. Anything is possible. No one can ever predict what
any market will eventually do with any certainty. But you can do a lot to prepare
yourself as a trader, especially in the energy sector.
I can’t tell you everything I know about oil in one chapter. Here I provide you
with a good summary of the way professionals think about and execute their
trades in the energy markets, and the way I make recommendations on
energy stocks and exchange-traded mutual funds (ETFs, see Chapter 5), as
well as covering and analyzing important stories regarding the oil markets on
my Web site (
www.joe-duarte.com
).
One thing is almost certain, however: The energy markets will be a major focal
point of the financial markets and the global economy for many more years.
And the key to understanding energy trading is to understand oil, natural gas,
gasoline, and heating oil futures.
20_287224-ch13.qxp 5/27/08 11:01 PM Page 221
Part IV: Commodity Futures
222
The emphasis in this chapter is on the entire energy complex from a speculator’s
standpoint, concentrating on the practical. The goal is to understand how you
can use a combination of three factors — supply and demand, geopolitics, and
technical analysis — to reach sensible decisions about making good energy
market trades.
In this chapter, when I refer to interest rates I’m referring to both the U.S.
Federal Reserve adjusted rates and the bond-market rates unless I specify
otherwise.
Some Easy Background Info
Trading in energy futures began in 1979, and it’s centralized at the New York
Mercantile Exchange (NYMEX), the world’s largest physical commodity
futures exchange. The 132-year-old NYMEX trades futures and options con-
tracts for crude oil, natural gas, heating oil, gasoline, coal, electricity, and
propane. The NYMEX also is home to trading in metals (see Chapter 14).
Trading is conducted on the NYMEX in two divisions:
The NYMEX division, which trades energy, platinum, and palladium
The COMEX division, which trades the rest of the metals
For smaller traders, NYMEX offers e-mini contracts for oil and natural gas that
also trade on the Globex network of the Chicago Mercantile Exchange (CME).
The NYMEX Web site,
www.nymex.com
, offers a good deal of information and
is worth a visit. The calendars and margin requirements, which are listed
individually for each contract, are especially useful to traders.
Next to interest rates, energy — especially oil — is the center of the universe
not only for industry but also for the financial markets.
Completing the Circle of Life:
Oil and the Bond Market
Much of what happens in the world — from your mortgage rate to how easily
you find a job — depends on what I like to call the Circle of Life formed by
energy prices and interest rates. For the sake of simplicity, I use the term oil
interchangeably with the term energy in the rest of this chapter unless I note
otherwise.
20_287224-ch13.qxp 5/27/08 11:01 PM Page 222

This relationship is important because it ties together the two most important
aspects of the global economy: energy (the fuel for growth) and interest rates
(the catalyst that powers borrowed money to do things). Sometimes the price
of oil leads to a rise in interest rates, both in the bond market and through the
actions of central banks, and at other times the opposite happens. In this
chapter, the term interest rates means both types unless I specify one or the
other. The relationship depends on where the economic cycle of supply and
demand and the political current happen to be at the time. After September
11, 2001, traditional relationships changed somewhat but not completely.
Here are two examples. In mid-2005, one of the major reasons for the Fed to
continue to raise interest rates, according to speeches made by Fed governors
and Fed Chief Alan Greenspan, was that the rise in oil prices was creating infla-
tion. At the same time, the bond market was struggling with the possibility
that high-energy prices were increasing the chances of a recession.
As a result, the Fed kept raising interest rates, and the bond market was
stuck in a trading range with rates slowly creeping higher.
If you fast forward to 2008, the economy of the United States was slowing, as
a result of the credit crisis created by the subprime mortgage crisis. Yet oil
prices kept moving higher. In this instance, the markets were struggling with
the potential for supply shortages of crude oil, along with geopolitical issues,
as the Middle East conflict was heating up, and demand for oil from China
remained stable.
The Federal Reserve kept lowering interest rates in this latter instance,
because they were more concerned about the slowing in the economy than
the potential inflationary pressures of higher oil prices.
Here’s the basic concept. If oil prices rise high enough, one of two scenarios hap-
pens: The Fed starts worrying about either inflation or an economic slowdown
because oil prices are so high that people can’t buy enough of other items.
If inflation is the dominant theory at the Fed, the central bank will raise inter-
est rates. If a slowing economy is more likely, the Fed will start lowering inter-
est rates. The bond market eventually will catch up with whatever the Fed
does, and sometimes leads the action of the Fed.
Watching the bond market
You’re probably wondering how you can determine — or at least make an
educated guess about — how the Fed will act. You can often find your best
clue by monitoring the bond market. If bond-market interest rates begin to
rise along with oil prices, it’s a sign that the bond market is growing concerned
about high oil prices triggering inflation. If bond-market rates rise high enough,
the Fed is likely to increase bank interest rates. If rates start falling in the bond
223
Chapter 13: Getting Slick and Slimy: Understanding Energy Futures
20_287224-ch13.qxp 5/27/08 11:01 PM Page 223
market, then bond traders are expecting a slowing of the economy, and the
Fed is likely to reduce interest rates. As I note in the preceding section, though,
the Fed sometimes makes the first move by raising interest rates, and the bond
market follows.
This explanation isn’t infallible, but it holds true a fair amount of the time. In
2004 and 2005, then-Federal Reserve Chairman Alan Greenspan called persist-
ently low bond-market interest rates combined with the Fed’s continuously
high interest rates a “conundrum.”
Nevertheless, when oil prices rise along with bond yields and/or interest rates
from the Fed, you must look for an inflection point, such as where bond yields
and overall interest rates have gone high enough to lead to a break in the price
of oil, because traders have started factoring in the fact that oil prices have
risen to a point where they’re becoming a hindrance to economic growth.
The bond market’s responses to the actions of the Federal Reserve aren’t
guaranteed. The bond market acts on its own initiative, meaning that if the
Fed lowers interest rates, such as the Fed Funds and/or the Discount rate, the
bond market will sell off if it senses inflation, and market interest rates will
rise. Such a scenario developed in early 2008 when the Fed had to lower inter-
est rates, but persistently high oil prices and overall demand for commodities
continued to fuel inflationary fears.
Looking for classic signs as oil prices rise
The overall markets are likely to project certain signs as oil prices rise and
traders start gauging the effect of the increases on the economy, including
Decreasing traffic in stores and malls (and on the highways, for that
matter): By August 2005, as oil prices were reaching all-time record highs,
retailers began blaming a slowing of sales on high gasoline prices. Also
look for how many people are actually buying products, as opposed to
window shopping or just hanging around the mall.
Decreasing consumer confidence: By August 2005, consumer confi-
dence was skidding. Plenty of reasons could be cited for falling con-
sumer confidence and rising gasoline prices. Hurricane Katrina did
significant amounts of damage to the Gulf of Mexico’s coastline in the
United States and rendered the city of New Orleans nearly useless. The
port of New Orleans, a major import hub for oil and export hub for agri-
cultural products, closed for days. And the oil and gas production and
refining infrastructure of the area, which accounts for 20 percent of the
gasoline and natural gas used in the United States, shut down and took
several months to get back on line.
Part IV: Commodity Futures
224
20_287224-ch13.qxp 5/27/08 11:01 PM Page 224
Crazy headlines: Look for increasing emphasis on oil prices on the
evening news and in the media that don’t normally cater to business
news. A perfect example was the call from Congress for a windfall profit
tax on oil companies and repeated calls for hearings on price gouging by
gas stations and fuel retailers.
These scenarios can take a long time to develop. You have to be very patient
and let the charts guide your trading. In this case of the U.S. economic slow-
down, nothing really hit the skids until the subprime mortgage crisis became
evident in 2007; by late in the year more and more people were losing their
jobs. More interesting is that even when all these negative things in the econ-
omy became obvious, at least as of March 2008, oil prices were still acting
fairly well, with West Texas Light Sweet Crude oil trading at $105 per barrel.
Here’s a key to the relationship between oil prices and the economy in general:
At some point, interest rates will rise enough to cool off the demand for oil.
When the economy reaches that point, oil prices will start to fall and, at some
point after that, traders and bond yields will begin to factor in a slower econ-
omy. The other side of the coin is that the Organization of Petroleum Exporting
Countries (OPEC), if nimble enough, may be able to slow the rate of descent of
prices by attempting to reduce production. This factor can be difficult to inter-
pret because OPEC is infamous for routinely cheating on production quotas.
The Fed’s main goals are to keep prices steady and keep everyone employed,
but achieving them is nearly impossible. That means the Fed will make mistakes
and create inefficiencies in the market that are key to traders making a profit. As
a trader, one thing you definitely know is that the Fed will act. As a result, oil
always is on the move, and that creates opportunities for you to trade. You have
to throw ideology out the door. Regardless of the party you vote for or what you
believe, in the oil market it’s what you see that can make you money.
Check out Figure 13-1 (later in this chapter), which shows the relationship
between interest rates in the bond market and oil prices. In a classic sense,
this is the way things are supposed to work:
Oil prices and interest rates generally move in the same direction when
viewed over long periods of time. Keep in mind that this relationship
involves a wide band of movement and that I’m discussing only the very big
picture, in the classic sense. The important point to remember is that rising
oil prices can lead to inflation, and inflation eventually will lead to higher
interest rates, both in the bond market and from the central banks. See
Chapters 2, 6, and 10 for more about bonds, inflation, and the economy.
225
Chapter 13: Getting Slick and Slimy: Understanding Energy Futures
20_287224-ch13.qxp 5/27/08 11:01 PM Page 225

At some point, if classic (historical) relationships hold up in the future,
oil prices and interest rates will rise enough so that the economy also
begins to slow. A slowing economy then tends to dampen demand for oil
and prices retreat.
The preceding describes a classic relationship that was well established
before the emergence of China, India, and other emerging markets as major
consumers of oil. As China’s economy continued to grow in the post 9/11
world, the relationship between supply and demand in the world markets
was distorted. Prior to China’s accelerated expansion, the United States
and Europe were the major oil consumption regions of the world, with little
competition. Thus, when those economies slowed down, oil prices would
eventually fall. The future is less certain, as it’s unclear whether the
demand from China and the emerging markets will be enough to make the
classic relationship between oil and interest rates a moot point. My guess
is that the relationship will not become useless, but that it could take a lot
longer before the endpoint, where high interest rates lead to falling oil
prices, is reached.
Note that oil prices made a new high in March 2005, but interest rates in
the bond market didn’t. At that point in time, you needed to be thinking
that a top in oil prices was possible because interest rates in the bond
market didn’t make a new high along with oil prices. Even though you
may not have been right, you nevertheless needed to think about it.
Examining the Peak Oil Concept
Peak oil is the concept that the world’s oil production has peaked or will
peak, and that after it does production levels will never again be as high.
The peak oil idea is controversial, but it’s increasingly plausible given the
state of the global oil industry. The most important factors affecting this
theory are as follows:
Countries such as Venezuela, Iran, and Nigeria, all of which are OPEC
members, aren’t necessarily friendly to the United States and other indus-
trialized nations. Turbulent political situations can reduce oil production in
these and other countries, as can any potential production problems
having to do with how much oil is available for extraction at any one point.
Poor maintenance of key facilities and equipment and questionable reserve
data, in essence lies about how much oil is really in the ground, are report-
edly rampant throughout OPEC nations; Indonesia’s production has already
been in decline for years. Indonesia is a net importer of oil, despite being an
oil-producing nation. Another example is Venezuela where thousands of oil
wells, with potential extractable reserves in the ground, are in such states
of disrepair that they are no longer usable.
Part IV: Commodity Futures
226
20_287224-ch13.qxp 5/27/08 11:01 PM Page 226
Traditional non-OPEC sources of oil, such as the North Sea and Mexico,
are also showing signs of declining production. The eventual loss of pro-
duction from key fields in Mexico will likely affect the U.S. economy at
some point. This is because many of these fields have been producing
for decades and have just run out of the easy-to-extract reserves.
What I think about peak oil doesn’t matter, because somewhere in the back of
just about every oil trader’s mind is the thought that the world may just be
running out of oil — a thought that now maintains an essentially permanent
influence on the oil markets. Needless to say, the concept of peak oil
Gathered steam after the events of September 11, 2001, and became well
established in many corridors of trading during the mega bull market in
oil that ensued and that remains in place well into early 2008.
Received support in July 2005 when Saudi Arabia told the world that in
ten years, its production wouldn’t be able to keep up with global demand
if demand continued to grow at rates that were prevalent at the time.
By 2008, some startling statistics were circulating. According to several key
opinions, world oil production may, in essence, have either peaked already or
will peak sometime in the next 10–20 years. If that’s true, the world as you
know it will certainly change. In fact, according to a CIBC World markets
report published in February 2008, it will take 4 million barrels per day of
new oil to keep up with the oil demand of the next few years — and that’s if
you take into account what’s already been lost in places such as Mexico,
Indonesia, Venezuela, and the United States.
So if the report, and the work of Matthew Simmons in his book Twilight In The
Desert: The Coming Saudi Oil Shock and the World Economy (Wiley, 2006), are
right, peak oil may already be under way. Simmons did a literature review of
hundreds of papers with relationship to Saudi Arabia’s oil supply and concluded
that the Saudis don’t have near as much oil in the ground as they say they do,
and that they have had shoddy maintenance of their existing fields that can still
produce. If he is correct, that would mean that peak oil may be closer than the
overall estimates, which seem to agree on 2010 or 2011 as the key dates.
The Post-9/11 Mega Bull
Market in Energy
The world changed after September 11, 2001. The invasions of Afghanistan
and Iraq were only a small part of what happened, at least in terms of the
financial markets.
227
Chapter 13: Getting Slick and Slimy: Understanding Energy Futures
20_287224-ch13.qxp 5/27/08 11:01 PM Page 227

Just prior to September 11, 2001, the United States was scrambling to recover
from the economic weakness caused by the bursting of the Internet bubble.
However, the attacks on the World Trade Center derailed the fragile economic
improvements and plunged the country into a deep psychological and logistical
nightmare in which businesses closed their doors and job losses began to mount.
Here’s what happened:
The U.S. dollar went into a multiyear bear market. Money left the
United States as the Fed lowered interest rates, making the dollar less
attractive. Politically, the world also viewed the United States as unstable,
unpredictable, and vulnerable because of the attacks. As with any bear
market, there were periods after 2001 when the dollar rallied. But the rallies
did not last. In February and March 2008, the U.S. dollar, as measured by
the U.S. Dollar Index, made new all time lows.
Oil and natural gas entered once-in-a-lifetime secular bull markets.
However, the natural gas bull lost steam much earlier than the bull in
crude oil because new production sources, such as the Barnett Shale
deposit near and under the city of Fort Worth, Texas, came online. A secular
bull market is one that lasts years to decades. Traders almost immediately
started bidding up the price of oil, initially because of the connection of
the terrorists who attacked the United States to Saudi Arabia, the world’s
largest oil producer. However, as time passed, a new dynamic developed as
money began to flow into China.
In other words, as the United States appeared to be entering a period of
uncertainty, traders began looking for places where economic growth
wasn’t as affected by what happened on September 11, 2001. These
traders found China, whose currency was pegged to the dollar.
As the dollar fell in value, the Chinese yuan remained weak, increasing
the demand for Chinese products and revving up the Chinese economy,
which relied heavily on exports to other countries, especially Europe
and the United States. As more foreign money flowed into China for
those exports, the Chinese economy became more and more able to pro-
duce goods and export them to the entire world. The upshot of all this
economic rotation was a faster rate of increase in global oil demand, just
at a time when production was starting to plateau.
Long-term interest rates entered a downward sloping and wide trading
range. The yield on the U.S. ten-year Treasury note initially rose, because
traders began to price in the likely collapse of the U.S. economy, and
because China and oil-rich countries recycled their new found riches into
U.S. Treasury bonds. Although by 2003 the U.S. economy wasn’t as strong
as it would have been had September 11, 2001, not occurred, it clearly
wasn’t going to collapse.
As the economy stabilized, interest rates began to rise. Note, though,
that the dollar didn’t bottom out until 2005, a full two years after bond
yields started to rise, and so did oil demand.
Part IV: Commodity Futures
228
20_287224-ch13.qxp 5/27/08 11:01 PM Page 228

The key is not to be in a big hurry to see these events unfold, and not to be
too rigid in our expectations or interpretations. That’s because these relation-
ships can take significant amounts of time to reach points at which they become
evident. Sometimes it takes a large number of interest-rate increases and a long
period of rising bond yields to turn a major currency like the dollar around. Don’t
forget that the politics and general stability of a country play big roles in how
strong its currency will be. In the post-September 11, 2001, period, the markets
weren’t immediately convinced that the United States would be able to survive
the attack and remain a major world power.
As of 2008, those who bet against the United States in the immediate post-9/11
period as a military power were proved to be wrong. Despite large amounts of
political controversy and conflict, the United States remained a major world
power. The irony is that even though the 9/11 attacks did not destroy the
United States and its economy, an internal attack on the U.S. economy in the
form of fraud, greed, and bad policy did deliver a significant blow, as the sub-
prime mortgage crisis unfolded. In essence, the ensuing credit crunch was a
bloodless coup as U.S. unemployment began to rise, record numbers of home
foreclosures developed, and the U.S. dollar continued to fall.
Understanding Supply and Demand
Wanna know a secret? Although most people think that demand is what
makes prices change, supply rules in the energy markets. As the U.S. econ-
omy slowed during the months that followed the World Trade Center attack,
the Chinese economy picked up steam, and its demand for oil increased.
The increased Chinese demand, however, wasn’t enough to boost oil prices
immediately. That boost didn’t become noticeable for several months.
Instead, the markets correctly began to price in the possibility of attacks on
the oil-producing infrastructure and the increasing challenges of getting oil
out of the Middle East. More important, the market again correctly factored
the loss of Iraq’s oil supply into the markets as the United States attacked Iraq.
Now in 2008, the market faces a different set of dynamics. Iraqi oil is starting
to flow back into the market, but it may not be enough to compensate for the
loss of production in Mexico, Venezuela, the North Sea, and other areas that
will likely crop up in the next few years.
229
Chapter 13: Getting Slick and Slimy: Understanding Energy Futures
20_287224-ch13.qxp 5/27/08 11:01 PM Page 229
Keep these important tidbits about the oil markets in mind:
The world runs on oil, and any threat to the oil supply leads to rising
prices.
As an oil trader, your primary goal is to consider the effects of events on
supply and to correlate those effects with your charts.
Demand fluctuates, but supply is finite. Weeks are necessary to ramp up
supply or to turn it back down. Refineries are a bottleneck in the system.
So even if plenty of oil is sitting in storage, if the refineries can’t turn it
into gasoline or heating oil, the supply of those products is impaired.
Playing the Sensible Market
The energy markets make sense, regardless of whether you believe in the
concept of peak oil.
Real companies have huge trading desks with hundreds of traders all betting
on the price of oil. Banks and brokers join oil, trucking, and airline companies
in using the oil markets on a daily basis to hedge their future price risks and
for pure speculation. Even Goldman Sachs and Merrill Lynch got into the oil
storage and distribution business in the early part of the 21st century in the
wake of September 11, 2001.
In other words, the oil market is about real people trying to figure out how
much oil they’re going to need to run their businesses in the next few months
to years, regardless of whether they’re suppliers or users.
Part IV: Commodity Futures
230
Charting refinery capacity in the United States
The United States hasn’t built a new refinery
since the 1970s. The combination of environ-
mental concerns, red tape and paperwork,
costs in the billions of dollars, and the multiyear
time frame needed to finish a new refinery are
prohibitive and have prevented any new oil-
refining capacity from coming online. In
essence, the United States is now in a position
in which domestic refinery capacity can’t meet
any increase in demand for oil or oil products.
That means that now more than ever, the United
States depends on foreign resources for its oil
and refined products.
Damage to refining and shipping capabilities
caused by Hurricanes Katrina and Rita brought
the U.S. refinery issue to the forefront as gaso-
line prices skyrocketed. The markets and con-
sumers also reacted as prices reached a level
that was high enough to decrease consumption
and lead to lower prices.
The net effect of the post-September 11, 2001,
bull market in oil, though, was to reset fuel prices
at a higher level than prior to that date. I don’t
think gasoline prices will ever dip below $.50
again, barring some truly extraordinary event.
20_287224-ch13.qxp 5/27/08 11:01 PM Page 230
Stock prices are built mostly on analysts’ drivel, such as price/earnings ratios
and new paradigms, such as the nonsense that sank the Internet stocks. Oil,
gasoline, heating oil, and natural gas prices, on the other hand, are based
more on real-life circumstances and aren’t usually influenced by the kind of
fiction spawned by slick Wall Street analysts penning negative e-mails about
the stocks they push onto the public.
Supply rules the energy markets, and here are the basics:
OPEC supplies 30 to 40 percent of the world’s oil. Russia, the next-biggest
supplier, and other non-OPEC producers like Mexico, Norway, and the
United Kingdom make up the rest of the world’s supply. The United States
also is an oil and natural gas producer, with Alaska and the Gulf of Mexico
being the largest affected areas. The United States ranks above Mexico and
Canada in proven oil reserves. The total oil reserves in the United States
are roughly one tenth of those in Saudi Arabia. Still, as time passes and
exploration becomes more difficult for both geologic and political reasons,
the dynamics of the oil market will change, and likely for the worse, with
the potential for higher prices and supply disruptions rising.
From a practical standpoint, supply is made up of what comes out of the
ground, what can be refined, and what can be delivered, both before it gets
to the refinery and after it’s refined into gasoline, heating oil, diesel, and
other fuels.
The potential for supply disruption can occur at any of several steps
along the route from extraction through the point of sale, and each step
has its own unique chance of causing price-increasing supply screw-ups.
Worker strikes, hurricanes and all other kinds of natural disasters, acci-
dents, spills, sabotage, and even market manipulation by OPEC and
other producers all end up affecting supply, not demand.
Oil without a doubt is a political tool. The Venezuelan government of
Hugo Chavez didn’t like President George W. Bush, so it repeatedly
threatened to cut shipments of oil to the United States during the Bush
years in the White House. Sabotage of oil pipelines was a major weapon
in Iraq in the early days of the U.S. invasion. It remains to see what will
happen when a new U.S. president is elected and takes office in 2009 and
how the war in Iraq will eventually evolve.
The one constant in supply, especially in the United States, is that not enough
refinery capacity is available to keep up with any more than normal demand.
That means when winters are extremely cold, refineries are a key bottleneck
in the oil-delivery system.
231
Chapter 13: Getting Slick and Slimy: Understanding Energy Futures
20_287224-ch13.qxp 5/27/08 11:01 PM Page 231
In the new world, with China, India, and the United States gobbling up increas-
ing supplies of oil, oil markets in general have to deal with the reality that
supplies are going to be tighter than they were a few short years ago. That’s
why prices stayed high in spite of the fact that the war in Iraq settled into a
less hectic rhythm and why even if prices fall from levels above $70–$80 per
barrel, the days of $10 oil aren’t likely to return in the near future unless the
global economy collapses.
Handling Seasonal Cycles
Energy demand, especially for heating oil, gasoline, and natural gas, is
extremely seasonal in nature, and if you look at your own life, you can easily
understand how these cycles work.
In winter, you heat your house. If you live on the East Coast of the United
States, that means you use heating oil. Everywhere else you burn natural gas
and sometimes coal. Some areas rely on nuclear energy. Likewise, during
summer you drive your car or fly off somewhere to go on vacation.
Traders anticipate the ebb and flow of these cycles and factor them into their
bets. A good number of traders work for companies, energy and otherwise,
that use the futures market either to have fuel delivered to them for resale or
for their own use. Others use energy futures to hedge the cost of the energy
they need to run their businesses. Still others are speculating and trying to
make a buck.
All cycles are variable and describe the oil markets in broad strokes only, so
you should never expect the course of the oil business to be perfect each
time you trade. You will, however, be a better trader if you remain aware of
these cycles and watch for their presence. In general, crude oil futures
Experience a lull in the spring months when refineries convert production
from heating oil to gasoline. When that happens, the price of heating oil
starts to fall, and gasoline prices firm up.
Swing up and down during the summer based on gasoline supplies. As
the end of the summer nears, another pause occurs when refineries
switch over from gasoline back to heating oil production.
This broad cycle became unreliable after September 11, 2001, because prices
bucked the cyclical trends and pretty much went higher.
Bear in mind, though, that a seasonal tendency for price action does exist.
For example, you don’t generally want to look to trade long on gasoline in
winter. Instead you want to focus on heating oil during cold-weather months.
At the same time, you need to consider natural gas as a potential short sale
during the spring and early summer.
Part IV: Commodity Futures
232
20_287224-ch13.qxp 5/27/08 11:01 PM Page 232
Preparing for the Weekly Cycle
A more useful cycle hinges on what happens on Wednesday mornings — or
on Thursday mornings after three-day weekends. That’s when the American
Petroleum Institute (API) and the U.S. Energy Information Agency (EIA)
release their weekly supply data reports.
Analysts all pony up their estimates for the reports usually on Monday and
Tuesday. They’re all focusing on supply, not demand, and they want to know
whether inventories are building (increasing in supply) or drawing down
(decreasing in supply).
Making trades based on the API and EIA supply data is a good idea to consider
because you can generate some nice short-term profits if you play them right.
The markets focus mainly on the report from the EIA because it’s a govern-
ment agency that requires companies to provide their supply statistics. The
API uses data supplied on a volunteer basis. Thus the API data tends to be
less exact because of its information-gathering system.
Analysts almost never get it right. That means that the market usually jumps
up or down after the data comes out. I do just about everything I possibly
can to rearrange my schedule so I can be in front of my trading screen when
that report comes out.
A great time for a coffee break is at 10:30 a.m. eastern time on Wednesdays so
you can watch for the energy supply data. Setting up some potential trades
ahead of the release of the reports can help you get a jump on executing
them based on the new supply data. Wednesdays can be the most profitable
day of the week in the energy pits.
Checking other sources before Wednesday
On Monday and Tuesday, I start scanning news sources for analysts’ opinions
about the oil market. Doing so gives me a good idea about what may happen
if the market is priced wrong regarding current supply levels.
Some good stuff to read before the release of the reports include the com-
modities column at MarketWatch.com (
www.marketwatch.com
). It provides a
good summary of expectations. Reuters (
www.reuters.com
) and Bloomberg
(
www.bloomberg.com
) also provide good summaries of what the market is
setting itself up for when the data comes out. If your broker gives you access
to good news data, Dow Jones Newswires is about as good as any source to
get the same data. Dow Jones Newswires is a subscription service accessible
online, usually through brokers and financial-service institutions.
233
Chapter 13: Getting Slick and Slimy: Understanding Energy Futures
20_287224-ch13.qxp 5/27/08 11:01 PM Page 233
How to react to the report
Making trades based on the supply reports isn’t an exercise in being exact,
because analysts usually are clueless about what’s coming up. What you want
to look for are instances when they all agree one way or another. For example, if
they’re all leaning toward a build (increased supply) of crude, be ready for the
market to go higher if the report even hints of a supply shortage. The same is
true for when the market gets set up for a drawdown (decreased supply) — be
ready for the market to go lower if the report hints of more abundant supplies.
Here are a couple of tips for trading the supply reports:
Be careful when the report comes out. Give the market some time
before you jump in. The first few trades can be volatile. After a minute or
two, your real-time chart should start to show you the way the market is
headed.
Consider some option strategies. As with other reports, a straddle (see
Chapter 4) is a good potential strategy to consider. Other hedging
techniques, such as holding some long positions in blue-chip oil stocks
and selling the futures, or buying puts on the futures, also may work.
If the supply data surprises the markets in a big way, the move can be huge,
and prices are likely to gap up as the figure is released. In this case, you may
be looking at one of the following three scenarios:
You’re already out of the market. If you aren’t already in the market,
you miss a chance to make some money. However, don’t go chasing
prices trying to get into the market. You’ll end up being sorry.
You have an established position. You take advantage of the data being
in your favor by ratcheting up your sell stops so you can take as much
profit as possible if the market happens to turn on you. If you’re using a
broker, hopefully you gave him instructions on what to do in this situation;
otherwise, you’d better have his number on speed dial and hope you’re
one of his favorite clients.
Your position gets stopped out. If you were in the market but were
stopped out because you guessed wrong, be glad you’re out. Reassess
your position and wait for a better opportunity. When you get stopped
out, it means that the stop-loss order you placed to limit your losses was
triggered as prices dropped to the level you specified.
Part IV: Commodity Futures
234
20_287224-ch13.qxp 5/27/08 11:01 PM Page 234

Forecasting Oil Prices
by Using Oil Stocks
One of the most reliable methods of forecasting futures prices is to use the
action in oil stocks. John Murphy is one of the most prominent promoters of
this dynamic, and I’ve found his approach a very useful starting point.
Changes in oil stocks tend to precede the moves in oil prices and should also
confirm them. Sometimes oil stocks also will move along with or just after
crude oil futures.
Although oil stock prices may sound unpredictable, as a new bull market in
oil starts, oil stocks will normally start rising along with crude prices either
before or right after crude oil futures start rising.
Much of the time, although not always, oil stocks will rise or fall before the
price of crude oil rises or falls.
Similarly, as the falling trend line of a bear market in oil takes hold, oil stocks
will either break sometime before, along with, or just after crude oil futures.
Figure 13-1 provides a good example of the dynamic, using information from
Exxon Mobil, the oil (XOI) and oil service (OSX) indexes, and December 2005
crude oil futures.
Take note of how
The price of Exxon Mobil stock (bottom-left chart) bottomed out before
the XOI index (top-left chart) took off.
The XOI index began to rally at a much steeper rate of rise than the
December 2005 crude oil futures (CLZ5) contract. Some of the steeper
rise results from the fact that the volume of trading in the December
2005 contracts didn’t pick up until 2003 and then really started booming
in 2004. Nevertheless, oil stocks clearly began to rally before the futures.
Oil service stocks (OSX top right chart) kept pace with the XOI and
Exxon.
Exxon stopped rallying in February 2005, and oil futures(bottom-right
chart) and the rest of the oil stocks continued to move higher. Every
time oil futures made a new high, Exxon didn’t confirm them — a classic
technical divergence that requires confirmation. Figure 13-1 shows a
classic double-top pattern in Exxon. A double top is when the market
reaches a price that’s similar to a previous price and then rolls over. A
double top is a sign of failing price momentum. Notice how the double
top in Exxon was followed by a breakdown in the price of oil, which on
November 1 dropped below $60.
235
Chapter 13: Getting Slick and Slimy: Understanding Energy Futures
20_287224-ch13.qxp 5/27/08 11:01 PM Page 235
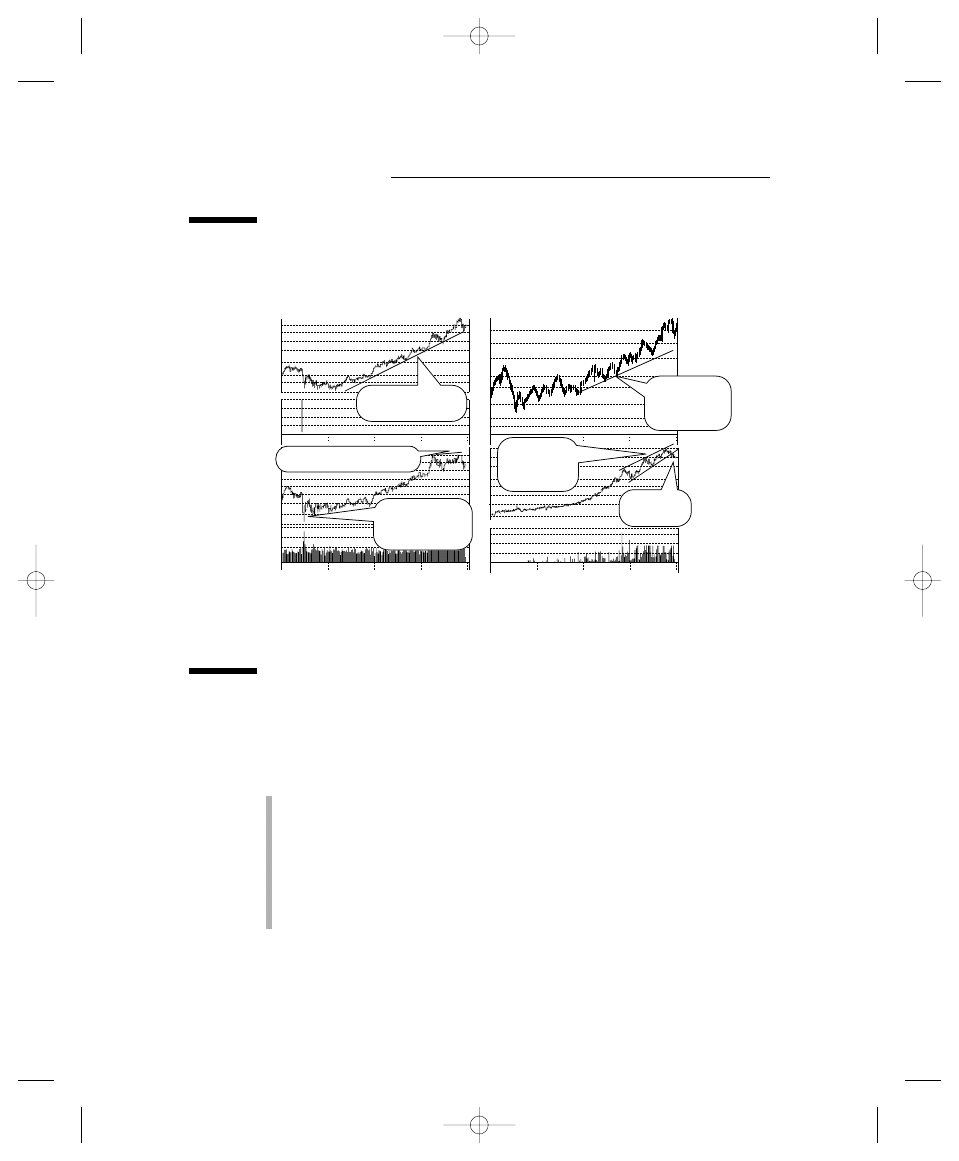
Figure 13-2 is an enlarged version of Figure 13-1, and it shows in greater detail
how the double top in Exxon coincided with the breakdown in the price of
the December crude oil contract and how the break in the stock preceded the
break in the futures. Be sure to check out these points in Figure 13-2:
Relative strength indicator (RSI) for Exxon and for CLZ5: Lower highs
are present on both charts; however, the Exxon chart also shows clear
overhead resistance on the stock’s price, a sign that sellers are waiting
to unload as soon as Exxon nears $64 per share.
How the crude futures chart continues to make new highs: The RSI
oscillator for crude futures also is cause for concern for the same reason —
because it also fails to confirm the new high in crude, a sign of a momentum
failure.
When the price of Exxon stock no longer confirms the new high in crude oil, you
need to start being careful and monitoring the momentum and trend indicators
so you can prepare to sell your crude futures position. In other words, Exxon, in
this case, flashed a correct warning sign that oil prices were likely to fall.
2002
2003
2004
2005
2002
2003
2004
2005
2002
2003
2004
2005
2002
70
60
50
40
35
30
25
20
3664
3000
2000
1000
2003
2004
2005
1000
900
800
700
600
500
450
400
100
75
50
25
160
140
120
100
90
75
65
60
60
55
48
44
40
36
32
1718
1269
1260
760
Steeper angle of
rise than futures.
Exxon’s bottom
precedes XOI
bottom.
Higher
highs in
crude oil.
Channel
break.
Oil service
keeps up with
overall trend.
Double top convergence.
Figure 13-1:
The rela-
tionship
between
Exxon
Mobil, the
XOI and
OSX
indexes, and
December
2005 crude
oil futures.
Top row:
Amex Oil
Index (XOI,
left),
Philadelphia
Oil Service
Index (OSX,
right).
Bottom row:
Exxon Mobil
stock (XOM,
left), crude
oil futures
(right).
Part IV: Commodity Futures
236
20_287224-ch13.qxp 5/27/08 11:01 PM Page 236
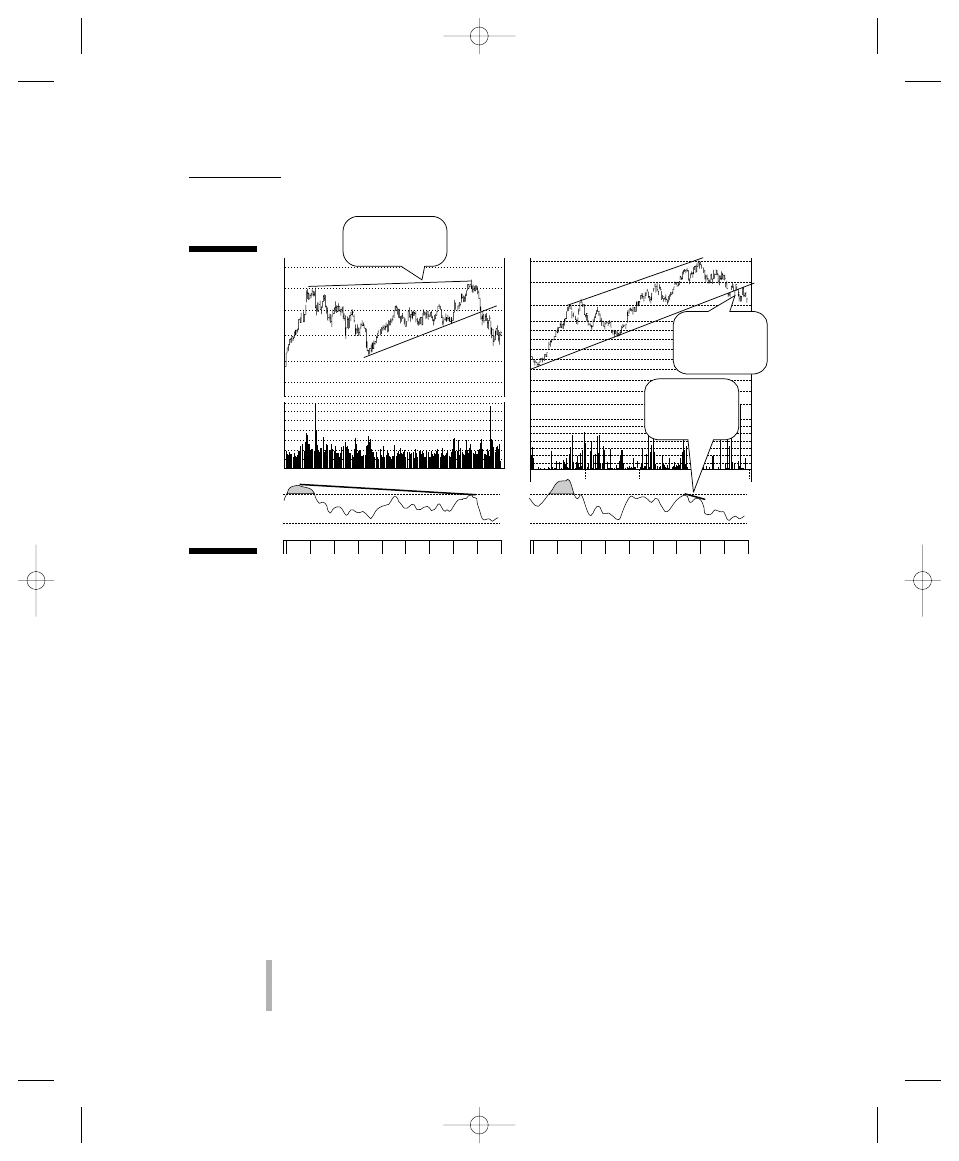
As a futures trader, the situation shown in Figure 13-2 gave you little choice
but to continue to trade crude futures on the long side. However, in this case,
because Exxon was warning you and the RSI oscillator wasn’t confirming the
rallies, you need to be very careful and use tight stop-loss points or consider
trading only with options to curb your risk.
Burning the Midnight Oil
Crude oil trades around the world, but New York’s Mercantile Exchange
(NYMEX) is considered the hub of global oil trading.
Light, sweet crude is high-grade, low-sulfur crude oil that’s more easily refined
than thicker oils. It also yields better products. When it isn’t going by that
name, it’s called West Texas Intermediate. High-sulfur crude, such as that
which comes from Venezuela and certain Saudi Arabian wells, requires spe-
cial refineries that process only the heavier crudes.
NYMEX also provides trading platforms for futures contracts based on the
following:
Dubai crude oil. This contract is a futures contract for Dubai crude oil.
The differential between the light, sweet crude oil futures contract and
Canadian Bow River crude at Hardisty, Alberta.
2002
2003
2004
2005
68
64
60
56
52
48
42
0922
6000
5000
1000
3000
2000
1000
70
64
63
54
52
50
48
46
44
42
40
2220
1750
1500
1250
1000
750
500
250
Double top
in Exxon.
Price break
follows Exxon
double top.
RSI does not
confirm new
all-time high.
Feb Mar Apr May Jun Jul Aug Sep Oct
Feb Mar Apr May Jun Jul Aug Sep Oct
Figure 13-2:
The rela-
tionship
between
Exxon Mobil
(XOM) and
December
crude oil
futures
(CLZ5) from
February to
October
2005 (Exxon
Mobil on the
left, crude
oil futures
on the right)
237
Chapter 13: Getting Slick and Slimy: Understanding Energy Futures
20_287224-ch13.qxp 5/27/08 11:01 PM Page 237

The differentials between the light, sweet crude oil futures contract and
four domestic grades of crude oil, including Light Louisiana Sweet, West
Texas Intermediate-Midland, West Texas Sour, and Mars Blend.
Brent North Sea crude oil.
Oil options.
Crude oil is the world’s most actively traded commodity, and the NYMEX
contract for light, sweet crude is the most liquid of all crude oil contracts.
The NYMEX Web site (
www.nymex.com
) is well worth a visit.
Here are the particulars of a crude oil contract:
Contract: Each crude oil contract contains 1,000 barrels of oil that will
be delivered to Cushing, Oklahoma.
The e-mini contract trades on the CME Globex electronic platform are
cleared at NYMEX and hold 500 barrels of light, sweet crude.
Valuation: A barrel of oil holds 42 gallons and trades in U.S. dollars per
barrel worldwide. The minimum tick of $0.01 (1 cent) is equal to $10 per
contract.
Trading: NYMEX offers both open-cry trading during regular hours and
electronic, Web-based trading after hours. Open outcry trading hours
are from 10 a.m. to 2:30 p.m. After-hours futures trading takes place on
the NYMEX ACCESS, an Internet-based trading platform, starting at 3:15
p.m. Monday through Thursday and ending at 9:50 a.m. the following
day. Sunday trading starts at 6 p.m.
Margins: The initial crude oil contract margin for nonmembers as of
January 2008 was $7,088 (with the maintenance margin for customers at
$5,250).
Settlement: Contract settlement is physical, and delivery takes place at
Cushing, Oklahoma, or similar pipeline or transfer facilities.
You can find contract listings and termination dates at
www.nymex.com
.
Getting the Lead Out with Gasoline
Gasoline has become a hugely important contract for several reasons. It’s the
largest-selling refined product sold in the United States and accounts for almost
half of the nation’s oil consumption. Two important factors that you need to
know about the gasoline futures contract are that
Refinery capacity is limited. As the global economy continues to grow,
the global demand for gasoline also is rising. As is true in the United
States, the number of cars in China also is growing, contributing to this
Part IV: Commodity Futures
238
20_287224-ch13.qxp 5/27/08 11:01 PM Page 238

increased global demand. For many of the same reasons, environmental
and otherwise, gasoline demand outpaced refinery capacity for a good
portion of 2005.
International competition for oil and geopolitical problems in South
America are on the rise. Although a bit more subtle, the importance of
Venezuela as a major exporter of oil and gasoline to the United States is
becoming a major global market factor. As rhetoric grew more intense
between Venezuelan president Hugo Chavez and the United States in
2005, so did the risk of Venezuela cutting off exports.
The situation between the Chavez government and the United States is rather
fluid. Much of it may be due to the personality conflict between Chavez and
President Bush, who will leave office in 2009. So things can theoretically change.
Chavez, though, has pursued the development of alternative markets for
Venezuela’s oil products, including having made deals with China and several
countries in South America. Indeed, Chavez has made production, explo-
ration, and refinery deals with Russia, Brazil, India, Iran, and Cuba. At some
point, if Chavez is successful, the United States may indeed encounter supply
problems. I’d expect that the United States can buy oil and gasoline from
alternative sources. The key is that prices are likely to be higher because of
the logistics involved.
Contract specifications
You needed a $7,425 initial margin per contract to trade a gasoline futures
contract and $5,500 to trade gasoline futures in February 2008.
A contract gives you control of 1,000 barrels or 42,000 gallons of unleaded
gasoline. A 25-cent move in the per-gallon price of gasoline is worth $10,500
per contract, and that amount is the limit move. Each tick of $0.0001 (1/100th
cent) is worth $4.20 per contract. Delivery is physical to the New York harbor.
Trading strategies
Keep the following general tendencies in mind when trading gasoline con-
tracts, but understand that they’re not guaranteed to occur or to follow any
particular script.
Gasoline prices tend to move along with prices for crude oil; however, gaso-
line prices aren’t guaranteed to mirror crude prices, because they move
according to their own supply and demand scenario.
Gasoline prices tend to be the highest during summer months when demand
is highest. Prices tend to rally for the July, August, and September gasoline
239
Chapter 13: Getting Slick and Slimy: Understanding Energy Futures
20_287224-ch13.qxp 5/27/08 11:01 PM Page 239
futures contracts during April and May. Figure 13-4 shows the start of the
rally in the September contract at the beginning of May. The figure also
exhibits choppiness in the market as expectations for less driving are incor-
porated into gasoline prices. This chart is particularly important, because it
shows the consistency of the overall seasonal pattern. In 2005, gasoline sup-
plies were below historical stockpiles because of an overall tightness in the
market and problems experienced within the refinery industry.
You also need to take note within Figure 13-4 that although Hurricane Katrina
pushed gasoline futures prices above $2, the seasonal pattern held. Aside from
the usual decrease in demand caused by seasonal factors, in this case, the
market was essentially flooded with gasoline imports from Europe, and President
Bush also suspended the need for refining a multitude of different grades of gaso-
line that are normally produced to meet clean-air standards. The combination of
these three individual variables led to the decline in gasoline prices.
Keeping the Chill Out with Heating Oil
The price of heating oil has a tendency to rise as the winter months approach.
As is true with all energy commodities, supply is the key, and chart watching
is as important as keeping up with supply when trading heating oil futures.
After gasoline, heating oil, which also is known as No. 2 fuel oil, makes up
about 25 percent of the yield from a barrel of crude oil. Here are the particulars
of trading heating oil futures:
Contract: Heating oil futures trade in the same units as gasoline: 1,000
barrels of 42 gallons each, or a total of 42,000 gallons. The contract is based
on delivery to New York harbor, the principal cash-market trading center.
Margins: Margins for heating oil are quite high, and they’re based on a
tiered structure designed to give a more precise assessment of risk. Each
tier consists of at least one futures month, and all the months within a
given tier are consecutive. In general, as of February 2008, the Group 1
margin for nonmembers was $6,750, with maintenance margins at $5,500.
If you trade nearby contracts, contracts that expire in months that are in
close proximity to the current month, your margin will be higher, because
the volatility and the chance for profit is higher, and you’re being charged
a premium for that.
Valuation: The price relationship of each tick is identical to gasoline,
with 1/100th of a cent equaling $4.20 per contract.
The airline industry, refiners, and others in the oil business use the heating
oil futures contract to hedge diesel-fuel and jet-fuel prices, which ultimately
means that you’re trading against a savvy group of adversaries when you
trade heating oil contracts.
Part IV: Commodity Futures
240
20_287224-ch13.qxp 5/27/08 11:01 PM Page 240
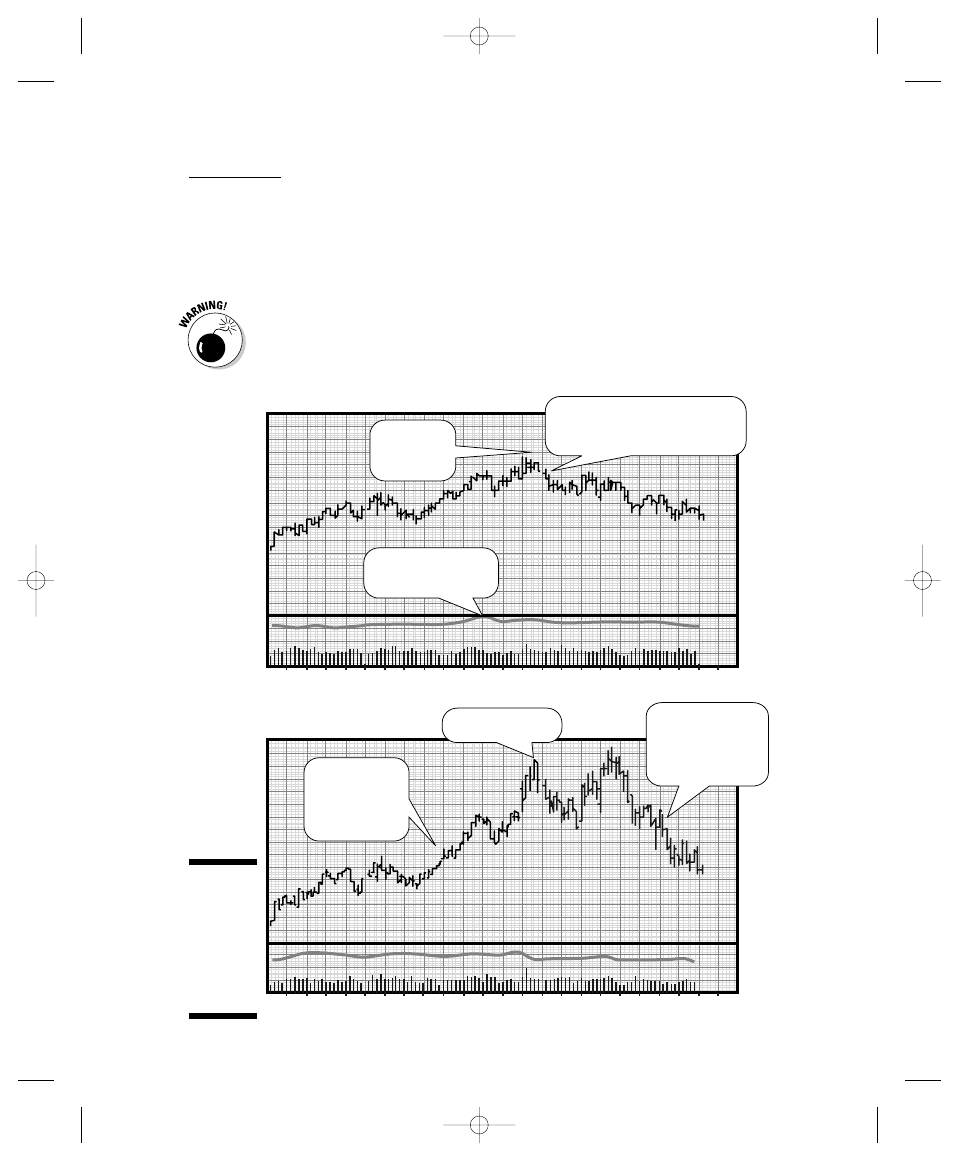
Figures 13-3 and 13-4 also show the general tendency of heating oil to rally
with oil, gasoline, and natural gas prices. During the time frame depicted in
the figures, the contract started to show some price compression in late
August and had joined gasoline in diverging from crude oil prices, which sug-
gested that a big move was coming.
Looking for confirmation from different markets is important. As Figures 13-3
and 13-4 show, the energy complex was running into trouble. Crude oil
topped out first, followed by gasoline, heating oil, and finally natural gas.
6
MAY-05
JUN
JUL
AUG
SEP
OCT
NOV
20
18
16
14
12
10
8
6
4
Cntrcts
500,000
0
20
4
18
1
15
29
12
26
10
24
7
6
MAY-05
JUN
JUL
AUG
SEP
OCT
NOV
80
75
70
65
60
55
50
45
40
Cntrcts
500,000
0
20
4
18
1
15
29
12
26
10
24
7
Crude oil
Gasoline
Katrina
effect.
President Bush opens
Strategic Petroleum Reserves.
Open interest tops
out before price.
Summer driving
expectations
rally.
Katrina effect.
Decreasing driver
demands and
high import
levels.
Figure 13 3:
Gasoline
and crude
oil futures
show the
effect of
Hurricane
Katrina.
241
Chapter 13: Getting Slick and Slimy: Understanding Energy Futures
20_287224-ch13.qxp 5/27/08 11:01 PM Page 241
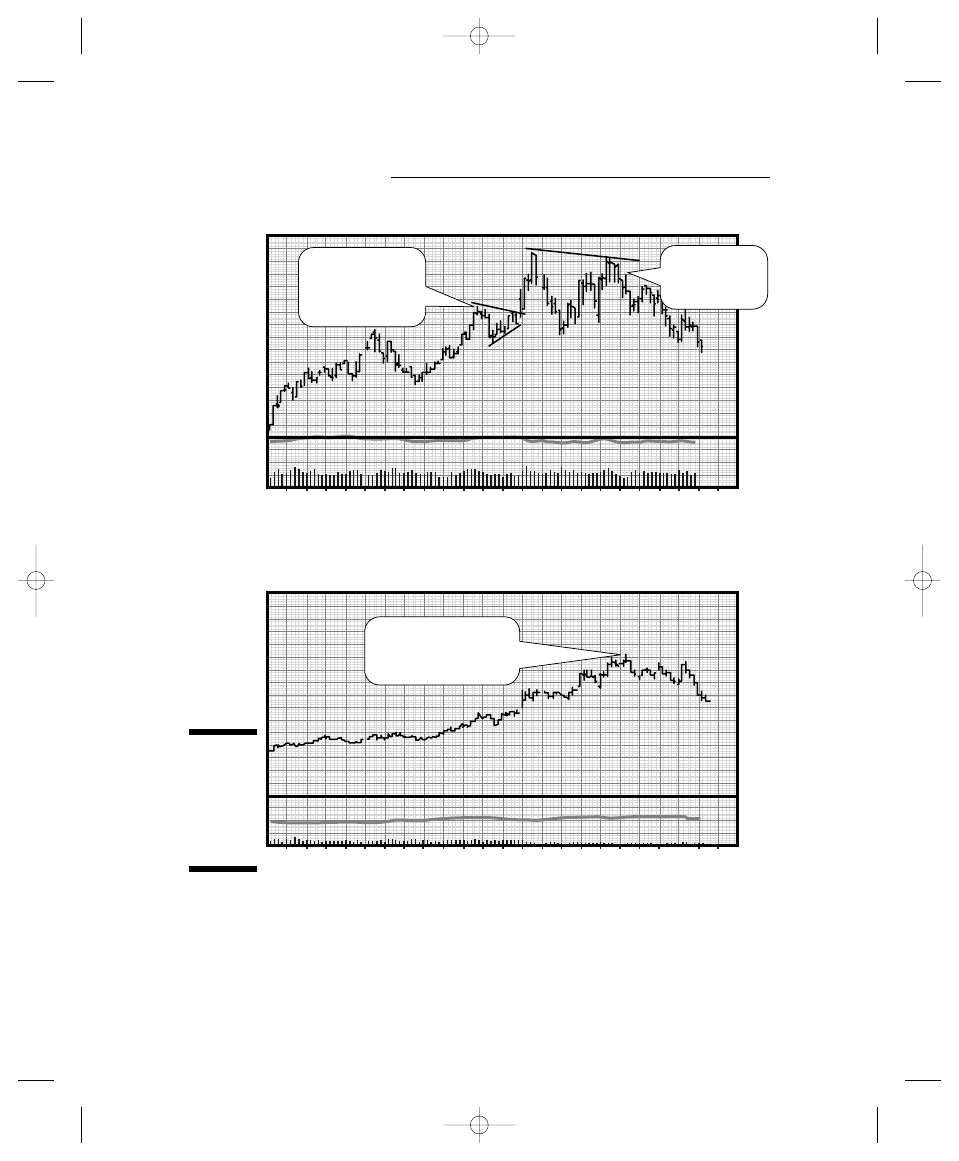
6
MAY-05
JUN
JUL
AUG
SEP
OCT
NOV
20
18
16
14
12
10
8
6
4
Cntrcts
500,000
0
20
4
18
1
15
29
12
26
10
24
7
Natural gas was the
last major energy
market to top out.
6
MAY-05
JUN
JUL
AUG
SEP
OCT
NOV
2.30
2.20
2.10
2.00
1.90
1.80
1.70
1.60
1.50
Cntrcts
100,000
0
20
4
18
1
15
29
12
26
10
24
7
Compression is a
sign that a big
move may be
on its way.
Heating oil
Natural gas
Double top
precedes
price decline.
Figure 13-4:
Heating oil
and natural
gas futures
after
Hurricane
Katrina.
Part IV: Commodity Futures
242
20_287224-ch13.qxp 5/27/08 11:01 PM Page 242

Getting Natural with Gas
Natural gas is an increasingly popular fuel. Its reputation for burning cleaner
than crude oil and coal has made it the number-one choice of environmental-
ists and a commodity with a rising demand profile.
Russia has the world’s largest natural gas reserves. The United States has
roughly a tenth of the reserves of Russia, and Iran has the second-largest nat-
ural gas reserves. Yet, domestic production in the United States has
increased significantly since crude oil prices have been on the rise.
Natural gas supplies about 25 percent of the energy used in the United States
and is increasingly important in generating electricity, especially during the
summer months, because of air conditioning.
Natural gas contracts have nine margin tiers, with initial margin requirements
differing and changing from time to time. Check out
nymex.com
for current
figures when you’re considering trading. Tier 1 margins in February 2008
were $6,750 and $5,000, respectively, for initial and maintenance for retail
customers.
A natural gas contract gives you control of 10,000 million British thermal
units (mmBtu), and a $0.1-cent move is equal to $10 per contract.
Aside from the usual supply-and-demand dynamics, natural gas is subject to
pressures from the hurricane season, because many major natural gas rigs
are located in the Gulf of Mexico. Figure 13-4 shows how natural gas prices
held up better than heating oil and gasoline during the week and weekend
leading up to the climactic run toward land of Hurricane Katrina.
You can trade natural gas and crude oil via exchange-traded mutual funds.
For crude oil, use the U.S. Oil Fund (USO), and for natural gas, use the U.S.
Natural Gas Fund (UNG).
Natural gas is extremely volatile, so you should be very well versed in technical
analysis before you try to trade it, even through UNG. A good idea is to do a fair
number of paper trades before you tackle natural gas trading in the real world.
243
Chapter 13: Getting Slick and Slimy: Understanding Energy Futures
20_287224-ch13.qxp 5/27/08 11:01 PM Page 243

Getting in Tune with Sentiment
and the Energy Markets
Sentiment is an unclear concept. To some, it can mean sadness; to others, it
means great joy. In the financial markets, it means greed and fear. Greed usually
comes with market tops, and fear usually is the hallmark of market bottoms.
These diverging concepts are, of course, what make up the contrarian thesis of
investing. (For more information about contrarian thinking, see Chapter 9.)
In the summer of 2005, when oil prices had risen by roughly 50 percent from
the previous summer, many attributed the huge rise in prices to a three-
pronged combination of refinery problems, significant weather changes, and
steady economic growth, compounded by event fear and fanned by the
flames of the greatest extension of a bull market in oil that started after
September 11, 2001. It was in this context that I started carefully tracking
market sentiment.
When I appeared on CNBC on August 24, 2005, the first question I answered
was, “How high can oil go?” My response was that $60 or $70 was possible,
but that I wasn’t sure. I also said that the market had been going up for some
time and that it was due for a pause.
When I returned to my office after the interview, the network pundits were
talking to Professor Michael Economides, author of The Color of Oil (Round
Oak Publishing, 2000), and he was predicting $100 oil, although he didn’t say
by when. All day long on CNBC and elsewhere in the financial media, cover-
age of the oil markets was rather dramatic, and so were the perceptions of
what was coming.
The next day oil prices fell more than a dollar, and the headline “SCREAMS AT
THE PUMP” appeared on the Drudge Report a few days later, signifying that
life in the oil markets was about to become even more interesting.
By August 26, 2005, the market was trying to decide what effect Hurricane
Katrina was going to have. The market close on that Friday was inconclusive,
but by Sunday, August 28, it became clear that Katrina was a major storm and
that the oil infrastructure in New Orleans and the Gulf Coast area, which is
responsible for a major portion of the energy supply and distribution of the
United States, was in peril.
Although oil had traded above $70 per barrel as the storm was brewing
overnight August 28, not enough data was available to support prices at that
level. As the storm hit on the morning of August 29, damage reports began
trickling in, and by August 30, oil finally burst above $70 per barrel during a
regular trading session.
Part IV: Commodity Futures
244
20_287224-ch13.qxp 5/27/08 11:01 PM Page 244

As the news of the storm trickled in, and the damage assessment became
clear, the oil market took on an entirely new, extremely serious tone that was
certain to suddenly make the American public keenly aware of daily price
fluctuations.
By the end of trading August 30, crude oil futures for October closed at
$69.85, just shy of $70, but nevertheless, still at an all-time record high.
On September 17, I appeared on the Financial Sense News Hour radio show
with Jim Puplava, and Jim and I both agreed that oil prices were looking as if
they were making a top. Few other analysts were on that side of the trade at
the time. I submitted an article to Rigzone.com in which I reported the con-
versation Jim and I had, and I forwarded the article to CNBC, which was inter-
ested enough to call me back for an interview.
I was back on CNBC the week after I made the call on the Jim Puplava show,
and told them that if oil fell below $56, it could go to $40. During the next
several weeks, the oil market dropped from the $70 area to around $60 by
November 1, when Republicans were agreeing with the Democrats in Congress
and starting to discuss adding a windfall tax to oil companies for making too
much money, another sign that prices could fall farther.
A second storm, Hurricane Rita, also hit the Gulf region just a few weeks after
Katrina, but the damage, although significant, wasn’t as bad.
As history shows, the U.S. economy recovered, but the price of oil, after a
brief fall, continued its bull market.
What was apparent in November 2005 was that at least 50 percent of the oil
and natural gas production infrastructure in the Gulf of Mexico was off-line,
although refinery capacity was steadily coming back online. The United States
was running on imported gasoline from Europe, yet prices still were going
lower and people were still calling for $100-per-barrel oil.
Some Final Thoughts about Oil
I’ll end this chapter with a list of some final thoughts to illustrate several
points that you need to know about the oil markets in the winter of 2008:
The bull market in oil was nearly seven years old. If you count
September 11, 2001, (or shortly thereafter) as its date of birth, that
means the bull market was getting old, even by secular or long-term bull
market standards, which are measured in years and sometimes decades.
No one knows how long a bull market of this magnitude can last. But one
thing is nearly certain, this one has been quite amazing, and theoretically
has the potential to last several more years, although there are likely to
be periods of significant declines along the way to higher prices.
245
Chapter 13: Getting Slick and Slimy: Understanding Energy Futures
20_287224-ch13.qxp 5/27/08 11:01 PM Page 245
The prevailing wisdom in August 2005 was that oil prices couldn’t go
anywhere but up. The world, after all, was running out of oil, and the global
economy could never slow down. At the start of 2008, the global economy
was slowing, and demand was about to slow, so prices should have fallen.
But they didn’t fall. In 2005, prices pulled back and the bull market resumed.
In 2008, prices finally closed at new records, well above $100.
In other words, no matter what the news and the experts are saying, always
trade with the trend. Develop a sense of when the market can turn, and don’t
be afraid to put your money where your mouth is. Don’t let what you want to
see happen get in the way of what’s happening. And don’t let what you want
to happen get in the way of your trading. The market will almost always
prove you wrong until you throw in the towel on your beliefs and what your
analysis is telling you. Then if you’re not careful, it will swallow you whole.
Part IV: Commodity Futures
246
20_287224-ch13.qxp 5/27/08 11:01 PM Page 246

Chapter 14
Getting Metallic Without
Getting Heavy
In This Chapter
Pricing the heavy-metal economy
Exploring the fundamentals of gold markets
Finding the trading line for silver
Going platinum (just not blonde)
Following the trends and markets in copper and other industrial metals
Strategizing for trades in copper futures
W
hen I think of heavy metal, I think of loud music, long hair, and fast
guitar licks. And if you look hard enough, you may even see me at one
of those increasingly popular 1980s’ metal reunion tours during the summer
because I like to see those old boys still strut their stuff.
The other side of heavy metal has nothing to do with music, but it’s still quite
industrial and can be just as profitable as record sales and concert grosses.
Indeed, metal futures (you knew I’d get around to it, didn’t you?) experienced
a significant revival because the global economy, largely influenced by
aggressive growth in China, has brought the luster back into what was a
largely faded area of the futures markets.
Metals divide into two major categories: precious and industrial. The markets
of the two different classes look at the same side of the economy but from dif-
ferent angles. Although precious metals are thought of as hedges against
inflation, price changes in the industrial metals category usually are precur-
sors to the start and often the end of economic cycles.
From a trading standpoint, especially from that of a beginner’s, the best way
to get started in the metals markets is to become familiar with the gold and
copper markets. They’re the two most economically sensitive of all the metals.
21_287224-ch14.qxp 5/27/08 11:01 PM Page 247

Part IV: Commodity Futures
248
In this chapter, I focus on gold and copper, but I also tie in enough information
about silver, platinum, and the other industrial metals to understand how the
markets for each of them work.
Tuning In to the Economy
The prices of precious and industrial metals are linked to economic activity.
Gold steals all the headlines, but the industrial metals do much of the work.
Here’s what I mean: Rising economic activity leads to increasing demand for
industrial metals. When industrial activity reaches the point where demand
starts to outstrip supply, inflationary pressures start to build in the system.
At that point, gold prices can start to rise.
Industrial metal prices are sensitive to demand. Copper prices, especially,
can be a leading indicator of an increase in economic activity, given the wide-
spread use of the metal in housing, electronics, and commercial construction.
The flip side is that the copper market can start to sag, and prices can start
to drop several months ahead of data such as Gross Domestic Product num-
bers (see the section “Getting into Metal without the Leather: Trading
Copper,” later in this chapter).
The key word here is can. With most of the world’s supply of gold in the
hands of central banks — whose main goal is fighting inflation — the man-
agers of those central banks know that speculators see rising gold prices as a
sign of inflation. When gold rallies tend to get out of hand, central banks start
selling the metal from their huge stockpiles, and prices eventually fall.
No one really knows whether central banks are heavy buyers of gold when
the price starts to fall; however, central banks can plausibly become gold
buyers of last resort when the fears of deflation hit the market or prices con-
tinually decline.
The fact that central banks tend to be gold sellers during rallies doesn’t mean
gold prices can’t rally for significant periods of time. It just means that central
banks are a formidable market opponent of the everyday trader and that the
days of straight-up advances in gold where smart speculators make or break
their lifetime’s fortune, although still possible, aren’t as likely as they once were.
And just so you don’t go around thinking that I’m pushing conspiracy theo-
ries, you can check out all kinds of extreme and sensible commentaries on
central banks and gold anywhere on the Internet.
A good commentary at Financial Sense.com (
www.financialsense.com/
fsu/editorials/2004/0308.html
) summarizes a fully disclosed five-year
plan of gold sales by central banks.
21_287224-ch14.qxp 5/27/08 11:01 PM Page 248
The highlights are simple. The central banks
Acknowledge that gold is “an important element of global monetary
reserves.”
Set limits of sales over the five-year period of the program to no more
than 500 tons per year and no more than 2,500 tons over the entire five-
year period.
Won’t sell more gold than they have in reserve.
Review the agreement in five years.
The bottom line is that gold is a tricky market because of central banks and
the role they play in it. On the other hand, industrial metals such as copper
offer more transparency in their pricing patterns because of their close rela-
tionship with economic expectations and economic activity.
From an investment standpoint, gold still is central to the world’s monetary
system — no longer because it’s a standard for payments, but rather because
it’s the most strategic holding common to the world’s central banks and often
serves as a tool to cool off the world’s view of inflation.
When you invest in gold, you’re swimming against the tide. The world’s cen-
tral banks hold 25 percent of all the gold ever mined. According to the World
Gold Council, in 2003, central banks held ten times the amount of gold that
was mined in that year — 33,000 metric tons housed in vaults versus 3,200
metric tons mined. I’m not saying that you need to avoid gold completely; I’m
simply noting that the average investor is up against gargantuan market-
making opponents in the world’s central banks.
Gold Market Fundamentals
South Africa is the world’s largest producer of gold, accounting for 25 percent
or more of all global production and 50 percent of the accessible reserves.
Russia, the United States, Canada, Australia, and Brazil make up the rest of
the top-tier producers.
The all-time high in gold prices was set in January 1980, when the price of the
October contract hit $1,026 per ounce as the spot-market price rallied to
$875. By February 2008 gold had moved back over $1,000 for a brief spell as
the weakness in the U.S. dollar and inflationary pressures from China pushed
prices upward. In March, gold prices crashed and burned also, taking prices
back down below $1,000. The decline started minutes after Federal Reserve
Chairman Ben Bernanke lowered interest rates, but changed the Fed’s message
to the markets highlighting the central bank’s concern about inflation.
249
Chapter 14: Getting Metallic Without Getting Heavy
21_287224-ch14.qxp 5/27/08 11:01 PM Page 249
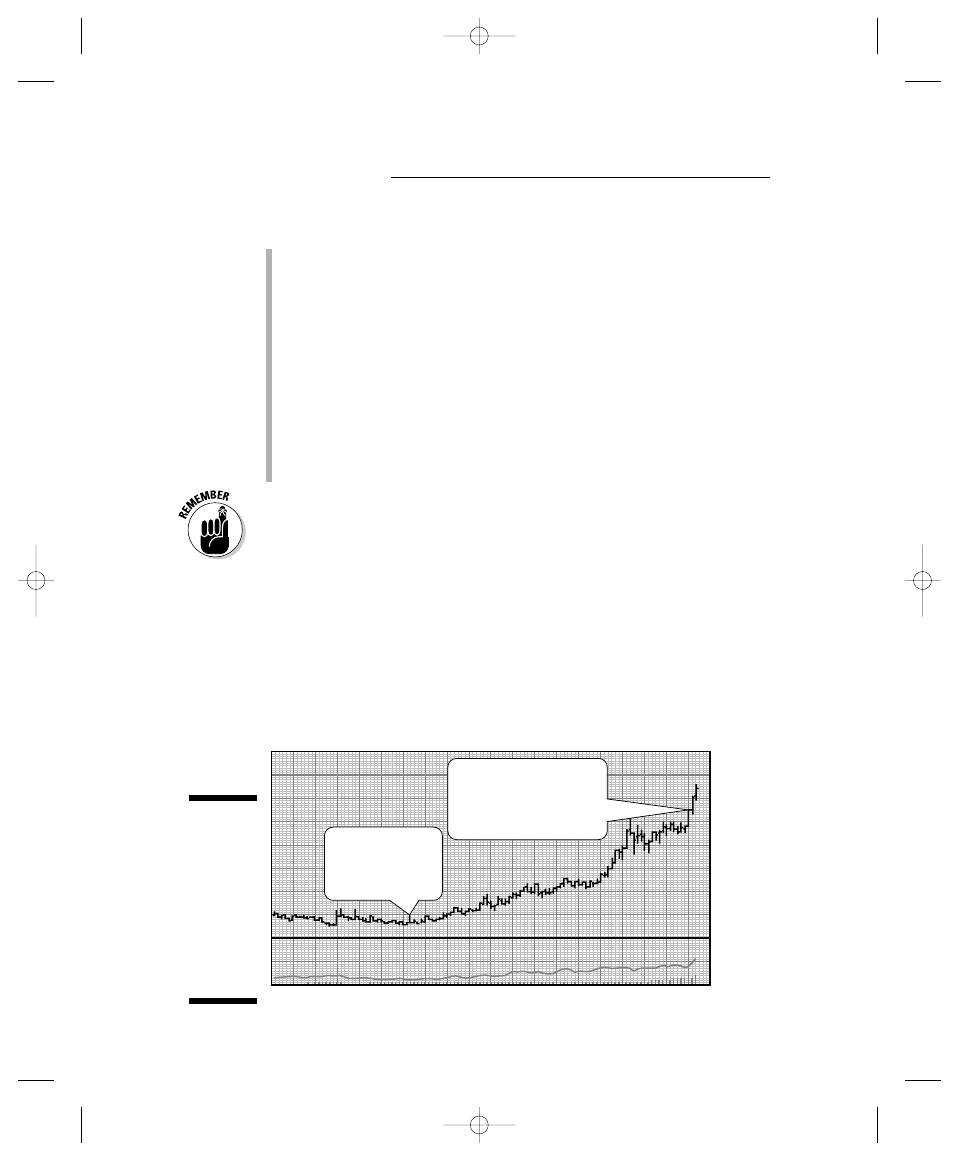
Here are two key factors to keep in mind about the gold market:
Two major influences have an effect on gold prices. They are
• Major political upheaval: Political crises tend to be the major
reason for gold prices to rise.
• Inflation: The influence of inflation on gold prices is much less
intense than it was in the past because of the management of gold
prices by the central banks.
The most reliable influence in the gold market is its relationship to
the U.S. dollar. Figures 14-1 and 14-2 show how the trends of gold and the
U.S. dollar reversed after the events of September 11, 2001, and how they
accelerated after the U.S.’s subprime mortgage crisis. The Federal Reserve
(the Fed) lowered interest rates in both cases, in effect printing money
and decreasing the value of the dollar, which brought the gold bugs out
of hibernation.
Gold prices and the U.S. dollar tend to move in reverse of each other. This
relationship isn’t a perfect one, but it’s worth looking for and tends to hold
up well over long periods of time.
The price of gold can be confusing, so here’s a quick primer. The international
benchmark price for gold is the London Price Fix, which is set in U.S. dollars
and is quoted in troy ounces twice daily as the a.m. fix and the p.m. fix. The
London exchange summarizes global gold trading as these composite prices.
Gold trades around the world on major exchanges in China, the United
Kingdom (UK), and the United States. India and China are countries with
expanding demand for gold.
98
99
00
01
02
03
04
05
06
07
08
200
300
400
500
600
700
800
900
1000
GOLD NEAREST FUTURES . . monthly OHLC plot
0
Cntrcts
500000
Gold blasts to new highs
on the U.S. Dollar
weakness after the
subprime mortgage crisis.
Gold bottoms
near 9-11-2001
and starts a long-
term rally.
Figure 14-1:
Gold bot-
toms near
September
11, 2001, and
accelerates
its advance
in 2007
as the
U.S. dollar
weakens.
Part IV: Commodity Futures
250
21_287224-ch14.qxp 5/27/08 11:01 PM Page 250
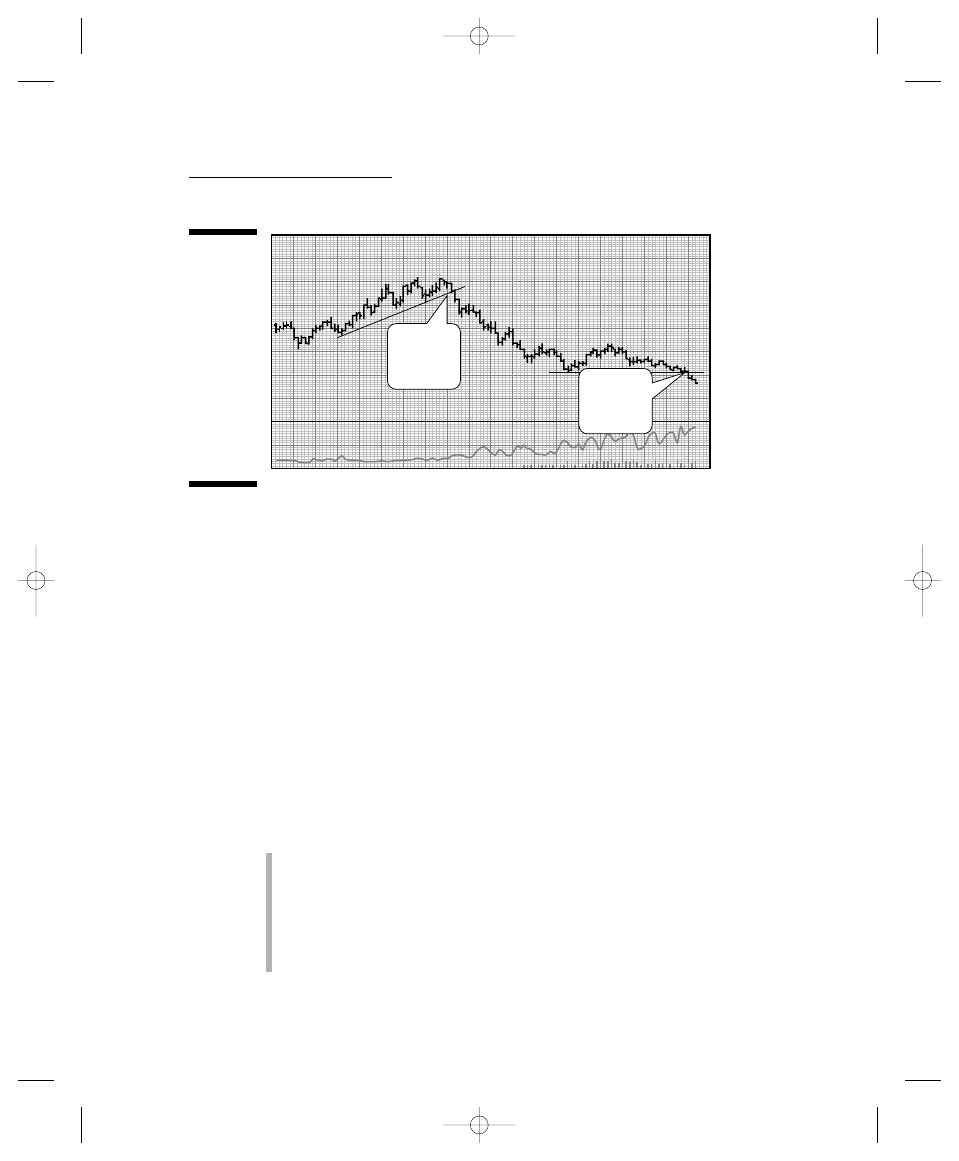
Spot gold and gold futures trade on the New York Mercantile Exchange
(NYMEX). Gold futures also trade on the Chicago Board of Trade (CBOT) and
have relatively low margin requirements for speculators. That means gold
can be an attractive market for small accounts. As of November 2007, initial
margin was $3,375, and maintenance was $3,375. The full contract margins at
CBOT were $2,309 and $1,710.
Mini contracts are smaller versions of the original contract. The mini contract
for gold futures also trades on CBOT. As of November 2007, mini-sized gold
margins were $770 and $570 for initial and maintenance. In the case of gold, a
mini contract contains 33.2 troy ounces of gold, compared with a full-size con-
tract that holds 100 troy ounces. The margin requirements are smaller, but the
general characteristics and fundamentals of the market remain the same.
You can find several reliable information sources for gold on the Internet.
Two I like to use are the World Gold Council (
www.gold.org
) and Kitco.com
(
www.kitco.com
).
When trading gold and gold futures, you need to watch the following:
Actions taken by central banks around the world: Central banks tend
to be net sellers. As a general rule, they either sell or stay out of the
markets. See “Tuning In to the Economy,” earlier in this chapter.
The Fed, the European Central Bank, the Bank of England, and the
National Bank of Switzerland usually are major players in the gold
market, but any central bank is a potential seller, especially during periods
of heightened inflationary expectations.
98
99
00
01
02
03
04
05
06
07
08
200
300
400
500
600
700
800
900
1000
U.S. DOLLAR INDEX NEAREST FUTURES . . monthly OHLC plot
0
Cntrcts
25000
9-11
inflection
point
Subprime
mortgage
crisis hits.
Figure 14-2:
The U.S.
dollar
breaks
down after
September
11, 2001, and
again
breaks to
new lows
as the
subprime
mortgage
crisis hit.
251
Chapter 14: Getting Metallic Without Getting Heavy
21_287224-ch14.qxp 5/27/08 11:01 PM Page 251
The geopolitical situation: Asia, the Middle East, and South America are
global regions full of potential instability. The chance for terrorist attacks
is rising on a daily basis and is likely to become something that remains a
big influence from time to time during the next several decades.
Wars: Wars can lead to volatility in the price of gold. The expectation for
higher prices during wars is often not met, given the frequency of major
regional conflicts around the world and the frequent selling by central
banks.
General weakness of the dollar and other major global currencies:
The general relationship is for gold to rise when the dollar weakens. As
with other traditional relationships, this rule isn’t set in stone but rather
is a tendency caused by central-bank intervention in the gold and cur-
rency markets. This relationship is as reliable as any in the financial mar-
kets and is worth understanding and monitoring.
In 2007, the U.S. dollar fell to a new low as measured by the U.S. Dollar
Index. The dollar fell to a level not seen since the 1970s.
At the same time, the price of gold moved above $800 per ounce.
Noticeably, the price of crude oil was nearing $100 per barrel at the
same time. The combination of higher oil prices, higher gold prices, and
a lower dollar was confirmation that the financial markets were betting
on inflation.
Inflation: If the Fed starts talking seriously about inflation and starts
raising interest rates aggressively, the gold market is likely to respond
with higher prices. For a major rally in gold to develop, the markets have
to start believing that central banks can no longer control inflation. That
hadn’t happened since the 1970s. In 2005, though, the Fed and other
global central banks began talking more seriously about inflation. When
they did, gold prices began showing some rising power. This accelerated
in 2007 when all the world’s central banks had to pump large amounts of
liquidity into the money markets as the liquidity crisis spawned by the
subprime mortgage crisis spread throughout the world.
Technical analysis indicators: They can keep you on the right side of
the trade. As with other markets (see Chapter 7 for an overview of tech-
nical analysis), moving averages, trend lines, and oscillators such as the
MACD and RSI work with gold prices and need to be an integral part of
your gold trading.
Getting into the habit of looking at long-term commodity charts on a weekly
basis makes you better able to deal with any titanic shifts in the long-term
trend, such as what occurred September 11, 2001. Figures 14-1 and 14-2
clearly mark two inflection points in the gold market’s key reversal and
subsequent multiyear bull run.
Part IV: Commodity Futures
252
21_287224-ch14.qxp 5/27/08 11:01 PM Page 252

Lining the Markets with Silver
Silver is a hybrid metal because it’s used for industrial purposes and as a pre-
cious metal in jewelry. The silver market is extremely volatile and can be diffi-
cult to trade.
Mexico and the United States are the largest producers of silver. Silver mines
usually can’t operate profitably when market prices fall below $8 per ounce.
As a result, when prices fall below that level, production of silver wanes con-
siderably, with much of it coming as a byproduct of copper, lead, and zinc
mining processes.
When trading silver, you need to know these nuts and bolts:
One silver contract contains 5,000 troy ounces, with a 1 cent move being
worth $50.
The modern-day trading range for silver is from 35 cents during the
Great Depression up to $50 per ounce when the Hunt brothers tried to
corner the silver market in the late 1970s.
When copper, lead, and zinc prices rise (especially because of decreased
production), the price of silver is likely to rally because much of the world’s
silver is a byproduct of mining and processing the other three metals.
Catalyzing Platinum
The platinum market is heavily influenced by Japan, where it’s the precious
metal of choice. Although a precious metal, platinum also has hybrid quali-
ties. In fact, it’s more often used as the key component in making catalytic
converters for cars.
The relative economic strengths in Japan, in the automobile market and in
the medical and dental fields — where platinum is also in demand — are the
major influences on the price of platinum.
Platinum trades on the NYMEX in contracts containing 100 troy ounces. It can
be thinly traded, though, and is best avoided by beginning traders. As with
gold, South Africa is the world’s largest producer, with Russia second and,
due to some recent finds, North America third. Platinum usually trades at a
higher price than gold, because supply is much smaller — only 80 tons of the
metal reach the market in any given year. For example, on October 28, 2005,
platinum futures closed at $941 per troy ounce while gold futures closed at
$474. As with any other market, you can apply the usual method of finding
out about the fundamentals combined with technical analysis.
253
Chapter 14: Getting Metallic Without Getting Heavy
21_287224-ch14.qxp 5/27/08 11:01 PM Page 253

Industrializing Your Metals
Technical indicators are the key to predicting future trends in industrial
metals, so you need to be on the lookout for the early clues before a trend
changes.
The most important industrial metals (copper, aluminum, zinc, nickel, lead,
and palladium) start to rally when the market senses that demand is starting
to increase, or they start to fall back when the market senses supplies start-
ing to stabilize. In general terms, then, trends in the industrial metals markets
start to turn at these transition points. As a trader, you can’t get caught in the
expectations game, though. You need to wait for the markets to make their
moves; you don’t get a prize for being the first trader to buy something.
Although gold still is an important asset, the industrial metals complex is a
better place for speculators to trade because it’s where supply and demand
information and easily measured economic fundamentals (with good correla-
tion to prices) are available and tested by price action and overall response
in the markets.
Getting into Metal Without
the Leather: Trading Copper
Copper is the third most-used metal in the world, and it’s found virtually
everywhere around the globe. The most active copper mines are in the
United States, Chile, Mexico, Australia, Indonesia, Zaire, and Zambia.
A beginning trader may be tempted to dive into the gold market, but some
good reasons exist for considering copper first, especially its close connec-
tion to the economic cycle and the housing market.
Generally, I like to trade markets that have a good correlation to a sector of
the stock market where I have access to company earnings and where industry
executives are required by law to provide the market with truthful information
by using widely disseminated means such as television and major media outlets.
You can see what I mean in the next section.
Before that, though, you need to know a few things about copper before you
start trading it, and these things have nothing to do with leather, smoke-filled
stages, or headbanging. The keys to trading copper that I tell you about in
this list set the stage for the more-involved data that follow.
Part IV: Commodity Futures
254
21_287224-ch14.qxp 5/27/08 11:01 PM Page 254
Uses: The major uses for copper are in
• Construction and housing for plumbing and wiring
• High technology for wiring
• Semiconductor-related industries for wiring
Markets: Copper trades at the COMEX, which is a division of the NYMEX
in New York, and at the London Metals Exchange. The London contract
trades several times more than the U.S. contract in terms of volume, but
both are liquid and active contracts.
Contracts: The COMEX contract is for 25,000 pounds of copper, and the
London contract is for 55,000 pounds. New York prices are quoted in
dollars and cents per pound, but London prices are quoted in dollars
and cents per ton. Thus, a 1-cent move in New York is worth $250, and a
$1 move in London in worth $25.
You can use stock prices and trends as predictors of industrial metal prices.
Setting up your copper-trading strategy
Figuring out key relationships within any market is your first step when analyzing
it from a technical standpoint. One of my favorites is the relationship between the
copper market and the stock of Phelps Dodge, and in turn, its relationship with the
bond and housing markets. These interrelationships are as important as any you
can find in the futures market, primarily because all the pieces depend on one
another for a complete picture of their respective markets to emerge. Here’s why:
Phelps Dodge was a leading smelter and producer of copper. As a
result, the stock had an excellent record of predicting the trend in market
for the metal. The key to the success of the relationship is that stock
investors start betting on the future trend of earnings for the company
based on their expectations for copper demand, and thus, its connec-
tion to the company’s earnings in 2007. Freeport McMoRan (NYSE: FCX),
another mining company that also mines for gold, bought Phelps Dodge.
The addition of gold into the mix made me look for another bellwether. The
truth is that I finally found two stocks that could serve the same purpose.
One is Freeport McMoRan (NYSE: FCX), and the other is Southern Copper
Corporation (NYSE: PCU). Together, these two stocks were almost as good
as Phelps Dodge. What’s important is that you look at the copper stocks as
well as the price of copper. The upcoming Figures 14-3 and 14-4 update the
relationship between the stocks of the copper producers and the price of
copper.
The housing market has a good correlation to the price action of hous-
ing stocks. The key is the information provided in monthly housing
reports, especially housing starts and building permits. These two
255
Chapter 14: Getting Metallic Without Getting Heavy
21_287224-ch14.qxp 5/27/08 11:01 PM Page 255
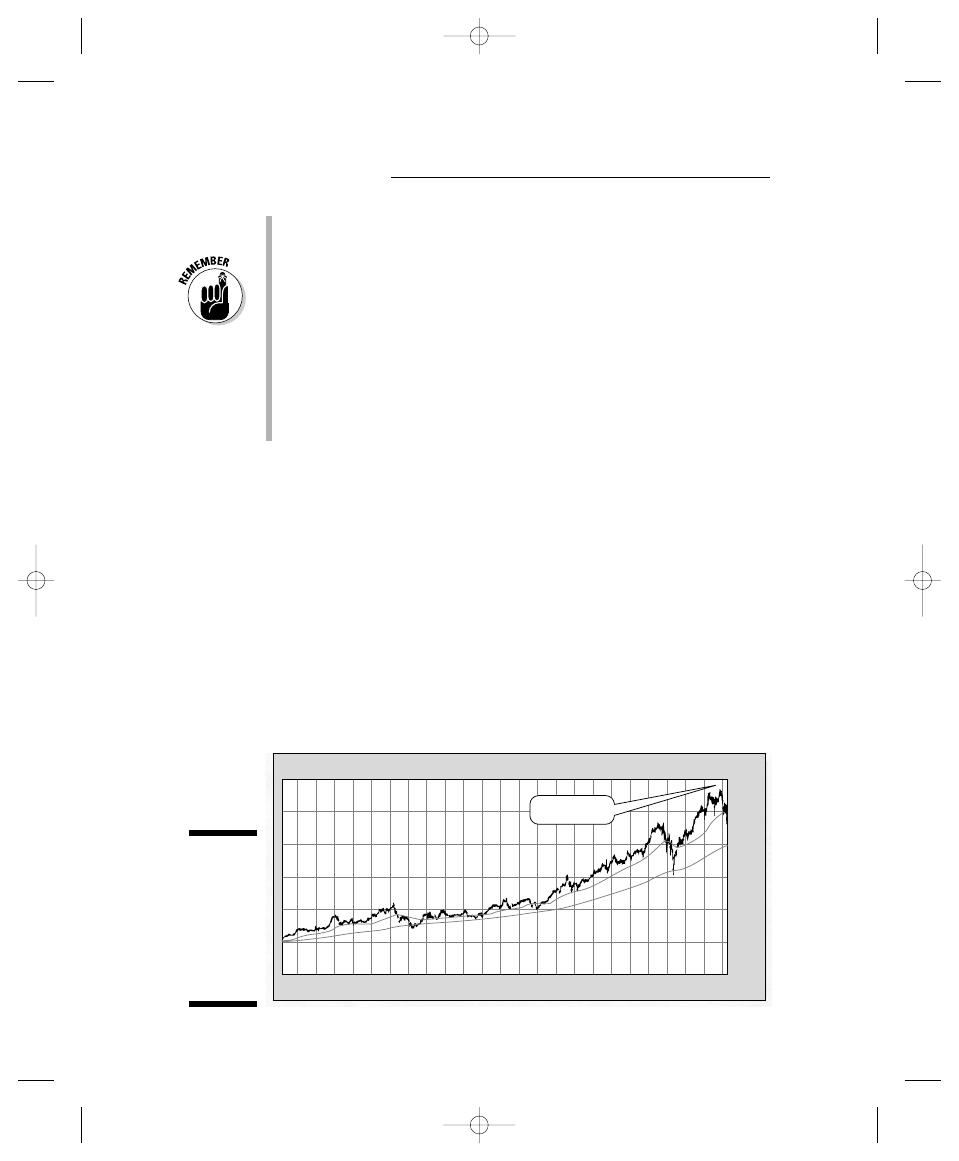
reports are the lifeline of the whole equation, because the Fed looks at
them closely as it tries to figure out what to do with interest rates.
The housing stock that you use for this purpose needs to be one that
behaves similarly in each cycle. I usually use Centex (NYSE symbol:
CTX) or Toll Brothers (NYSE symbol: TOL), because they’re large capi-
talization stocks that service significant portions of the housing market.
Toll Brothers is an upscale builder that usually is one of the last to top
out because it serves richer customers who can last longer. Centex is a
good cross-section builder that also works on commercial properties.
The bond market takes its cues from inflationary indications. For
example, if housing prices rise too rapidly, and signs of bottlenecks
appear in commodities markets for copper and lumber, the bond market
starts to sell off and interest rates rise.
Charting the course
Putting copper market interrelationships together requires you to keep a
close watch on charts of the components that I explain in the preceding sec-
tion, including copper futures, shares of Phelps Dodge Corporation, housing
starts and building permits, and the bond market.
Figures 14-3 and 14-4 show good examples of how these relationships worked
with Phelps Dodge, and the historical significance of the relationship is worth
chronicling. Notice the general trends of the metal (Figure 14-3) and the stock
(Figure 14-4) and how they usually change directions within a close time
frame of each other. Phelps Dodge topped in March while the metal was drift-
ing lower. Soon after, though, the metal made a new low, and both rallied
starting in May and heading into August.
D 06 F M
150
125
100
75
50
25
0
A M J
J
A
S
O N D 07 F M A M J
J
A
S
O
PCU
EMA(50) 123.70 EMA(200) 98.66
EMA(50) 123.70 EMA(200) 98.66
UNCHG
114.070
Double Top
Figure 14-3:
Six-month
chart of
copper
futures
for the
September
2005
contract.
Part IV: Commodity Futures
256
21_287224-ch14.qxp 5/27/08 11:01 PM Page 256
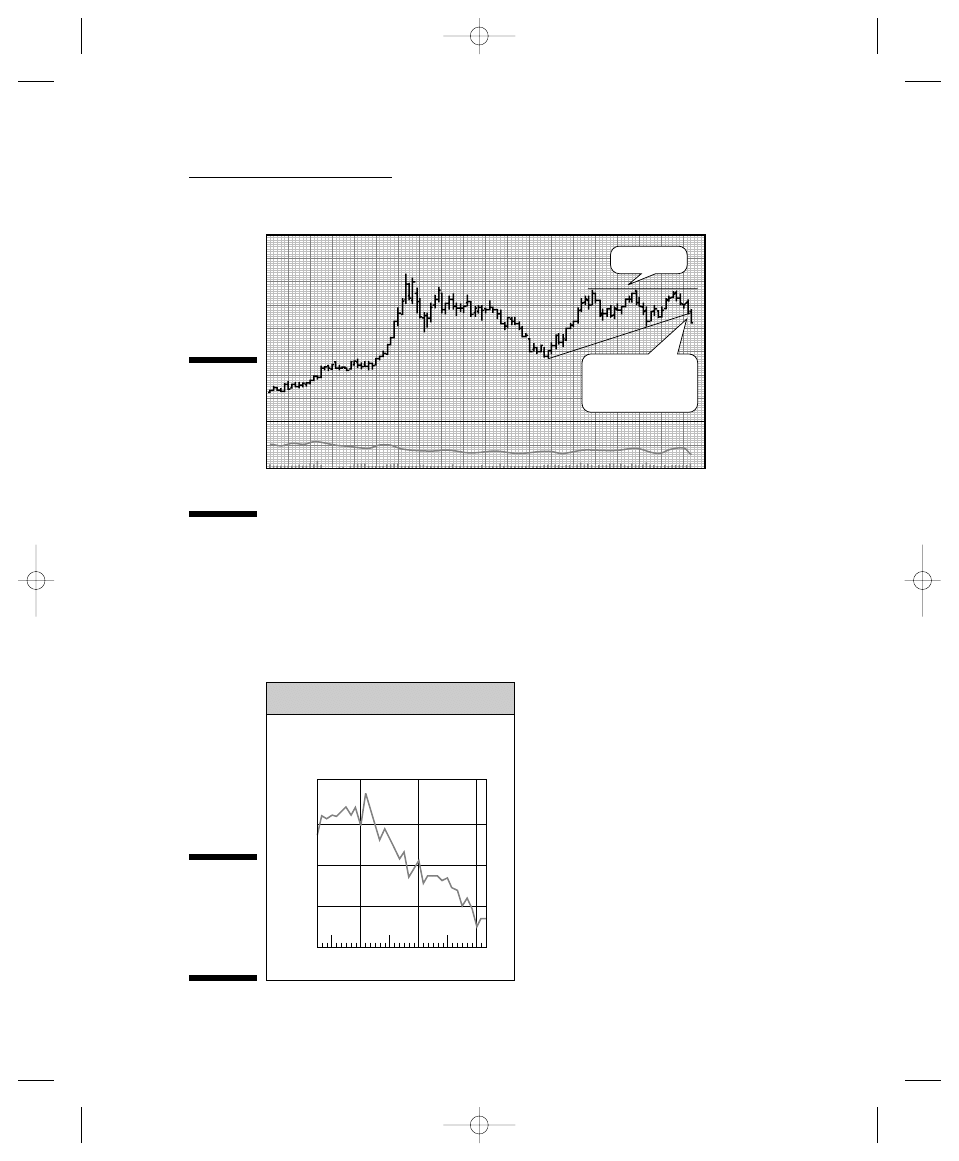
In Figure 14-5, you can see how housing starts started drifting lower in the
spring of 2005 after hitting a high point in January. The slowing of housing
starts correlates well with an intermediate-term top seen in the price of
Phelps Dodge stock. Notice that as housing starts stabilized, Phelps Dodge
and copper each staged yet another rally that reached new highs as it
extended into August.
2006
HOUSING STARTS
2005
2.40
Annual rate in millions of units,
seasonally adjusted
2007
0.80
1.20
1.60
2.00
Figure 14-5:
Housing
starts from
January
2002 to July
2005.
S
O N D
J
F M A M J
J
06
05
As of 11/05/07
07
A
S
O N D
J
F M A M J
J
A
S
O N
100
150
200
250
300
350
400
450
500
HIGH GRADE COPPER NEAREST FUTURES . . monthly OHLC plot
0
Cntrcts
1000000
Critical break of
intermediate term
support
Triple Top
Figure 14-4:
Six-month
chart of
stock prices
for Phelps
Dodge
Corporation
in 2005.
257
Chapter 14: Getting Metallic Without Getting Heavy
21_287224-ch14.qxp 5/27/08 11:01 PM Page 257
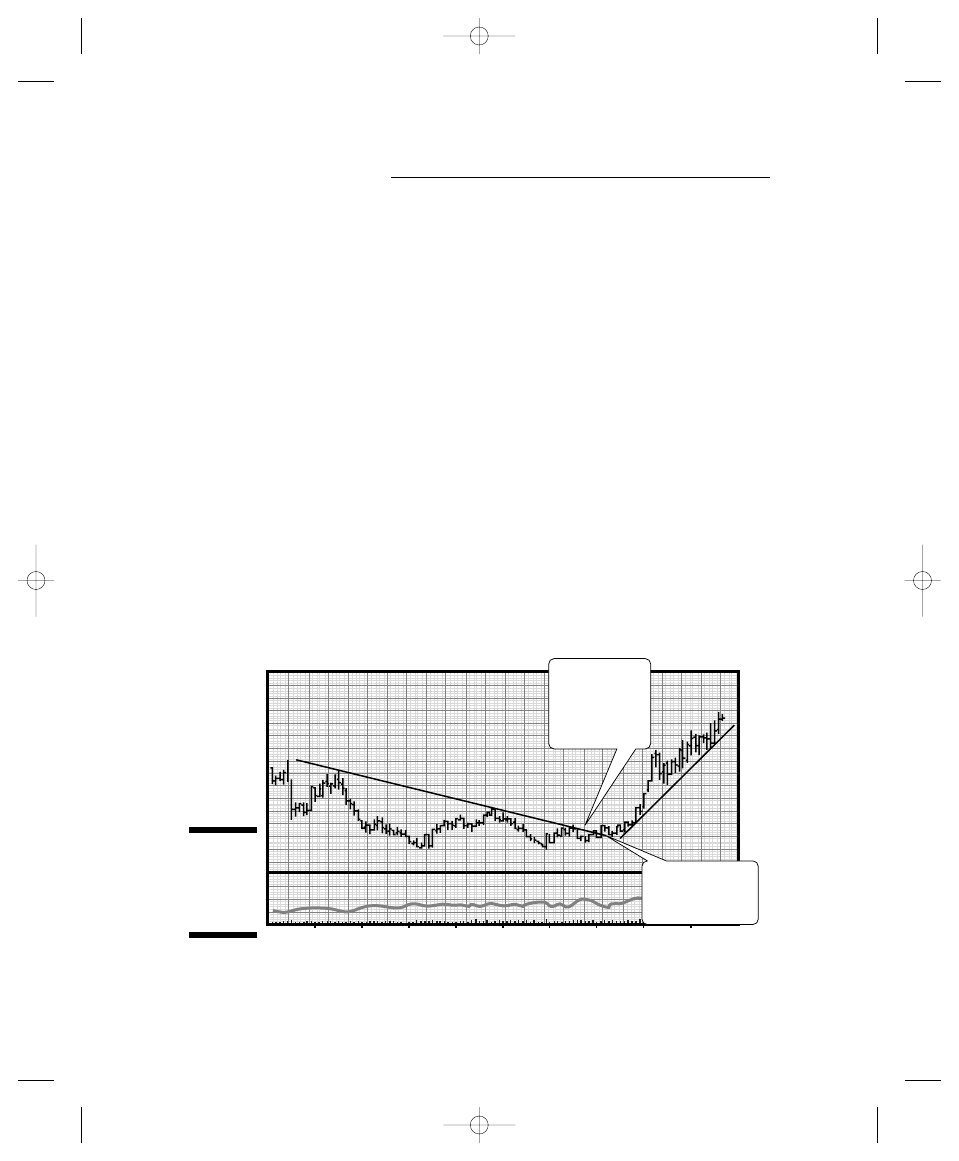
According to Figure 14-7 (later in this section), Centex, a good representative
of the housing sector, rallied a full two years before Phelps Dodge took off on
its own rally. The reason the rally in Centex led to the rally in Phelps Dodge
shows up in Figure 14-6. Copper prices were forming a base in the late 1990s,
but only when the market started to price in the fact that demand for the
metal would likely outstrip supply did the rally in Phelps Dodge begin.
Figure 14-7 shows something very important: Centex (right), a major U.S.
homebuilder, began to falter at the same time housing starts began to drift.
This move is more obvious in Figure 14-8, which shows the U.S. ten-year
Treasury note yield rising dramatically on August 6, 2005, in response to a
strong U.S. employment report. Note that on the day of the big move up in
interest rates, Centex fell apart.
By August 16, Phelps Dodge also had fallen, but then something interesting
happened in September and October. Hurricanes Katrina and Rita hit the U.S.
Gulf coast, leading to massive housing and commercial building destruction.
As a result, the market started pricing in a rebound in new construction, driv-
ing prices higher.
At the same time, during this period, China’s economy, as measured by gross
domestic product (GDP), continued to grow at a 9.4 percent clip as the U.S.
economy grew at a faster-than-expected rate, and copper prices moved to a
slightly new high as the market factored in a rise in demand for copper in the
wake of the rebuilding.
96
200
180
160
140
120
100
80
60
0
97
98
99
00
01
02
03
04
05
Never ignore a
sustained break
above or below a
multi-year trendline.
Long term
Copper rally
starts out near to
start of major
long-term rise in
housing starts.
Figure 14-6:
Long-term
view of
copper
prices.
Part IV: Commodity Futures
258
21_287224-ch14.qxp 5/27/08 11:01 PM Page 258
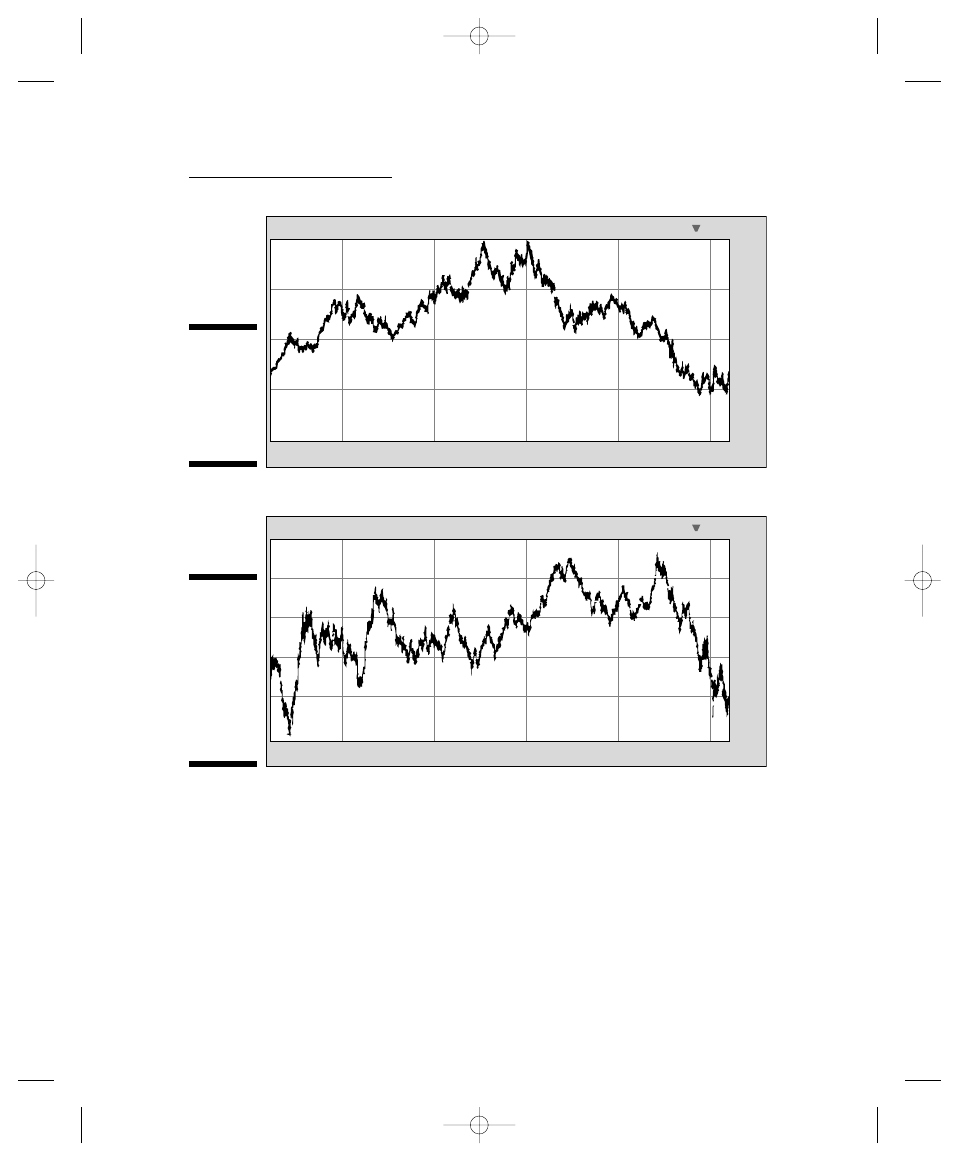
In the following section, I discuss the relationship between copper and the
global economy as the U.S. economy began to slow and the Chinese economy
didn’t. This situation led to a slowing in the advance for the price of copper,
while some of the demand for the metal slowed due to the weakness in the
United States. However, the strength in China was good enough to keep
things going.
04
05
06
TNX.X
0.680
34.660
55
07
08
50
45
40
35
30
Figure 14-8:
A huge one-
day backup
in bond
yields drove
interest
rates up and
housing
stocks
down.
0.090
04
05
06
CTX
23.600
80
07
08
60
40
20
0
Figure 14-7:
A decades-
long view of
the prices of
Phelps
Dodge and
Centex.
259
Chapter 14: Getting Metallic Without Getting Heavy
21_287224-ch14.qxp 5/27/08 11:01 PM Page 259

My point is that markets react to circumstances as well as perception. A
major top in copper was building as the housing market began to respond to
higher interest rates, but an intangible set of events — in this case, the hurri-
canes — and the persistent growth of the Chinese and American economies
led to a new leg up in prices. These circumstances give more credence to the
relationship between interest rates, the price of copper, and the housing
market.
Organizing the charts
I find it useful to organize the way I look at my charts on a timeline, and you
may benefit from organizing the way you look at charts, too. Here are the
steps that I take:
1. Look at daily charts.
Starting with a glimpse of daily charts helps you to get the current pic-
ture straight.
2. Look at longer-term charts.
I like to take a step back and view charts spanning years so I can put the
current picture (from Step 1) in the right perspective. Orienting the
short-term with longer-term charts helps you decide whether the cur-
rent trading activity is within the long-term trend or a counter-trend
move.
3. Look at shorter-term charts.
By shorter-term, I mean checking out charts that span either a few days
or maybe even only an intraday time period (hours or even minutes)
with an eye on optimizing my entry and exit points.
Use a charting program that enables you to look at more than one chart at a
time.
Here’s what you need to watch for when viewing your charts:
Interest-rate trends: Interest-rate trends are your leading indicator,
because the housing market thrives on low interest rates. The big move
up in rates in early 2005 wasn’t the top in copper, but it was enough to
take the wind out of the rally’s sails for quite some time.
Differing timelines: By looking at the same chart using at least three
different timelines, you focus in on a much clearer picture of what’s hap-
pening in the market. With practice, you can compile the trio of timeline
data in only a few minutes.
Overall trends: Using a long-term chart like the one in Figure 14-5 as
your guide, you can check out a market’s overall trend. You need to plan
your trades based on the primary long-term trend. For example, if copper
Part IV: Commodity Futures
260
21_287224-ch14.qxp 5/27/08 11:01 PM Page 260

is in a three-year uptrend, you can expect pullbacks. You can short the
pullbacks whenever they look like they’re going to last. However, as a
trader, your main focus needs to be on trading the long side until an
irrefutable break to the downside occurs. When that break occurs, you
need to turn your sights to short selling, all the time knowing that you’ll
eventually get short-term opportunities to go long.
An example of such a potential break came in November 2007, where the
copper market failed to keep up with the advance in PCU. When the
commodity fails to keep up with the bellwether stock, it can be a sign of
trouble ahead. The two may not finally agree for a long time. The chart
of the stock, for example, may feature a double top that closely corre-
sponds to the time frame where the third peak of the triple top occurred
in copper.
Economic News: You need to keep abreast of the news. In November
2007, the triple top in copper came as the U.S. economy was showing
significant signs of a potential slowing due to the persistent problems in
the housing sector. It was also a time when oil prices were near $100 per
barrel, and China was in the midst of an energy crisis because its domes-
tic oil companies were having a hard time keeping up with demand.
Trend lines: Never ignore a sustained move above or below a multiyear
trend line. Watch trend lines closely. Figure 14-6 shows a new bull market
forming in copper, starting in 2003 as the multiyear downtrend line was
broken. So just as Pink Floyd sings, “How can you have any pudding if you
don’t eat your meat?” — if you trade futures, keep this in mind: If you don’t
read your charts, you’ll miss important turning points in the market.
Divergence in your charts: Make sure copper stocks and copper futures
are moving in the same general direction. If they’re not, you have a tech-
nical divergence, a situation that can result in one of two scenarios:
• Futures will turn in the direction of the stocks.
• Stocks will turn in the direction of the futures.
Figures 14-3 and 14-4 show a small divergence between Phelps Dodge
and the September futures contract. Although they bottomed in May, the
move in copper was stronger than the one in the stock. It took until June
for the full reversal in Phelps Dodge to confirm the rally in the futures.
Making sure fundamentals
are on your side
Success in the futures market depends on how well you know the market
in which you’re trading, technically and fundamentally. The economically
261
Chapter 14: Getting Metallic Without Getting Heavy
21_287224-ch14.qxp 5/27/08 11:01 PM Page 261
sensitive metal markets are too difficult to trade without using both technical
and fundamental analyses.
Here are some key tips on how you can make sense of technical and funda-
mental information:
Check housing starts. This key report shows you whether the current
trend in copper is sustainable. For example, housing starts were flat in
June 2005, a factor that was reflected in the July 19 report, which you can
view at The Wall Street Journal online,
www.wsj.com
, when you subscribe.
Look beyond the headlines. The full text of the June housing report
contained some important details about single-family home starts being
down 2.5 percent from the May report. However, the number of building
permits still was rising, so that particular number held up the market.
Still, as the newspapers flaunted the never-ending housing boom, the
June report was cautionary.
Check supply and demand. You need to know what supply-and-demand
indicators like the Purchasing Manager’s (ISM) reports are saying.
A good way to get a grip on supply and demand is to see which indus-
tries are reporting growth and which aren’t from the ISM report, which
also is available in full on The Wall Street Journal Web site. The July 2005
report was released August 5, 2005, just a few days after the Fed started
to set the stage for a more aggressive stance toward higher interest
rates and just before the housing stocks began to show signs of weak-
ness. The list of industry sectors that the July ISM report said were
growing included Instruments and Photographic Equipment; Food; Wood
and Wood Products; Electronic Components and Equipment; Leather;
Miscellaneous; Industrial and Commercial Equipment and Computers;
Transportation and Equipment; Furniture; Chemicals; Fabricated Metals;
and Textiles.
The sectors that the July ISM said were decreasing in activity included
Printing and Publishing; Glass, Stone, and Aggregate; Primary Metals;
Apparel; Rubber and Plastic Products; and Paper.
A quick glance at these sectors shows these factors:
• Several housing-related sectors were growing, especially the fabri-
cated metals, such as steel, textiles, and wood, which are used in
furniture. Indeed, furniture also was growing. The overall picture
for housing, however, was mixed.
• Primary metals, copper included, were one of the weak sectors.
At a point in the copper market like the one described in the preceding list,
you want to be careful, watch the charts, and wait for the next month’s report
to confirm your suspicions that the trend may slow.
Part IV: Commodity Futures
262
21_287224-ch14.qxp 5/27/08 11:01 PM Page 262
Getting a handle on the Fed
You must maintain a continued awareness of when the Fed’s board of
governors and open market committee are meeting.
Nothing happens to interest rates without the Fed getting into the game. So
you have to keep an eye on the central bank to watch for clues about whether
the Fed is happy with current rates. Remember, the Fed, by design, is paranoid
about inflation, and the central banks, as members of the Fed, can control gold
prices, thus making the markets wonder about inflation. However, the Fed and
the central banks can’t sweep rising housing and commodity prices under the
rug, so they have to do something about them.
In early 2005, the Fed was getting annoyed with the housing market. Fed
Chairman Alan Greenspan had described regional bubbles in selected mar-
kets and expressed mixed feelings about them. In July, Greenspan pointed to
“signs of froth in some local markets where home prices seem to have risen
to unsustainable levels.”
The Fed’s governors like to make speeches or leak key concepts to the press.
And that’s clearly what happened in 2005 just before the employment report
was to be released August 6, 2005.
On August 3, 2005 (a Wednesday), Greg Ip, a reporter for The Wall Street
Journal with a pretty good pipeline into the Fed, wrote: “As the Federal
Reserve prepares to raise short-term interest rates again next week, officials
there increasingly believe the bond market, which sets long-term rates, is
diluting their efforts to tighten credit and contain inflation.” And it got even
scarier: “Some policy makers worry that bond yields are being kept in check
by overly complacent investor sentiment, which could rapidly dissipate,
pushing up mortgage rates and shaking the housing market. Indeed, some
Fed officials see similarities between the attitudes of bond investors today
and of stock investors in the late 1990s.”
As the subprime mortgage crisis unfolded in 2007, the Federal Reserve was
reluctant to predict a recession, but it was talking about a “significant” slow-
ing in the growth rate of the U.S. economy. The Fed was also concerned about
the inflationary effects of having had to ease interest rates and increase the
liquidity available to banks due to the slowing in the housing sector. In fact,
at the time the Federal Reserve was in a box. It knew it could cause an infla-
tionary spiral by lowering interest rates, but it also knew if it didn’t it could
cause a recession.
When the Fed is in a box, you want to watch the U.S. dollar and the gold mar-
kets. In 2007, it paid off quite well because the dollar fell, and gold rallied,
giving you and me two good opportunities. One was to short the dollar, and
the other was to go long on gold.
263
Chapter 14: Getting Metallic Without Getting Heavy
21_287224-ch14.qxp 5/27/08 11:01 PM Page 263
Pulling it together
After you determine the long-term trend and check for potential land mines
(such as the Fed clearly telling the markets that interest rates are going way
up and for a long time), you need to core down your technical analysis
toward the short term by doing the following:
Use trend lines, moving averages, and oscillators (see Chapters 7 and 8)
to look for clear and precise entry points above key resistance when
going long and below critical support levels when going short.
Always confirm your trades with at least two technical oscillators, such
as MACD and RSI, before diving in.
Set sell stops or buy-to-cover stops, depending on the direction of your
trade, by referring to moving averages or percentages as your guidelines.
Never lose more than 5 percent on any given trade, and you’ll stay in the
game.
Part IV: Commodity Futures
264
Getting beyond gold and copper
Other metals besides gold and copper trade in
the futures markets. After you master — or at
least become familiar with — the gold and
copper markets, you can try your hand at alu-
minum, zinc, nickel, lead, and tin.
Most of them are more thinly traded than gold
and copper, with the exception of aluminum,
which can be very liquid.
The major influences are similar to the eco-
nomic fundamentals for gold and copper: strikes
and wars, individual metal stocks released reg-
ularly by the exchanges, and inflation.
21_287224-ch14.qxp 5/27/08 11:01 PM Page 264

Chapter 15
Getting to the Meat of the Markets:
Livestock and More
In This Chapter
Cashing in on meat-market supply and demand
Getting an inside look at the cattle and swine markets
Using meat-market technical and fundamental analyses
Knowing which reports to keep an eye out for
Seeing the effects of major reports and outside influences
I
f you’re like I was before I began trading, the first image of futures trading
that comes to mind is something like pork bellies or orange juice. You
probably start chuckling and shake your head, saying, “No way man . . . not
for me . . . no sir.”
Then there’s the Hollywood take on commodities traders. They’re usually
portrayed as not-too-smart, greedy fellows, looking for an edge and a quick
buck.
In the movie Trading Places, Eddie Murphy and Dan Akroyd turn the tables on
two old scoundrels played by Ralph Bellamy and Don Ameche, who are
gaming the orange-juice market with inside information before the release of
the monthly data hits the wires.
Although the movie is entertaining and the two old buggers get what they
deserve, it unfortunately paints a lopsided picture of the futures market. Some
traders in the futures markets might very well seriously consider trading on
insider information. But given the tight surveillance of the markets and the
potential for being caught, finding out just how the markets work and whether
you’re cut out to trade probably is the best route for you to take.
Trading, after all, is a serious business, and the meat markets are basically
about how much you and I have to pay to eat. If you look at it from that
standpoint, you start taking it a bit more seriously.
22_287224-ch15.qxp 5/27/08 11:02 PM Page 265
Part IV: Commodity Futures
266
Meat markets are as much about farmers, producers, and other industry-
related traders using the markets to hedge their bets against potentially
negative outside influences — weather, herds that catch plagues, and even
fad diets like the low-carb craze that took hold in the last decade — as they
are about people like you and me who look at charts and real-time quotes
and try to make money by trading meat.
This chapter is meant to provide a good overview of basic trading strategies
in the meat markets. Some excellent and more in-depth information can be
found at these Web sites:
The Chicago Merchantile Exchange (CME) at
www.cme.com/files/
LivestockFund.pdf
)
Ohio State University at
www-agecon.ag.ohio-state.edu/people/
roe.30/livehome.htm
The best free charting for cattle futures is available from Barchart.com at
www.barchart.com
, which is a good place to start looking at the meat markets
and becoming familiar with the action that takes place before deciding
whether you want to trade in them.
Exploring Meat-Market Supply and
Demand, Cycles, and Seasonality
Like all commodities markets, meat markets are based on supply. However, a
more equitable relationship exists with demand in the meat markets than in
other commodities markets where supply is key. The two major temporal fac-
tors to understand about the meat markets are the longer meat cycle, which
is different for cattle than it is for hogs, and the more reliable — although not
perfect by any means — aspect of seasonality.
The meat market goes through several phases where herds are built up and
subsequently sold. When farmers increase the number of cattle in their
herds, it’s called the accumulation phase, and when they thin the herd for sell-
ing, it’s called the liquidation phase. For hogs, the spectrum starts with expan-
sion and ends with contraction.
The time that passes from accumulation to liquidation and from expansion to
contraction is called the livestock cycle. Historically, the cycle for cattle usu-
ally lasted 10 to 12 years, and for hogs, it usually was around 4 years. The
actual length of the cycle is measured either from one trough, or the low point
in inventory, to the next, or from one peak, or high point in inventory, to the
next. The time that it takes for female swine to reach breeding age has a
direct effect on the hog expansion phase.
22_287224-ch15.qxp 5/27/08 11:02 PM Page 266
Seasonality, on the other hand, can be short term or have more of an intermedi-
ate duration. During summer months, the demand for certain cuts of beef that
can be grilled outside tends to increase. The same is true of the demand for
turkeys at Thanksgiving time. When consumers are flocking to one kind of meat
at specific times, prices can be affected, and the market reacts and adjusts. For
example, some specific times that affect specific meat markets include
January through March: These three months tend to be strong ones for
feeder livestock prices because grain prices tend to be lower during the
same period. Feeder cattle are steers, castrated males, and heifers, or
females that have not calved. These animals weigh anywhere from 600 to
800 pounds when they arrive at the feedlot, with a goal of reaching 1,000
to 1,300 pounds before they’re slaughtered.
April through August: The spring and summer usually are weak months
for feeder prices.
September through December: These four months are a second season
of strength in feeder prices; however, the January through March period
historically has been the stronger of the two periods.
Feeder cattle and oat prices sometimes move before live cattle prices. So reli-
able is this tendency that some traders actually describe this relationship as
“Feeders are the leaders.”
Corn, a mainstay in livestock feed, is increasingly being used in the production
of ethanol to fuel motor vehicles. This trend is a significant pricing component
in both the grain and meat markets. These markets are likely to ebb and flow
accordingly over the next several years, depending on how prevalent ethanol
becomes as a fuel in the United States. In late 2007, ethanol’s popularity was
waning as major infrastructure problems for the industry, as well as the
impact on the environment and the world’s fuel and food supply, was a hot
political topic.
Understanding Your Steak
Here’s a quick-and-dirty overview of the cattle business to get you rolling in
the right direction.
Despite increasingly frequent scares about mad cow disease, the steak that
everyone loves to eat starts off with a cow/calf operation, which in short is a
cattle-breeding business that consists of a plot of land that holds a few bulls,
some kind of feed, and an average of 42 cows, according to government sta-
tistics provided by the United States Department of Agriculture (USDA). The
cow/calf operations are where natural or artificial insemination takes its
course and calves are born.
267
Chapter 15: Getting to the Meat of the Markets: Livestock and More
22_287224-ch15.qxp 5/27/08 11:02 PM Page 267

The breeding process
Producers breed cattle in the late summer or early fall because nine months
are required to birth a calf. Most of the cattle production in the United States
takes place in Kansas, Nebraska, Colorado, Oklahoma, Texas, Iowa,
Minnesota, and Montana. Many of these areas of the country endure tough
winters, so birthing calves in spring gives them a better chance for survival.
Calves spend six months or so with their mothers and then are either
released into the feedlot or undergo backgrounding, a period where smaller
animals catch up in size and weight, essentially a process by which they are
fed until they grow to 600 to 800 pounds, which is considered large enough to
enter the feedlot and become feeder cattle, the beef that humans consume.
Feedlots are where feeder cattle — calves, or steers and heifers — are fat-
tened up. Cattle hotels are commercial feedlots that account for only about 5
percent of all lots that are involved in raising feeder cattle, but they produce
80 percent of the cattle sold. Feedlots sometimes buy cattle for their clientele
or charge farmers a fee to custom feed their stock.
Commercial operations offer farmers convenient services, such as boarding and
feeding cattle, and often serve as middlemen by setting up deals between farm-
ers and slaughterhouses. In other words, commercial operations fatten up
herds and use their industry contacts with packing plants to sell their
client/farmer’s herds. Sometimes commercial operations combine smaller herds
from several farms into one feedlot and then sell them to the slaughterhouses.
Feeder cattle are fed a high-energy diet consisting of grain, protein supple-
ments, and roughage. Putting on weight fast is the idea. The grain portion
these cattle are fed usually is made up of corn, milo, or wheat if the price is
low enough. Usually, the protein supplement includes soybeans, cottonseed,
or linseed meal. The roughage usually is alfalfa hay or even sugar beet pulp,
depending on market prices.
The packing plant
When feedlot animals reach specific weights, they are sold to the packing
plant. The packing plant is where live cattle and hogs are sent to be slaugh-
tered. Packers sell the meat and byproducts, including the hides, bones, and
glands, to different customers, including retailers, such as grocery stores and
manufacturers of clothing and furniture.
Part IV: Commodity Futures
268
22_287224-ch15.qxp 5/27/08 11:02 PM Page 268

The feeder cattle contract
Feeder cattle contracts are made up of feeder cattle, the precursor to live
cattle, and are the province of the feedlot operator. See the previous section,
“The breeding process,” for details about feeder cattle, and the next section
for details on live cattle.
The prices of feeder cattle contracts are dependent on two major raw materi-
als: the number of animals on the feedlot and the price of grain.
Feedlot operators increase the number of animals based on the demand for
feeder cattle, which is dependent on the demand for live cattle. Corn and
other grain prices influence the costs of maintaining an animal on the feedlot.
Cheap grain prices usually correlate well with higher feeder cattle prices
when you trade this contract. Low supplies of grain stocks, on the other
hand, usually lead to weak feeder prices. Here are some of the specifics of
feeder cattle contracts:
Composition: This contract holds 50,000 pounds of feeder cattle, with
specifications calling for a 750-pound steer, such that each contract
holds an average of 60 animals.
Valuation: Prices are quoted in either cents per pound or dollars per
hundredweight.
Settlement: Delivery is cash settled and is based on an index, with the
final price being the price of the index on the contract’s last day.
Price limits: The price limit is equal to the live contract limit, which is
300 points or 3 cents per pound, or $3 per hundredweight, above or
below the closing price for the previous day.
The CME live cattle contract
The main difference between the live cattle contract and the feeder cattle
contract is that the animals in the live cattle contract are ready for slaughter.
Buyers of live cattle usually are meat packers who sell the meat and byprod-
ucts. In general, prices for live cattle tend to rise from January to March, start
falling in April, bottom out in July, and then remain below average until
October.
This shifting of prices results from the pattern of cattle slaughter. According to
USDA data, the number of cattle slaughtered peaks during the period from June
through August, making a second but lower peak in October, and then declining
into February, when the cycle starts rising again until the June/August top.
269
Chapter 15: Getting to the Meat of the Markets: Livestock and More
22_287224-ch15.qxp 5/27/08 11:02 PM Page 269
Live cattle contracts are much like feeder cattle contracts, with the same
daily limits (300 points, 3 cents per pound, or $3 per hundredweight) above
or below the previous day’s close, but each contract consists of 40,000
pounds of slaughter-ready animals.
Beef prices are susceptible to mad cow disease and other health-related
stories — such as being linked to cancer and heart disease — as well as
product recalls due to bacterial contamination. Other issues that occasionally
appear in the press with regard to the meat market include the use of illegal
immigrants as part of the workforce in meat processing plants and farms.
These stories can remain in the headlines for several days or weeks. During
those periods, avoiding the beef market is often the best alternative for inex-
perienced traders. The flip side is that those kinds of stories can also provide
trading opportunities. As you understand more about trading these markets,
you can adjust your tactics to accommodate these instances.
Understanding Your Pork Chop
The hog market is similar in many ways to the cattle market, but it has some
important distinctions:
Pork demand rises in spring because of Easter and in winter because of
the holiday season.
Hog prices tend to rise in January and peak in May and June, rolling over
in July and falling into fall and the holiday season.
During the period of rising hog prices, the number of slaughters
decreases.
Living a hog’s life
Similar to cattle, hogs being raised for the market go through significant
stages that traders need to track. The two basic stages are pre-slaughter and
post-slaughter. The pre-slaughter stage is known as the farrow-to-finish opera-
tion, which encompasses the entire process from breeding and rearing a hog
to slaughter because the hog stays on the same farm from birth to finish.
When hogs reach 220 to 240 pounds, which takes about six months, they’re
sent to market. Unlike beef, a significant amount of pork is processed into
smoked, canned, or frozen ham.
Part IV: Commodity Futures
270
22_287224-ch15.qxp 5/27/08 11:02 PM Page 270
Pork bellies
As a frustrated baseball announcer, I love a good slice of bacon, so I thought
I’d do the next best thing by shouting out the title of this section as if it were
Sammy Sosa striding up to the plate.
Pork bellies, though, are not a laughing matter. Indeed, they are the part of
the hog from which bacon is derived. Hogs are cash settled, based on a
USDA-calculated index.
Here are the basics of what you need to know about pork-belly contracts:
Contracts: Pork-belly contracts are traded in lots of 40,000 pounds,
compared with 40,000 pounds for the live-hog contract.
Valuation: When trading hogs and pork bellies, a 1-cent move in hogs
is worth plus or minus $400 per contract, while a 1-cent move in pork
bellies is worth $400 per contract.
Market makeup: Speculators make up 85 percent of the trading volume
in pork bellies.
Pork bellies are among the most treacherous of futures contracts. The combi-
nation of a big move with just a penny’s movement in the price and the
volatile nature of the contract in general make the pork-belly contract one
that you need to be extremely careful about when you trade it.
Matching Technicals with Fundamentals
If you’re a livestock producer, you have to be thinking about hedging tech-
niques because you have real cattle that you must deliver to the market at
some point. Thus, futures markets offer you a great opportunity to reduce
your risk, and fundamentals combined with technical analysis can help you
set up your hedging trades.
Figure 15-1 shows a fairly classic six-month chart for feeder cattle prices.
Note how prices rallied in the early part of the year and started to roll over
during the summer months.
As a speculator, you want to understand the market from a hedger’s point of
view, but you need to focus on these keys to the cattle market:
Understanding the seasonal cycle: Livestock prices tend to be cyclical
in nature, but more important, you want to confirm that the cycle is
working the way it usually does. In the case of the chart in Figure 15-1,
you’d be correct in playing the long side of the market during the early
part of the year.
271
Chapter 15: Getting to the Meat of the Markets: Livestock and More
22_287224-ch15.qxp 5/27/08 11:02 PM Page 271
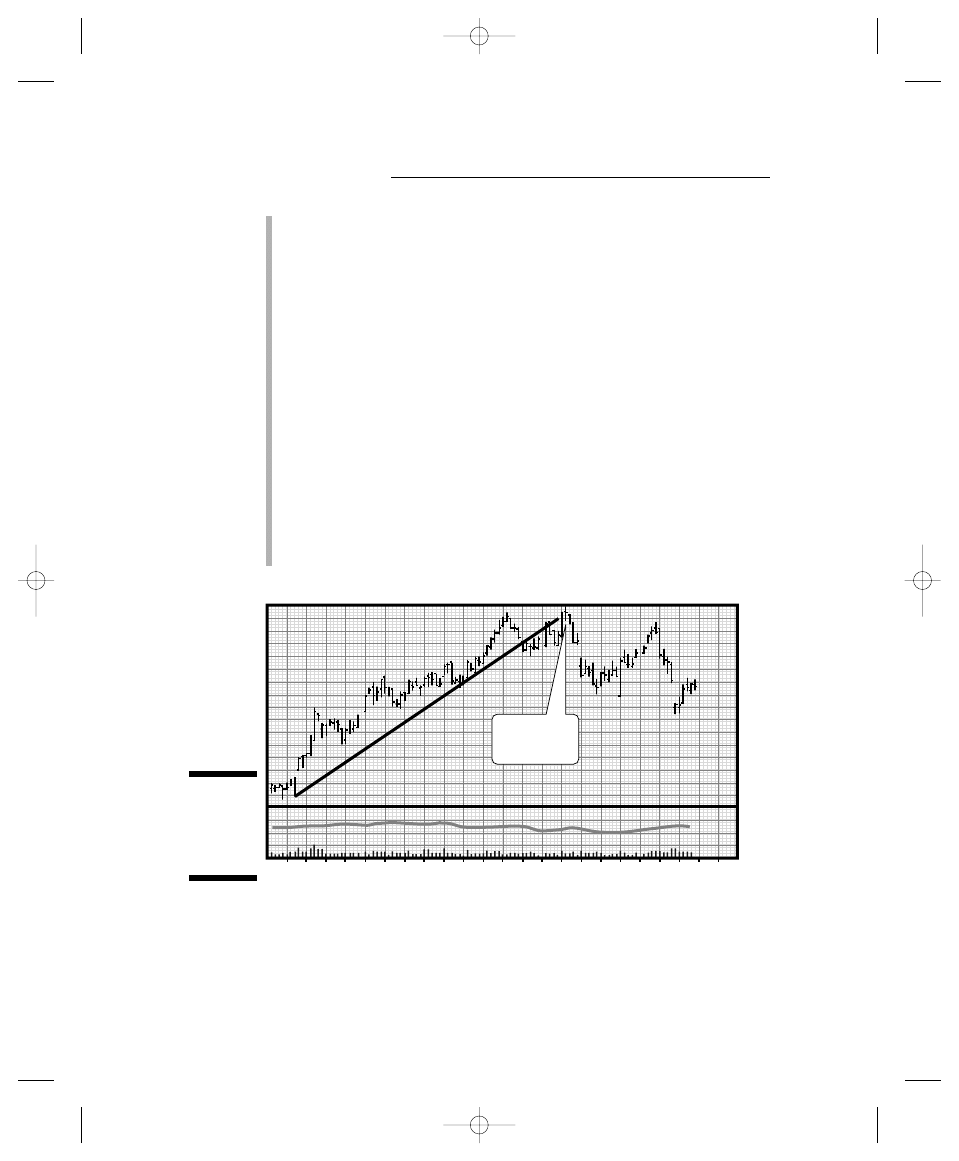
Using technical analysis: You’re not out on the farm, so you must trust
the price action. Trend lines, moving averages, and oscillators are useful
in trending markets, such as the one shown in Figure 15-1. See Chapter 7
for a full overview of technical analysis.
Keeping your strategies fluid: As with other contracts, you need to keep
up with government reports that are scheduled for release and hedge
your regular positions by buying options or by selling futures contracts
if you’re long.
Following your trading rules: If you set a sell stop or a buy-to-cover
stop on a short position, don’t change it other than to keep ratcheting it
up or down as your position becomes more profitable. And when your
rules say the time is right, don’t hesitate to take those profits.
If you get stopped out, you either saved yourself a lot of trouble or didn’t
give yourself enough room. That dilemma is easily remedied. Go back and
check the usual price range of the commodity for the specific time frame in
which you’re trading. If you’re trading 15-minute bars and the commodity
tends to move one to two ticks during that period, then set your stop just
outside of or close to the normal movement. That way, if you get stopped
out, it was because of an abnormal movement by the market against your
position, and you’ve likely saved yourself from an even bigger loss.
Match seasonal
tendencies with
technical analysis
28
FEB-05
MAR
APR
MAY
JUN
JUL
AUG
114
112
110
108
106
104
102
100
98
Cntrcts
20000
0
14
28
11
25
9
23
6
20
4
18
1
Figure 15-1:
Feeder
cattle
futures for
August 2005.
Part IV: Commodity Futures
272
22_287224-ch15.qxp 5/27/08 11:02 PM Page 272

Watching for the Major
Meat-Market Reports
As with virtually all other commodities markets, given their connection to
supply and demand, meat-market traders need to keep an eye on their own
distinct set of key reports. The CME and your broker have calendars that
warn you when these key reports are going to be released. You need to take
seriously the reports I describe in the sections that follow because they’re
the most important inside influence on prices. Many times the information in
one of them is enough to change the overall trend of the particular market for
extended periods.
Of course, some reports are more important than others, but you’re asking
for trouble if you either have an open position or you’re trying to set one up
without knowing what to expect when one of these potential bombshells hits
the street.
Counting cattle
Released every month by the USDA’s National Agricultural Statistics Service
(NASS), the Cattle-on-Feed Report usually moves the market and is made up
of these three parts:
Cattle on feed: This part of the report focuses on the actual number of
cattle in the feedlots.
Placements: This part of the report focuses on the number of new ani-
mals placed into feedlots during the previous month. This number is an
important predictor of future supply, because an animal placed in a feed-
lot can be market-ready in 120 to 160 days.
Marketings: This part of the report focuses on the number of animals
taken out of the feedlots. This number is a hazier piece of data because
it can be affected by an individual operator’s feeding methods and
particular animal-specific idiosyncrasies.
For example, depending on demand and how well a particular animal
grows, feedlot operators can vary their marketings from month to month.
273
Chapter 15: Getting to the Meat of the Markets: Livestock and More
22_287224-ch15.qxp 5/27/08 11:02 PM Page 273
Posting pig-related data
The Hogs and Pigs Survey, which is released quarterly by NASS, reports pig
crop data from 16 major hog-producing states and is the most important
report for the hog and pork-belly markets. Information in it can lead to limit
moves that can last for several days whenever surprises are reported.
This report definitely is a market mover, but it can be wrong — although you
won’t be able to verify whether it’s right or wrong for six months or so.
Here are the nuts and bolts of the Hogs and Pigs Survey:
Total numbers of pigs: This figure is the pig crop, and it shows where
the market volume is at the time the report is released.
Breeding herd numbers: This figure tells you the total number of hogs
not sent to slaughter that are to be kept for breeding purposes.
Farrowing intentions: This number provides an indication of breeding
levels expected in the future.
Market hogs: This number is the portion of the report that gives you the
number of hogs that are being taken to market.
Other meat-market reports to watch
If you want your research to be complete, take note of these reports:
Cattle Inventory Report: This report is released in January and July and
provides the number of mature animals and the number of calves in the
annual crop.
Cold Storage Report: This report is a monthly release that tells you how
much meat is stored in the freezers, including beef, chicken, and pork. It
usually moves the pork-belly markets more than anything else.
Out of Town Report: This report is released after the markets close
every Tuesday and, like the Cold Storage Report, is aimed mostly at
pork-belly traders. It measures whether pork bellies were put into freezers
or taken out of storage. Rising numbers of bellies going into freezers is
bearish. Falling numbers of bellies in storage is bullish.
Daily Slaughter Levels: This report measures the daily activity of meat
packers.
Part IV: Commodity Futures
274
22_287224-ch15.qxp 5/27/08 11:02 PM Page 274

Interpreting Key Report Data
Reports in March and June 2005 affected the ebb and flow of the August 2005
pork-belly contract by starting a recovery in the market and pointing to two
trading opportunities you can use to catch this kind of market bottom.
Figure 15-2 shows the pork-belly contract for August 2005 and how it broke
above the first trend line and marked a trading bottom and how a second
trend line marked a break in the downtrend. The first break in the market
occurred soon after the release of the March Cold Storage Report from the
USDA,
usda.mannlib.cornell.edu/reports/nassr/other/pcs-bb/
2005/
, which contained the following line:
“Total red meat supplies in freezers were down 1 percent from last
month, but up 4 percent from last year. Frozen pork supplies were up 9
percent from last month and up 14 percent from the previous year. Stocks
of pork bellies were up 19 percent from last month and up 32 percent
from last year.”
This reported glut of pork was not worked off until June when the govern-
ment’s Cold Storage Report indicated:
“Frozen pork supplies were down 9 percent from May, but up 24 percent
from the previous year. Stocks of pork bellies were down 9 percent from
last month, but up 97 percent from last year.”
By July:
“Frozen pork supplies were down 4 percent from last month, but up 32
percent from the previous year. Stocks of pork bellies were down 14 per-
cent from last month, but up 90 percent from last year.”
That was three months of sequential decreases in the amount of pork in stor-
age, which was good enough for the market to make a bottom. The chart in
Figure 15-2 clearly shows how a series of reports can influence the sensible,
supply-and-demand driven pork-belly market.
Notice the following key technical developments on the charts in Figure 15-2:
Open interest (line on bottom of chart above volume bars) rose as selling
accelerated, which is a bearish sign because it shows more people are
selling.
Open interest declined as the pork-belly contract started to bottom,
which is bullish because it shows selling is losing strength.
275
Chapter 15: Getting to the Meat of the Markets: Livestock and More
22_287224-ch15.qxp 5/27/08 11:02 PM Page 275
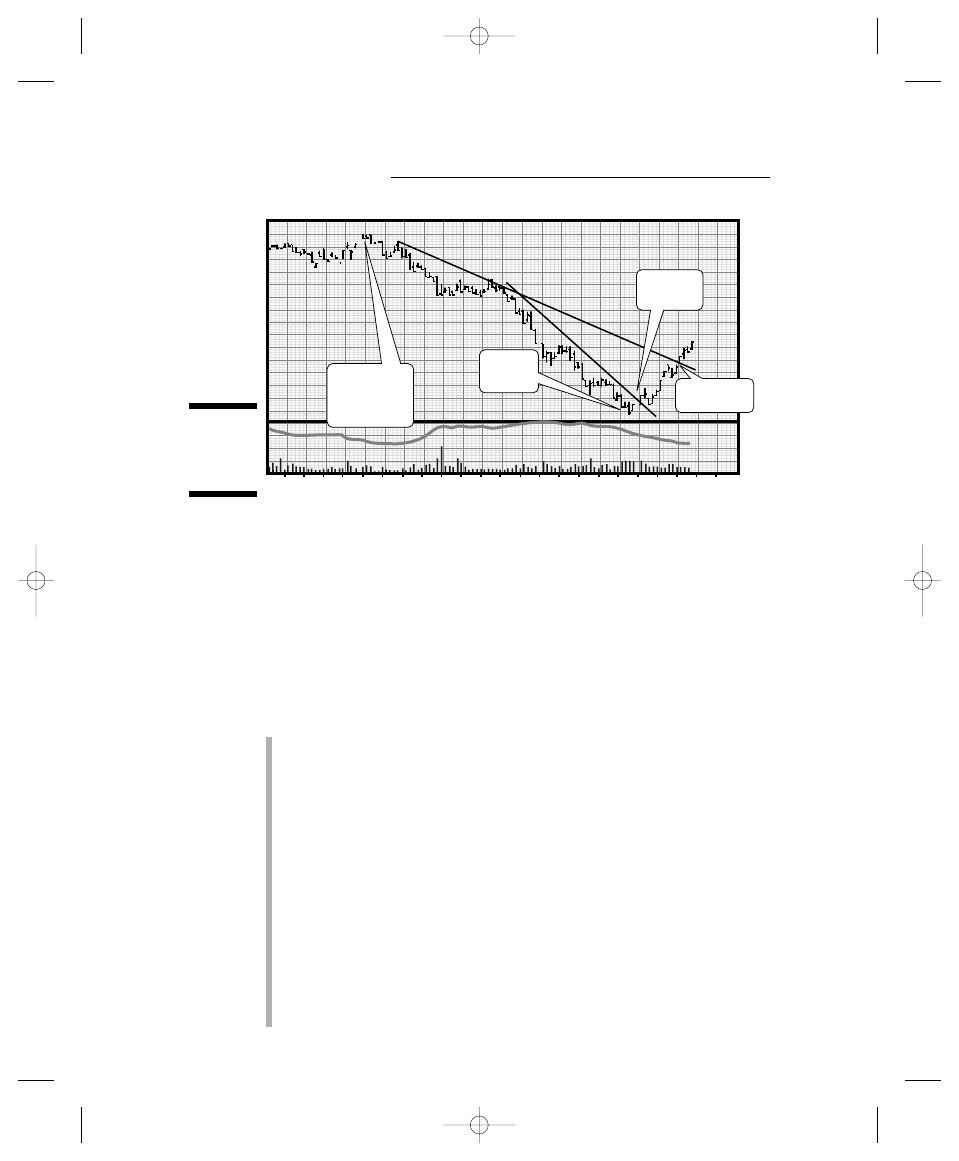
Outside Influences that
Affect Meat Prices
An important set of background factors can affect meat prices. Some are short-
term influences, but others have been in the pipeline for some time and can
suddenly be felt when a certain catalyst hits the news, such as an article that
shows that beef is not as healthy for consumption as it was thought to be.
Some longer-term and softer influences on meat prices are
Population changes: If a demographic shift occurs in which more children
are born, more baby food will be sold, which tends to be more vegetable
based.
Income changes: The overall economy affects the kinds of food people
buy and whether they will go out to a restaurant and order higher-priced
items, such as steaks.
Prices of substitutes: Higher beef and pork prices are likely to lead to
increased use of chicken; that is, until the price of chicken gets too high
and the potential for a shift back to pork and beef increases.
Prices of complements: With a sudden increase in the price of barbecue
sauce, you can see a decreased demand for beef or pork.
Changing consumer tastes: This anomaly can be described as the classic
Atkins diet effect. Pork, beef, and chicken prices rose when the low-carb
craze swept the United States. If a soybean-based diet was to catch on in
the same way, you’d likely see a similar phenomenon in soybean prices,
while you’d likely see the reverse in meat prices.
28
FEB-05
MAR
APR
MAY
JUN
JUL
AUG
95
90
85
80
75
70
65
98
Cntrcts
2000
0
14
28
11
25
9
23
6
20
4
18
1
Belly glut
improving
Cold storage
report shows
huge rise in
bellies
Down trend
broken
Trading
bottom
Figure 15-2:
Pork bellies
respond to
key reports.
Part IV: Commodity Futures
276
22_287224-ch15.qxp 5/27/08 11:02 PM Page 276
Some shorter-term but more constant influences on meat prices are
Weather: A tough winter can lead to big animal losses, which, in turn,
can affect supply for extended periods of time. Cold winters also tend to
make animals eat more but gain less weight. So even if no animal deaths
occur, the time to market can be delayed because producers need more
time to fatten up animals, in effect delaying their time to market. A glut
in the market can then result at a later time, lowering prices after the ini-
tial rise caused by the short-term shortage.
Grain prices: Generally speaking, high feed prices result in liquidation,
and low feed prices result in accumulation. The liquidation/accumulation
ratio also is affected by the kind of prices producers get for their finished
products. If meat prices are high, producers can spend more money on
feed and pass along the added price.
A forced liquidation, a period where large numbers of animals are sent to
market because of droughts or periods of high feed prices, can lead to a
longer-term boom in prices. For example, in 1996, all-time high prices in corn
led to forced liquidation of both corn stores and herds. Cattle prices fell, only
to rebound strongly after the excess supply was taken off the market.
277
Chapter 15: Getting to the Meat of the Markets: Livestock and More
22_287224-ch15.qxp 5/27/08 11:02 PM Page 277

Part IV: Commodity Futures
278
22_287224-ch15.qxp 5/27/08 11:02 PM Page 278
Chapter 16
The Bumpy Truth About
Agricultural Markets
In This Chapter
Steering clear of bad trades
Cycling through seasonal crop fluctuations
Keeping track of grains and beans
Understanding other commodity softs
T
he agricultural markets have staged a resurgence over the last few years,
as the use of corn for the manufacture of ethanol has led to price increases
and political controversy over the grain’s role in global agriculture. As with
most booms, there will eventually be a bust, and the heady gains of the recent
past will meet with significant price declines. Still, good trading means that you
go with the trend, and because what goes up must come down, when the boom
busts, you are likely to get good opportunities to trade these markets on the
short side.
During the first 70 years of futures trading, agriculture was dominant given its
Japanese origin in the rice markets. However, in the 1980s and 1990s, as the
stock market captured the public’s imagination, these markets became the
province of insiders, such as grain producers, farmers, and professionals.
Obviously, things have changed as corn trading patterns have recently
shown. There are some key factors that are likely to keep these markets near
the headlines for a significant portion of the future:
Weather patterns and climate change continue to add volatility and inten-
sity to the grain markets. and Politics center on environmental concerns
as well as the use of crops for food or fuel, while are also an important
influence.
Fossil-fuel prices are also increasingly influential as they raise the cost of
grain production, transportation of grains to markets, and the choices
consumers make in their food purchases.
23_287224-ch16.qxp 5/27/08 11:02 PM Page 279

For entry-level futures traders, the most important agricultural contracts are
the corn and soybean contracts. They are the most actively traded and quoted
agriculture contracts, so I devote much of this chapter to them.
After you gain a basic understanding of the concepts of seasonality and crop
cycles and how external factors influence them, adapting to other contracts
becomes relatively easy. In addition to the two major grain contracts, I also
briefly touch on coffee, sugar, and lumbers futures in this chapter.
Staying Out of Trouble
Down on the Farm
From a real-world economic standpoint, futures contracts in the agricultural
markets are important. However, they’re not for the fainthearted because of
their volatility, the thinness of trading that sometimes accompanies them,
and the dependence of prices on the influence of the weather.
Indeed, trading grains and softs can be very challenging, especially during
periods of volatile weather. If recent history is any indication, this will
become a rule more than an exception, especially during hurricane season.
Softs, by the way, is the name given to a group of commodities that includes
cocoa, sugar, cotton, orange juice, and lumber. Here are some characteristics
of trading grains and softs that you need to know to stay out of the doghouse
and the poorhouse:
Thinly traded contracts: Grain contracts and softs are not traded as
much as stock-index or financial contracts, which leaves traders open to
the effects of decreased liquidity. Liquidity is an important term referring
to the availability of money in the markets. Decreased liquidity, in turn,
can lead to wide price swings in short periods of time, which make trad-
ing difficult. See Chapters 7 and 8 for information on technical analysis
and details on trading gaps.
Low liquidity: A lack of cash in these markets can lead to lots of chart
gaps and limit moves.
Before you trade any agricultural futures, you need a refined understanding of
the fundamentals of the particular sector and market in which you’re trading.
For example, at the very least, you need to know about growing and harvesting
seasons, geopolitical risks in the growing area, and how the weather affects the
crop. In other words, these contracts are better left for serious and experienced
traders because they’re more adept at collecting information, putting it in the
proper context, and managing risk. I’m not saying that you shouldn’t trade these
markets. I’m just saying that they’re not the best ones to start with. As you gain
more experience with the general aspects of futures trading, you’ll be able to do
more in these areas.
Part IV: Commodity Futures
280
23_287224-ch16.qxp 5/27/08 11:02 PM Page 280
Corn, soybeans, and other agricultural futures are excellent contracts to
allow someone else to trade for you, either through a commodity fund that
specializes in these markets or an advisor with a good record who knows
what he’s doing.
Consider trading commodities through an exchange-traded fund (ETF). I like
the PowerSharesDB Commodity Index Tracking Fund (DBC). It isn’t a perfect
way to trade the grains, but it does include corn and wheat as part of the com-
ponents. The ETF buys futures and U.S. Treasury bills and tracks the Deutsche
Bank Commodity index. Other index components include oil, heating oil, gold,
and aluminum. For a more direct way to trade grains through ETFs, you can
use the PowerShares DB Agricultural Fund (DBA). I go into more detail on using
ETFs to trade commodities and futures in Chapter 5.
Agriculture 101: Getting a Handle
on the Crop Year
You need to know what the crop year is to be able to understand grain trading.
The crop year is the time from one crop to the next. It starts with planting and
ends with harvesting. During that time, crops are going through what the U.S.
Department of Agriculture and Joint Agricultural Weather facility call the mois-
ture- and temperature-dependent stages of development.
What happens between planting and harvest tends to affect the prices of the
crops the most. For example, the weather is a major factor. Drought, flooding, and
freezing are the major events. Other external events, such as shipping problems,
can also affect delivery at key times, such as when Hurricane Katrina hit the port
of New Orleans, from which much of the Midwest’s grain makes its way out of the
United States.
Think of the supply of grain brought to market as a rationed situation. By that
I mean that although grains are used year round, most of them are replen-
ished only one time during the year. As a result, prices are affected by a com-
bination of current supplies and future supply expectations. The way a grain
market perceives future and current supplies and the way that traders pre-
dict the effect of internal and external factors on prices is a major set of vari-
ables to consider. In other words, in all markets there is a certain fudge
factor, or an intangible influence on prices.
Think of it along these terms. In futures markets, as in all markets, perception
is as much a part of pricing as reality. The markets are efficient, and that means
they react to the information that they have available instantaneously, which
leads to short-term price volatility. As with the hog and pig report I discuss in
Chapter 15, data in a single quarterly report may be significantly off the mark
as slaughter approaches, and thus the reality in any market, grains and softs
281
Chapter 16: The Bumpy Truth About Agricultural Markets
23_287224-ch16.qxp 5/27/08 11:02 PM Page 281
included, can be different than the original report indicates. So you need to
know that markets can retrace major moves as better information becomes
available.
As with most other commodities, trading in corn and soybeans is all about
supply.
Except during times of extraordinary circumstances, such as dietary fads or
major external, political, climactic, or geological events, demand stays within
a fairly predictable range. Under normal circumstances, demand fluctuates
within certain bands based on the number of people and animals to be fed at
any given time. Consequently, the market focuses on anything that affects
how much grain will be available to feed them from year to year.
That doesn’t mean that demand isn’t important. For example, the markets are
used to a certain amount of demand for soybeans from China every year;
however, if China’s weather changes dramatically and its domestic crop suf-
fers, global demand for soybeans will increase, thus having a direct effect on
the markets. Assuming that U.S. supply remains stable in a year that China’s
weather changes, you’re likely to have an increase in prices caused by the
increased demand.
Likewise, if the supply of soybeans is decreased because of a crop plague in
the United States — which supplies most of the world’s soybeans — and
global demand remains the same, prices are likely to rise.
The situation is similar in virtually all markets; changes in supply tend to
affect prices more strongly than changes in demand. See Chapter 13 for more
details about how supply rules the markets.
In general, high levels of current supplies and/or expectations of high supply
levels in the future usually lead to lower prices. Conversely, low levels of current
supplies and/or expectations of future shortages usually lead to higher
prices.
Weathering the highs and lows of weather
Weather has the greatest influence on crops, and significant weather develop-
ments affect crop markets. Globally, weather is important in grain and seed
markets. Some basic points to keep in mind about the weather include
Spring weather in the United States (or anywhere for that matter) affects
planting season. Too much rain can delay planting.
Summer weather affects crop development. Crops need rain to develop
appropriately. Droughts play havoc with crop development.
Part IV: Commodity Futures
282
23_287224-ch16.qxp 5/27/08 11:02 PM Page 282
During the North American winter, agricultural market watchers and
traders concentrate on the weather in South America because it’s summer
there. Likewise, dormant winter wheat in North America needs enough
snowfall to protect the crop from winterkill, or freezing because not
enough snow is on the ground to insulate the crop.
A wet harvest can cause delays and decrease crop yields.
All these factors can raise prices.
The U.S. Department of Agriculture (USDA) Weather Bulletin,
www.usda.
gov/oce/waob/jawf/wwcb.html
, is an excellent resource for information
about weather trends and potential developments. You can subscribe to the
report for $60 per year. The USDA releases it on Wednesdays. Subscribing to
these reports may not be worthwhile unless you’re a farmer who’s looking
into the small details. As a trader, especially one using charts, you’ll be react-
ing to the market’s response anyway.
Weather markets, or periods when crops are being affected by droughts,
floods, or freezing temperatures, create possibly the most volatile types of
markets, and they’re risky to boot. Droughts or unusual snowfall or rainfall
patterns are among the more common events that trigger weather markets.
Looking for Goldilocks: The key
stages of grain development
Prices for grain and soybean futures can move significantly during three key
time frames when seasonal and logistical expectations are the result of the
cultivation and growing cycles. At these three times of year, weather condi-
tions mustn’t be too hot, too cold, too dry, or too wet. Like Goldilocks and
her porridge, conditions have to be “just right” during
Planting season: When it’s time to plant, rainfall is the major influence.
Too much rain means a late planting season that can lead to smaller,
lower-quality crops, which in turn can lead to higher prices. A wet planting
season offers traders an opportunity to trade on the long side.
Pollination or growing season: Rain and heat are the keys when seeds
are pollinating and growing. Too much heat and too little rain lead to
lower levels of pollination, which again can lead to smaller crops. Cold
temperatures and too much water can have the same effect.
Maturation and harvest season: When plants are maturing and harvest
is near, too much heat and too much rain can mean poor crops from
difficult field conditions and the spread of fungus among crops.
283
Chapter 16: The Bumpy Truth About Agricultural Markets
23_287224-ch16.qxp 5/27/08 11:02 PM Page 283

Cataloging Grains and Beans
The grain complex has multiple components, including soybeans, soybean
meal, soybean oil, Canola, palm oil, corn, oats, and wheat. I concentrate on
the soybean and corn markets because they’re the most heavily traded and
offer the best opportunity for small accounts and beginning traders. However,
you can apply what you find out about these grains and how these markets
work to develop an understanding of other grain markets and to set up
strategies.
One caveat is that individual markets have their own subtle sets of parame-
ters, and you’ll have to figure them out as you expand your trading horizons.
The soybean complex
The soybean complex is made up of three separate futures contracts for deliv-
ery of soybeans, soybean meal, and soybean oil. Soybeans are legumes, not
grains, but they’re traded and cataloged as part of the grain complex. Don’t
let this weird stuff confuse you. Markets and traders are efficient, and they
look for convenience. Besides, can you imagine somebody on TV talking
about legume futures? Egads!
Until 2004, the United States was the largest soybean producer with about a
50 percent market share. Until 1980, the United States held an 80 percent
share, but the Carter administration’s grain embargo, a political maneuver in
1980 that was designed to protest the Russian invasion of Afghanistan, cost
the U.S. farming industry dearly.
Currently, South America produces most of the other half of the world’s soy-
beans, with China making up the rest.
Soybeans are the protein source used most by humans and animals around
the world. The primary uses of soybeans are for meal for animal feed and oil
for human consumption.
Soybean contracts
The soybean contract trades on the Chicago Board of Trade (CBOT). Here are
the particulars of a soybean contract:
Contract: A contract is 5,000 bushels, and prices for soybeans are
quoted in dollars and cents per bushel.
Valuation: A 1-cent move in the price of soybeans is worth $50 per contract,
with daily price movements shifting as much as 50 cents per day.
Part IV: Commodity Futures
284
23_287224-ch16.qxp 5/27/08 11:02 PM Page 284
Limits: Trading limits in soybeans are variable based on prevailing
market conditions. As of April 2008, the limit was 50 cents per day
($2,500 per contract) with no limits in the spot month.
Margins: As of April 2008, the initial speculative margin requirement was
$5,400 per contract, and the maintenance margin requirement was $4,000
per contract.
Soybean meal contracts
Soybean meal (what’s left after the extraction of oil from soybeans) can be
fed to cattle, hogs, and poultry. A 60-pound bushel of soybeans yields 48
pounds of meal. Forty percent of U.S. meal production is exported. The rest is
used domestically. Here are the particulars of the soybean meal contract:
Contract: A soybean meal contract is 100 short tons (200,000 pounds),
with a (short) ton equal to 2,000 pounds. Prices are quoted in dollars
and cents per ton.
Valuation: A $1 move in the per-ton price of soybean meal is worth $100
per contract.
Limits: Price movements are limited to $20 per day, which is also variable,
again depending on market conditions. If the market closes at the limit,
the limit is raised for the next three days to accommodate traders.
Although this tactic may seem a bit strange, remember that the role of the
futures markets, especially in key commodities such as grains, is to enable
commerce to take place — capitalism at its finest. If market conditions are
such that limits need to be expanded, the exchanges are more than happy
to accommodate the markets.
Margins: As of April 2008, the initial margin requirement was $2,700, and
the maintenance margin was $2,000.
Soybean oil contracts
Soybean oil is the third major soybean product for which futures contracts
are bought and sold. A bushel of soybeans produces 11 pounds of oil, and
soybean oil competes with olive oil and other edible oils. Soybean oil is
extracted by a multistep process that involves steaming, pressing, and perco-
lating (similar to brewing coffee) the beans. If you’re really into how soybean
oil is extracted, plenty of background info can be found on the Internet. Have
at it! Here are the basics of what you need to know:
Contract: A soybean oil contract is 60,000 pounds. Prices are quoted in
cents per pounds.
Valuation: Be careful trading soybean oil. A 1-cent move is equal to 100
points, which is worth $600 per contract.
285
Chapter 16: The Bumpy Truth About Agricultural Markets
23_287224-ch16.qxp 5/27/08 11:02 PM Page 285
Limits: Trading limits are set at 1 cent, but they can be adjusted because
soybean trading can be very volatile due to the weather and other exter-
nal factors. Thus, trading limits are variable, meaning that they can be
changed if prices continue to be very volatile over a period of time. See
Chapter 3 for more about trading limits.
Margins: As of April 2008, the initial margin requirement was $2,025, and
the maintenance margin requirement was $1,500.
Getting corny
Corn is the most active commodity among grain contracts, and it is the major
crop grown in the United States. American farmers grow about 50 percent of
the world’s corn supply, and 70 percent of U.S. production is consumed
domestically.
Corn futures are known as feed corn, or corn that’s fed to livestock — not the
same stuff that you and I eat at summer picnics or find behind the Jolly Green
Giant label. Here are the particulars of corn futures:
Contract: A contract holds 5,000 bushels, and a 1/4-cent move is worth
$12.50 per contract. Prices are quoted in cents and
1
⁄
4
cents.
Limits: The daily limit is 20 cents, or $1,000. There are no limits in the
spot month.
Margins: As of April 2008, the initial margin requirement for speculators
was $2,025 per contract, and the maintenance margin requirement was
$1,500 per contract.
The CBOT’s Web site (
www.cbot.com
) can provide you with a great deal of
useful background information, charts, and even trade summaries. I highly
recommend a good review of the data there.
Culling Some Good Fundamental Data
Although charts are the most useful tools for trading futures, getting a grip
on the fundamental expectations of price movements in the particular con-
tract you’re trading is important. The fundamentals, of course, are back-
ground information, and you need to be aware that even the best guesses can
be wrong. The key is to gauge what the expectations are for the market and
then find out what prices actually do.
Part IV: Commodity Futures
286
23_287224-ch16.qxp 5/27/08 11:02 PM Page 286
Getting a handle on the reports
You can find plenty of good fundamental information at the USDA’s Web site
at
www.usda.gov
. Here is a good sequence of data and market factors to keep
in mind for getting a handle on a market’s supply and demand:
Beginning stocks: The beginning stock is the amount of grain that’s left
over from the previous year, as reported by the government.
Production: Production is the estimated amount of a crop that will be
harvested during the current year.
Weekly Weather and Crop Report: The USDA releases a weekly Crop
Progress Report that updates the crop and weather conditions. This
report usually is released on Wednesday. See the earlier section,
“Weathering the highs and lows of weather,” for data included in this key
report.
Import data: The United States is a grain exporter, so this data rarely is
significant. If that ever changes — permanently or temporarily, the
markets will let everyone know.
Total supply: The total supply is the sum of beginning stocks, production,
and imports.
Crush: (No, I’m not talking about your favorite orange or grape soda —
although a grape soda would taste great right about now.) Crush refers
to the amount of demand being exhibited by crushers, or businesses that
buy raw soybeans and make them into meal and oil.
Exports: Two export reports are released each week. They are
• Export inspections — released on Monday after the market closes
• Export sales — released on Thursday before the market opens
Currency trends: Trends in the currency markets, especially those of
the dollar, can affect export reports.
Seeds and residual: Usually 3 to 4 percent of the crop is held for seeding
the next year’s crop. Seeds are important because they’re the next season’s
planting stock. Residuals are the portions of soybean oil that are not used
in food-related processes. Soybean oil also is used as an additive in pesti-
cides and has biochemical uses, including medications. It’s also used as
grain spray to prevent dust from settling on stored crops.
Total demand: Total demand is the sum of exports, seeds, crush, and the
residual figure.
Ending carryover stock: Ending carryover stock is a big number that
tends to move the markets. It’s the total supply minus total demand.
287
Chapter 16: The Bumpy Truth About Agricultural Markets
23_287224-ch16.qxp 5/27/08 11:02 PM Page 287
Don’t forget the Deliverable
Stocks of Grain report
The Deliverable Stocks of Grain report is an interesting report that merits its
own section. Every Tuesday the CBOT tallies the number of bushels of corn,
wheat, soybeans, and oats stored in elevators that are licensed to deliver
grains in relation to trades made on the CBOT.
This report is important because the information contained in it is a good way
to determine whether enough grain is in storage for delivery. If not, the market
experiences a short squeeze because traders with short positions don’t have
any way to make good on their deliveries. They have to buy futures contracts
to make good on their bets. A short squeeze happens when large numbers of
traders have open short positions, or bets that the market will fall. If the
market goes against those short positions, traders have to buy contracts to
prevent their losses from getting worse. When large numbers of short posi-
tions must cover their positions at the same time, the market rallies.
The Deliverable Stocks of Grain report is issued as a Microsoft Excel spread-
sheet and can be found on the CBOT Web site. The best way to use it is to
keep track of deliverable stocks and watch how the data are trending over a
period of time. In fact, you can view several reports and then construct your
own chart on the figures so that the trend becomes visible. Otherwise, you
must rely on the market’s reaction to the release.
Gauging Spring Crop Risks
The risk premium is the influence of future expectations of supply on current
prices, and it’s the basis for price fluctuations in the futures markets. As men-
tioned in the section “Looking for Goldilocks: The key stages of grain devel-
opment,” earlier in this chapter, crops are most vulnerable during planting,
pollination, and harvesting. During these stages, the markets begin to apply a
risk premium to prices. This kind of pricing can be an emotional rather than
rational process, which is why prices can fluctuate wildly on weather reports,
fires, and reports of diseases and insect infestations in the fields.
Corn and soybeans are planted in spring, so they tend to compete for acreage,
which makes the price relationship between the two important. In other words,
how much acreage farmers decide to devote to each crop is a significant
influence on prices.
You need to realize that risk is around every corner during each stage of the
crop year. Any external news event, such as flooding, drought, crop plagues,
late freezes, or even the accidental introduction of a foreign beetle that flour-
ishes as crops emerge, can shake the markets.
Part IV: Commodity Futures
288
23_287224-ch16.qxp 5/27/08 11:02 PM Page 288
A perfect example of crop risk and its effect on the markets was associated
with the rise of orange juice prices in October 2005. Aside from the damage
to Florida orange orchards from Hurricane Wilma, an increase was reported
in canker, a bacterial infection of citrus fruit trees that’s spread by wind. Any
citrus tree within 1,900 feet of an infected tree had to be cut down.
Planting risk premiums tend to be higher than pollination risk premiums
because of the market’s fear that the crop won’t ever be planted. Pollination
risk tends to be less because after the crop is planted, chances are greater
that at least some of the crop will emerge and thus be pollinated. The third
risk comes at harvest time, when traders begin to fear that crops will wither
in the field because of bad weather or other events.
As the market begins pricing in risk premiums, futures contracts in corn and
soybeans tend to rise during the months of March and April because of the
following:
Corn planting starts in late March and usually is completed by late May.
March and April tend to be months during which corn tends to rally.
Soybeans usually are planted in mid-March through May. March and
April can be good rally months for soybeans.
Pollination and harvest risks come into play as the year progresses:
Corn pollinates in late June or early July. June can be a strong month
for corn.
Soybean pollination usually takes place in August. August beans can
experience a small rally.
October and November are harvest months. Rallies during these months
usually are not very profitable, because harvest usually takes place and,
barring truly extraordinary circumstances, supply and demand find a
balance.
During the summer of 1973, the Russians made large purchases of grains.
Supply fear (the fear that planting, pollination, or harvesting won’t be suc-
cessful) truly gripped the market, and the resulting rally was violent, but it
didn’t last long. In the absence of major problems with planting, pollination,
or harvesting, grain prices responded by falling back to their mainstream
trend lines, which is rather simple technical analysis.
During May and June, you need to tailor your trades toward going long in
corn and soybeans; however, after August, you need to be looking to go short
so you can capitalize on the normal trends of the market. The key word is
“looking,” because external factors like the weather can cause the market to
deviate from general seasonal tendencies.
289
Chapter 16: The Bumpy Truth About Agricultural Markets
23_287224-ch16.qxp 5/27/08 11:02 PM Page 289
The bumps, rallies, and valleys of the grain markets are only tendencies.
Before deciding to make a trade, be sure to
Find out from your charts whether the market actually is following
seasonal patterns that have tended to happen in the past. In 2005, trading
was difficult in the corn market, but it was easier in soybeans because
the market tended to trend for longer periods.
Look for evidence that confirms what prices are telling you. In the case
of corn in 2005, open interest started to rise in conjunction with prices,
which is as good a confirmation of a rising trend as there is. Rising open
interest means that more buyers are coming into the market. Compare
the open interest in soybeans with that of corn, and you can see that the
open interest rate for corn actually was flat. Corn contracts had no life in
them at that time.
Agriculture 102: Getting Soft
Coffee, sugar, orange juice, and cocoa are known as the softs. Some call them
the breakfast category of futures. They can deliver some profitable moves if
you take the time to become familiar with the standard stuff that goes on in
the softs markets.
In contrast to grains and beans, much of the action in softs goes on overseas
and often in remote regions of the world, especially in places that from time
to time are politically unstable. As a result, trading the softs can be more
volatile.
Having coffee at the exchange
Coffee trades in the United States and in London, with the United States
trading the largest amount. Coffee is the most active contract at the Inter-
continental Exchange (ICE)/New York Board of Trade.
Coffee is all about supply, and the 2001 International Coffee Agreement (ICA),
a product of the International Coffee Organization, is meant to provide guide-
lines with regard to managing the global coffee supply and to encourage con-
sumption. Like all such agreements, the ICA isn’t foolproof. It can be
circumvented and thus can create controversy in the markets.
Coffee supplies can be affected by smuggling and by quantities of coffee that
are not a part of the quota system and arrangements agreed upon by the ICA.
Prices can fall whenever the market is hit with data or rumors suggesting that
smuggling is on the rise. For general details and news on coffee, visit the ICA’s
Web site at
www.ico.org/
.
Part IV: Commodity Futures
290
23_287224-ch16.qxp 5/27/08 11:02 PM Page 290
Coffee is produced in two classes, Arabica and Robusta, and thus two coffee con-
tracts are traded. These two classes of coffee can trend differently during short
periods of time, but they tend to trade along the same long-term trend line.
Arabica
Arabica beans account for 60 percent of the world’s coffee supply. Arabica is
a cool-temperature, high-altitude crop. Brazil and Columbia combined pro-
duce a third of the world’s Arabica coffee. Costa Rica, Mexico, Guatemala,
Honduras, and El Salvador also are major producers of Arabica, and
Indonesia, Uganda, and Vietnam produce the rest.
Arabica is the more important of the two coffee classes when analyzing the
North American markets. Supply, as is usual with commodities, is the key.
Weather, blights, moves by big retailers, and political events in Africa, Asia,
Brazil, and South America, in general, can cause volatility in the coffee markets.
Robusta
Robusta is a less mild variety of coffee that comes from Africa and Asia.
Robusta trades in London and is most often used as instant coffee because of
its stronger flavor.
Trading coffee
Coffee trading is centered on the New York ICE/New York Board of Trade for
Arabica and the Euronext for Robusta. Euronext consolidated the futures
markets in Belgium, France, The Netherlands, and Portugal. Here are the par-
ticulars for coffee trading:
Contract: The contract size for coffee in New York is 37,500 pounds of
Arabica, and it trades at the ICE/NYBOT. Robusta coffee futures trade at
Euronext. A Robusta contract contains 5 tons of coffee.
Valuation: A 1-cent move is worth $375 per contract for Arabica. The
minimum tick is $1 per ton for Robusta.
Limits: No limits are in place for Robusta.
Trading hours: - Trading hours in New York for Robusta as listed at
ICE/NYBOT are “8:30 a.m. to 12:30 p.m.; pre-open commences at 8:20
a.m.; closing period commences at 12:28 p.m. (electronic trading hours:
1:30 a.m.–3:15 p.m. ET).”
Staying sweet with sugar
Sugar is another breakfast commodity, and it’s another volatile commodity
that is best left for more experienced traders. As with all commodities, you
have to understand the basics of the industry, the key reports that move the
291
Chapter 16: The Bumpy Truth About Agricultural Markets
23_287224-ch16.qxp 5/27/08 11:02 PM Page 291

market, and how to apply technical analysis to trading. Unlike coffee, most
sugar-producing countries produce much of the sugar that they use and then
export the rest.
Cuba, India, Thailand, and Brazil are major sugar cane producers. Russia and
the European Union are the major sugar beet producers. Russia, Europe, the
United States, China, and Japan are the biggest importers, and Cuba,
Australia, Thailand, and Brazil are the biggest exporters.
The two sugar contracts are
#14, which has subsidy-supported sugar.
#11, which has free-market sugar. The free-market sugar contract is the
one to trade. A contract is for 112,000 pounds, and a 1-cent move is
worth $1,120.
Sugar trades on the stock-to-usage ratio, which is the level of supplies
compared to demand. Sugar traders talk about tightness, which means the
state of the supply/demand scenario. A ratio of 20 to 30 percent is low and
usually leads to higher prices.
Traders also watch for candy sales and the price of corn because of competition
from high-fructose corn syrup, which competes with sugar as a commercial
sweetener.
Building a rapport with lumber
Lumber is another so-called soft. Why that is, I can’t tell you. Some traders
think that it’s lumped in with the rest of the softs because another place can’t
be found for it.
Lumber is used in homebuilding, and the price can be volatile. In some cases,
lumber prices peak or trough before housing busts or booms, respectively.
Several months can elapse before a glut or a major shortage finds its way
from the futures markets to the housing industry.
The lumber contract calls for 80,000 board feet (construction grade two by
fours) manufactured in the Pacific Northwest or Canada. Prices are quoted in
dollars and cents per board foot. A $1 movement in price equals $80 in the
contract. Lumber is another thinly traded contract that you can work your
way toward trading as you gain more experience.
Part IV: Commodity Futures
292
23_287224-ch16.qxp 5/27/08 11:02 PM Page 292
Part V
The Trading Plan
24_287224-pp05.qxp 5/27/08 11:02 PM Page 293

In this part . . .
I
n Part V, you’re getting serious — down to brass tacks.
You can’t trade without getting organized, so I show
you how to set realistic goals and expectations, take
inventory of your finances, figure out how to best choose
a broker, develop a trading plan, and work through a
futures trade in real time.
24_287224-pp05.qxp 5/27/08 11:02 PM Page 294

Chapter 17
Trading with a Plan Today So You
Can Do It Again Tomorrow
In This Chapter
Coming up with the cash to trade
Choosing who you want to do the trading
Selecting a CTA
Bonding with a broker
I
n this chapter I help you decide whether you or someone else will do your
trading, and I explain how you can go about setting up your trading infra-
structure.
Deciding just who will do your trading is as important a decision as you can
make because your success or failure, or how fast you get to your goals, can
depend on how you decide to make your trades. Each side of the aisle has
advantages and disadvantages, and much of deciding whether to trade for
yourself or have someone do it for you depends on your personality, how
much hand-holding you need, and what your expectations are.
If you decide to make your own trades, you must fully commit your time and
efforts to the enterprise. In a very real sense, you’re starting a new business,
and any casual notion you have that becoming a trader will be an easy, effort-
less road to riches is the way to disaster.
The decisions you make have a direct and usually quick bearing on how
much money you make or lose while trading.
25_287224-ch17.qxp 5/27/08 11:03 PM Page 295
Financing Your Habit
The most difficult question that you must answer about trading has to do
with where you’re going to get the money to trade futures.
A simple rule: If you have to borrow money, you shouldn’t trade futures or
anything else. Money for trading needs to be money that you can afford to
lose, period.
You may have to develop a savings plan over several years to finance your
new endeavor. As a result, you may need to make changes in your spending
habits, such as missing a vacation, driving a more modest car, or eating at
less fancy restaurants.
Regardless of how you do it, the best way to trade futures is with your own
money. When it’s your money that you’re trading, you’re more likely to be
extremely careful about what you do with it.
Although most discount brokers enable you to open a self-managed futures
trading account for $5,000, most Certified Trading Advisors (CTAs) require a
minimum of $50,000, with the range usually being anywhere from $25,000 up
to several million dollars. See the next section for more details about choos-
ing a broker or CTA.
Deciding Who’s Going to Do the Trading
After you’ve made up your mind to trade futures, you need to decide who’s
going to do the actual trading. The choice is pretty simple; either you or
someone else will do it, but that also means you have to decide whether to
use an advisor, a broker, or a managed account.
Choosing has its subtleties. Keep in mind that when a broker is doing your
trading — depending on your agreement — he or she may have to call you
and ask your permission to trade on your behalf. That can delay your ability
to make short-term profits. Conversely, you may choose to give your broker
full trading authority and discretion to make trades for you. If you do, then
you have to abide by the results of the broker’s decisions, which means you
may face some conflict down the line if your broker is either unscrupulous or
not very talented.
A managed account is akin to a mutual fund. It is a pooled amount of money
that is managed by an individual or a group. Those managers don’t have to
ask for permission to trade your money because they trade the entire pool
Part V: The Trading Plan
296
25_287224-ch17.qxp 5/27/08 11:03 PM Page 296
simultaneously, and shareholders make or lose money depending on the
results of the pool’s trades and the number of shares they respectively hold.
The main advantage of letting someone else do the trading is that you can
spend time finding out how to trade while your account grows, assuming that
you find a good firm or broker to manage your account. The main disadvan-
tage is that you have little control of your money. If you need control, you’ll
probably be miserable.
Here are your basic trading options:
Manage the account yourself based on your own analysis.
Manage the account yourself based on advice from newsletters, publica-
tions, or even a broker.
Have a CTA manage the account.
Buy an interest in a limited-partnership pool managed by a professional
CTA. Limited-partnership pools also are known as futures funds.
Other advantages of managed futures, either individual accounts or trading
pools, are as follows:
Good CTAs have more experience than novice traders and therefore
have a better chance of making money.
Trading pools have more money to invest than individuals and thus can
establish better positions in the market.
Trading pools can pay lower commissions when they trade and thus
save you money on costs.
Trading pools are structured as limited partnerships or LLCs, entities
that limit your risk. They spread risk across all the partners, with the
managing partner or the manager/management firm assuming the
largest part of the risk. You’re liable only for losses or any required resti-
tution for fraud and so on, and your liability is limited to the percentage
of the partnership that you own. So if you own 2 percent of the shares,
and the partnership goes belly up, you’re at risk of losing only an
amount commensurate with what you put in.
Some managed futures funds guarantee the return of your initial investment if
you remain with the fund for a set number of years. The disadvantages of
that option are that your return from these funds may be lower, and you usu-
ally must hold the fund until maturity, so your money’s tied up in the fund,
regardless of how well it’s doing.
297
Chapter 17: Trading with a Plan Today So You Can Do It Again Tomorrow
25_287224-ch17.qxp 5/27/08 11:03 PM Page 297
The disadvantages of managed futures accounts are
Higher fees, loss of control of your money, and the general illiquidity
associated with them.
The fact that you have to part with (or give up control of) your money
for an extended period of time and be willing to weather some volatility
during that holding period.
The Commodity Futures Trading Commission (CFTC) provides an excellent
summary of what a CTA is and how the commodities trading system func-
tions at
www.cftc.gov/opa/backgrounder/opacpocta.htm
.
Choosing a CTA
A CTA is a professional money manager who must register with the CFTC and
undergo a rigorous FBI background check before being allowed to trade other
people’s money. A knowledgeable CTA can manage your futures trades. You
can find a CTA either through a broker or by subscribing to services such as
Managed Accounts Reports (MAR;
www.marhedge.com
), which can become
expensive.
Reviewing the CTA’s track record
After you get a few names of potential CTAs, review their disclosure docu-
ments, which by law have to present all their vital information and their track
records. Track records (also by law) have to be presented in a way that is
easy enough for you to understand, regardless of whether the advisor has
made money. They include comparisons with benchmarks such as the S&P
500 and the Lehman Brothers Long-Term Government Bond Index.
The track record also has to show
How much money was being managed
How much money per month came from trading
How much came from new deposits or was lost to withdrawals from
the fund
Amounts of fees charged by the fund
Amounts of fees paid by the fund
Earnings from interest
Net return on investment after all fees and trading were taken into
account
Part V: The Trading Plan
298
25_287224-ch17.qxp 5/27/08 11:03 PM Page 298

Be careful in how you look at the posted returns of CTA candidates. Here’s
an example: Suppose you have two advisors, X and Y, and advisor X’s three
years of returns are
+
10 percent,
+
40 percent, and –20 percent, while advisor
Y’s returns for the same three years are
+
15 percent,
+
10 percent, and
+
per-
cent. At first glance, you’re probably inclined to think that X is the better of
the two, but if you do the math, you’ll see that if you gave them each $1,000,
after three years, X would have $1,232, while Y would have $1,328.
Other CTA characteristics to watch for
Use this checklist to make your best choice of CTAs. Above all, make sure
that you match the CTA to your risk tolerance.
Check how long the CTA has been in business. The longer the advisor
has been in business, the better he is likely to be, because he’s a survivor.
Find the CTA’s largest drawdown or the biggest loss he’s ever had. The
two important things to find out are how bad the loss was and how long
it took the CTA to get the money back after the loss.
Evaluate the returns of prospective CTAs based on risk. The CTA who
has a lower return but took less risk may be a better choice because he
or she is likely to provide more stable returns, and you may sleep better.
Check out the stability of the business. Make sure that plenty of signs
point to the CTA having a stable business and a stable methodology.
Look for consistent, but not necessarily high, returns.
Ask about risk management. Look for reasonable answers with regard
to money management and risk aversion.
Look for conflicts of interest. Is the CTA getting paid by certain brokers
to use their services? Is that costing you money? What kind of fees is the
CTA collecting from other sources as fees and commissions?
Considering a trading manager
Another possible suggestion is employing a trading manager or a middleman
when you’re trying to choose a CTA. If you’re overwhelmed by the thought
of having to plow through hundreds of documents while screening your list
of potential CTAs, managed funds, and trading pools, a trading manager can
act as an investment counselor, serving as an independent resource who can
sift through the jungle of paperwork to help you evaluate CTAs, funds, and
managers.
299
Chapter 17: Trading with a Plan Today So You Can Do It Again Tomorrow
25_287224-ch17.qxp 5/27/08 11:03 PM Page 299
Trading managers collect a fee for doing your legwork, and they get a per-
centage of your profits, which turns out to be a good incentive for them to
find someone who is good for your money. Large investors usually employ
trading managers.
Choosing a Broker
If you decide to trade for yourself, you need to choose between a full-service
broker and a discount broker. A full-service broker charges you a larger com-
mission but is expected to provide you with good advice about your trades.
Some also serve as middlemen between you and CTAs.
Be careful whenever you deal with brokers, CTAs, mutual funds, annuities,
and so on because brokers and advisors sometimes earn large incentives for
steering you in certain directions, regardless of whether taking those direc-
tions with your money is in your best interest.
Look for full access to the following when you open an account:
All markets: Even if you’re interested in only a handful of markets right
now, you may want to consider expanding your horizons in the future,
so choosing a broker who can give you all the choices under one roof
is best.
Research: Some brokers offer discounts to newsletters and Web sites,
while others offer direct access to their own research departments.
Some offer live broadcasts from the trading pits.
The full gamut of technical tools: You really want an opportunity to get
as fancy with your trading as you want to in the future, including having
the ability to run multiple real-time charts with oscillators and indica-
tors and receive intermarket analysis.
Intelligent software: Some brokers offer you access to software and
charting packages that enable you to back test, or review, the results
of your trading strategies and indicators.
Forward testing your strategy: Nothing guarantees that you’ll match the
results predicted by the software, but the ability to forward test your
trading strategies is a nice tool to have. Back testing shows you how
your trades would have worked based on historical data. Forward test-
ing is based on the probability of certain conditions occurring in the
future and is more related to how much money you’d make if certain
things happened; however, it’s a useful tool only in hypothetical settings.
Part V: The Trading Plan
300
25_287224-ch17.qxp 5/27/08 11:03 PM Page 300

Follow these suggestions when boiling down your choices between brokers:
Test more than one trading platform. Most brokers will offer you a trial
of their software and trading platforms if you register on their Web sites.
Make sure that the broker offers a 24-hour customer-service line. This
line of communication is crucial if you decide to exit a position
overnight in the face of events that are costing you money. If you have to
wait until the morning, your losses can be larger than you’d expect. The
24-hour nature of futures trading is another reason to use stop-loss
orders.
Make sure that you have the choice of entering trades via the Internet
or phone. If phone lines are busy and you have to make a trade, you
want access. If your Internet connection and your backup connection
are down, you’d like to have phone access to either check your posi-
tions or make trades.
Check all potential trading fees before you sign up and make a trade.
Check all fees, including whether all the trading bells and whistles are
included in the commission or whether extra charges or conditions
must be met, such as a minimum number of trades to qualify for certain
services.
Open an account with a well-known firm. Going with an established
broker can be a good idea, at least when you’re getting started. If you try
to save a few bucks with a smaller firm, you may be sorry later on, espe-
cially if you’re concerned about order execution, software glitches, and
hidden fees. Large firms are not exempt from fraud but, because of their
size, information about their practices is more readily available.
Check for current trading scams: Look on the CFTC’s Web site (
www.
cftc.gov
) under the “Consumer Protection” heading for current trading
scams and for disciplinary actions taken against firms and brokers.
You’ll find important bulletins and helpful Web links to important infor-
mation about general rules and recent enforcement actions. On the
National Futures Association’s (NFA) Web site (
www.nfa.futures.org/
basicnet
), you can search for brokers, trading pools, and CTAs.
Falling in the pit of full service
Some of the same criteria that apply for choosing a CTA can be used for
choosing a full-service broker (see the earlier sections on “Reviewing the
CTA’s track record” and “Other CTA characteristics to watch for”). Especially
important is whether you’re dealing with an experienced broker, who earns
his or her keep.
301
Chapter 17: Trading with a Plan Today So You Can Do It Again Tomorrow
25_287224-ch17.qxp 5/27/08 11:03 PM Page 301

With brokerage firms, many times you meet the lead guy once, but you never
see him again. You’re left dealing with underlings, and that can be just like
Russian roulette. If you get a good one, you’ll be mostly okay, if you can
handle the larger fees. Much of the time, especially when you have a smaller
account, you’re relegated to someone just starting out with the firm, and that
may or may not be in your best interest.
Choosing a futures discount broker
Going the route of the discount broker may be a better alternative if you’re
adventurous and do your homework, which includes practice trading in simu-
lated accounts.
A large number of discount brokers operate in the futures markets, and you
can find most of them by using your favorite search engine on the Internet or
looking at advertisements in Futures, Active Trader, the Wall Street Journal,
and other publications.
Aside from the important aspects, such as service in general, availability of
24-hour service, commissions, and ease of access to the trading desk, dis-
count brokers offer online trading services. You want to make sure that the
trading platform the discount broker provides is easy to use and that the
orders you place online are executed in a reasonable amount of time.
Part V: The Trading Plan
302
25_287224-ch17.qxp 5/27/08 11:03 PM Page 302
Chapter 18
Looking for Balance
Between the Sheets
In This Chapter
Finding out what’s on your trading mind
Accounting for what’s in your wallet
Investigating what you’re worth
T
he futures markets are a zero-sum game. Someone always loses, and
someone always wins. In other words, any money that you make trading
is money that you’ve taken away from someone else who’s also trading.
Put the shoes on your own feet, and you get a better picture of the situation.
Yup, out there in cyberworld or in some crazy trading pit, someone is waiting
to take your money away from you. So before you decide to start trading, you
need to figure out whether you measure up mentally and financially.
I’m not talking about your self-esteem or your intellect here, although good
measures of both are required for success in trading. More important, you
need to know how much money you have and whether you can manage it
well enough for continued success in trading futures — that is, well enough
to stay in the game.
In this chapter, I tell you about some basic issues that can help you decide
whether you should be a trader or think about doing something else with
your money until your finances are in good enough shape to enable you to
trade comfortably.
In a sense, you need to keep track of two personal balance sheets: a mental
one, from which you figure out why you want to trade, and a financial one,
from which you decide whether you have enough money to finance your
trading venture. Both are equally important, and ignoring one or the other is
a recipe for disaster.
26_287224-ch18.qxp 5/27/08 11:03 PM Page 303

Exploring What’s on Your
Mental Balance Sheet
Your expectations about futures trading shape the role futures play in your
portfolio. As a general rule, futures need to be part of an overall financial plan
that includes stocks, bonds, mutual funds, annuities, real estate, and other
assets. Although not a mandatory component, futures and commodities in
general can be useful in the portfolios of individuals with large net worths,
especially as a hedge against risk. However, the central tenet of your mental
balance sheet is understanding why trading futures appeals to you.
Why do you want to trade?
Most people look to the excitement often associated with gambling and
equate it with trading futures. Unfortunately, trading futures or other assets
is not gambling. Trading isn’t associated with glitz and shouldn’t be associ-
ated with liquor or other diversions. In fact, the more aware you are of the
current global situation and the current situation in your market, the better
off you’ll be.
Here’s how I answer the question: Trading is a hedge for my life. I have two
full-time jobs: my medical practice and my financial business. On occasion,
one or the other takes over as a major income producer. When my trading
business isn’t going well, my medical practice still provides a relatively
stable income and vice versa. (I’ve experienced periods when the opposite
has been true.)
I trade for these two reasons:
It’s my business. Trading and the byproducts of trading, such as writing
books, selling subscriptions to my Web site, and occasionally providing
consulting services, are major contributors to my income. By trading,
I’m not only making money, but I’m also testing strategies in real time
that I eventually can pass on to my subscribers (
www.joe-duarte.com
)
in the form of recommendations and insights.
Trading provides income diversification and enables me to maximize
the total return on my retirement fund. I add as much to my IRA every
year as is legally possible within my means, and I trade the hell out of it.
I don’t miss an opportunity to contribute to it, no matter what. Most of
the time I fund my IRA entirely from the income that trading and related
endeavors produce.
Part V: The Trading Plan
304
26_287224-ch18.qxp 5/27/08 11:03 PM Page 304
For me, trading is an important source of income and income diversification
that I derive from a tremendously enjoyable and agreeable mental and intel-
lectual exercise.
When pondering the question that heads up this section, make sure that your
answers are truthful. If you’re just looking for kicks or you think that trading
will fix all your problems, don’t fool yourself. Trading is work that requires
personal and financial commitment, even if it isn’t your primary source of
income. If you take it seriously, you need to think about what you expect to
get out of it. If you decide not to take it seriously, don’t trade.
Trading is a sporadic way to produce income. You can experience long
stretches during which no matter how you feel or how accurately you follow
your trading plan, you’ll still have few opportunities to ply your craft, or you’ll
end up going through a long and steady string of losses. In a good year, I can
make as much or more money by trading than I’m allowed to add to my IRA.
By adding money every year, I increase the overall rate of accumulation in the
account. But in a bad year, I may have to consider taking out a loan to cover
my taxes and to fund my IRA. Fortunately, I haven’t had many bad years.
Trading is a serious game that should not be taken lightly. The key to being a
successful trader is to be comfortable with yourself, your motivation, and
your ability to formulate a plan and put it into action. Before you start trad-
ing, it’s important that you understand why you want to trade. You need to
look at your own life and situation to make a decision that you can live with
when it comes to how much time and effort you can devote to trading and
whether you’re willing to stick to it.
Trading as part of an overall strategy
Trading futures needs to be put into proper perspective. After you’ve sorted
out your mental balance sheet, you can consider where trading fits into
your life.
Trading can be a part-time endeavor, or it can be a full-time job. If you’re like
me, you consider trading as full-time work, but if you do it part time, it can be
a useful source of income all the same.
Say, for example, that you’re a buy-and-hold investor in stocks, concentrating
on income-producing preferred, blue-chip, and utility stocks. Trading futures
can add a more aggressive element to your portfolio.
One ideal way for you to trade to your advantage takes place during times
when a market is moving sideways, and you can improve your income by
writing call options (see Chapter 4 for more about options). Another way is
when a market is ready to top out, and you can either sell stock-index futures
short or buy put options to protect your stock portfolio.
305
Chapter 18: Looking for Balance Between the Sheets
26_287224-ch18.qxp 5/27/08 11:03 PM Page 305

Trading for a living
On the other hand, when you’re trading futures for a living, you may want to
consider moving to Chicago or New York and looking for a job in the industry.
If that is your goal, it probably will take several years to master the craft and
significant amounts of capital, guile, risk taking, and effort may be required
on your part to accomplish it.
Regardless of what you decide, you can derive at least some benefit from fig-
uring out your mental balance sheet.
The Financial Balance Sheet
The high-risk world of futures trading requires a higher litmus test of your
finances than other forms of investing. In the same way that you took the
time to explore the reasons why you want to trade and how trading is going
to fit into your life, you now must look at your finances with the least amount
of flattery possible.
The big question is whether you have enough money to take risks as a trader.
If you’re struggling to pay your bills every month and your idea of being sol-
vent is transferring your credit-card balances to a new card every six months
to increase your credit line, you’re better off not trading futures. On the other
hand, if you have enough money, you may want to find someone to do the
trading for you. And if you’re somewhere in between having no money for
trading at all and enough not to worry, you’ll probably have to do at least
some of the work yourself.
Organizing your financial data
As elementary as it may sound, getting organized is the only place to start.
But before you start adding and subtracting, make sure that you have the
following matters under control and accounted for within your monthly
finances:
Your living expenses, especially food, mortgage, rent, and car pay-
ments: If you can’t live the way you want to on what you make, looking
to the futures markets to save you from your current situation is not
prudent. You have to have enough money for the basic necessities, food,
transportation, and rent before you do anything else.
Part V: The Trading Plan
306
26_287224-ch18.qxp 5/27/08 11:03 PM Page 306

Your life insurance coverage: The amount here is variable and needs to
be based on your family’s expected expenses after your death. Some
basic life-insurance calculators are available online to help you deter-
mine how much you need. I recommend a quick Internet search, using
your favorite search engine.
Your health insurance needs: Again, the amount of health coverage you
have is based on your family and your individual needs. You need to
figure in a worst-case scenario, though.
Your retirement plan: This aspect of your finances needs to be one of
your highest priorities before any kind of investing. Make sure that you
establish one and that you fund it as fully as possible before doing any
other kind of investing or trading. As I note earlier in this chapter, I trade
my retirement account actively and successfully, and I believe that you
can do it too if you master the craft well. Just remember, you should not
put 100 percent of your retirement money into a futures trading account.
Always diversify and time the markets based on your experience and
knowledge of trends and indicators.
Your savings plan, including how you’re going to pay for your chil-
dren’s college educations: Start by calculating your savings rate, which
is the percentage of last year’s earnings that you didn’t spend.
Your emergency fund: Set up an emergency fund and don’t even think
about using it to fund your futures trading. At least three to six months’
worth of living expenses is a good start.
When you have the essentials covered, you can turn your sights on reducing
or restructuring your debt with a clear and concise endpoint in mind so you
can pay it off and start thinking about accumulating money to trade with. One
way is to set yourself up with an allowance every month or every paycheck.
If by some miracle you find that you have enough money left over, congratu-
lations! You can consider trading.
A good place to gather information for preparing this kind of a budget is your
tax return or any recent loan application you’ve filed. You can develop a good
inventory of your assets and liabilities by reviewing credit-card statements,
your checkbook ledger, and your monthly receipts, especially expenses that
are recurring every week or month, such as grocery, cellphone, and utility
bills, and car and house payments.
Don’t forget to include intangibles, such as car repairs and impromptu med-
ical and dental bills, because they can add up in a hurry. Be sure to catego-
rize your expenses according to their similarities, much like when you’re
preparing your tax return.
307
Chapter 18: Looking for Balance Between the Sheets
26_287224-ch18.qxp 5/27/08 11:03 PM Page 307

Get a second opinion from a financial planner about the state of your
finances. Be careful when you do because most will tell you that trading
futures is too risky, and some will try to sell you high front-loaded and back-
end-loaded mutual funds instead. If you visit a financial advisor or planner,
make sure you tell him upfront that you’re interested only in him checking
your work and your calculations.
Setting realistic goals
Set the bar on your finances high enough that you won’t be sorry later.
Ideally, you need $100,000 or more as an initial trading stake. If you can’t
come up with that kind of money, wait until you can at least meet the lowest
trading threshold of $25,000. Again, these are guidelines. Stories exist of tal-
ented traders who’ve made millions after starting with as little as five or ten
thousand dollars.
When setting your financial goals, consider the following:
Your age: How old you are is especially important whenever you’re not
well capitalized. Make sure that you can make your money back if you
happen to have a disastrous start or streak.
The size of your family: As with age, the number of people who rely on
you financially is more important when you’re not well capitalized. If
your income is a significant portion of the family’s well-being, then that
takes precedence regardless of the circumstances. Never sell your family
short.
Job security: Most traders and would-be traders need a steady infusion
of income that’s provided by a steady job. If you decide that trading is
your job, you still need to find a way to supplement your income during
the times when trading won’t provide you with enough money.
Your family’s attitude toward trading: If your spouse is going to harass
you about trading, or you lose contact with the family because you’re up
at strange hours trading currencies, you’re going to have a major prob-
lem at some point.
Your own risk tolerance and emotional status: If you can’t stand the
thought of what you’ll do if you get a margin call or you get wiped out,
find something else to do.
Calculating Your Net Worth
Your net worth can guide you in making your final decision about whether
you can actually afford to become a futures trader. The calculation is simple,
but it requires attention to detail. Widely used financial computer programs
Part V: The Trading Plan
308
26_287224-ch18.qxp 5/27/08 11:03 PM Page 308

like Quicken can help you do the work. A quick search on your favorite
Internet search engine takes you to several Web sites that feature other pro-
grams that also can help. You can find a simple free calculator on the Web
through a quick search, or ask your bank for a checklist.
You can also do the calculations by hand. If you need a major helping hand
with this aspect of getting set up, pick up a copy of Eric Tyson’s Personal
Finance For Dummies, 5th Edition (Wiley).
Figure 18-1 shows you a generic personal balance sheet that’s self-explanatory.
First, you list your assets and add them all up. Next you do the same with
your liabilities. Finally, you subtract the liabilities from the assets, and you get
your net worth.
That bottom-line number, your net worth, is the amount you hope that you
can get out of all the things you own after you pay off all the debt you owe if
for some reason you have to sell everything. And that’s the number that can
tell you whether trading futures is a good idea.
Pay special attention to the amounts you have in the following:
Cash: Cash means the amount of money you have in money-market
funds, your pocket, and even stashed in your secret hiding place.
Real estate: Real estate refers to your home and any rental property,
second home, or other real property that you may own. As a rule, if you
can’t sell it tomorrow, it shouldn’t count toward this calculation.
Stocks, bonds, and retirement accounts: Most people hold stocks,
bonds, and mutual funds in their retirement accounts, although some
also own them outside of their retirement plans. Any money that’s in a
retirement account will be subject to tax consequences and early with-
drawal penalties, so you need to include those amounts in the calcula-
tion. However, you also need to be realistic. You’re not likely to cash in
your IRA or 401(k) plan to go speculate on soybeans. After reading this
book, you better not!
Business assets: Consider how many of your business assets are
involved in cash flow and inventory. Be careful not to be too generous in
this category.
Credit-card balances, second mortgages, and adjustable-rate mort-
gages: Pay special attention to these amounts under liabilities, and be
sure to include the latest credit-card balance and make sure that the
amount includes any big purchases that you’ve recently made. Don’t
hesitate to check your account online for the most current, real-time
statement on your credit cards.
309
Chapter 18: Looking for Balance Between the Sheets
26_287224-ch18.qxp 5/27/08 11:03 PM Page 309
After you do all the calculations, here’s a useful guideline: If your net worth is
less than $200,000, you shouldn’t be trading at all, much less trading futures.
Differentiating between trading and investing is important. If you have
$200,000 or less, investing in mutual funds is perfectly acceptable, perhaps
even in a mixture of stocks and funds, as long as you’re careful to follow
sound money-management and loss-management rules and have a long
enough time frame to make it profitable. If you’re trading, which by definition
means aggressively and actively deploying your money, keep the following in
mind as a bare-bones set of criteria.
Cash
Real Estate
Car
Bank Accounts
Stocks and Bonds
Mutual Funds
Retirement Accounts
Current Values of Businesses
Others
Total Assets
15,000
240,000
35,000
12,500
74,000
30,000
95,000
110,000
25,000
636,500
Home Mortgages
Credit Cards
Car Loans
Personal Loans
Education Loans
Taxes
Others
Total Liabilities
Net Worth
200,000
35,000
28,000
35,000
12,500
13,000
5,000
328,500
308,000
Figure 18-1:
A balance
sheet can
calculate
your net
worth.
Part V: The Trading Plan
310
26_287224-ch18.qxp 5/27/08 11:03 PM Page 310

Never risk more than 10 percent of your net worth as a trading stake unless
you have a net worth of at least $500,000 to $1 million or more and you’re
a well-equipped, stable, and experienced trader. If you are, you may want
to risk as much as 20 percent of your net worth to trade, provided your
expenses and long-term investments are covered. However, risking more
than 25 percent of your net worth in any trading venue is a crapshoot and
will likely get you into trouble.
311
Chapter 18: Looking for Balance Between the Sheets
26_287224-ch18.qxp 5/27/08 11:03 PM Page 311

Part V: The Trading Plan
312
26_287224-ch18.qxp 5/27/08 11:03 PM Page 312

Chapter 19
Developing Strategies Now
to Avoid Pain Later
In This Chapter
Choosing what to trade and understanding how to trade it
Keeping those profits coming
Checking and practicing trading strategies
Timing your markets for entry and exit points
Checking your trade results and adjusting for success
A
solid trading plan consists of developing a broad understanding of
what you’ll be trading, getting a handle on your emotions, finding out
about different strategies, and tempering your expectations of and interac-
tions with the market. It also takes in the more methodical nuts and bolts of
actually putting together a step-by-step detailed plan in which you micro-
scopically map out your strategies and rules.
In this chapter, I give you the background needed to create a more specific
trading plan than you ever imagined.
Deciding What You’ll Trade
I have no secret here, no magic rules or revelations. I can tell you only that
you need to trade what you like and use what you already know to your
advantage as much as possible. So when preparing a trading plan, take the
following into account:
Use your experience. Use what you know to focus on areas in which
you’re already an expert, but trade what feels right and what you have
success in.
27_287224-ch19.qxp 5/27/08 11:03 PM Page 313

Get specific and get good by applying and refining your knowledge.
It’s great to be a one-trick pony. Of all the currencies, I prefer the
euro/dollar pairing. I find that for me, it makes sense for two reasons:
• European monetary policy moves at the pace of molasses, and the
European economy usually is slow-moving at best. In other words,
the news from Europe is less likely to move the markets directly.
Instead, the euro is a reactionary currency that tends to move in a
slow, steady, one-directional trend, as opposed to other currencies
that can be more volatile, such as the Japanese yen, the Swiss
franc, and the British pound.
• The dollar, despite the rise of China and other emerging markets,
is still the world’s reserve currency. The United States still has the
most transparent markets and the most reliable economic data and
communications infrastructure.
Study the markets. See which ones appeal to you the most and make
the most sense. If you enjoy trading stocks, you may do well with stock-
index futures. If you like a particular sector, such as energy, try a few
paper trades (practicing without money) with oil, natural gas, heating
oil, or gasoline.
If you’re a political junkie like me, the bond and currency markets may
suit you well because they’re the markets that move the most with poli-
tics and world crises.
If you’re in real estate and construction, consider copper and bond
futures. Interest rates are the fuel for mortgage rates, while copper is
one of the key building materials in home building. If you know one city
or region’s real-estate market well enough, consider trading futures for
that market. Real-estate futures and housing futures are now available
also, but may take some time to become mainstream trading vehicles for
the public.
If you own a gas station, you probably have a good understanding of
supply and demand in the energy markets.
If you work in produce, you may have a leg up in grains and seeds.
Remain flexible. If you discover that you have a penchant for trading
well in the soybean markets, even though you’re not in the business and
you never knew anything about it before, add soybeans to your trading
arsenal.
Adapting to the Markets
A major part of your trading success is your ability to adapt. Even if you’re a
specialist trading primarily one or two markets, you still encounter periods
when those markets trade in difficult patterns.
Part V: The Trading Plan
314
27_287224-ch19.qxp 5/27/08 11:03 PM Page 314
The major point to understand is that no plan works for all situations.
However, you can rely on these realities of the markets. They trade in threes:
Three market directions: Up, down, or sideways
Three trading styles: Trading the reversal, momentum trading, and
swing trading
You need to be familiar with the three major trading directions and styles. I
cover these in the following sections.
Trading the reversal
When trading the reversal, you’re looking for the market’s turning point,
when either a bottom or a top is being made. To find that turning point, you
need to keep an eye on the current trend and watch for a significant trend
change.
The longer a trend stays in place, the more important the reversal will be,
and the longer the new trend is likely to stay in place. Here are some tips for
identifying a change in trend:
Use moving averages, trend lines, and oscillators to predict and pinpoint
as precisely as possible the meaningful trend changes. I describe how to
use these indicators in Chapter 7, which is about technical analysis, and
in the numerous examples of individual trades throughout this book.
Set your entry points just above the breakout if you’re going long, and
below the trend breakdown (a switch by the market to a downtrend) if
you’re going short. See Chapters 7, 8, and 20 for more trading tips. Use
a sell stop for long trades and a buy stop to cover your shorts when
you’re betting on a breakdown.
Trading with momentum
Trading with the trend or with the momentum of the market is a classic style
of participating in the markets. In fact, it’s something that I always recom-
mend you do. It works the same way in uptrends as it does in downtrends.
Just keep the following in mind:
If the market is trending up, your position needs to be long. Even if
you’re day trading, your primary goal needs to be to look for opportuni-
ties to trade when the market is rising.
If the market is falling (trending down), you need to be short.
315
Chapter 19: Developing Strategies Now to Avoid Pain Later
27_287224-ch19.qxp 5/27/08 11:03 PM Page 315
As with any other trade, protect yourself by using stops. Stops are
preset instructions that direct your broker to sell your position when a
certain price is reached and keep your losses from expanding beyond
control (see Chapters, 7, 8, and 20).
Use the market as your guide in momentum trading. You need to let
the market help you make decisions for buying and selling.
When you’re going long, you need to look for breakouts as entry
points. Breakouts are generally signs of market strength.
When you’re going short, you need to look for breakdowns to enter
your short position. Breakdowns are generally signs of market weakness.
A rising channel can be used as an opportunity to swing trade or to trade by
using momentum strategies. In this case, every pullback to the lower trend
line was yet another opportunity to go long, and every tag of the upper trend
line was an opportunity to either take profits and watch for what the market
would do next or consider a short-term opportunity by short-selling the
market. I tell you more about swing trading in the next section.
Swing trading
Swing trading is the best method for trading in markets in which prices are
moving sideways, neither going up nor down. For more information about
swing trading, see Chapter 8.
Managing Profitable Positions
One of the most important aspects of trading is deciding what to do when
you’ve earned a nice profit, and you’re getting antsy about cashing in. This
situation may occur during the course of a normal market or one that is
reaching the irrational exuberance, or blowoff, stage.
You must watch for several important indicators during a blowoff, or in a
market that seems unstoppable and experiences short-term corrections. That
can mean that sometimes the market sells off in the middle of the day, and
buyers are waiting for the market to drop so they can buy at lower prices.
In this kind of market environment, especially when you’ve earned big prof-
its, taking profits is a good idea whenever the market drops for two consecu-
tive days.
Part V: The Trading Plan
316
27_287224-ch19.qxp 5/27/08 11:03 PM Page 316

On the other hand, if the market opens down significantly without news, take
it as a sign that worse things may be coming. And if the market fails to set a
new high after a short-term correction, it’s pointing to an important sign that
a significant top is developing.
Whenever the market breaks and you don’t sell your position in time, use the
snap-back rally, which is when the market bounces after an aggressive period
of selling that usually develops so you can move out of your position and into
the next.
Building yourself a pyramid
(Without being a pharaoh)
Futures traders add to profitable positions by pyramiding, or adding more
contracts to existing profitable positions. When you pyramid a position,
you’re adding to your existing holdings, not selling your holdings and starting
a new position. Check out the example at the end of this section, where I
detail how to pyramid a position in which your initial buy is ten contracts.
Never use a reverse or inverted pyramid strategy when trading. By that I
mean that the first number of contracts you buy needs to be the guideline for
your maximum risk. If, for example, you buy three crude-oil contracts, double
your initial investment in the trade, and the market still looks attractive, you
can add to your position, but only by a maximum of three contracts each
time you add to your pyramid. The goal is to keep adding contracts as long
as the market remains in the same trend or until reality sets in and you run
out of the money that you’d set aside for this trade.
Use a pyramid strategy only during the early stages of a move, such as the
breakout and subsequent early stages of the breakout. If you try it when the
market has been moving in one direction for a long time, you’re likely to lose
money.
Preventing good profits from
turning into losses
When you trade and the market turns on you quickly, you obviously have to
get out with whatever you have left. But when your positions show nice prof-
its, don’t let the market take away your hard-earned gains.
317
Chapter 19: Developing Strategies Now to Avoid Pain Later
27_287224-ch19.qxp 5/27/08 11:03 PM Page 317
Stay on top of your profits by setting protective sell stops as the market
moves. For more details about stops, see the previous section and Chapters
3, 7, 8, and 20. With protective stops, you can (at all costs) make every
attempt to at least break even on nice big profits, especially when you’re
trading markets that move quickly and can change at the drop of a hat if
you’re not paying attention.
For example, say you establish a position in the euro at 8 a.m., the market ral-
lies, and by 11 a.m. you have a nice profit. In the middle of the day while you
take a lunch break away from your trading screen (bad idea), news breaks,
and the euro tumbles, taking your profit with it. If you had set a (protective)
sell stop and had adjusted it higher as your profits accumulated, you would
have gotten stopped out with more money than you started.
Never adding to losing positions
When the market goes against you, it’s time to get out. If you average down,
or add to positions at lower prices in the futures markets, you’ll get hurt
badly.
Back Testing Your Strategies
Back testing is the practice of using historical data to test how well your indi-
cators work in a particular market. Software programs enable you to look at
past markets and test how different methods and indicators have worked in
the past, but it’s a tricky practice. These capabilities amount to a double-
edged sword in a chaotic universe because although your indicators may
back test well, you still can get a false sense of security. Similarly, what didn’t
work in the past may somehow start working.
In other words, no trades ever work exactly the same way twice, so you have
to take your back-testing results with a grain of salt. Back testing can, how-
ever, help give you a broad feel for how markets behave under certain condi-
tions and help you spot important characteristics of the market, such as the
following:
Seasonal trends: Seasonal trends work best when trading the energy,
grain, seed, and livestock markets, because those markets are depend-
ent on well-established planting and harvesting cycles, as well as the
demand for energy during summer and winter. In other markets, such as
bonds and currencies, seasonality is often less reliable, except during
short periods of time. For example, stock prices tend to rise at the end
of every month and the first few trading days of a new month, because
institutions put new money to work during that time frame.
Part V: The Trading Plan
318
27_287224-ch19.qxp 5/27/08 11:03 PM Page 318

Market tendencies: The amount of time that a particular market tends
to run in a certain direction is a great example. If you look at a long-term
chart of the U.S. dollar index, you immediately see that its trend lines tend
to last for months to years after they’re established (see Chapter 11).
Indicators: Use your indicators wisely after you confirm their accuracy
by back testing them. Get the big picture. For example, if you’re testing a
moving average crossover method, remember that the one you’re study-
ing now may not work as well later. However, if your testing shows that
moving average crossovers work in the market you’re testing, get a
handle on several combinations and then monitor them in the current
market to find out which ones work best.
Setting Your Time Frame for Trading
The aspects of trading that are most often mismatched are the trader’s
personality and the time frame of the trade. Some people are just more
patient than others. To be a good trader, you have to find that delicate bal-
ance between your level of patience and the reality of the market. If you try
to impose your personality on the market, you’re going to get hurt. At the
same time, you have to let your general tendencies guide you toward your
trading style.
Day trading
Day trading is a misunderstood and oft maligned term. Day trading is the
practice of holding positions open for short periods of time during the trad-
ing day with the goal of accruing small, but numerous, profits. Usually it
means that you exit all positions at the end of the trading day and return to
the market with a fresh slate the next day. What it doesn’t mean is that you
trade every day or that you open positions at the open of the trading day no
matter what.
When day trading, you still need to keep basic trading principles in mind,
such as picking good entry and exit points, placing protective stops, manag-
ing your money, and using technical analysis. And you still need to keep an
eye on the news and on the overall trends of the markets.
Intermediate-term trading
Traditionally, intermediate-term trading means that you hold a position
for several weeks to several months, which ultimately is impractical in the
futures markets, where volatility can lead to margin calls and where leverage
makes holding positions for extended periods extremely dangerous.
319
Chapter 19: Developing Strategies Now to Avoid Pain Later
27_287224-ch19.qxp 5/27/08 11:03 PM Page 319

So in the futures markets, intermediate is more likely to mean several days
and is more often referred to as position trading, where you use a longer-term
time frame as your reference point for keeping a position open.
One way to participate in the overall trend of the futures markets for the
intermediate term is to use exchange-traded funds. See Chapter 5 for details.
Long-term trading
Long-term trading is impractical in the futures markets, unless you’re
extremely well capitalized, and you’re hedging your business. When that is
the case, however, you can use contracts that are several months to even
years ahead as your positions as long as you’re mindful of expiration dates
and other parameters. ETFs can help here as well because they let you trade
the trend without worrying about expiration dates and contract rollovers,
such as when you’re trading straight futures. Don’t be fooled, though. ETFs,
such as the U.S. Oil Fund (USO) are just as volatile as the market which they
mirror. That means that a big loss in oil futures can be a big loss in USO.
Setting Price Targets
Setting price targets is a useful strategy, especially when you’re swing trad-
ing, which is where you ease into and out of positions by closely watching a
market’s trading range. Setting targets in momentum markets, however, may
do more harm than good because you may sell a potentially huge profitable
position too soon.
Adapting your strategy to the market’s overall trend is the better approach,
but Fibonacci levels and support and resistance levels can help you set tar-
gets for taking profits.
Reviewing Your Results
After each trade, finding out why you did well or why you failed is a good
idea. Checking your trading data from the time you enter a position to the
time you exit it on every single trade can be tedious, but it also can be
extremely useful. Here is a fairly good overview of the kinds of information
and questions you may want to check and answer after good or bad trades:
Part V: The Trading Plan
320
27_287224-ch19.qxp 5/27/08 11:03 PM Page 320

Exit and entry points: Review your exit and entry points and then ask
yourself whether you adapted the right strategy to the right market and
whether you used the best possible method to protect yourself.
Did you give yourself enough room to maneuver? For example, was your
sell stop too tight? Should you have given the market more room?
Your charts: Go back and look at the charts you used to make your
trade to find out whether the market you were trading is acting similar
to the way history shows it has acted in the past. If it isn’t, try to figure
out what’s different about the market.
Fundamentals: Did you really understand what the fundamentals of the
market were telling you? Did you understand the nuts and bolts of the
industry? For example, did you pay attention to the part of the livestock
cycle that the market was in when you traded hogs? Or did you check
the weather reports before you shorted soybeans?
Market suitability: Are you really suited for trading in a given market?
Does it move too fast or too slow for you? If you’re trading currencies,
for example, can you handle moves that last for several days and keep
your positions open overnight? Or does that frighten you and make you
lose sleep? If you lose sleep, you’ll be flat-footed when you wake up, and
you’re thus bound to miss something. A 20-minute gap in a chart can be
closed in an hour because the bad or good news that moved your cur-
rency turned out to be a false alarm, and the market moved briskly
beyond (above or below) where it was trading before the news hit.
Technical analysis: Did you let your own personal judgment ruin your
trade because you thought you knew better than the charts? Always
trade what you see and not what you think you know. You may eventu-
ally be right, and then you can trade the other way, but in the present,
trade with the charts, follow the market’s response to the news that hit
today, and forget what the talking heads are saying.
Market volume and sentiment: Did you consider the market’s volume
and the overall sentiment before you bought that top and got stopped
out in a hurry? Low volume and high levels of pessimism often mean
that a market has bottomed, while huge volume and a feeling of invinci-
bility are the hallmark of a pending top.
Subtleties: Don’t miss the subtle stuff. Did you pay attention to your
indicators? Did you look at your RSI and MACD oscillators for signs that
the market’s bottom that you missed came on a lower low on the charts
but a higher low on the indicator?
321
Chapter 19: Developing Strategies Now to Avoid Pain Later
27_287224-ch19.qxp 5/27/08 11:03 PM Page 321

Remember Your Successes and
Manage Your Failures
When things go well, you need to remember the moment in your gut, your
mind, and your being. If you fail, do the same. That way, if you’re ever faced
with a similar set of situations, you have a visceral and mental archive that
will let you react in the correct manner.
This strategy is tailor-made for trading. For example, when you make a big
profit, you need to sear the particulars of that trade into your mind. Try to
remember how you did it, what you saw, what you felt, and what decisions
you made along the way.
Following your trading plan all the way down to your checklist always is the
better approach to trading, because then you already have a road map with
which to evaluate your performance.
When managing your failures, avoiding the markets that you just don’t under-
stand is best. For example, I don’t trade gold. It just doesn’t work for me, so I
manage it by avoiding it.
In the rare instances when I do consider trading gold stocks or other gold-
related instruments, I always ask myself really tough questions, such as
whether I can stand the lack of sleep. The result: I rarely trade gold.
Making the Right Adjustments
After evaluating your successes and your failures, you can make changes that
keep you out of trouble by
Avoiding markets that you don’t understand or that make you uncom-
fortable.
Not adding to positions without planning your strategy before pulling
the trigger.
Having your road map ready and not deviating from it unless you’ve
previously decided how you’ll do it and how far you’re willing to go.
Not making the same mistake twice. If you get nailed in the oil market,
don’t trade oil until you’ve figured out why you got hammered.
Part V: The Trading Plan
322
27_287224-ch19.qxp 5/27/08 11:03 PM Page 322

Chapter 20
Executing Successful Trades
In This Chapter
Preparing to place a trade by observing a full range of details
Planning an entry point to place a trade
Comparing your market’s relationships with others and confirming your plan
Placing the trade and managing your positions
Deciding when to close out your positions
Evaluating your trade so you can benefit from your mistakes.
T
his chapter is all about putting together the analysis, the execution, and
the management of a trade. Although the information throughout this
chapter generally is hypothetical, it nevertheless relies on real-life examples
of trading. It starts with your pre-trade analysis and then details the actual
execution of the trade through a phone conversation with your trading desk,
managing the position, and then closing out the trade.
The trade I outline chronologically in this chapter obviously is idealized, but
it isn’t meant to be a Pollyanna-like exercise. Instead, it’s an exercise of dis-
covery that uses a real-life example in an active market — the oil market —
during a crucial period of time.
Setting the Stage
Here’s the scene: The oil market has been consolidating since October 2007,
with prices ranging between $82 and $95. As Figure 20-1 shows, the May con-
tract for crude formed a double bottom between January 11 and February 12,
2008. Note the “W” formation, and also note the clumping of prices around
the 20-, 50-, and 200-day moving averages (labeled 20, 50, and 200), as the
right portion of the “W” forms.
28_287224-ch20.qxp 5/27/08 11:03 PM Page 323

Figure 20-2, confirms your analysis, as the Bollinger Bands around the 20-day
moving average are squeezing the prices. When Bollinger bands squeeze
prices and there is consolidation around moving averages or key support or
resistance points, such as in these figures, that’s known as compression, and
it is usually a prelude to a big move. And that’s when you should start making
plans to trade this market. Three scenarios are possible:
A move to the up side is possible, which is an opportunity to go long.
The market might go nowhere, which means that you have to wait some
more.
Or the market is about to fall. In this case, the chart clearly shows that
the $85 or better area has held at least two times, as marked by the
asterisks.
This kind of chart formation suggests that the market is most likely to rise.
Your three major goals are to
Analyze the situation. Combine your knowledge of technical and funda-
mental analyses with the psychology of a market in a multiyear bull
market.
Design a trading strategy. Based on your analyses, you must design
a well-crafted, step-by-step, careful plan that either makes you some
money or gets you out of the position with as little damage as possible
(if you’re wrong or the market turns against you).
Put the plan into action. Make the trade, establish the position, and
then manage it as you take the plunge into chaos.
You wake up, get your coffee ready as your computer boots up, and survey
the landscape. As you sip coffee while going through your stretching routine,
you scan the latest news on CNBC, in the Wall Street Journal, or on Google
News or the Dow Jones Newswires. You probably ought to check Reuters and
Bloomberg, too. As you scroll through all that information, you have only one
goal in mind: watching the different markets as they set up for trading.
What you know for sure is that the date is February 8, 2008, a bull market is
raging in oil and has been for several years, and the market is clearly at a crit-
ical juncture, because crude oil futures have been consolidating for months
and the weekly release of supply data is in about five days — February 13. As
you scan the news, you note that there is a big energy conference in Houston
next week and that leaks and comments from experts are starting to make
the wires.
Most of them are concerned about the effects on the economy of $100 oil,
which is still $18 away from the prices you see in electronic trading.
Part V: The Trading Plan
324
28_287224-ch20.qxp 5/27/08 11:03 PM Page 324

You take another sip of coffee, and scan the markets. The dollar is flat but
looking a bit wobbly, and stock-index futures are flat, a couple of days after
having gotten hit fairly hard. Bonds are also flat.
That means that you’re focused on oil. It’s the one market that looks ready to
jump and it’s the one that suits your style and the one where you’ve had your
share of success.
Getting the Big Picture
As you pour yourself another cup of coffee and grab a roll, you realize that
you have some time before heavy trading in crude oil gets going in a couple
of hours, but you note that the price has steadily crept higher in the
overnight markets. Aside from the news on the upcoming conference in
Houston, there is little going on at first glance.
Then the news hits about Exxon Mobil winning a court battle against
Venezuela and the price starts to move. Exxon got a court in London to freeze
$12 billion worth of assets of Venezuela’s state-owned oil company, PDVSA,
and the Venezuelan government started making threats about halting oil
sales to Exxon. The markets needed a spark, and this seemed to be it.
Viewing the long-term picture
of the market
You review your one year chart of crude oil, and the RSI indicator (Figure 20-2).
See Chapters 8 and 13 for more about the RSI oscillator.
The RSI oscillator is an important and key indicator that tends to serve as a
good early-warning system. Your point of view is now narrowed because you
expect that oil will likely bounce, and you’re looking for confirmation that the
market is oversold enough to carry any bounce for at least a few days.
A perfect example is shown in Figure 20-2. A look at RSI is very encouraging,
as it is confirming the “W” bottom on the price. More important, the second
bottom in the RSI is higher than the first one, which shows that the selling on
the second “V” of the “W” was not as strong as the first “V.” This is often an
indication that sellers were exhausted during the second bout of selling in
“W” formation.
You’re all set now. You have the background from which you’ll approach your
trade. Until proven otherwise, a bottom is in place and this market has to
played from the long side.
325
Chapter 20: Executing Successful Trades
28_287224-ch20.qxp 5/27/08 11:03 PM Page 325

Doing a little technical analysis
Check out the technical status of the oil market by
Examining the long-term trend: The crude-oil contract are consolidat-
ing just below the 20-, 50-, and 200-day moving averages. The long- and
intermediate-term trends clearly are moving sideways, but look ready to
turn up. You want to be there when they do. (See Chapter 7 for more
about market trends and support.)
Watching the behavior of the market in relationship to the Bollinger
bands: During this consolidation the Bollinger bands — both upper and
lower — have served as support and resistance for crude oil (see Figure
20-2). Notice that every time oil prices tag one or the other of the bands,
the result usually and eventually leads to a reversal and a tag of the
opposite band. Most recently, though, the price of crude came off of the
bottom band. This is another clue that a move up is likely.
Noticing that the 20-day moving average also provided fairly good
resistance during the recent rally attempt in crude. You want to make
sure that prices stay above that key level before making your move.
Analyzing what the price does above the 50 and 200 day averages:
Figure 20-1, shows all three averages. You decide that you want to make
sure that you don’t get whipsawed, so you’ll put your initial buy point
above the 200-day line, at 91.55, just above the 200-day line.
Stalking the Setup
You’re now waiting for the setup, or a key set of developments that need to
come together almost simultaneously before you pull the trigger and make
the trade.
As you wait for these circumstances to occur, run through the following
checklist to get ready for the trade:
Check the status of your account.
Review the key characteristics of your contract.
Fine-tune your strategy.
Review your plan of attack.
Part V: The Trading Plan
326
28_287224-ch20.qxp 5/27/08 11:03 PM Page 326
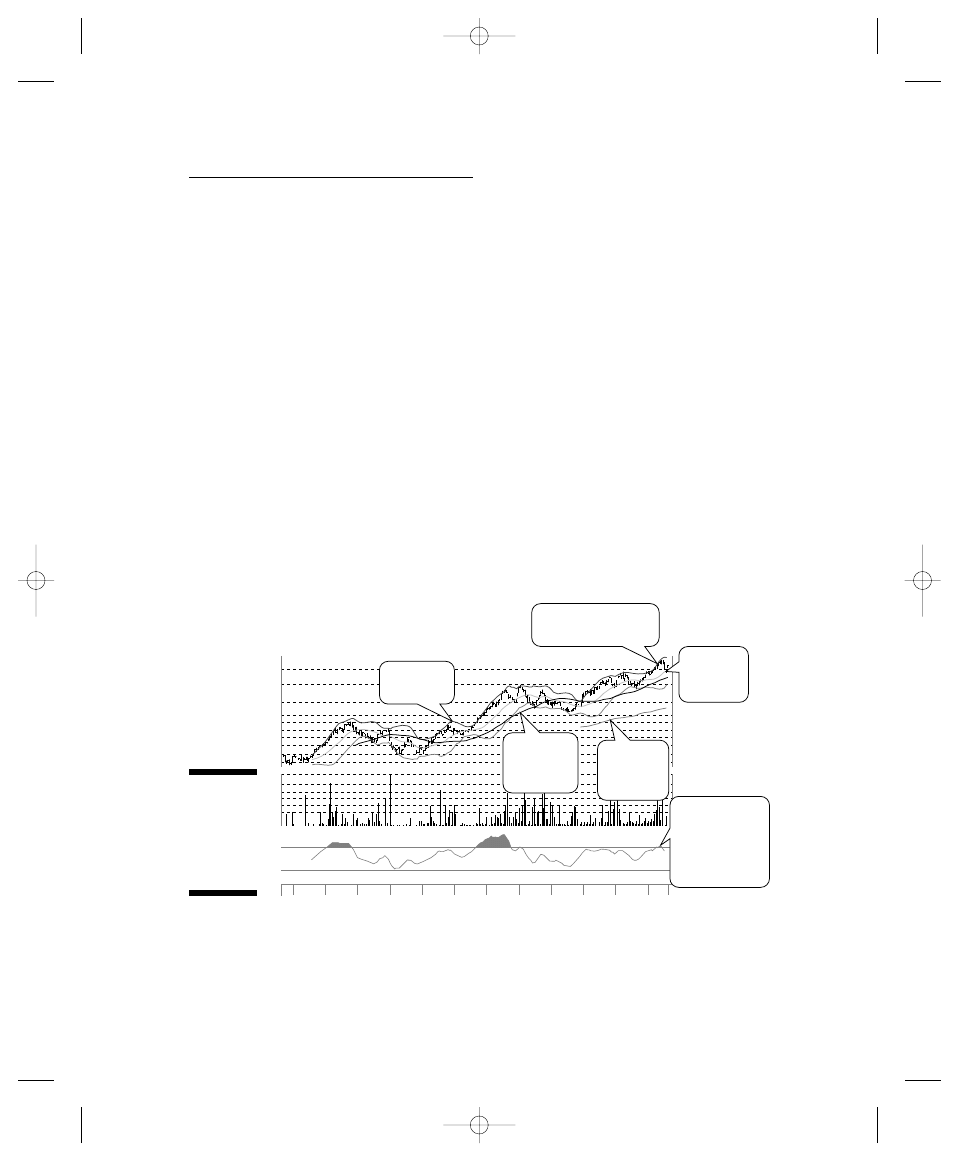
Checking your account
Always know how much money you have in your account. You can check
your account status online. Say, for example, that you have $100,000 worth of
equity. Your margin check shows that you need an initial margin of $7,763 per
May contract and a maintenance margin of $5,750. See Chapters 3 and 4 for
details about margins.
You have $100,000 of equity in your account. By consulting the margin
requirements for the May contract for crude oil, you quickly calculate that
you have enough in your account for going long on one or two contracts
because the margin is $7,763
×
2 = $15,526. Your rule is that you don’t want
to risk more than 10 percent equity in any one trade, but given the margins,
and your analysis, you may want to risk an extra 5 percent in this one. In
order to follow your rules closely, though, you decide to only buy one con-
tract during your initial purchase. Let your experience and risk tolerance
guide your decision.
You want to figure in how much to limit your losses to, so you have $2,013
per contract that you can play with before you start getting worried about a
margin call ($7,763 – $5,750).
500
Sep
Aug
750
1000
1250
1500
1875
Volume max: 1875
38
40
42
44
46
48
50
54
60
65
500
750
1000
1250
1500
1875
38
40
42
44
46
48
50
54
60
65
Aug
Oct
Nov
Dec
Jan
Feb
Mar
Apr
May
Jun
Jul
20 day
moving
average
RSI sell signal
as RSI fails to
make a new
high even
though oil did.
Bollinger
Band
New high in oil not
confirmed by RSI.
50 day
moving
average
200 day
moving
average
Figure 20-1:
Crude oil,
moving
averages,
and buy
points.
327
Chapter 20: Executing Successful Trades
28_287224-ch20.qxp 5/27/08 11:03 PM Page 327

Reviewing key characteristics
of your contract
As you formulate this trade, reviewing the characteristics of the crude-oil
futures contract is a good idea. A barrel of oil holds 42 gallons and trades in
U.S. dollars per barrel worldwide. The minimum tick of $0.01 (1 cent) is equal
to $10 per contract. A single futures contract for light, sweet crude oil is in
the amount of 1,000 barrels, or 42,000 gallons of oil.
That means that each penny you gain or lose is $10 worth of gain or loss in
the contract, so you figure that $1 in price movement in crude oil is $1,000
worth of gain or loss.
You have $100,000 worth of equity in your account, so you have a good cush-
ion. But you’ll get a margin call if your equity drops a little over $2,000. That
means that you’ll have to work out your sell stop to be somewhere in
between those two numbers. You decide that placing your sell stop just
above where the margin call would get you is a good idea, so you settle on
the initial stop being at $89.05. The margin call would be at $88.53.
See Chapter 17 for the details about trading plan and money-management
rules. You need to follow the rules you establish, or else you’ll eventually get
into trouble.
Regular open-cry trading hours at the NYMEX are from 10 a.m. to 2:30 p.m.
(14:30) eastern time. After-hours futures trading takes place electronically via
NYMEX ACCESS, an Internet-based trading platform, beginning at 3:15 p.m.
Monday through Thursday and concluding at 9:50 a.m. the following day. On
Sundays, the session begins at 6 p.m.
Reviewing your plan of attack
After you come up with a plan, review it just to be on the safe side.
Here’s what you’ve accomplished:
You were attracted to the oil market (the right one for you) because it’s
where the action is. You understand the oil market, so it’s okay to trade it.
You’ve figured out the technical side of the trade, and you’ve identified
the catalyst for the trade, the news of Venezuela’s spat with Exxon Mobil.
You’ve waited patiently for the right setup.
You’ve calculated your risk, and you’ve decided on your entry point and
your sell-stop placement.
Part V: The Trading Plan
328
28_287224-ch20.qxp 5/27/08 11:03 PM Page 328
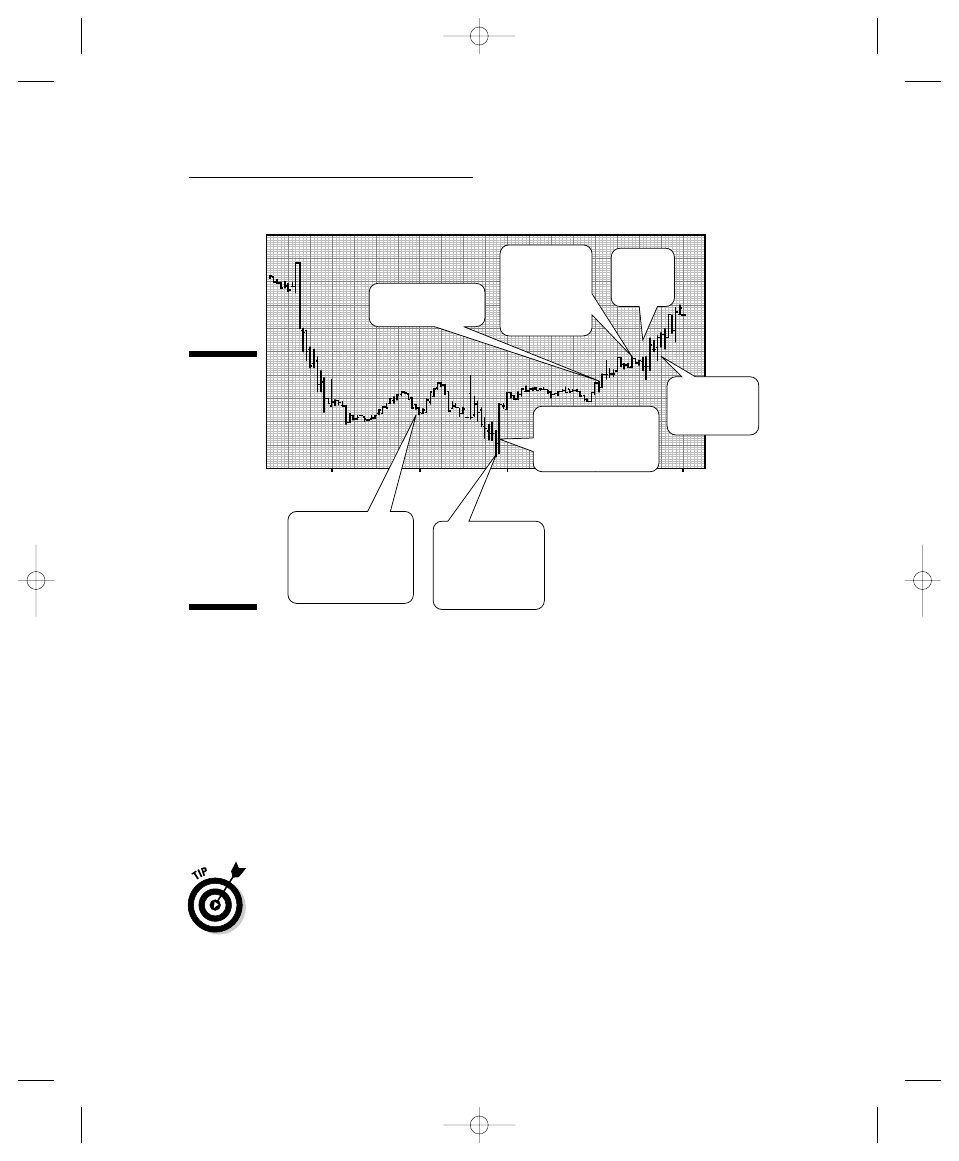
Jumping on the Wild Beast:
Calling In Your Order
As more traders come in, you see that the action is heating up, so you decide
to make your trade because the price is moving swiftly toward your entry
point of 90.55.
You have good trading software, but you decide to call your broker because
she’s been good about giving you good fills, and the guys at the trading desk
are good at making sure that you, as a fairly young trader, get the kind of
order that you want executed.
So you place the call, using all the correct language. Here’s a good template
to follow when calling in an order:
1. Say who you are.
“This is Tom Smith.”
2. Say what kind of order you’re placing.
“This is a futures order.”
62.5
63
64.5
65
65.5
66
66.5
67
67.5
02:30
19
CRUDE OIL OCT 2005 . . 30 minute OHLC plot
14:30
17
02:30
18
14:30
18
14:30
19
Prices remained
higher overnight.
Put in your
trade 15
minutes into
the regular
season.
Put in
second
order
Raise your
stop as the
market rallies.
Buyers step into the
market and drive
prices higher.
Crude oil breaks
below $63.50 and
finds final support
at $62.75 before
rallying.
$63-$63.50 is a key
short term support
level, as prices
stopped falling
in this area.
Figure 20-2:
A 30-minute
chart for
crude oil for
Aug. 17–19,
2005, zooms
in on
the action
shown
in less
detail on
longer-term
charts like
Figure 20-1.
329
Chapter 20: Executing Successful Trades
28_287224-ch20.qxp 5/27/08 11:03 PM Page 329
3. Give your account number.
“My account number is 8648642.”
4. In a clear voice, say what you want done.
Buy one October crude oil, $89.05 stop.
5. Ask for a reading of your order before you agree to have it sent to
the floor.
The desk usually does this automatically, but it doesn’t hurt to remind
the person with whom you’re working that you need confirmation.
If for any reason you’re unsure about your order or unsure whether the desk
understood it, make sure that you either cancel it or confirm that the trading
desk person knows exactly what you want to do.
You just told the trading desk that you wanted to buy one October crude oil
contract at the market price and that you wanted to place a sell stop at
$89.05. The desk reads the order back to you, and you agree. The order then
gets transmitted to the trading floor, and the desk informs you that you’re
filled at $90.75 and gives you your order number.
If you had wanted to keep the order active indefinitely, you would have told
the trading desk that it was a good-’til-canceled (GTC) order. If you’d wanted
to make it a limit order, you would have specified the limit. The fact that you
didn’t make the order a day order, which would be canceled at the end of the
day, makes it a market order, so the point is not that important here. See
Chapter 3 for more details about the different types of orders.
When you open an account with a broker, the broker sends you detailed
information about how to place orders and what the correct language is.
Some have special trading desks for new and inexperienced traders. Most
futures brokers are fully aware of the fact that they need your business and
will do everything they can to make your life as easy as possible short of
guaranteeing that you’ll make money.
Riding the Storm
As the day progresses, the market continues to move and it closes at $91.62.
You have some gains after all that waiting — hurrah! And you’re still pro-
tected by your stop. Now, you raise your stop to $89.92, just slightly below
the gains you made,. As the regular trading close nears, the market is rallying
even more, so you raise your stop to $65, and you’re nicely ahead now, with a
Part V: The Trading Plan
330
28_287224-ch20.qxp 5/27/08 11:03 PM Page 330

guaranteed paper profit of $870 per contract if your stop gets hit without a
major catastrophe that knocks prices below your sell stop in a gap. A good
rule of thumb in a market that is moving rapidly is to raise your stop by 50
cents for every 50-cent rise in the market. If you make more than 50 cents,
you can raise your stop more. Although I’m giving you guidelines here, the
more you trade and the more you become familiar with the way each individ-
ual market trades, the more likely you’ll develop your own guidelines. The
message here is that as the market rises, you need to raise your sell stop to
lock in gains.
Now you have a decision to make. Your overall profit is $870 at the close on a
Friday. Your options prior to the close are
Selling your contract and reentering the market on Monday: This
strategy makes sense because you never know what’s going to happen
over the weekend.
Tightening your stops: This strategy can get you stopped out of the
market, which means that your sell stop is triggered, your position is
closed, and you’re out of the market. That would be good if the market
crashed or lost ground, and it may cost you some money if you no
longer have a position and the market rallies again. Remember, you want
to let your profits run.
Knowing If You’ve Had Enough
Presented with the two trading options in the preceding section, I’d choose
to leave the position open and see what happens during the weekend. I’m
a cautious trader, and I don’t like leaving large positions open during the
weekend. But, the rally was very strong, and the Exxon news looked as if it
had legs.
By managing my sell stop, I’d accomplish two things. First, I would have
locked in my profits on a good trade, and second, I’d leave myself with a rea-
sonable and tolerable risk over the weekend, with the potential to gain more.
By February 19, prices had moved nicely and the price of crude was getting
close to $100, a price area that would likely lead to volatility, given the
inevitable hype from the media.
On that day, as the price of crude jumped over $4 by the close, there was
plenty of opportunity to sell. If you sold somewhere above $99, say $99.25
you bagged $8.50 in profits, or $8,500 minus commissions per contract.
331
Chapter 20: Executing Successful Trades
28_287224-ch20.qxp 5/27/08 11:03 PM Page 331

Reviewing Your Trade
After your trade is completed, you need to review what you did right and
what you did wrong. One way to conduct such a review is to answer these
questions:
Was this market the right one for me to trade? If you understood the
fundamentals and you knew that the action was here, then you traded
the right market.
Should you have bought into this market sooner? More than likely your
answer is no. By waiting for the right setup, and managing your sell
stops, you had a fantastic trade.
Did you risk the right amount? You followed your own rules by risking
no more than 10 percent of your total equity in one market, and you
used the right amount of protection as you set your stops. Best of all,
you profited.
Were you patient enough? Yes, indeed. You didn’t jump into the market
until you were convinced that the odds of a bounce back to the top of
the range were on your side. Then you waited until the trend was clearly
established before adding to your position, and you raised your stops at
a steady and patient pace.
Mastering the Right Lessons
The trade outlined in this chapter probably is a good prototype for a beginning
trader. I tried to make it easy to relate to and used easy-to-follow indicators.
This example is as much about approach as it is about the tools traders use.
You can make trading as simple or as sophisticated as you want, but in the
end, the only thing that counts is whether you make or lose money by using
those tools.
Other books may offer different approaches, and as you gain more and more
trading experience, you’ll develop your own methods. Nevertheless, at the
end of the day, trading is all about knowing your market, setting up your
strategy, being patient, executing your trading plan, managing your position
properly through vigilance, and following your strategy as well as the market
will enable you to.
Finally, remember that a two- or three-day time frame in the futures markets
can be a profitable time if you understand how to trade for short periods of
time and how to use technical analysis.
Part V: The Trading Plan
332
28_287224-ch20.qxp 5/27/08 11:03 PM Page 332
Part VI
The Part of Tens
29_287224-pp06.qxp 5/27/08 11:04 PM Page 333

In this part . . .
G
et ready to put the final touches on your newfound
trading abilities. Rules, resources, and strategies are
good, but they’re a whole lot better when you can use
them. That’s what this part is all about. I give you a com-
prehensive and detailed set of concepts and ideas to help
you put it all together and fill in any gaps that may have
formed. In this part, I take you through ten or so killer rules
and must-know hedging strategies with two goals in mind:
keeping you solvent and showing you how to survive and
thrive as a trader. Don’t skip this part!
29_287224-pp06.qxp 5/27/08 11:04 PM Page 334

Chapter 21
Ten Killer Rules to Keep
You Sane and Solvent
In This Chapter
Relying on chaos, capital, and patience
Putting your trust in the trends, charts, and diversification
Going small with losses, trades, and expectations
Getting real about trading goals, and knowing your limits
T
rading is 90 percent head games and 10 percent money. If your head isn’t
screwed on straight, you’re going to lose a lot of money in a hurry. So in
this chapter, I help you keep the old noggin atop your shoulders by providing
you with a road map to ten of the best trading rules I’ve discovered during
my 17 years of trading. These rules can help you keep your mind and money
where they’re supposed to be — between your ears and in your pocket,
respectively.
Trust in Chaos
Chaos theory rules the markets. By definition, chaos is nonlinear order. In
other words, what some describe as random actually is orderly in its own
peculiar way. Look at the basic tenets of chaos, and then look at a market
chart. It isn’t hard to see a connection.
Prices follow a nonlinear order. They tend to stay within defined channels or
trading ranges. When they rise above or below the range, they enter an area
of disorder, but when they enter a new price range, they go up, down, or side-
ways, again seeking and eventually finding nonlinear order.
30_287224-ch21.qxp 5/27/08 11:04 PM Page 335
Big money can be made when you figure out how to spot the limits of chaos
and the transitions from chaos to disorder and back to chaos. By making this
concept the basis of your trading, you’ll find that working the market is much
easier than buying and holding something forever, hoping its price goes up,
and much better than having the market work you or (more precisely) work
you over.
When you trade with chaos as your guide, you find it easier to accept that the
market will do whatever the market wants to do and that your job is to do
your best to be on the profitable side (the right side) of the trade and to cor-
rect your mistakes as soon as you can.
Avoid Undercapitalization
If you don’t have enough money, don’t trade, period. It’s as simple as that.
Many people open futures trading accounts with $5,000 and lose half of it
within a month only to run with their tails between their legs back to some-
thing safer. I know. That’s what happened to me the first time I tried to trade
futures.
How much money do you need? Most pros say that you need $100,000 mini-
mum to open a futures trading account. If you whittle at them long enough,
they’ll come down to $20,000 to $50,000, but few will tell you that you need
anything less than $20,000.
More important is the fact that your $20,000 to $100,000 needs to be money
that you can afford to lose.
Why do you need so much money? Bluntly, it needs to last long enough for
you to endure all the bad trades until you can finally make a good trade that
makes you plenty of money.
Be smart with your money. Don’t be one of those fools who maxes out his
home equity just to be able to trade oil futures. Sure, you may get lucky and
make it work, but the odds truly are against that. You can lose your money,
and you’ll probably lose your spouse, your family, your home, and your shirt.
Be Patient
The two times when you need patience in the financial markets are when
you’re becoming a good trader and finding good trades.
Part VI: The Part of Tens
336
30_287224-ch21.qxp 5/27/08 11:04 PM Page 336
The problems with today’s markets are that you have access to so much
information that you can fool yourself into believing that you must trade all
the time. That can get you into big trouble.
In fact, trading for the thrill of it, or because you’re bored, is a recipe for dis-
aster. I can remember periods where I didn’t trade for days or weeks at a
time. These periods of market inactivity occur more often as I develop my
trading skills. When I first started, I overtraded, and I paid the price for it.
Luckily, I don’t make my entire living by trading and can afford to take my
time picking and choosing the right times to trade.
Exercising this kind of patience can be to your advantage, too, because you
can pick and choose when and how you trade.
Take time to think about your trading life. Some tough choices await you. Here
are some important questions to ask before you jump in to the chaotic fray:
How much of my livelihood do I intend to make by trading futures and
options?
How much time am I willing to put into analyzing the markets to improve
my chances of delivering profits consistently?
How much money am I willing to spend to educate myself and obtain a
good trading setup?
How long will I give myself to fully develop my trading talents?
When will I trade?
Trade with the Trend
Investors are obsessed with the fundamentals. Futures trading isn’t investing;
it’s speculating, so you need to be interested in technical and fundamental
analyses. But the key here is that technical analysis tells you the direction in
which the market you’re trading is headed — how it’s trending — and that’s
something you need to know from the get-go.
When trading futures, the market trend, your time frame, your entry and exit
points, and the protection of your capital in between are all that matter. If
preservation of your capital jibes with the fundamentals of the market and
you make money, you can take a few minutes to celebrate and then go right
back to worrying about the following:
Keeping an eye on your charts
Following your trading rules
337
Chapter 21: Ten Killer Rules to Keep You Sane and Solvent
30_287224-ch21.qxp 5/27/08 11:04 PM Page 337
When trading with the trend, never lower your sell stops just because you
think the market will turn around and that you were too tight in setting them.
Likewise, when selling short, never raise your stops if the market starts going
against you.
Believe in the Charts, Not
the Talking Heads
The ultimate truth about trading is the price action. Few sources offer a
better view of price action than price charts, especially in the fast-moving
world of the futures markets.
Opinions are numerous. Some are going to be right; some are going to be
wrong. However, the majority of commentators have their own self-interest in
mind. In other words, their goal is to look good in front of the camera or in
print so they can keep their jobs. If they traded, they wouldn’t have time to
talk so much or to write reports.
That isn’t to say that when I’m on CNBC, I won’t be giving you the benefits of
my experience, though, or that CNBC and other television channels don’t pro-
vide access to good guests and good timely information. My point is that you
always need to look at all information through the jaded eyes of a trader, and
that means looking at the market’s response to a story or an opinion and
trading on what the market is doing, not on what the story is telling you.
Remember, Diversification Is Protection
In the stock market, diversification means spreading your risk among a large
number of stocks and asset classes. Asset allocation models therefore have
become quite handy. An asset allocation model is just a way to divide your
investment portfolio and is often depicted as a pie chart. A common asset
allocation model calls for a 60 percent exposure to stocks, a 35 percent allo-
cation to bonds, and a 5 percent allocation to cash.
In the futures markets, however, diversification is different. It has more to do
with how much cash you have on hand and how you allow seasonal tenden-
cies of the market to affect your trading. Futures diversification boils down to
your ability to manage your capital, your time, and your experience.
Part VI: The Part of Tens
338
30_287224-ch21.qxp 5/27/08 11:04 PM Page 338
If you have more than one or two positions open at the same time in the
futures market, you may find yourself in a dilemma because you have a hard
time keeping up with what’s happening when the markets move so fast. The
way to get around this problem is to limit the number of markets that you
trade at any one time. For some of us, it’s one, or maybe two. Much depends
on which markets you develop a knack for trading as you progress.
Limit Losses
Limiting your losses while trading is a simple rule that should make sense,
but it’s a rule that bears repeating. The 5 percent rule is commonly used by
traders and is easy to see and remember. Don’t risk any more than 5 percent
of your trading capital on any given position, and limit your losses to 5 per-
cent of the value of any given trade.
Get used to limiting your losses early on in your experience so you become
disciplined in your approach to trading.
For a futures trader, a 5 percent loss is probably as much as you’ll ever want
to handle. If you’re day trading, you can use period moving averages to iden-
tify where to place your stop-loss orders.
Make it a rule never to get a margin call. You’ll sleep better.
Trade Small
Trading small goes along with limiting your losses. But above all else, trade
within your means. If you have $5,000 equity, which is way too little to think
about trading futures, you should never trade contracts that require a $5,000
margin. A bad day can wipe out your entire equity position, and you’ll soon
be getting a margin call.
For most beginning traders, trading one or two contracts at a time is a good
rule of thumb. If you’re trading crude oil, your margin is somewhere near
$7,100 per contract, which means that, in a perfect world, you need to have
at least $142,000 total equity to be able to trade one contract. See the previ-
ous section about how much to risk in any particular market. Your loss limit
from that starting point is $355, or 5 percent of $7,100. See the preceding sec-
tion with regard to limiting losses to 5 percent. (Check out Chapter 3 for more
about margins and the futures markets.)
339
Chapter 21: Ten Killer Rules to Keep You Sane and Solvent
30_287224-ch21.qxp 5/27/08 11:04 PM Page 339

A perfect, or nearly perfect, contract for small accounts is the Chicago
Mercantile Exchange (CME) E-mini Eurodollar contract. Margins for the
Eurodollar contract tend to be less than $1,500 per contract, so you’re
thus at least closer to following the 5 percent rule.
Have Low Expectations
Most good traders are right a third of the time on average and half of the time
during periods when they’re hot. The way you stay in business is to manage
your money so that you cut losses short.
Good traders are masters of the low-expectations game. That’s where you
think that if you come out even or a few bucks short, it’s a good day. Pros
readily admit they tend to make a lot of trades just on either side of breaking
even. Known as scratch trades, they’re the most common experience that
you’re likely to have while trading futures.
Having enough money and the sense to be able to continue to trade are key.
The longer you stay in the game, the greater your chances of making the
occasional big trade.
Set Realistic Goals
After you become well funded, develop a good money-management system,
and set your expectations at the right level. The next step is to set realistic
goals.
Here are a couple of ideas:
Some pros shoot for a three-to-one reward-to-loss ratio. If you choose
this strategy, that means when things are going well, your goal is to
double your money twice over, while (of course) setting prudent stops
and managing your money correctly.
Take profits when you’ve made 20 percent. I like to take at least partial
profits when I make 20 percent on anything. In futures trading, applying
this rule is not always possible when you have only one contract,
because commissions and fees can eat away at the profit. However, my
20 percent rule works well in the stock market, when I’m trading several
hundred shares of stock.
Part VI: The Part of Tens
340
30_287224-ch21.qxp 5/27/08 11:04 PM Page 340

Chapter 22
More Than Ten Additional
Resources
In This Chapter
Exploring futures through government and general-information Web sites
Knowing the commodity exchanges
Reading more books about trading
Checking out the newsletters and magazines
I
f you’re going to trade on your own, you need some help, at least in the
way of information, so you can apply what you’ve discovered in this book
and in your newfound experiences with trading futures.
Literally hundreds of Web sites and publications deal with trading futures.
This chapter lists and describes some of the more reliable information
sources. Although the list may not be large, it is full of useful Web sites,
books, and other sources of information that can actually help you become
a better trader.
Government Web Sites
The Web sites of the Commodity Futures Trading Commission (CFTC —
www.cftc.gov
), the United States Department of Agriculture (USDA —
www.usda.gov
), and the Board of Governors of the Federal Reserve System
(
www.federalreserve.gov
) are useful in their own ways. If you’re a data
hound, there’s no better place to look than the St. Louis Fed’s Web site
(
http://stlouisfed.org/default.cfm
).
31_287224-ch22.qxp 5/27/08 11:05 PM Page 341

The CFTC Web site is a great resource for reviewing trading laws and
regulations and finding out what kind of recent advisory rulings have
been handed down. When laws and regulations change, your trading can
be affected. These changes can affect anything from higher fees to what
you can and can’t trade under certain circumstances.
The USDA Web site runs the gamut from important crop and livestock
reports to vital weather information. The USDA site can be of great use
to you when you trade commodities.
The Federal Reserve Web site offers the Fed Beige Book, a great sum-
mary of where the Fed thinks the economy has been and is headed. The
Beige Book is the Fed’s road map for interest rates, and it sets the stage
for much of the action in the bond and stock markets.
The St. Louis Federal Reserve Bank Web site is full of charts and statis-
tics that I like to use when I’m doing my history homework, such as
when I want to see a chart of interest rates for the last several years.
This site is also different from the Fed’s main Web site in that it has a
more news-oriented, less-academic feel to it.
General Investment Information
Web Sites
In this section, I list several important Web sites that can serve as libraries of
information about trading futures, options, and other securities and financial
instruments. Some of these sites require a fee; others don’t. I like them all and
visit them regularly.
The “Economy” section of Wall Street Journal.com: This section of
the Wall Street Journal’s Web site is one of my favorites. It’s an excellent
resource for catching up on the big picture before you trade. The edito-
rial content is first class, but for a futures trader, the best part is the
data library, where you can find charts that chronicle the major eco-
nomic indicators and enable you to perform a good visual inventory of
economic activity.
Investor’s Business Daily’s “The Big Picture” column: This is a great
resource for getting a fix on the overall trend of the stock market. This
column can help your timing of stock index futures as it features clear
and easy to understand analysis of when the stock market changes its
major trend, up or down. This is a subscription service which has an
excellent digital web site (
www.investors.com
), which I highly recom-
mend and use on a daily basis.
Part VI: The Part of Tens
342
31_287224-ch22.qxp 5/27/08 11:05 PM Page 342

Marketwatch.com’s “Commodity Summary” (
marketwatch.com
): This
summary provides a great overview of the commodities markets, usually
with a pretty heavy emphasis on oil. The best part: It’s free, but it works
better if you register.
Reuters.com (
reuters.com
): Another excellent free news site, I espe-
cially like to check out Reuters early in the morning because it offers
good summaries of the overnight markets.
Barchart.com (
barchart.com
): The most complete Web-based charting
service specializing in the futures markets, Barchart.com offers real-time
data to subscribers, but its delayed data and charting are excellent for
beginners who are trying to get a grip on the knowledge part of trading
before they move on to the real thing.
CandlesExplained.com (
candlesexplained.com
): This free site is from
Greg Morris, the author of Candlestick Charting Explained (McGraw-Hill).
It’s a good site for anyone who wants an online review or a quick refer-
ence to candlestick charting beyond what’s available in this book.
FX-charts.com: You can find free, real-time, foreign exchange charts at
www.fx-charts.com/pgs/toolbox_livecharts.php
. This is a great
place to get a good feel for real-time charts in the currency market. The
charts also have indicators that you choose, including the ability to
draw your own trend lines.
Joe-Duarte.com (
www.joe-duarte.com
). Sure, this seems like self-
promotion, but it’s not. If you like what you read in this book, what a
better place to get more of the same as well as clarifying any doubts that
you may get from time to time. I offer a good deal of market timing infor-
mation, especially using ETFs for trading energy, stock indexes, and cur-
rencies. It is a paid subscription site, but also offers a good deal of free
information.
Commodity Exchanges
The Web sites of the Chicago Mercantile Exchange (CME
www.cme.com
), the
Chicago Board of Trade (CBOT
www.cbot.com
), and the New York Mercantile
Exchange (NYMEX
www.nymex.com
) are excellent resources, especially for
beginning traders.
All three exchanges provide excellent overviews of the commodities that
trade within their jurisdictions, margin requirements, and delayed charting.
343
Chapter 22: More Than Ten Additional Resources
31_287224-ch22.qxp 5/27/08 11:05 PM Page 343

Trading Books
Very few high-quality trading books about the futures markets are available,
given the public’s major interest in stocks. Here is a good sampling of some of
the better books that I’ve run across:
Trading Commodities and Financial Futures (Financial Times-Prentice
Hall, 2005) is written by George Kleinman, an author with a pure trader’s
mind-set. It offers an excellent step-by-step guide into the analysis and
execution of trading.
Starting Out in Futures Trading, 5th Edition, by Mark J. Powers (Probus
Publishing, 1993, largely out of print) offers a trader’s point of view,
moving between an analyst’s and an academic’s perspective on the
futures markets. You can find used copies at very low prices online.
The Murphy triad: Author John Murphy has compiled and written what
some consider a classic trilogy of technical analysis in these three tomes:
• Technical Analysis of the Financial Markets: A Comprehensive Guide
to Trading Methods and Applications (New York Institute of Finance,
1999)
• Intermarket Analysis: Profiting from Global Market Relationships
(Wiley, 2004)
• Technical Analysis of the Futures Markets: A Comprehensive Guide to
Trading Methods and Applications (New York Institute of Finance,
1983)
Candlestick Charting Explained by Gregory L. Morris (McGraw-Hill, 1995)
is the easy-to-read-and-use bible for candlestick charting. No trader
should be without this one in his or her library.
Technical Analysis For Dummies by Barbara Rockefeller (Wiley, 2004) is a
pretty good reference book that can be a companion to this book. It
offers excellent tutorials for beginners, and it’s a great read for building
a base for more complex fare, such as Murphy’s triad.
Currency Trading For Dummies by Mark Galant and Brian Dolan (Wiley,
2007) is another excellent entry-level book that offers the basic princi-
ples of trading, not only in great detail but also in an easy-to-digest style.
This book is great for someone who is interested in trading but isn’t
quite ready to delve into it.
Reminiscences of a Stock Operator by Edwin Lefevre (Fraser Publishing,
1980) is the classic trading book. Although it deals with the stock market
during a different era, no other book that I’ve ever read captures the
spirit of speculating better. At the heart of it, this book is about cutting
losses at small levels and letting winners run.
Part VI: The Part of Tens
344
31_287224-ch22.qxp 5/27/08 11:05 PM Page 344

Newsletter and Magazine Resources
Many futures publications are available, and many of them can be accessed
on the Internet. A few, though, have been around long enough to have
become quite reliable, including the following:
The Hightower Report (
www.futures-research.com
): As Fred Sanford
of Sanford & Son used to say, “This is the big one, Elizabeth.” The
Hightower Report is the most widely circulated futures newsletter in the
United States, and it covers the entire futures complex.
Consensus National Futures and Financial Weekly (
www.consensus-
inc.com
): This subscriber-supported service, whose major calling card
is its weekly sentiment index, provides a poll of bullish and bearish
investors on all commodities and futures, from interest rates to energy
and livestock.
Futures Magazine (
www.futuresmag.com
): The name says it all; it’s the
monthly bible of the industry covering all aspects of the trade.
Technical Analysis of Stocks & Commodities (
www.traders.com
):
This magazine is written by traders, and it’s where I got my start as a
writer and an analyst. It’s a good resource to scan regularly for good
trading ideas.
Active Trader: Similar to Technical Analysis of Stocks and
Commodities: This publication tends to offer more about short-term
trading.
345
Chapter 22: More Than Ten Additional Resources
31_287224-ch22.qxp 5/27/08 11:05 PM Page 345

Part VI: The Part of Tens
346
31_287224-ch22.qxp 5/27/08 11:05 PM Page 346

•
Numbers
•
9/11 attacks
impact on economy, 29
impact on energy bull market, 227–229
10-year interest futures, trading, 180–183
20-day moving average, explanation, 115
30-year interest futures, trading, 180–181
50-day moving average, example, 114
100-day moving average, explanation, 115
200-day moving average example, 114
1987, stock market crash, 205
1987-2007 Fed time line, 29
• A •
activist protests, monitoring, 158
agricultural markets
considering crop years, 281–283
Deliverable Stocks of Grain, 288
influences on, 279–280
pollination risks, 289
reports, 287
risk premiums, 289
supply versus demand, 282
terminology, 287
trading, 290
using ETFs (exchange-traded funds), 281
airlines, considering as hedgers, 41
API (American Petroleum Institute), weekly
reports, 233
arbitrage, rules, 202–203
Asian currency crisis, occurrence, 29
at the money, definition, 57
at-the-money call
delta value, 58
gamma value, 60
averaging down, advisory, 318
• B •
back testing
definition, 116
trading strategies, 318–319
balance of trade report, using, 98
balance sheet, calculating net worth,
309–310
bands. See trading bands
bank reserve management system,
using, 27–28
bar charts
versus candlestick charts, 110
description, 107
using, 108
Barchart.com
charting for cattle futures, 266
open interest feature, 151
Web site, 104
base charting patterns, analyzing, 111–113
bear market
definition, 49
in oil, 235–236
oil supply, 97
U.S. dollar post 9/11, 228
bearish candlestick, description, 108–109
bearish open interest, explanation, 153
beef prices, impact of mad cow disease
on, 270
Beige Book report
availability, 84
release, 94
using, 92–94
Bernanke, Ben, 30, 36–37
Black-Scholes model, goal, 62
Bollinger bands
overview, 131–134
stock-index futures contracts, 217
trading with, 133–134
Index
32_287224-bindex.qxp 5/27/08 11:07 PM Page 347

Bollinger bands
(continued)
versus trend lines, 134
using with other indicators, 133–134
watching for crude oil, 326
watching for oil market, 324
bond markets
arbitrage, 202
versus Fed, 165–166
impact of economic reports on, 98
impact of inflation on, 165
impact on Fed decisions, 223
versus stock market, 99
bond portfolio, using stock indexes
with, 213
bonds
buying by Fed, 36–37
calculating amounts of, 309
trading, 180–183
boom and bust cycles, time between, 28–29
borrowing money, trends, 23, 38
bottom
anticipating, 149
versus base, 112
Brady Commission, 42
Brazil, importance, 20
breakaway gap, explanation, 119
breakdowns
anticipating for selling short, 141
occurrence, 117
breakouts
buying, 139
occurrence, 116–117, 138
selling and shorting in downtrends,
140–141
brokerage account, minimum deposit for,
43–44
brokers
full-service versus discount, 300–302
using, 296
budget, preparing, 307
budget status, impact on currency
values, 187
building permits report, example, 95
building versus drawing down energy
inventories, 233–234
bull market
in 21st century, 16
commodities, 72
definition, 49
in energy post 9/11, 227–229
first stage of, 145
impact on bonds, 98–99
oil, 245
sentiment in, 145
bullish crossover, occurrence, 127
bullish engulfing pattern, example, 120
bullish open interest, explanation, 153
business assets, calculating
amounts of, 309
business cycle, definition, 28
business report, using, 90–91
bust and boom cycles, time between, 28–29
buy orders, using resistance lines with, 113
• C •
call and put, buying, 215
call options
buying, 64
delta number, 58
explanation, 55–56
option writing, 64
candlestick bars, changes in size, 111
candlestick charts
advantages, 108–111
versus bar charts, 110
description, 107
doji patterns, 109–110
lower and upper shadows, 109
real body, 108
resource, 121
using, 108
candlestick patterns
engulfing, 120–121
example, 114
hammer, 121–122
hanging man, 121–122
harami, 122–124
variety, 123
capital gains, blending by IRS, 207
cash, calculating amount of, 309
348
Trading Futures For Dummies
32_287224-bindex.qxp 5/27/08 11:07 PM Page 348

Cash Index (S&P 500), consulting, 213–214
cash settlement, S&P 500 Index, 210
cattle, accumulation and liquidation
phases, 266
cattle business
breeding process, 268
CME live cattle contract, 269–270
cow/calf operation, 267
feeder cattle contract, 269
packing plant, 268
cattle futures, charting resource, 266
Cattle Inventory Report, description, 274
cattle market
seasonal cycles, 271
technical analysis, 272
trading strategies and rules, 272
Cattle-on-Feed Report, consulting, 273
CBOE (Chicago Board Options Exchange),
45, 66, 154
CBOT (Chicago Board of Trade), 46,
168, 286
central banks
creation of money by, 27
versus Federal Reserve, 26
function, 30–31
gold sales by, 248–249
impact of actions on gold market,
251–252
purpose, 28
Certified Trading Advisors (CTAs)
choosing, 298–299
using, 296–298
chaos theory, impact on markets, 335–336
chart formations, interpreting, 323–324
chart patterns
bases, 111–113
head-and-shoulders, 116–117
limitations, 102
preparing for use of, 111
chart reading, guidelines, 103–104
chart types
bar, 107
candlestick, 107
charting services
Barchart, 104
choosing, 105–106
fees, 105
charting versus technical analysis, 103
chartist, definition, 82
charts
gaps and triangles, 118–119
interpreting with indicators, 126
monitoring divergence in, 261
organizing and monitoring, 260–261
reviewing after trades, 321
as tick-by-tick history, 102
trusting, 338
Chicago Board of Trade (CBOT), 46,
168, 286
Chicago Board Options Exchange (CBOE),
45, 154
Chicago exchanges, examples, 45–46
China phenomenon, 16–17, 35
Chinese economy, impact on copper
market, 258
circuit breakers
implementation of, 42
versus price limits, 209
climate change, impact on agricultural
markets, 279
CLZ5 and Exxon, RSI (Relative Strength
Indicator), 236
CME (Chicago Mercantile Exchange),
46, 266
coffee, trading, 290–291
Cold Storage Report
description, 274
example, 275–276
collar rule, S&P 500 Index, 209–210
commodities
bull market, 72
tendendies, 33
trading on CME (Chicago Mercantile
Exchange), 46
trading on NYBOT (New York Board of
Trade), 47
trading through ETFs, 281
commodities column, consulting in
MarketWatch.com, 233
commodity ETFs, resource, 68
commodity markets
actions related to, 22, 37–38
rise of, 23
commodity versus fiat money, 27
349
Index
32_287224-bindex.qxp 5/27/08 11:07 PM Page 349

computer requirements, 12
Conference Board survey
components, 91–92
Index of Leading Economic Indicators,
95–98
congressional investigations, monitoring,
158
consolidation, occurrence, 149
Consumer Confidence Report, using, 87,
91–92
Consumer Price Index (CPI) report, using,
89–90
contrarians, trading habits, 144, 158
conversion factor, definition, 181
copper
ranked use of, 254
trading strategy, 255–256
uses, markets, and contracts, 255
copper futures, charting, 256–260
copper market
impact of Chinese economy on, 258
as indicator, 248
monitoring charts, 260–261
copper stocks versus copper futures, 261
corn
versus soybeans, 288–289
use for ethanol, 267
corn futures, components, 286
corporate treasurers, hedging activity, 167
cow/calf operation, explanation, 267
CPI (Consumer Price Index) report, using,
89–90
crashes, effects of, 42
credit, tightening by Fed, 28
credit markets, calming, 36
credit-card balances, calculating amounts
of, 309
credit-card rates, raising, 165
crop risks, effect on markets, 289
crop years, considering in agricultural
markets, 281–283, 288
crops, influence of weather on, 282–283
crossover, negative versus positive, 128
crossrates
arbitrage, 202
calculating, 189–190
watching for Swiss franc, 201
crude oil
versus gasoline, 239
light, sweet, 237–238
moving averages and buy points, 327
crude oil contracts
components, 238
performing technical analysis, 326
crude oil futures
characteristics, 232
impact of Hurricane Katrina on, 241
reviewing, 328
crude oil, stockpiling, 97
CTAs (Certified Trading Advisors)
choosing, 298–299
using, 296–298
currencies. See also forex (foreign
exchange)
buying and selling on spot market, 189
ETFs (exchange-traded funds), 74–75
euro against dollar, 199
impact of news events on, 202
Japanese yen, 200
locations for trading, 189
nuances, 194
pairings, 188
Swiss franc, 201
tracking with long-term charts, 192, 194
trading, 189
trend changes, 193
trends, 191
UK pound sterling, 200
currency markets, counter-trend moves,
193
Currency Shares EuroTrust (FXE),
description, 75
currency trading
hardware and software, 194–195
timing, 203
currency values, influences, 186–187
• D •
Dallas Fed district, Beige Book publication,
93
day trading, 319
DBA (PowerShares DB Agriculture Fund)
ETF, description, 74
350
Trading Futures For Dummies
32_287224-bindex.qxp 5/27/08 11:07 PM Page 350

DBB (PowerShares DB Base Metals Fund)
ETF, description, 74
DBC (PowerShares DB Commodity Index
Tracking Fund) ETF, description, 73
DBE (PowerShares DB Energy Fund) ETF,
description, 72–73
DBP (PowerShares DB Precious Metals)
ETF, description, 74
DCR (Macroshares Oil Down Tradeable
shares) ETF, description, 73
DDM (Ultra Dow 30 ProShares) ETF,
description, 71
delta values
determining for options, 58–59
versus gamma, 60
demand versus supply. See supply versus
demand
DGL (PowerShares DB Gold Fund) ETF,
description, 74
DIA (Diamond Shares) ETF, description, 71
Diamond Shares (DIA) ETF, description, 71
discount, trading stock-index futures at,
208
discount rate
adjustment by Fed, 164–165
lowering, 36
diversification, as protection, 338–339
DOG (Short Dow30 ProShares) ETF,
description, 71
doji patterns
dragonfly, 109
gravestone, 110
plain, 109
dollar. See U.S. dollar
dot.com boom, 29
double top, occurrence, 235
Dow Jones Industrial Average ETFs, 71
Dow Jones Newswires, consulting, 233
downtrends
base at bottom of, 112–113
euro, 128
selling and shorting breakouts in, 140–141
trend lines in, 135
drawdown, impact on oil supply, 97
drawing down versus building energy
inventories, 233–234
Drudge Report, scanning for soft sentiment
signs, 157
DXD (UltraShort Dow30 ProShares) ETF,
description, 71
• E •
ECB (European Central Bank)
versus Fed, 19, 30
mandate, 30–31
economic calendar, definition, 86
economic reports
balance of trade, 98
Beige Book, 92–94
Consumer Confidence, 91–92
consumer confidence numbers, 84–85
CPI (Consumer Price Index), 89–90
employment, 87–88
GDP (Gross Domestic Product), 96–97
housing starts, 94–95
Index of Leading Economic Indicators,
95–98
oil supply data, 96–97
PPI (Producer Price Index), 88–89
release, 86
Report on Business, 90–91
sources, 84–87
trading based on, 98–99
using, 85–86
economic sectors, researching, 93–94
economic variables, dominance, 16
economy
components, 83
versus oil prices, 225–226
EIA (U.S. Energy Information Agency),
weekly reports, 233
electronic brokerages, choosing, 194–195
Electronic Brokering Services (EBS) Web
site, 195
electronic spot trading
compiling charts, 191–194
overview, 190
emergency fund, prioritizing, 307
e-mini contracts
definition, 47
ES (S&P 500), 211
NQ (NASDAQ 100), 211
351
Index
32_287224-bindex.qxp 5/27/08 11:07 PM Page 351

employment report, components, 87–88.
See also job growth, impact
energy
bull market post 9/11, 227–229
versus oil, 222–223
seasonal cycles, 232
weekly cycle, 233
energy futures, beginning of trading in, 222
energy inventories, building versus
drawing down, 233–234
energy market ETFs, 72–74
energy markets, sentiment, 244–245
engulfing candlestick pattern, interpreting,
120–121
entry points
reviewing after trades, 321
setting, 142
setting for forex trading, 195–196
equity, risking on trades, 178–179
ES (S&P 500) e-mini contract, popularity,
211
ETF sponsor, management fee, 69
ETFs (exchange-traded funds)
advantages, 198
advisory, 69
appeal of, 67–68
currency, 74–75
Dow Jones Industrial Average, 71
energy market, 72–74
features, 68–69
versus LEAPS (long-term options), 69
metal market, 74
NDX (Nasdaq 100), 71
SPX (S&P 500), 70
trading commodities through, 281
using in long-term trading, 320
using in trading, 75–78
ethanol, use of corn for, 267
euro
Bollinger bands, 132–133
versus dollars, 18
moving averages example, 128
multi-year bull market, 191–192
trading against dollar, 199
Eurobond futures, globalizing, 169–170
Eurodollar contract, margins, 340
euro/dollar pairing, benefits, 314
Eurodollars
initial maintenance margins, 175
margin calls, 179
points and ticks, 175
prices, 175
setting stops for, 177–178
trading, 175–179
trading hours, 175
trading in short term, 172
European Central Bank (ECB)
versus Fed, 19, 30
mandate, 30–31
European economy, decline, 17–19
Euroyen contracts, globalizing, 169
EUR/USD currency pairing, 188
exchange clearinghouse, function, 45
exchange rates. See forex (foreign
exchange)
exchanges, conducting trading on, 44–47
exchange-traded funds (ETFs)
advantages, 198
advisory, 69
appeal of, 67–68
currency, 74–75
Dow Jones Industrial Average, 71
energy market, 72–74
features, 68–69
metal market, 74
NDX (Nasdaq 100), 71
SPX (S&P 500), 70
using in long-term trading, 320
using in trading, 75–78
exit points
reviewing after trades, 321
setting, 142
setting for forex trading, 195–196
expiration date
definition, 57
impact on options, 58
Exxon Mobil
considering as hedger, 41
XOI and OSX indexes, 235–236
352
Trading Futures For Dummies
32_287224-bindex.qxp 5/27/08 11:07 PM Page 352

• F •
fair value, overview, 208
Fed, the
versus bond market, 165–166
buying bonds, 36–37
versus central banks, 26
versus ECB (European Central Bank),
19, 30
functions, 164
goals, 83, 225
increasing money supply, 27
mandates, 30
monitoring monetary policies, 34–35
objectives, 28–30
tightening credit, 28
Web site, 93
Fed Beige Book reports. See Beige Book
report
Fed decisions
impact of bond market on, 223
monitoring, 263–264
Fed funds futures, trading, 168
Fed funds, interest rate adjustments, 164
Fed Funds rate, target, 37
Federal Reserve. See Fed, the
Federal Reserve District Banks,
locations, 92
feed corn, components, 286
feeder cattle contracts, components, 269
feeder cattle futures, example, 272
feeder versus live cattle contracts, 269–270
fiat money
versus commodity money, 27
purchasing power, 28
financial data, organizing, 306–308
financial markets, relating money flows to,
22–23
floor broker, definition, 51
foreign currency, trading, 199–202
foreign exchange rates, internal and
external factors, 186
foreign policy, impact on currency values,
187
forex (foreign exchange). See also
currencies
compiling charts, 191–194
pip, 188
terminology, 188–189
forex trading
OCO (one cancels the other) orders, 196
requirements, 195
setting exit and entry points, 195–196
TPO (take profit orders), 196
fossil-fuel prices, impact on agricultural
markets, 279
France, historical data, 18
front month, definition, 49, 150
futures and options, margins in, 54
futures contracts
appeal of, 41
canceling and closing out, 45
characteristics, 43
checking expiration dates of, 43
consistency of, 45
criteria, 44–45
daily price limits, 43
definition, 39, 54
fair value, 208
types, 39
futures markets
link to spot market, 214
margins, 69
margins in, 51–52
movement, 35
futures traders
profile of, 10–11
success, 11–13
futures trading. See also trading
defining expectations, 304–306, 340
fundamental side, 13
goal-setting, 340
online survey of, 11
requirements, 12
resource, 10–11
technical side, 13
FX charts.com charting program, 106–107
FXE (Currency Shares EuroTrust),
description, 75
353
Index
32_287224-bindex.qxp 5/27/08 11:07 PM Page 353

• G •
gamma number, determining for options,
59–60
gasoline futures contracts
impact of Hurricane Katrina on, 240–242
overview, 238–239
trading strategies, 239–240
gasoline versus crude oil, 239
GBP/CHF crossrate, calculating, 190
GBP/USD currency pairing, 188
GDP (Gross Domestic Product) report,
using, 96
GDP deflator, definition, 32
Germany, historical data, 17–18
globalization, overview, 168–170
Globex trading system, features, 48–49
gold
investing in, 249
producers of, 249
sales by central banks, 248–249
trading, 250–252
gold futures
mini contracts, 251
trading, 251–252
gold market
impact of inflation on, 252
impact of U.S. dollar on, 252
gold prices
factors having impact on, 250
height of, 249
impact of U.S. dollar on, 250
impact of wars on, 252
international benchmark, 250
rise in, 248
government Web sites, 341–342
grain complex
corn, 286
soybeans, 284–286
grain development, stages, 283
grains and softs, trading, 280
The Greeks. See also options on futures
definition, 57
delta values, 58–59
gamma number, 59–60
theta number, 60–61
vega number, 61–63
Greenspan, Alan, 30, 36
Gross Domestic Product (GDP) report,
using, 96
• H •
H (head) marking, using, 116–117
hammer candlestick pattern, interpreting,
121–122
hanging man candlestick pattern,
interpreting, 121–122
harami candlestick pattern, interpreting,
122–124
harvest risks, considering, 289
head-and-shoulders pattern, example,
116–117
heating oil futures, trading, 240–242
hedgers
characteristics, 40–41
versus speculators, 42
hedging
definition, 50
diversifying stock portfolios, 213–215
futures versus stocks, 212–213
overview, 166–167
stock-index futures, 206
hog market, overview, 270–271
hogs, expansion and contraction spectrum,
266
Hogs and Pigs Survey, consulting, 274
holder option buyer, definition, 40, 56
house starts, impact on copper market,
255–259
household survey, consulting, 88
housing starts report
checking, 262
release, 94–95
Hurricane Katrina
impact on energy markets, 244–245
impact on gasoline and crude oil futures,
240–242
impact on natural gas, 241–242
HV (historical volatility)
explanation, 62–63
versus IV (implied volatility), 62–63
354
Trading Futures For Dummies
32_287224-bindex.qxp 5/27/08 11:07 PM Page 354

• I •
ICA (International Coffee Agreement),
purpose, 290
implied volatility (IV)
explanation, 62–63
versus HV (historical volatility), 62–63
index contracts. See stock-index futures
contracts
Index of Leading Economic Indicators,
95–98
index put/call ratio, overview, 154–156
India, importance, 20–21
indicators. See also moving averages;
sentiment indicators
back testing, 319
definition, 126
MACD (Moving Average Convergence
Divergence), 128–129
moving averages, 126–128
oscillators, 128–130
RSI (Relative Strength Indicator), 130
sentiment, 145
stochastic oscillators, 129
trading volume, 148–151
industrial metals
versus precious metals, 247
predicting trends, 254
inflation
controlling, 27
definition, 32
impact, 164
impact on bond market, 165
impact on currency values, 186
impact on gold market, 250, 252
impact on markets, 16
measuring with CPI (Consumer Price
Index), 89–90
versus money supply, 31–33
inflation targeting, 30
Institute for Supply Management (ISM)
report, consulting, 90–91, 262–263
interbank market, spot-market
trading on, 187
interest rates
following, 35
impact on currency prices, 186
impact on options, 58
lowering, 17, 27, 29, 34–36, 83, 165
manipulating, 36–37
monitoring trends on charts, 260
oil and energy, 223
versus oil prices, 225–226
predicting, 87
raising, 35, 164
yield curve, 170–171
interest-rate futures
resource, 176
trading, 173–174
intermarket spread, example, 52
International Coffee Agreement (ICA),
purpose, 290
international interest-rate contracts,
trading, 174
International Standardization Organization
(ISO) code, 188
intramarket spread, example, 52
investing versus trading, 310–311
investment information, Web sites, 342–343
Investor’s Business Daily, 101, 104
invoice price, definition, 181
IRS, blending of capital gains, 207
iShares DB Silver Trust (SLV) ETF,
description, 74
Islam, militant, 21
ISM (Institute for Supply Management)
report, consulting, 90–91, 262–263
ISO (International Standardization
Organization) code, 188
IV (implied volatility)
explanation, 62–63
versus HV (historical volatility), 62–63
• J •
Japanese yen, trading, 200
job growth, impact, 99. See also
employment report, components
• K •
KCBT (Kansas City Board of Trade), 46
355
Index
32_287224-bindex.qxp 5/27/08 11:07 PM Page 355

• L •
labor shortages, impact, 93
LEAPS (long-term options) versus ETFs
(exchange-traded funds), 69
legal tender, definition, 26
lenders, hedging activity, 166–167
LIBOR (London Interbank-Offered Rate)
futures, globalizing, 168–169
life insurance fund, prioritizing, 307
limit day, definition, 150
limit order, setting for forex trading, 196
limit up day, definition, 150
liquidity, definition, 280
live charts, accessing, 106
livestock cycle, troughs and peaks, 266
livestock producers, hedging techniques,
271–272
livestock reports, interpreting, 275–276
loans, provision by Fed, 29
London Interbank-Offered Rate (LIBOR)
futures, globalizing, 168–169
London Price Fix, benchmark for gold
price, 250
long side, trading, 136
long versus short sellers, 40–41, 49
Long-Term Bond Exchange-Traded fund
(TLT) chart, 114, 123–124
long-term charts, drawing trend
lines on, 136
long-term trading, 320
losses, limiting, 50, 339
lumber, trading, 292
• M •
M0-M2 money supplies, 31, 33–34
MACD (Moving Average Convergence
Divergence) indicator
example, 114
using, 128–129
Macroshares Oil Down Tradeable shares
(DCR) ETF, description, 73
mad cow disease, impact on beef
prices, 270
magazines, consulting, 345
Managed Accounts Reports, subscribing,
298
managed accounts, using, 296–298
margin calls
anticipating, 327
avoiding, 15
getting for Eurodollars, 179
stock-index futures contracts, 218
margins
futures and options versus stocks, 54–55
futures markets, 69
stock market, 69
margins, trading on, 51–52
market bottom. See bottom
market order, definition, 50
market sentiment. See sentiment surveys
market tendencies, back testing, 318
market to market, definition, 52
markets. See also trends
analyzing, 15
consolidation, 149
emergence, 20–21
following trends, 34
globalizing, 168–170
impact of inflation on, 16
inefficiency of, 173–174
linking, 42
response to news, 77–78
studying, 314
trading directions, 315
trends, 23
viewing long-term, 325
watching, 36
meat market reports
availability, 274
Cattle-on-Feed, 273
Hogs and Pigs Survey, 274
meat markets
phases, 266
seasonality, 267
supply versus demand, 266
Web sites, 266
meat prices, influences on, 276–277
356
Trading Futures For Dummies
32_287224-bindex.qxp 5/27/08 11:07 PM Page 356

metal market ETFs
DBB (PowerShares DB Base Metals Fund),
74
DBP (PowerShares DB Precious Metals),
74
DGL (PowerShares DB Gold Fund), 74
SLV (iShares DB Silver Trust), 74
metal markets
gold, 249–252
platinum, 253
silver, 253
technical analysis, 264
variety, 264
metals, precious versus industrial, 247–248
Mexico, role in NAFTA, 19
MGEX (Minneapolis Grain Exchange), 46
mini accounts, arbitrage, 203
mini contract, gold futures, 251
monetary exchange equation, 32
monetary recommendations for trading,
12, 336
money
in Fiat system, 26
making when prices fall, 13–14
managing, 14–15
origin, 27–28
money flows, relating to financial markets,
22–23
money supply
increase by Fed, 27
versus inflation, 31–33
M0-M2, 31
tendencies, 33
mortgages, rate increases, 165
Moving Average Convergence Divergence
(MACD) indicator
example, 124
using, 128–129
moving averages. See also indicators
20 days, 50 days, 100 days, 200 days, 115
advantages, 126
advisory, 126
comparing, 127
definition, 126
overview, 114–116
stock-index futures contracts, 217
using with Bollinger bands, 134
watching with oscillators, 130
multiplier effect, definition, 33
mutual funds. See ETFs (exchange-traded
funds)
• N •
NAFTA (North America Free Trade
Agreement), 19
NASDAQ-100 Futures Index (ND), overview,
210
natural gas
impact of Hurricane Katrina on, 241–242
trading, 243
ND (NASDAQ-100 Futures Index), overview,
210
NDX (Nasdaq 100) ETFs, overview, 71
net worth
calculating, 308–310
risking, 311
New York Board of Trade (NYBOT), 47
New York Mercantile Exchange (NYMEX),
47
open-cry trading hours, 328
trading on, 222
trading platforms for futures, 237–238
news, response of market to, 77–78
newsletters, consulting, 345
North America Free Trade Agreement
(NAFTA), 19
note futures, trading, 180–183
NQ (NASDAQ 100) e-mini contract,
popularity, 211
NYBOT (New York Board of Trade), 47
NYMEX (New York Mercantile Exchange),
47
open-cry trading hours, 328
trading on, 222
trading platforms for futures, 237–238
• O •
OCO (one cancels the other) orders,
placing in forex, 196
oil
bull market, 245
non-OPEC sources, 227
suppliers, 231
357
Index
32_287224-bindex.qxp 5/27/08 11:07 PM Page 357

oil markets
analysts’ weekly reports, 233
checking technical status, 326
resource, 218
responding to supply reports, 234
supply versus demand, 229–231
oil prices
versus economy, 225–226
fluctuation, 232
forecasting via oil stocks, 235–237
impact of rise in, 224–226, 244–246
versus interest rates, 225–226
oil stocks, monitoring changes, 235–237
oil supply data, obtaining, 96–97
oil versus energy, 222–223
one cancels the other (OCO) orders,
placing in forex, 196
online brokerages, choosing, 105–106,
194–195
OPEC (Organization of Petroleum
Exporting Countries)
members, 226
oil supplied by, 231
open interest
charting, 151
falling markets, 152–153
flat, 153
overview, 151
rising trend, 152
sideways markets, 152
versus volume, 156–157
open-cry system, use of, 47–48, 328
option price
fluctuation, 61
influences on, 57–58
option traders, types, 56
option writing, using call options, 64
Options Analysis Software, availability, 63
options mispricing, definition, 62
options on futures. See also The Greeks
advice, 66
calls, 55–56
choosing, 63
effect of time on, 60–61
puts, 56
requirements, 54
resources, 66, 218
S&P 500 futures contract specifications,
64–65
strategy, 64–65
terminology, 57
options writers, rule of thumb, 55
optionsXpress.com charting program,
106–107
orders
calling in, 329–330
filling and matching, 44
types, 49–50
Organization of Petroleum Exporting
Countries (OPEC)
members, 226
oil supplied by, 231
oscillators
definition, 128
MACD (Moving Average Convergence
Divergence), 128–129
RSI (Relative Strength Indicator), 130
RSI as early-warning system, 325
stochastics, 129–130
stock-index futures contracts, 218
using with Bollinger bands, 134
watching with moving averages, 130
OSX and XOI indexes versus Exxon Mobil,
235–236
out of the money, definition, 57
Out of Town Report, description, 274
overbought market
definition, 103
occurrence, 129
oversold market, occurrence, 129
• P •
peak oil concept, overview, 226–227
perception versus reality, considering in
pricing, 281
Phelps Dodge, impact on copper market,
255–259
pigs. See Hogs and Pigs Survey, consulting
pip in forex, occurrence, 188
pit, definition, 50
platinum, trading, 253
political activity, monitoring, 158
political stability, impact on currency
values, 187
pork-belly contracts, components, 271
358
Trading Futures For Dummies
32_287224-bindex.qxp 5/27/08 11:07 PM Page 358

portfolio insurance
impact on stock market, 205
puts as, 56
portfolio risk, determining, 55
portfolios, diversifying, 213–215, 338–339
positions
calculating moves in, 55
entering, 23, 38
leaving open, 331
positive divergence, definition, 128–129
Powers, Mark, Starting Out in Futures
Trading, 10–11, 42
PowerShares ETFs, overview, 72–75
PPI (Producer Price Index) report, using,
88–89
precious versus industrial metals, 247
premium
definition, 57
trading stock-index futures at, 208
premium erosion, impact on options, 60
price actions, predicting, 118–119
price limits versus circuit breakers, 209
price margin, definition, 41
price targets, setting, 320
prices
breakout relative to, 116
calculating current strength, 129
measuring at producer level, 88–89
pricing, perception versus reality in, 281
prime rate, raising, 165
Producer Price Index (PPI) report, using,
88–89
profitable positions, managing, 316–318
profits
locking in, 50
protecting against losses, 317–318
taking, 215–216, 340
PSQ (Short QQQ Proshares) ETF,
description, 71
put and call, buying, 215
put options
delta number, 58
explanation, 56
strategies, 64
put/call ratios
abnormalities, 155–156
index, 154–156
as sentiment indicators, 153–156
total, 154
using as alert mechanisms, 155
pyramiding, 317
• Q •
QID (UltraShort QQQ ProShares) ETF,
description, 71
QLD (Ultra QQQ Proshares) ETF,
description, 71
QQQQ (PowerShares Trust) ETF,
description, 71
• R •
real estate, calculating amount of, 309
reality versus perception, considering in
pricing, 281
real-time quotes, obtaining, 106
refinery capacity in U.S., condition, 230
Relative Strength Indicator (RSI)
as early-warning system, 325
Exxon and CLZ5, 236
hedge trade for stock portfolio, 213–215
overview, 130
Report on Business, using, 90–91
resistance lines, characteristics, 114, 117
retail market, spot-market trading on, 188
retirement plan, prioritizing, 307, 309
reversal
anticipating, 132
trading, 315
reversal pattern, harami candlestick,
122–124
risk exposure
limiting, 43–44, 50, 52
measuring with vega, 61–63
risk free, definition, 180
risk premium, definition, 288
risks, measurements of, 57–61
RSI (Relative Strength Indicator)
as early-warning system, 325
Exxon and CLZ5, 236
hedge trade for stock portfolio, 213–215
overview, 130
359
Index
32_287224-bindex.qxp 5/27/08 11:07 PM Page 359

• S •
S (shoulder) marking, using, 116–117
S&P 500 Cash Index, consulting, 213–214
S&P 500 futures contract specifications,
64–65
S&P 500 (SPX) ETFs, example, 76–78
savings plan, prioritizing, 307
scratch trade, definition, 340
SDS (UltraShort S&P 500 ProShares) ETF
description, 70–71
shorting, 75–78
seasonal trends, back testing, 318
seat on exchange, buying, 44
secular bull market, definition, 228
security analysis, charts, 107
self-employed people, consulting report, 88
sell orders, support levels, 113
sell stops, setting, 142, 331
selling into breakdown, 141
selling short, 13–14, 70, 141
sell-short orders, support levels, 113
sentiment
bull market, 145
energy markets, 244–245
as indicator, 145
sentiment indicators. See also indicators
developing, 159
put/call ratio, 153–156
sentiment surveys
Barron’s, 146
Consensus, Inc., 145–146
features, 146–147
Market Vane, 146
pros and cons, 146
as trend-following systems, 147
usefulness, 147
setups
looking for, 138–139
preparing for, 326–328
SH (Short S&P 500 ProShares) ETF,
description, 70
Short Dow30 ProShares (DOG) ETF,
description, 71
Short QQQ Proshares (PSQ) ETF,
description, 71
short selling versus short-term trading, 135
short versus long sellers, 40–41, 49
shorting the market, 13–14, 70, 141
short-term charts, using, 138
short-term trading versus short selling, 135
silver
as hybrid metal, 253
producers of, 253
trading, 253
SLV (iShares DB Silver Trust) ETF,
description, 74
soft sentiment signs, using, 157–158
softs
coffee, 290–291
definition, 280
lumber, 292
sugar, 291–292
software, availability, 62
soybean complex
soybean contracts, 284–285
soybean meal, 285
soybean oil, 285–286
soybeans versus corn, 288–289
SP (S&P 500) stock-index futures, overview,
209–210
SPAN (Standard Portfolio ANalysis of risk),
55
SPDR S&P 500 (SPY) ETF
description, 70
purchase, 76
speculating
definition, 9–10
stock-index futures, 206, 216
speculators
characteristics, 40, 42, 50
hedging activity, 167
spot market
buying and selling currency, 189
link to futures market, 214
spot-market trading
example, 196
interbank market, 187
overview, 187–188
retail market, 188
spreads
options on futures, 55
reducing risk with, 52
360
Trading Futures For Dummies
32_287224-bindex.qxp 5/27/08 11:07 PM Page 360

SPX (S&P 500) ETFs, overview, 70–71,
SPY (SPDR S&P 500) ETF
description, 70
purchase, 76
squeeze, occurrence, 132
SSO (Ultra S&P 500 Shares) ETF,
description, 70
standard deviation, definition, 131
Standard Portfolio ANalysis of risk (SPAN),
55
stochastic indicators, overview, 129–130
stock indexes
Dow Jones Industrial Average, 71
NDX (Nasdaq 100), 71
SPX (S&P 500), 70–71
stock market crashes
effects of, 42
occurrences, 205
stock market versus bond market, 99
stock portfolios, diversifying, 213–215
stock-index futures contracts
avoiding margin calls, 218
Bollinger bands, 217
concentrating on, 218
developing personal philosophy, 217
e-mini, 211
hedging, 206
limiting risk, 217
moving averages, 217
ND (NASDAQ-100 Futures Index), 210
origin, 205
oscillators, 218
researching, 217–218
selling, 218
SP (S&P 500), 209–210
speculating with, 216
versus stocks, 212–213
tax consequences, 207
time factors, 207
trading, 206
trading at discount, 208
trading at premium, 208
trading on CME, 46
trading strategies, 212–216
stocks
calculating amounts of, 309
margins, 54, 69
versus stock-index futures contracts,
212–213
stop-loss order
definition, 49–50
setting for forex trading, 196
stops
setting for Eurodollars, 177–178
tightening, 331
using, 316
STP (straight through processing),
requirement, 194
straddle, definition, 215
strategies. See trading strategies
strike price, definition, 57
subprime mortgage crisis, 29, 36
successes versus failures, 322
successful tests, using with trend lines, 136
sugar, trading, 291–292
supply fear, occurrence, 289
supply reports for energy, responding to,
234
supply versus demand
agricultural markets, 282
charting considerations, 103–104
checking indicators, 262–263
consumer prices and inflation, 89
definition, 22, 38
energy markets, 229–231
equation, 51
meat markets, 266
support chart point, explanation, 113
support levels, characteristics, 114
support versus resistance, 117
SV (statistical volatility)
explanation, 62–63
versus IV (implied volatility), 62–63
swing line, definition, 215
swing rule, calculating, 215–216
swing trading, 139–140, 316
Swiss franc
as safe haven, 202
trading, 201
• T •
take profit orders (TPO), placing in
forex, 196
target rate, announcement, 37
taxes in futures markets, rates, 207
T-bill futures, trading, 179–180
T-bill margins, value of, 55
361
Index
32_287224-bindex.qxp 5/27/08 11:07 PM Page 361

technical analysis. See also trends
benefits, 113
versus charting, 103
interpreting, 262–263
oil markets, 326
resources, 103–104, 107, 123
reviewing after trades, 321
using, 13, 102–104
technical divergence, occurrence, 261
terminology
agricultural markets, 287
futures markets, 49–51
options on futures, 57
theta number, determining for options,
60–61
tick
definition, 106
of Eurodollars, 175
time premium, rate of decline, 60–61
time-frame analysis, accessing, 106
TLT (Long-Term Bond Exchange-Traded
fund) chart, 114, 123–124
T-note and T-bond futures, volatility, 172
T-notes, trading, 180–183
top versus bottom and base, 112
total put/call ratio, calculation, 154
TPO (take profit orders), placing
in forex, 196
trade management
using brokers, 296, 300–302
using CTAs (Certified Trading Advisors),
296–298
using trading managers, 299–300
traders, types, 40–42
trades
deciding on, 313–314
evaluating results, 320–321
learning from experiences, 322, 332
making decisions about, 331
reviewing, 332
risking equity on, 178–179
trading. See also futures trading
basing on energy supply reports, 234
with Bollinger bands, 133–134
contemplating before entering, 337
day, 319
determining time frame, 171–173
implementation, 296–298
intermediate-term, 319–320
versus investing, 310–311
justifying, 304–305
long side, 136
long-term, 320
making living by, 306
managed accounts, 296–298
with market momentum, 315–316
as part of overall strategy, 305
process, 47–51
reversal, 315
setting time frame, 319–320
as speculating, 9–10
terminology, 49–51
with trend lines, 134–137
with trends, 337–338
trading bands
Bollinger, 131–134
definition, 130
trading books, consulting, 344
trading collar, definition, 150
trading directions, 315
trading envelopes
trading managers, considering, 299–300
trading opportunities, looking for, 138
trading place, designation of, 44
trading plan, reviewing, 328–329
trading range, defining, 113, 117
trading small, 339–340
trading strategies
back testing, 116, 318–319
copper, 255–256
designing, 324
gasoline futures contracts, 239–240
stock-index futures contracts, 212–216
trading volume, analyzing, 148, 150–151,
156–157
trailing stops
definition, 50
using, 142
transactions
negotiating, 45
rules related to, 44–45
362
Trading Futures For Dummies
32_287224-bindex.qxp 5/27/08 11:07 PM Page 362

trend changes, indicating with harami
pattern, 122–124
trend lines
versus Bollinger bands, 134
definition, 135
drawing, 137
drawing on long-term charts, 136
forex (foreign exchange), 191
moving average as, 114–116
trading with, 134–137
trends. See also markets; technical analysis
depicting with candlestick charts,
108–111
in economic reports, 86
examples, 16
following, 34
following via sentiment surveys, 147
identifying, 137–138
interpreting in charts, 111
monitoring on charts, 260–261
spotting changes in, 38
staying with, 132
tracking, 138
tracking via moving averages, 126–128
trading with, 337–338
triangles, occurrence on price charts,
118–119
• U •
UDN (PowerShares DB U.S. Dollar Bearish
Fund), description, 75
UK pound sterling, trading, 200
Ultra and UltraShort ETFs, 70–71, 75–78
unemployment rate, trends, 88
UNG (United States Gas Fund) ETF,
description, 73
United Kingdom, strengths, 19
University of Michigan, consumer
confidence survey, 92
uptrends
base at top of, 113
trend lines in, 135
U.S. (United States), deficits, 20
U.S. Department of Agriculture (USDA)
Web site, 287
U.S. dollar
impact on gold market, 250, 252
pairing with euro, 314
trading euro against, 199
U.S. dollar index, overview, 197–198
U.S. Energy Information Agency (EIA),
weekly reports, 233
U.S. Oil Fund (USO) ETF, description, 72
U.S. Treasury yield curve, example,
170–171
USD/CHF currency pairing, 188
USD/JPY currency pairing, 188
USO (U.S. Oil Fund) ETF, description, 72
UUP (PowerShares DB U.S. Dollar Bullish
Fund), description, 75
• V •
velocity, definition, 32
volatility
decrease, 132
definition, 41, 61
historical (HV), 62–63
impact on options, 57–58
implied (IV), 62–63
measuring with vega number, 61–63
occurrence, 173–174
T-note and T-bond futures, 172
weather markets, 283
volume. See trading volume, analyzing
volume indicators, limitations, 150
• W •
wars, impact on gold prices, 252
washout, definition, 148
weather
impact on housing starts, 95
influence on crops, 282–283
Web sites
Active Trader, 104
American Stock Exchange, 68
Barchart.com, 104, 151, 266, 343
Barron’s Online, 146
Bloomberg, 233
CandlesExplained.com, 343
363
Index
32_287224-bindex.qxp 5/27/08 11:07 PM Page 363

Web sites
(continued)
CBOE (Chicago Board Options Exchange),
66, 154
CBOT (Chicago Board of Trade), 46, 168,
286, 343
CFTC (Commodity Futures Trading
Commission), 341–342
charting program, 106–107
Chicago Board of Trade (CBOT), 343
Chicago Board Options Exchange, 45
Chicago Mercantile Exchange (CME), 343
CME (Chicago Mercantile Exchange), 46,
266, 343
collar rule, 210
commodity exchanges, 343
Commodity Futures Trading Commission
(CFTC), 341–342
Consensus, Inc. sentiment survey, 145
Consensus National Futures and Financial
Weekly, 345
crossrates, 189
currency ETFs, 75
currency trading, 185
Deutsche Bank, 68
Drudge Report, 157
EBS (Electronic Brokering Services), 195
ETFs (exchange-traded funds), 68
Fed Board of Governors, 341–342
Federal Reserve, 93
Financial Sense.com, 248
Futures, 104, 345
FX charts.com, 106–107, 343
Globex trading system, 48
gold sales, 248, 251
government, 341–342
The Greeks, 57
Hightower Report, 345
ICA (International Coffee Agreement), 290
interest-rate futures, 176
investment information, 342–343
Investor’s Business Daily, 104, 342
ISM (Institute for Supply
Management), 91
Joe-Duarte.com, 343
KCBT (Kansas City Board of Trade), 46
Kitco.com, 251
Managed Accounts Reports, 298
Market Vane sentiment survey, 146
MarketWatch.com, 233, 343
meat-market data, 266
MGEX (Minneapolis Grain Exchange), 46
New York Board of Trade (NYBOT), 47
Nostradamus, 195
NYMEX (New York Mercantile Exchange),
47, 222, 238, 343
Ohio State University meat-market data,
266
oil markets, 218
optionsXpress.com, 106–107
Reuters.com, 233, 343
St. Louis Fed, 341–342
stockcharts.com, 107
Technical Analysis of Stocks &
Commodities magazine, 63, 104, 345
USDA (U.S. Department of Agriculture),
287, 341–342
Weather Bulletin (USDA), 283
World Gold Council, 251
whipsaws, occurrence, 126, 144
writer option buyer, definition, 56
• X •
XOI and OSX indexes versus Exxon Mobil,
235–236
• Y •
yen, trading, 200
yield curve
overview, 170–171
shapes on, 172
tracking, 173
364
Trading Futures For Dummies
32_287224-bindex.qxp 5/27/08 11:07 PM Page 364

BUSINESS, CAREERS & PERSONAL FINANCE
Also available:
Business Plans Kit For Dummies
0-7645-9794-9
Economics For Dummies
0-7645-5726-2
Grant Writing For Dummies
0-7645-8416-2
Home Buying For Dummies
0-7645-5331-3
Managing For Dummies
0-7645-1771-6
Marketing For Dummies
0-7645-5600-2
Personal Finance For Dummies
0-7645-2590-5*
Resumes For Dummies
0-7645-5471-9
Selling For Dummies
0-7645-5363-1
Six Sigma For Dummies
0-7645-6798-5
Small Business Kit For Dummies
0-7645-5984-2
Starting an eBay Business For Dummies
0-7645-6924-4
Your Dream Career For Dummies
0-7645-9795-7
0-7645-9847-3
0-7645-2431-3
Also available:
Candy Making For Dummies
0-7645-9734-5
Card Games For Dummies
0-7645-9910-0
Crocheting For Dummies
0-7645-4151-X
Dog Training For Dummies
0-7645-8418-9
Healthy Carb Cookbook For Dummies
0-7645-8476-6
Home Maintenance For Dummies
0-7645-5215-5
Horses For Dummies
0-7645-9797-3
Jewelry Making & Beading
For Dummies
0-7645-2571-9
Orchids For Dummies
0-7645-6759-4
Puppies For Dummies
0-7645-5255-4
Rock Guitar For Dummies
0-7645-5356-9
Sewing For Dummies
0-7645-6847-7
Singing For Dummies
0-7645-2475-5
FOOD, HOME, GARDEN, HOBBIES, MUSIC & PETS
0-7645-8404-9
0-7645-9904-6
Available wherever books are sold. For more information or to order direct: U.S. customers visit www.dummies.com or call 1-877-762-2974.
U.K. customers visit www.wileyeurope.com or call 0800 243407. Canadian customers visit www.wiley.ca or call 1-800-567-4797.
HOME & BUSINESS COMPUTER BASICS
Also available:
Cleaning Windows Vista For Dummies
0-471-78293-9
Excel 2007 For Dummies
0-470-03737-7
Mac OS X Tiger For Dummies
0-7645-7675-5
MacBook For Dummies
0-470-04859-X
Macs For Dummies
0-470-04849-2
Office 2007 For Dummies
0-470-00923-3
Outlook 2007 For Dummies
0-470-03830-6
PCs For Dummies
0-7645-8958-X
Salesforce.com For Dummies
0-470-04893-X
Upgrading & Fixing Laptops For
Dummies
0-7645-8959-8
Word 2007 For Dummies
0-470-03658-3
Quicken 2007 For Dummies
0-470-04600-7
0-470-05432-8
0-471-75421-8
Also available:
Blogging For Dummies
0-471-77084-1
Digital Photography For Dummies
0-7645-9802-3
Digital Photography All-in-One Desk
Reference For Dummies
0-470-03743-1
Digital SLR Cameras and Photography
For Dummies
0-7645-9803-1
eBay Business All-in-One Desk
Reference For Dummies
0-7645-8438-3
HDTV For Dummies
0-470-09673-X
Home Entertainment PCs For Dummies
0-470-05523-5
MySpace For Dummies
0-470-09529-6
Search Engine Optimization For
Dummies
0-471-97998-8
Skype For Dummies
0-470-04891-3
The Internet For Dummies
0-7645-8996-2
Wiring Your Digital Home For Dummies
0-471-91830-X
INTERNET & DIGITAL MEDIA
0-470-04529-9
0-470-04894-8
* Separate Canadian edition also available
†
Separate U.K. edition also available
33_287224-badvert01.qxp 5/27/08 10:30 PM Page 365
Also available:
3D Game Animation For Dummies
0-7645-8789-7
AutoCAD 2006 For Dummies
0-7645-8925-3
Building a Web Site For Dummies
0-7645-7144-3
Creating Web Pages For Dummies
0-470-08030-2
Creating Web Pages All-in-One Desk
Reference For Dummies
0-7645-4345-8
Dreamweaver 8 For Dummies
0-7645-9649-7
InDesign CS2 For Dummies
0-7645-9572-5
Macromedia Flash 8 For Dummies
0-7645-9691-8
Photoshop CS2 and Digital
Photography For Dummies
0-7645-9580-6
Photoshop Elements 4 For Dummies
0-471-77483-9
Syndicating Web Sites with RSS Feeds
For Dummies
0-7645-8848-6
Yahoo! SiteBuilder For Dummies
0-7645-9800-7
SPORTS, FITNESS, PARENTING, RELIGION & SPIRITUALITY
Also available:
Catholicism For Dummies
0-7645-5391-7
Exercise Balls For Dummies
0-7645-5623-1
Fitness For Dummies
0-7645-7851-0
Football For Dummies
0-7645-3936-1
Judaism For Dummies
0-7645-5299-6
Potty Training For Dummies
0-7645-5417-4
Buddhism For Dummies
0-7645-5359-3
Pregnancy For Dummies
0-7645-4483-7 †
Ten Minute Tone-Ups For Dummies
0-7645-7207-5
NASCAR For Dummies
0-7645-7681-X
Religion For Dummies
0-7645-5264-3
Soccer For Dummies
0-7645-5229-5
Women in the Bible For Dummies
0-7645-8475-8
Also available:
Alaska For Dummies
0-7645-7746-8
Cruise Vacations For Dummies
0-7645-6941-4
England For Dummies
0-7645-4276-1
Europe For Dummies
0-7645-7529-5
Germany For Dummies
0-7645-7823-5
Hawaii For Dummies
0-7645-7402-7
Italy For Dummies
0-7645-7386-1
Las Vegas For Dummies
0-7645-7382-9
London For Dummies
0-7645-4277-X
Paris For Dummies
0-7645-7630-5
RV Vacations For Dummies
0-7645-4442-X
Walt Disney World & Orlando
For Dummies
0-7645-9660-8
TRAVEL
GRAPHICS, DESIGN & WEB DEVELOPMENT
0-471-76871-5
0-7645-7841-3
0-7645-7749-2
0-7645-6945-7
0-7645-8815-X
0-7645-9571-7
Also available:
Access 2007 For Dummies
0-470-04612-0
ASP.NET 2 For Dummies
0-7645-7907-X
C# 2005 For Dummies
0-7645-9704-3
Hacking For Dummies
0-470-05235-X
Hacking Wireless Networks
For Dummies
0-7645-9730-2
Java For Dummies
0-470-08716-1
Microsoft SQL Server 2005 For Dummies
0-7645-7755-7
Networking All-in-One Desk Reference
For Dummies
0-7645-9939-9
Preventing Identity Theft For Dummies
0-7645-7336-5
Telecom For Dummies
0-471-77085-X
Visual Studio 2005 All-in-One Desk
Reference For Dummies
0-7645-9775-2
XML For Dummies
0-7645-8845-1
NETWORKING, SECURITY, PROGRAMMING & DATABASES
0-7645-7728-X
0-471-74940-0
33_287224-badvert01.qxp 5/27/08 10:31 PM Page 366
Document Outline
- Trading Futures for Dummies
- About the Author
- Dedication
- Author’s Acknowledgments
- Contents at a Glance
- Table of Contents
- Introduction
- Part I: Understanding the Financial Markets
- Part II: Analyzing the Markets
- Chapter 6: Understanding the Fundamentals of the Economy
- Chapter 7: Getting Technical Without Getting Tense
- Chapter 8: Speculating Strategies That Use Advanced Technical Analysis
- Chapter 9: Trading with Feeling Now!
- The Essence of Contrarian Thinking
- Bull Market Dynamics
- Survey Says: Trust Your Feelings
- Considering Volume (And How the Market Feels About It)
- Out in the Open with Open Interest
- Putting Put/Call Ratios to Good Use
- Understanding the Relationship Between Open Interest and Volume
- Using Soft Sentiment Signs
- Developing Your Own Sentiment Indicators
- Part III: Financial Futures
- Part IV: Commodity Futures
- Chapter 13: Getting Slick and Slimy: Understanding Energy Futures
- Some Easy Background Info
- Completing the Circle of Life: Oil and the Bond Market
- Examining the Peak Oil Concept
- The Post-9/11 Mega Bull Market in Energy
- Understanding Supply and Demand
- Playing the Sensible Market
- Handling Seasonal Cycles
- Preparing for the Weekly Cycle
- Oil Prices by Using Oil Stocks
- Burning the Midnight Oil
- Getting the Lead Out with Gasoline
- Keeping the Chill Out with Heating Oil
- Getting Natural with Gas
- Getting in Tune with Sentiment and the Energy Markets
- Some Final Thoughts about Oil
- Chapter 14: Getting Metallic Without Getting Heavy
- Chapter 15: Getting to the Meat of the Markets: Livestock and More
- Chapter 16: The Bumpy Truth About Agricultural Markets
- Chapter 13: Getting Slick and Slimy: Understanding Energy Futures
- Part V: The Trading Plan
- Part VI: The Part of Tens
- Index
Wyszukiwarka
Podobne podstrony:
ISBN 13 for Dummies Special Ed (ISBN 0555023400)
Guitar For Dummies
CCNA for Dummies (2000)
Making Money For Dummies
Beating The Bear Short Term Trading Tactics for Difficult Markets with Jea Yu
Chronic Pain for Dummies
Making Money Online For Dummies
Arabic For Dummies
hacking for dummies [ EN ] Hacking For Dummies
Korean for Dummies Cheat Sheet
więcej podobnych podstron