
Chapter 4: ormative Findings on American College Students
Introduction
The findings to be presented in this chapter are based on studies of American college students over
a 45-year period. While such findings may at first glance seem limited because most students come
from a narrow age range and a small portion of the socioeconomic ladder, this is in fact the greatest
strength of the findings because they are not attenuated by other variables. They provide an anchor
point for investigations of the relationship of dream content to such factors as age, ethnicity, race,
class, nationality, and individual differences.
Moreover, college students are an ideal group to study if the primary goal is to understand the
meaning of dreams because they are introspective, articulate, and often interested in understanding
their own dreams. They are at an open and inquiring age, and many are willing to cooperate
wholeheartedly in attempts to study their dreams. Although many dream theorists seem to believe
that we will learn more about dream meaning from studying the dream reports of children,
psychiatric patients, and preliterate people living in small traditional societies, in our experience the
new and most provocative findings on dream content come from studying the dream reports of
college students or the dream diaries of highly motivated post-college adults.
Hall and Van de Castle (1966: chap. 14) carried out their first study using the new coding system
on 500 dream reports from 100 European-American female students and a similar number of reports
from 100 European-American male students, all of whom were between 18 and 25. Five reports
from each student were randomly selected from dream series containing between 12 and 18 dreams.
Dream reports less than 50 words or more than 300 words were eliminated before the selections were
made. The findings from this study provide the "norms" for the Hall/Van de Castle system for home
dream reports for college students.
Two issues of critical importance have to be dealt with in analyzing findings of the type presented
in this chapter. First, dream reports from different groups or individuals may differ in length; since
longer dream reports might be expected to have more of everything in them, some kind of correction
must be made for this possibility. In Hall and Van de Castle's normative sample, for example,
women's dream reports were on the average 8% longer than those from men. It therefore can be
expected that the tables presented in this chapter generally will show higher frequencies of dream
elements for women than men. In our experience this is a fairly typical gender difference. However,
Use these links to quickly navigate through the book:
•
Introduction
•
Chapter 1: The Scientific Study of Dream Content
•
Chapter 2: The Hall/Van De Castle System
•
Chapter 3: The Quality of the Data
• Chapter 4: Normative Findings
•
Chapter 5: Age Differences in Dream Reports
•
Chapter 6: Cross-Cultural Studies of Dream Content
•
Chapter 7: Consistency and Change in Long Dream Series
•
Chapter 8: The Continuity Between Dreams and Waking Life
•
Chapter 9: The Repetition Dimension
•
References
Strona 1 z 24
Finding Meaning in Dreams: Chapter 4
2009-02-11
file://E:\prace\artykuły\sny\ksiazki\finding_meaning_in_dreams\Finding Meaning in ...

a reversal of the pattern on dream report length in a study by Kramer, Kinney, and Scharf (1983)
criticized at the end of this chapter has led to a great amount of confusion in the literature on gender
differences in dream content. The second problem in analyzing findings with the Hall/Van de Castle
coding system is that the frequencies of social interactions are affected by the frequencies with
which various types of characters appear as well as by dream length. For example, since there are
more male than female characters in the dream reports of men, there is a greater possibility for social
interactions with male characters.
We use several different strategies to deal with these two related problems. Sometimes, as in the
case of the normative study to be presented in this chapter, we do not use dream reports under 50
words in length. In one or two instances we have divided the frequency of an element by the number
of words or lines in a report. However, we do not think these approaches are the best possible
solution, a conclusion based in part on a finding by Trinder et al. (1970) that the relationship
between dream report length and frequency of elements is not a linear one for all content categories.
Instead, we apply a variety of solutions to the length and frequency problems that allow us to
bypass any correction for the length of the dream report. Basically, we create various ratios, rates,
and proportions that are called indexes and percentages in the terminology of this book. For
example, when subclasses of such general categories as settings, characters, activities or objects are
being compared in different samples, the effect of report length can be eliminated by converting each
frequency of a subclass into a percentage of the total frequency of the category. Thus, we determine
what percentage of the total human characters in a sample are male or female, what percentage of the
combined friendly and aggressive interactions are aggressive ones, what percentage of the total
number of aggressions are physical ones, and what percentage of the total number of activities are
physical ones (cf. Hall, 1969a:153-154).
Similarly, the comparison of social interactions between the dreamer and other characters can be
standardized by creating an index controlling for the different number of characters in different
samples. For example, we simply divide the number of aggressive interactions by the number of
characters, creating an "aggressive-interactions-per-character" rate, so to speak; we call this the "A/C
index." Such indexes can be created for any character subclass to learn if a dreamer has a higher
aggressive-interaction rate (A/C index) with men or women, children or adults, relatives or strangers.
In short, our "unit of analysis" for aggressive interactions, and all other social interactions, is
characters (cf. Hall, 1969a:154).
We do not propose to present all of our specific percentages and indexes at this point. Instead,
they will be introduced at the appropriate place in the discussion of various findings, where the
context will make them more immediately understandable. The important conclusion for now is one
we stated at the beginning of this discussion of percentages and indexes: all of these strategies allow
us to bypass correcting for dream length, so we do not have to talk in terms of "mean frequencies"
per dream report or per dream-report sample. Whether this approach is the better course to take can
only be determined by seeing if the results it provides make psychological sense and inspire new
investigators to do further studies using it. However, it is based on long experience.
The issue of how to deal with inevitable differences in report lengths and variations in raw
frequencies also brings us to the question of what form our statistical analyses should take. As we
explain in more detail in Appendix D, we have chosen statistics that are based in percentages and
percentage differences for a variety of reasons. The most important of those reasons, however, is that
these statistics allow us to analyze the particular kind of data we had to create in order to correct for
dream length and differential frequencies for some kinds of elements.
Rather than discussing issues of statistics in the main text of this book, we ask readers interested in
the rationale for our statistical approach to turn to Appendix D before reading the rest of this chapter.
Here we will only say the main test of statistical significance we use is called the "significance of
Strona 2 z 24
Finding Meaning in Dreams: Chapter 4
2009-02-11
file://E:\prace\artykuły\sny\ksiazki\finding_meaning_in_dreams\Finding Meaning in ...

differences between two independent proportions" and that it yields the same results as better-
known alternatives such as correlation and chi square with our particular kind of data. Beyond that,
we need only add here that statistical significance is a minor issue for us, in good part because the
large size of our samples insures that even small differences are found to be statistically significant.
The main issue for us, therefore, is the magnitude or size of differences, which we measure with
Cohen's (1977) h statistic, explained in Appendix D.
We first turn to a presentation of the results of Hall and Van de Castle's normative study of
European-American college men and women. Once the findings of this study are discussed, the
results of subsequent investigations of American college students by several different investigators
will be presented.
The chapter includes three recent innovations with the potential to make dream content studies
easier and more interesting. First, we will show that it takes only 100 dream reports from the
normative sample of 500 dreams to obtain the same findings. Second, we will argue that one "Most
Recent Dream" from 100 students makes it possible to replicate the normative findings. Taken
together, these two points mean that comparisons of subgroups with each other and our norms can be
done much more efficiently than in the past, and with confidence in any differences discovered.
Third, we will present the h-profile as an effective way to display the ways in which a subgroup or
individual differs from our norms, making it possible to see possible patterns in the findings with
great ease.
To avoid inundating readers with dozens of frequencies and percentages in the main text, only
some of Hall and Van de Castle's major findings for each content category are presented in this
chapter. The complete findings are displayed in highly detailed tables in Appendix E. Putting the
detailed tables together in one place in an appendix makes it easier for readers to use them for
research purposes. To make this appendix even more useful, the normative expectations for all our
major categories are brought together in
Table E.1
.
The Hall/Van de Castle ormative Study
Characters
There are several main findings in the realm of characters. We will use these findings to introduce
readers to how we use percentages to correct for dream length. We also will show how we use
comparative findings to begin to make sense out of our data, but the full implications of most of our
findings will become apparent only in the context of the findings presented in later chapters. We
begin with the following simple findings, as displayed in Table 4.1.
Table 4.1. Frequencies and Percentages of Selected Subclasses
of Dream Characters
Men Women
f
%
f
%
Total Characters
1180
1423
Average No. Per Dream
2.4
2.8
Total Animal Characters
71
06
60
04
Total Human Characters
1108
94 1363
96
Total Male Characters
587
67
507
48
Total Female Characters
286
33
547
52
Strona 3 z 24
Finding Meaning in Dreams: Chapter 4
2009-02-11
file://E:\prace\artykuły\sny\ksiazki\finding_meaning_in_dreams\Finding Meaning in ...

As the table reveals, there are two to three characters aside from the dreamer in the average dream
report. The exact figure is 2.4 for males and 2.8 for females, but we need to recall that women's
dream reports are 8% longer than those of men; this finding does not correct for the difference in
length. We also need to remember that groups of any size count as only one character. In point of
fact, the mean number of characters per dream is not a finding we use very often. It is merely a rough
benchmark, as is the fact that less than 5% of dream reports are without any characters aside from
the dreamer.
We next see in Table 4.1 that most of the characters in the dream reports of these college students
are other human beings. This may not be surprising to most readers, but it is actually a useful
finding, experience has taught us, when we use it as part of an equation we call the "animal percent."
According to our norms, 6% of the characters in the dream reports of men are animals; the figure is
4% for women dreamers. These findings have no particular relevance in and of themselves, but they
start to take on meaning when they are compared with findings for children (where the animal
percent is much higher), or dreamers in small hunting and gathering societies (where it is also much
higher), or dreamers in Japan (where it is below 1%).
The "finding" on the percentage of animal characters allows us to return to the issue of how we
deal with differences in dream length. Here we have used the "total characters" as our unit of
analysis. In future studies, whatever the length of the average dream report, and whatever the total
number of characters in the dream reports, we can speak of the person or group's "animal percent" in
a directly comparative way because it is always a function of "total animals" divided by "total
characters."
We next note in Table 4.1 that there is a gender difference in how often men and women include
male and female characters in their dreams: men dream twice as often about other men as they do
about women (67% vs. 33%), and women dream equally about both sexes (48% men, 52% women).
If we put the numbers in the kind of 2 X 2 table discussed in Appendix D, and then perform our
statistical operations, we find this difference of 19 percentage points has an h value of .39 (defined as
a medium-sized effect size in Appendix D) and is statistically significant well beyond the .01 level of
significance (see Table 4.2). However, as Table 4.2 also shows, the confidence interval for this
finding ranges from .30 to .48.
We call this finding the "ubiquitous" gender difference in dreams (Hall and Domhoff, 1963a; Hall,
1984), and we label it the "male/female percent." Men have a male/female percent of 67/33 and
women have a male/female percent of 48/52. This difference is not found in each and every study,
but it is found in most of them. It is a totally unexpected outcome of the coding system. It is a
"discovery," and it turns out to have its counterpart in published short stories written by male and
female authors (Hall and Domhoff, 1963a) and in stories made up by pre-school children (as
reported in the next chapter). There is no obvious or certain "interpretation" of this finding, but it is
the type of finding that may lead eventually to a theory of dream meaning, as will be shown in
subsequent chapters.
Total Familiar Characters
501
45
796
58
Total Unfamiliar Characters
607
55
567
42
Table 4.2. Gender Differences in Male and Female Characters
Male Dreamers Female Dreamers
Male Characters
587 (67%)
507 (48%)
Female Characters
266 (33%)
547 (52%)
h = .39; significance level = .0000; 95% confidence interval = .30 to .48
Strona 4 z 24
Finding Meaning in Dreams: Chapter 4
2009-02-11
file://E:\prace\artykuły\sny\ksiazki\finding_meaning_in_dreams\Finding Meaning in ...

Returning to Table 4.1 for a final time, we see there is also a gender difference in the percentage
of "familiar" and "unfamiliar" characters which basically means people we know, such as extended
family and friends, or do not know. This information can be used to create a "familiarity percent,"
determined by dividing the number of familiar characters by the total number of familiar and
unfamiliar characters. A comparison of male and female dreamers on familiarity percent is presented
in Table 4.3; this same comparison is also used in Appendix D in explaining a 2 X 2 table.
Once again, the magnitude of the difference is in the medium range, the level of significance is
well beyond the .01 level, and the confidence interval for the effect size is fairly wide.
If we ask ourselves why there is a gender difference on familiarity percent, we may be given a
start toward the answer in the findings on unfamiliar males and females presented in the more
detailed table in Appendix E on characters (
Table E.2
). There we learn that men dream more often of
unfamiliar males than do women (28% vs. 15%), but men and women dream equally about "familiar
males" (25% vs. 23%). Conversely, women are dreaming more often of familiar females, 29% vs.
16% for the males, but males and females dream about equally of unfamiliar females, 10% for males
and 11% for females. In short, these comparisons tell us it is "unfamiliar males" in male dreams and
"familiar females" in female dreams that create the difference on the familiarity percent.
We do not want to give the impression from the findings presented so far that our primary interest
in the norms is in the gender differences. For our purposes, gender differences are most important as
a starting point for the study of individual differences. For example, if we were to study a male
dream series that had an animal percent of 18 instead of the usual 6, a male percent of 90 instead of
the usual 67, and a familiarity percent of 25 instead of 45, we might start to suspect we were
studying a fairly unusual person. In an individual study, the only importance of the gender
differences is that we know we must use different norms for uncovering individual differences in
males and females.
We now turn to the highlights of our findings on the various types (subclasses) of human
characters categorized in the Hall/Van de Castle system. Both genders dream most frequently about
known characters. Women are a little more likely to dream about family members and known
characters, and men a little more likely to dream about strangers, but we already knew most of this
from the findings on familiar and unfamiliar characters. The complete findings on types of human
characters can be found in
Table E.3
.
For the most part, Table E.3 (subclasses of characters) is not used as frequently as Table E.2.
However, it is the basis for our normative expectations on one of our possible psychopathology
indicators, the "friends percent." Recall from the discussion in chapter 2 that for this indicator we
divide the number of known characters by the total number of human characters. The normative
percentage is 37 for women and 31 for men.
The findings on characters are useful in and of themselves, but they become of even greater
interest in indexes involving aggressive, friendly, and sexual interactions. Thus, we often begin an
investigation of a dream series or dream set with an analysis of the characters.
Table 4.3. Gender Differences in Familiarity Percent
Male Dreamers Female Dreamers
Familiar characters
501 (45%)
796 (58%)
Unfamiliar characters
607 (55%)
567 (42%)
h = .26; significance level = .0000; 95% confidence interval = .18 to .36
Social Interactions
Strona 5 z 24
Finding Meaning in Dreams: Chapter 4
2009-02-11
file://E:\prace\artykuły\sny\ksiazki\finding_meaning_in_dreams\Finding Meaning in ...

Social interactions are usually the most revealing aspects of a dream series or dream set. The first
consistent finding is that aggressions outnumber friendly interactions for both genders. Sexual
interactions are a very distant third, contrary to many popular stereotypes of dream content. Forty-
seven percent of men's dreams and 44% of women's contain at least one aggressive interaction. For
friendliness the percentages are 38 for men and 42 for women, and for sexuality 12 and 4.
Because aggression is the most frequent social interaction, we begin with a number of findings on
aggressions. We first note that men have more aggressive interactions in their dreams than women, a
point we will come back to in more detail when we discuss the ways in which we correct for
differences in dream length and number of characters in analyzing aggressions and friendliness. In
terms of our eight subclasses of aggression, men tend to have more physical aggressions and women
far more interactions in the "rejection" category. The net result is that there is a gender difference in
the physical aggression percent, calculated by dividing the number of physical aggressions by the
total number of aggressions. Males have a physical aggression percent of 50, whereas for females the
percentage is 34 (h = .33). Note that the relationship being expressed here, between physical and
nonphysical aggression, is entirely independent of dream report length, number of dream characters,
or number of aggressions. It is a comparison we often make, and it is one of our hypothesized
indicators of possible psychopathology. The detailed findings for the types of aggressions in dream
reports can be found in
Table E.4
.
Turning to the interaction dimension of aggressions, summarized in
Table E.5
, there are two main
findings. First, dreamers are involved in about 80% of the aggressions in their dreams. Percentages
that are much higher or lower are of potential interest to us, especially when they are compared with
the percentages for involvement in other social interactions. Second, we find that dreamers are more
often victims than they are aggressors, as best shown in the victimization percent, which is
independent of dream length, number of characters, or number or type of aggressions. If we use only
the categories for aggressor and victim in Table E.5, ignoring witnessed, reciprocated, mutual and
self aggressions, we can figure the normative Victimization Percent for men and women as follows:
Males:
Victimization Percent = D as victim ÷ (D as victim + D as aggressor) = 153 ÷ (153+100) = 60%
Females:
Victimization Percent = 155 ÷ (155+76) = 67%
If the victimization percent is above 50, the dreamer more likely to be a victim. If it is below 50,
the dreamer is more likely to be an aggressor. This percentage can be determined for every major
class of character with whom the dreamer interacts. From this we can learn that the dreamer may be
an aggressor in relation to some people and a victim in relation to others. For example, everyone is
likely to be a victim of animals and male strangers, a point we will demonstrate after we look at the
main findings on friendliness.
Friendliness
Women have more friendliness in their dreams than do men if we look at the raw frequencies
alone. The subclass for "helping and protecting" has the highest frequency for both genders,
followed by friendly remarks and compliments, which we call "verbal friendliness." Findings on the
frequencies and distribution of friendly interactions by seven subclasses are presented in
Table E.6
.
There are three main findings in terms of the interactions within which acts of friendliness occur.
First, dreamers are involved in almost all of the friendly interactions in their dream reports. Second,
there is little or no mutual, reciprocal, or self friendliness. Third, we expect the typical college
dreamer, whether male or female, to initiate friendly interactions about as often as they are received.
This figure, the befriender percent, is 50% for males and 47% for females. The befriender percent
Strona 6 z 24
Finding Meaning in Dreams: Chapter 4
2009-02-11
file://E:\prace\artykuły\sny\ksiazki\finding_meaning_in_dreams\Finding Meaning in ...

does not include "reciprocal" and "mutual" friendly interactions. When looked at in conjunction
with the victimization percent, it gives us some idea of the dreamer's assertiveness in her or his
dreams. The complete results on friendly interactions are presented in
Table E.7
.
Aggression and Friendliness
The findings on aggressive and friendly interactions take on even more interest when they are
compared with each other. We do this in two different ways that correct for the fact there tend to be
more characters in female dream reports. The first way is to divide the total number of dreamer-
involved aggressions by the total number of dreamer-involved aggressions plus friendliness. This
yields the "aggression/friendliness percent" mentioned in chapter 2 as a possible indicator of
psychopathology in dreams. A percentage over 50 indicates a greater amount of aggression; a
percentage less than 50 indicates a preponderance of friendliness. The aggression/friendliness
percent is over 50 for both men and women; for men the figure is 59, for women it is 51. Men have
more aggressive interactions with males, and more friendly interactions with females, whereas
women have about equal amounts of aggression and friendliness with both male and female
characters. Women are very friendly with familiar males, but have a preponderance of aggressive
interactions with unfamiliar males. If we define "enemies" as characters with whom the
aggression/friendliness percent is over 60, then male strangers and animals are "enemies" in the
dreams of both men and women. These and other findings are displayed in Table E.8 [not available
on-line yet].
Our other strategy for comparing aggressions and friendliness while controlling for the number of
characters is to divide the number of aggressions or the number of friendly interactions by the total
number of characters or the total number of characters in a given subclass. For example, if we divide
the total number of aggressions (402) in male dream reports in our normative sample by the total
number of characters (1180), we have an A/C index of 34. If we do the same for female dreamers,
337/1423, the A/C index is 24. Thus, male dreamers are found to be even more aggressive in their
dream reports than raw frequencies suggest if we control for characters. If we compute the same
figures for friendliness, the male F/C index is 21, the female index 22. These indexes are also useful
when they are computed for specific classes of characters, especially males and females.
As we noted briefly in chapter 2 when talking about possible indicators of psychopathology, we
have found it useful to look at people's patterns of friendliness and aggression with males and
females by means of a 2 x 2 table that we call the "A/F square." This table appears as part of
Table
E.1
. It tells a very similar story for males to what we found with the aggression/friendliness percent:
men are more aggressive with other men and more friendly with women in their dream reports.
However, from the A/F square we learn that women have both more aggression and more
friendliness with male characters than they do with female characters. We think that atypical A/F
squares might be of great use in studying individuals and groups. There have been a few revealing
studies with males that will be presented in chapter 8 but none with females. We are hopeful that the
great potential in using this 2 x 2 table in studying women of varying personality and sexual
orientations will be tested in the next few years.
Just to reinforce our point about animals as dangerous characters in dreams, we present the A/C
and F/C indexes with animals for both men and women in Table 4.4.
Table 4.4. Relations with Animals in Dream Reports
Men Women
A/C with Animals
38
33
F/C with Animals
08
10
Sexual Interactions
Strona 7 z 24
Finding Meaning in Dreams: Chapter 4
2009-02-11
file://E:\prace\artykuły\sny\ksiazki\finding_meaning_in_dreams\Finding Meaning in ...

After the several interesting and useful findings on aggressions and friendliness, the few findings
on sexual interaction will come as a letdown. The two meager findings emerging from
Table E.9
are
(1) men report more sexual dreams than women and (2) female dreamers have more sexual
interactions with familiar characters, whereas male dreamers have more with unfamiliar characters.
Not only are the findings meager, but they may reflect the greater likelihood of sexual activity on the
part of college males in the past. We think our norms for sexuality in dreams should be used with
caution, especially with women, and that not too much should be made out of them. We also note
that sexual interactions in dreams are far more likely to be fraught with negative emotions than
popular stereotypes suggest (Jerasitis, 1992).
Activities
The main findings on activities can be summarized very briefly. The details can be found in
Table
E.10
. First, activities are frequent in dream reports, averaging 4.7 per dream report for males and 4.9
for females. Second, physical activity, movement, and talking account for 74% of men's activities in
dreams and 71% of women's. Finally, we think it may be useful in future studies to divide the
number of dreamer-involved physical activities by the total number of dreamer-involved activities to
derive a "physical activities percent." The normative expectation for men is 61% and for women
56%. For the most part, we use the activities categories primarily for normative comparisons with
other societies, not for individual studies unless we notice some unusual frequencies.
Successes and Failures
Successes and failures are not very frequent in the dream reports of either males or females. Most
successes and failures occurred to the dreamer. There was rarely a "consequence" of a success or
failure in the normative study. We use these findings to determine if the dreamer has an unusually
large percentage of dreams with successes or failures in them. We also use these findings to derive
our "success percent," which is the number of dreamer-involved successes divided by the number of
dreamer-involved successes and failures; this percentage is 51 for men and 42 for women. The
details for the findings on successes and failures can be found in
Table E.11
.
Misfortunes and Good Fortunes
Misfortunes occur in 36% of men's dream reports and 33% of women's. Good fortunes happen in
only 6% of dream reports for both men and women. Misfortunes are followed by good fortune,
success, or friendliness about 10% of the time for men and 6% of the time for women. In the
normative sample, good fortunes were never followed by any "consequences," positive or negative.
Misfortunes are of use to us in two ways. First, we always check the percentage of dream reports in a
series or set with at least one misfortune. Second, we use the "bodily misfortunes percent" as a
possible psychopathology indicator, as explained in chapter 2. This figure is 29% for men and 35%
for women. The specific findings on misfortunes and good fortunes can be found in
Tables E.12 and
E.13
.
Emotions
As mentioned in chapter 2, it is surprising how few emotions are included in dream reports.
Women express more emotions than men, but the distribution of types of emotions is about the same.
Negative emotions account for 80% of all emotions reported. This figure is our normative
expectation when using the negative emotions percent as a possible indicator of psychopathology.
The figure is 79% for men and 82% for women if only emotions expressed by the dreamer are
included. The main findings on emotions are presented in
Table E.14
.
Settings
Strona 8 z 24
Finding Meaning in Dreams: Chapter 4
2009-02-11
file://E:\prace\artykuły\sny\ksiazki\finding_meaning_in_dreams\Finding Meaning in ...

Few dreams lack a setting. There were virtually identical numbers of settings in both samples, 644
in the 500 male dream reports, 654 in the 500 female reports. However, our quantitative findings on
the nature of settings are generally prosaic, perhaps because the categories had to be so few and so
general to achieve adequate intercoder reliability.
The most useful of the findings on settings in our experience concern the dimensions of indoor/
outdoor, familiar/unfamiliar, and distorted/normal, although there are usually very few distorted
settings. To make the findings on indoor/outdoor more clear, we ignore findings on "ambiguous" and
"no setting" codings, where there are small numbers and no gender differences. We then can say that
when a setting can be coded indoor or outdoor, women are indoors 62% of the time and men 49% of
the time. This finding is presented in Table 4.5.
If we look only at settings that can be clearly coded as familiar or unfamiliar, there is once again a
gender difference. Although familiar settings predominate for both men and women, women are
even more likely to be in familiar settings than men. This finding is presented in Table 4.6. The
details on all the findings on settings are presented in
Table E.15
.
Table 4.5. Frequency and Percentage of Indoor and Outdoor
Settings in Men and Women's Dream Reports
Men
Women
Indoor Settings
284 (48%) 362 (61%)
Outdoor Settings 302 (52%) 229 (39%)
h = .26; significance level = .0000; 95% confidence interval = .15 to .37
Table 4.6. Frequency and Percentage of Familiar and Unfamiliar
Settings in Men and Women's Dream Reports
Men
Women
Familiar Settings
197 (62%) 241 (79%)
Unfamiliar Settings 123 (38%) 65 (21%)
h = .38; significance level = .0000; 95% confidence interval = .22 to .54
Objects
There are many objects in dreams. The typical dream report has between two and nine objects,
with a mean of 4.8 for men and 5.3 for women. Only 20 male dream narratives and 11 female dream
narratives in the normative sample had no objects in them. Where we have found these categories of
greatest use is in the study of individual dream series in which there is an unusually high percentage
of some rare category. Two gender differences in the objects category have been of use in later
replication studies: although the frequencies are small, men are three times as likely to dream about
implements, such as tools and weapons, and women are more likely to dream about clothing.
Table E.16
presents the large number of specific findings on objects in dream reports. This table
provides the basis for determining the "torso/anatomy percent" presented in chapter 2 as a possible
indicator of disturbances in bodily image. As noted there, the torso/anatomy percent is determined by
dividing the sum of torso, anatomy, and sexual organ references by the frequency of all body parts.
The normative torso/anatomy percent is 31 for men and 20 for women.
Remaining Categories
Strona 9 z 24
Finding Meaning in Dreams: Chapter 4
2009-02-11
file://E:\prace\artykuły\sny\ksiazki\finding_meaning_in_dreams\Finding Meaning in ...
The findings for modifiers are presented in
Table E.17
; negatives, temporal references, and food
and eating are presented in
Tables E.18 through E.20
. These categories have not been used as
frequently as the categories presented earlier. The findings are worthy of only the briefest mention
here. The frequencies are not large in most instances, with the exception of "size" (large/small) and
"intensity" on the modifiers scale. There are no major gender differences, although women tend to
use more negatives in their reports than men. We have created no percentages or indexes using any
of these findings. These findings await further exploration and creative development.
There are no norms for the Elements From the Past or Unusual Elements Scales.
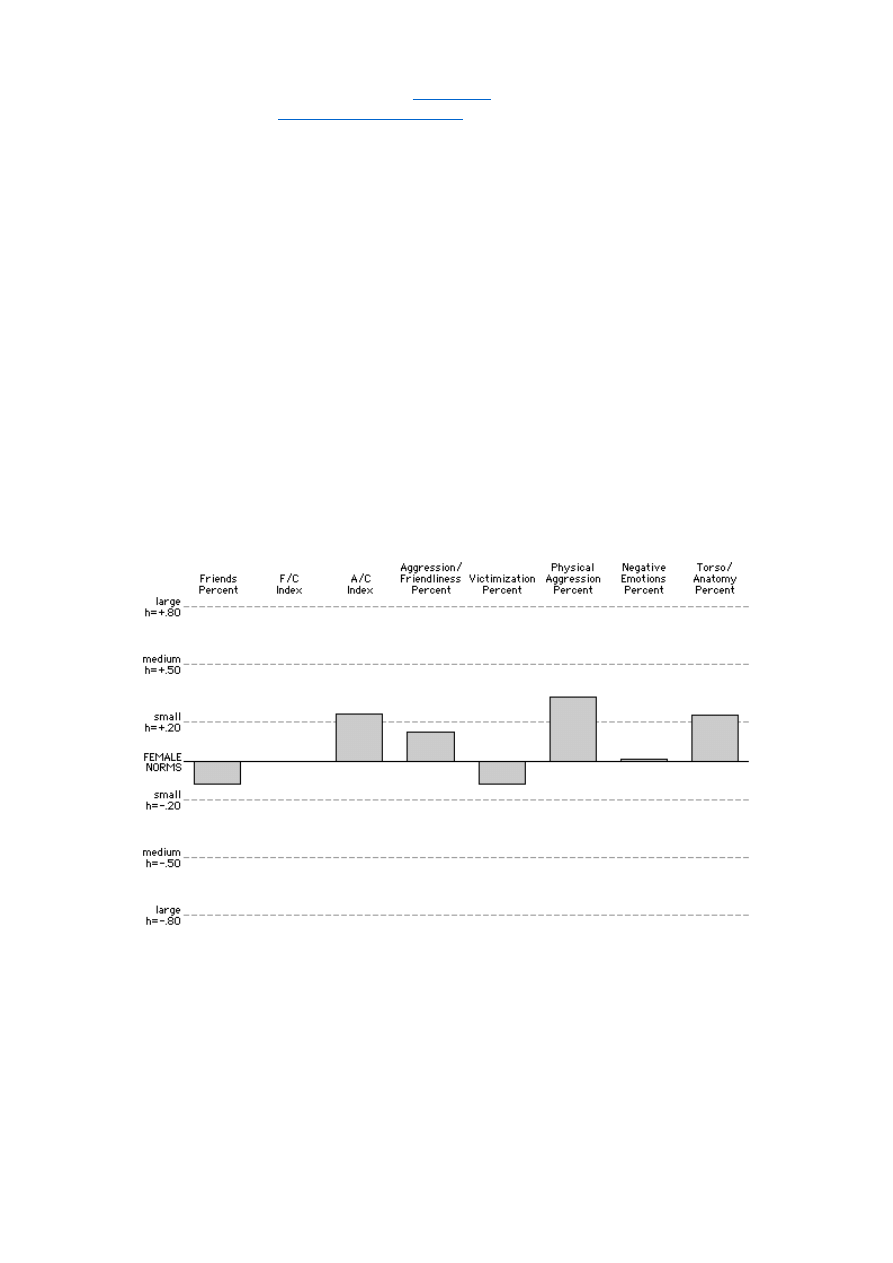
The h-Profile
It is often difficult to comprehend a large number of numerical comparisons. A graphic display of
results makes the task easier and more interesting. It also allows us to detect patterns more quickly if
we are making comparisons among many groups or individuals. We therefore use our effect sizes to
create what we call the "h-profile," defined as a display of the differences between one group and
another (or our norms) for any combination of our percentages and indexes we may choose to
compare. In Figure 4.1 we present the h-profile for male dreamers as it compares with our female
norms on several major indexes. As can be seen, it immediately shows the most salient differences,
those related to aggression. It gives a sense of pattern.
How Large Should Samples of Dream Reports Be?
As noted at the outset of the chapter, the norms for the Hall/Van de Castle coding system are
based on 500 dream reports from 100 females and a similar number of reports from the same number
of males. But were that many dream reports necessary to obtain a representative sample of the dream
life of these college students? More exactly, how large a subsample is necessary to approximate the
overall findings with the full sample? We think the answer to this question is very important because
it gives us a good idea of how large samples of dream reports should be in order to be confident that
we have an accurate (representative) portrait of a group's dream life.
Figure 4.1. h-Profile of males compared to the Female Norms.
Strona 10 z 24
Finding Meaning in Dreams: Chapter 4
2009-02-11
file://E:\prace\artykuły\sny\ksiazki\finding_meaning_in_dreams\Finding Meaning in ...

To answer our question, Adam Schneider compared randomized subsamples of 25, 50, 75, 100,
and 250 dream reports coded by Hall and Van de Castle for the original normative study. Schneider
used dream reports from the male sample, the only one we could find in Hall's files. The findings for
each sample size were compared with each other and the norms.
The important finding that emerges from the many comparisons computed by Schneider is that it
takes about 100 dream reports to approximate the norms. At one extreme, sets of 25 have widely
fluctuating departures from the norms and are almost certainly not useful. At the other extreme, 250
dream narratives replicate the norms almost exactly; this finding could be of great use to those who
might wish to generate new norms for people in other countries. With sets of 50, the findings on
most of our measures have settled down considerably compared to sets of 25, but the average
departure from the norms for most indicators was usually over ten percentage points. By comparison,
the average departures from the norms were generally cut in half with 15 samples of 100 dream
reports each, and were small enough to make samples of that size useful on most of our measures.
The main findings from Schneider's analyses are displayed in Table 4.7. The average departure
from the norms for many different random subsamples of 50, 75, and 100 dream reports are
presented. The table shows that some measures have reasonable stability at 50 or 75 dream reports,
such as the A/C and F/C indexes, but that 100 narratives are needed to bring the average departure
from the norms to under 10 percentage points for most measures. The information on the stability of
specific measures can be used in two ways. First, it can tell researchers what sample size is needed if
they are interested in focusing on only a few measures for one theoretical reason or another.
Conversely, if researchers find themselves with samples of only 50 or 75 dream reports that cannot
be augmented, this table tells them what indicators they can use with some degree of confidence.
Table 4.7. Average Departures from the Male Norms with
Numerous Random Samples of Varying Size
*
Category
Male
Norms
Sets
of 250
Sets
of 125
Sets
of 100
Sets
of 75
Sets
of 50
Sets
of 25
Characters
Animal Percent
6%
±0.9
±1.3
±1.7
±1.9 ±4.4 ±7.6
Male/Female Percent
67/33%
±1.6
±4.3
±4.4
±6.0 ±8.4 ±13.6
Familiarity Percent
45%
±0.3
±3.4
±5.3
±4.4 ±8.4 ±13.4
Friends Percent
31%
±0.9
±3.1
±5.7
±6.2 ±11.7 ±16.1
Social interactions
A/C Index
.34
±.018 ±.048 ±.044 ±.057 ±.065 ±.136
F/C Index
.21
±.004 ±.021 ±.027 ±.032 ±.050 ±.117
Aggression/Friendliness Percent
59%
±1.3
±4.6
±5.0
±6.2 ±8.8 ±18.8
Victimization Percent
60%
±1.3
±7.1
±7.0
±8.2 ±14.9 ±29.2
Befriender Percent
50%
±2.0
±8.8
±10.1 ±11.8 ±18.0 ±30.3
Physical Aggression Percent
50%
±1.2
±4.5
±7.2
±8.1 ±15.4 ±25.6
Settings
Indoor Setting Percent
49%
±1.2
±3.2
±5.2
±5.0 ±8.7 ±13.4
Familiar Setting Percent
62%
±1.3
±6.5
±5.5
±9.6 ±13.1 ±24.6
Other categories
Dreamer-Involved Success Percent
51%
±5.1
±10.9 ±10.5 ±13.5 ±26.3 ±48.1
Bodily Misfortunes Percent
29%
±0.8
±2.3
±4.4
±8.6 ±12.1 ±25.9
Torso/Anatomy Percent
31%
±0.8
±7.2
±11.1 ±9.2 ±17.3 ±28.6
Negative Emotions Percent
80%
±2.6
±6.2
±7.5
±9.1 ±13.4 ±20.3
Percentage of dream reports
with at least one:
Strona 11 z 24
Finding Meaning in Dreams: Chapter 4
2009-02-11
file://E:\prace\artykuły\sny\ksiazki\finding_meaning_in_dreams\Finding Meaning in ...

We think the findings presented in this section also can be used as one dimension in judging the
usefulness of past studies of the dream life of a group. We also think these findings could be used to
set the minimal sample size for publishable quantitative studies of dream content using the Hall/Van
de Castle system. We recognize that statistical tests might be able to detect large differences between
two or more groups with sample sizes smaller than 100. However, we think the focus of future
research using this coding system should be on what we believe is a more useful kind of comparison,
namely, one with the Hall/Van de Castle norms. Sample sizes of at least 100 are needed to approach
this goal.
By coincidence or not, findings we will present in chapter 7 lead to a similar figure for what
constitutes an adequate sample of the dream life of an individual. That is, it once again takes a
subsample of about 100 dream reports for the quantitative findings to resemble those for the entire
series of 200 or more dream narratives.
Most Recent Dreams: A ew Methodology
Some potential dream content analysts may worry that they will not be able to obtain enough
dream reports to do good studies, but we have found there is a simple and excellent way to create
very large representative samples. Since the Hall/Van de Castle norms can be approximated with 100
everyday dreams from 100 people, it follows that 100 Most Recent Dreams should provide an
adequate sample. We have tested this hypothesis and found support for it with 100 Most Recent
Dreams from women students at the University of California, Santa Cruz, in 1992 and 1993. We
simply ask students to write down the most recent dream they can remember, whether it was "last
night, last week, or last month." To reinforce this emphasis on recency, we first ask people to write
down the date and the time of day they recalled the dream. This information also can be used to
screen out dreams not recalled within the past few days, thus making even more certain that the
dream reports in the sample are recent ones. The instructions we use are reprinted in Appendix C.
The importance of emphasizing Most Recent Dreams in such studies cannot be overestimated
because of the tendency for people to report a recurrent dream, nightmare, or an especially unusual
dream if they are asked in a general way to report a dream. This is what happened, for example,
when Stanley Krippner asked a television audience to send him a dream: 33% of the dream reports
he received were described as recurring ones, and many respondents reported that they experienced
Aggression
47%
±1.9
±5.7
±7.4
±7.6 ±11.3 ±17.3
Friendliness
38%
±1.0
±4.0
±4.7
±8.0 ±10.7 ±18.0
Sexuality
12%
±2.2
±3.7
±4.0
±5.1 ±7.3 ±14.7
Misfortune
36%
±0.4
±2.8
±4.6
±6.2 ±8.7 ±17.3
Success
15%
±1.1
±3.2
±5.4
±5.6 ±10.0 ±15.3
Failure
15%
±1.9
±4.1
±5.2
±6.2 ±8.7 ±15.3
* Three sets of random numbers were utilized, making it possible to draw 20 sets of
25, 10 sets of 50, 6 sets of 75, 5 sets of 100, 4 sets of 125, and 2 sets of 250 three
different times from the full set of 500 dream reports, thereby creating a total of 60
sets of 25 reports, 30 sets of 50 reports, 18 sets of 75, 15 sets of 100, 12 sets of
125, and 6 sets of 250. The phrase "average" departure from the norms" is used to
avoid any confusion that might arise from the use of the statistical terms "deviation"
and "range." The numbers in the table are an average of all the departures from the
norms for a given set of samples. The use of the plus/minus signs indicates that the
departure is, on average, that many points above or below the normative figure in
the lefthand column of the table. For example, the ±1.7 for the Animal Percent for
sets of 100 dream reports means that the findings for the subsets fell, on average,
between 4.3% and 7.7% (the normative figure is 6%). Similarly, the figure ±4.4 for
the A/C index for sets of 100 dream reports means that the subsets fell on the
average between .296 and .384 (the normative figure is .34).
Strona 12 z 24
Finding Meaning in Dreams: Chapter 4
2009-02-11
file://E:\prace\artykuły\sny\ksiazki\finding_meaning_in_dreams\Finding Meaning in ...

the dream years earlier, sometimes in childhood (Rubenstein and Krippner, 1991: 41). It is not
surprising that the findings differed from the Hall/Van de Castle norms.
Studies based on Most Recent Dreams hold out the possibility of expanding dream content studies
to a wide range of subgroups within the college population from skydivers to racial minorities to
gays and lesbians. They also hold the potential for cross-national studies in which Most Recent
Dreams are collected on the same date in many different universities around the world. Moreover,
large samples of Most Recent Dreams can be analyzed very quickly by focusing on the question of
what percentage of the reports have at least one aggression, friendliness, sexuality, misfortune,
success, or failure. This approach allows investigators to bypass coding the dream narratives for
characters and avoids detailed classification of social interactions.
Given the solid rationale for studies of Most Recent Dreams using 100 or more subjects in each
group, the day of studies using small samples of two to five dreams from a handful of subjects
should be over. Such studies lead nowhere intellectually, as the problems they cause in the dream
content literature convincingly show. If it is not possible to obtain lengthy dream series from
individuals, then it is far better to work with one recent dream from each of many subjects, as our
research demonstrates. It is also easier to obtain one Most Recent Dream from students in a
classroom, dorm, or dining hall than it is to obtain dream diaries with even five dreams in them from
more than a handful of subjects.
Replications and Follow-ups
We turn now to several follow-up studies that can be seen in part as attempts to replicate the
findings presented so far in this chapter. They are more than replications, however, for some of them
sought to determine if historical changes, all-female settings, or racial and ethnic differences might
influence the findings.
The Richmond Study
Dream reports collected from predominantly European-American students at the University of
Richmond in 1979 for a study of emotions in dream reports (Stairs and Blick, 1979) provided an
unplanned opportunity to see what if anything had changed in the dreams of college students over a
30-year period (Hall, Domhoff, Blick, and Weisner, 1982). This Richmond sample, as we came to
call it, consisted of three, four, or five reports by each of 53 males and 69 females for a total of 263
male reports and 340 female reports. The reports were collected with instructions very similar to
those used by Hall in his earlier work. Case Western Reserve University and the University of
Richmond, although in different parts of the country, are both private, urban coeducational
universities whose students come from the middle and upper-middle socioeconomic strata. The
dream reports were collected in psychology classes at both universities.
Due to time constraints on the investigators, only selected categories from the Hall/Van de Castle
system were utilized. The categories were selected on the basis of three criteria. First, they had been
used in several studies subsequent to the normative study. Second, they are categories with large
frequencies. Third, some of them have shown gender differences and others have not.
The findings of this study can be presented in two ways. First, the Richmond males and females
can be compared with the Hall/Van de Castle norms for males and females. The results of that
comparison show there are few differences and that the differences are relatively small in magnitude
even when they are statistically significant. Specifically, Richmond males and females report a
higher percentage of familiar characters than the norms. Richmond males have a lower percentage of
total friendliness, friendliness with males, and friendliness with unfamiliar characters. Richmond
females have a lower percentage of total friendliness. Richmond males have a lower percentage of
Strona 13 z 24
Finding Meaning in Dreams: Chapter 4
2009-02-11
file://E:\prace\artykuły\sny\ksiazki\finding_meaning_in_dreams\Finding Meaning in ...

dreams with at least one sexual encounter and with references to clothing. Richmond females also
have a lower percentage of references to clothing. In all, of 40 comparisons, only nine are
statistically significant, six for males, three for females.
The second way to compare the findings is to see if the gender similarities and differences for the
norms are the same as they are for the Richmond study. Rather remarkably, there was not a single
change. Where there were gender differences in the norms, there were gender differences in the
Richmond study. Where there were no gender differences in 1950, there were no gender differences
in 1980.
Hall et al. were careful to note they did not know why there were so few differences between the
two sets of dream reports. They mention three "possible" answers: that "human nature" has not
changed, that 30 years is too short a time for the effects of social changes to manifest themselves in
dream reports, and that any changes in American society in the past 30 years have not been very
significant (Hall et al., 1982:193). They then wrote that "we cannot say which, if any, of these
answers is the correct one ..."
Despite this caution, their conclusions have been misinterpreted by some dream researchers. For
example, after reporting the findings accurately, Cartwright and Lamberg (1992:82) imply that the
authors attribute the lack of differences to the alleged fact that "human nature has not changed."
Since few readers of Cartwright and Lamberg's popular book are likely to read the original report,
this mischaracterization of the "interpretation" of the findings can be described not only as
inaccurate, but as unfortunate. Statements like Cartwright and Lamberg's obscure the fact that
extremely important findings were reported. Such statements also steer feminist social scientists
away from quantitative content analysis.
The Salem College Study
Salem College is a small, private all-women's college in Winston-Salem, North Carolina. It is very
similar to Case Western Reserve and the University of Richmond in that its students are mostly
European-Americans who come from middle and upper-middle social strata. In 1987 Linda Dudley
and one of her students (Dudley and Fungaroli, 1987) collected dreams from 12 female students
enrolled in a special upper-division topics course in psychology to see if the dream reports of
students at a women's college differed from those of women in the normative sample. With a sample
of 141 dream reports, they found there were both striking similarities and some interesting
differences.
The consistencies were found for character and settings. The male/female percent for Salem
women was 46/54 as compared with 48/52 in the norms. The familiarity percent was 65 at Salem
compared to 58 for the norms. The percentage of indoor settings was 60 at Salem compared to 61 for
the norms.
There were some interesting differences in the patterns of social interactions. Whereas women in
the Hall/Van de Castle normative study had more aggressive acts with males than with females (22%
with males vs. 14% with females in the norms), the women at Salem College had the same
percentage of aggressions with male and female characters (14% vs. 15%) due to less aggressive
interactions with males. In keeping with this finding for aggressions, it was found the Salem women
had a greater percentage of friendly interactions with women than the normative group (21% vs.
15%) even though their level of friendly interactions with male characters remained higher than with
female characters (27% for Salem, 24% for the norms). Taken together, these findings lead to the
cautious "interpretation" that the all-women's environment led to less aggression with men and more
friendliness with women. It is the kind of finding that is clearly worth testing in other social
situations.
Strona 14 z 24
Finding Meaning in Dreams: Chapter 4
2009-02-11
file://E:\prace\artykuły\sny\ksiazki\finding_meaning_in_dreams\Finding Meaning in ...

In spring, 1990, Dudley did a follow-up study with 33 women in an introductory psychology class
(Dudley and Swank, 1990). Their average age was 18.5. The findings were very similar to her first
study. The women continued to have a higher percentage of friendliness with women than women in
the normative group. However, the decline in aggression with male characters was not as great,
perhaps because they had not been at Salem College as long. The findings for the two Salem studies
are compared with the norms in Table 4.8.
Dudley and her students have made an important contribution to the quantitative study of dream
content by realizing that they had a unique situation in which to collect dream reports. Their findings
have strengthened our confidence in the normative findings and given us new hypotheses to explore
about why dream reports may vary in their percentages of friendly or aggressive interactions with
male and female dream characters.
Table 4.8. Comparison of Norm Women with 1987 and 1990 Salem
Women Across Content Categories
Content Variable
Hall/VDC Norms 1987 Salem 1990 Salem
Characters
Percent Male
48
46
49
Percent Female
52
54
51
Percent Familiar
58
65
65
Interactions
Aggression with Males
22
14
19
Aggression with Females
14
15
14
Friendliness with Males
24
27
27
Friendliness with Females
15
21
21
% dreams with sex
04
Not Studied
08
Settings
Indoor
61
60
61
Outdoor
39
40
39
Adapted from Dudley, L., & Swank, M. (1990). A comparison of the dreams of
college women in 1950 and 1990. ASD Newsletter 7(5), 3.
The Berkeley Study
The first study of the dream reports of women at a major public university was made by Tonay
(1990-91). Moreover, that university was the best-known campus in the state of California, the
University of California at Berkeley. Tonay's study included many safeguards to improve the quality
of her data. It also included an ethnicity component. It did not include men because not enough of
them turned in dream reports.
The subjects were 100 of 220 women attending an upper-division psychology class on the
Berkeley campus. They participated voluntarily and received no compensation. Students were
invited to submit five consecutive dreams on basically the same forms originally used by Hall and
assured of anonymity. After three weeks, 109 dream booklets had been collected. Five subjects said
they recalled no dreams during the time period, leaving 104 subjects. Four other subjects later
admitted on the post-study questionnaire discussed in the previous chapter that they had made up
dreams, leaving 100 subjects and 500 dream reports. The typical subject was 21 years old, single,
middle class, and a social science major with a 3.22 average. Most of the subjects were European-
American or Asian-American. The volunteer subjects did not differ on any of these variables from
the students in the class who did not participate.
Strona 15 z 24
Finding Meaning in Dreams: Chapter 4
2009-02-11
file://E:\prace\artykuły\sny\ksiazki\finding_meaning_in_dreams\Finding Meaning in ...

The dream reports were put into a common pile and randomized before they were coded by two
female undergraduate assistants trained by Tonay. Dreams were randomized again after the coding
for each category. A third person compared the coding by the two raters. The rare disagreements
were resolved by agreement between the two raters. The findings for 24 comparisons in the
categories for characters, settings, friendliness, and sexuality did not reveal a single significant
difference from the norms. For emotions and aggressions, there were three differences, all of which
may be plausibly interpreted as showing more assertiveness and outgoingness on the part of these
women. First, there were more emotions in their dream reports. Second, they were more likely to be
victims of women characters than in the past. Third, they were more likely to be aggressors than in
the past, meaning in the terms adopted for this book that their victimization percent had declined.
However, Tonay counted aggressions reciprocated by the dreamer as instances of being an
aggressor, so her findings are not strictly comparable to the norms on this issue. Including reciprocal
aggressions in our equation for the victimization percent drops it from 67 to 60 for women and from
60 to 52 for men.
Tonay's study included a comparison of Asian-American and non-Asian-American women. As
Table 4.9 shows, there were very few differences between the two samples. The Asian-American
women were more likely to be in unfamiliar settings. They were less likely to act as the aggressors in
their dreams, and were more often the victims of male characters than non-Asian-Americans. Citing
studies of the deferential way in which Asian-American women are often socialized (Hsu, 1971;
Fong, 1973; Chow, 1984), Tonay (1990-1991:93-94) hypotheses that the differences on the
aggression scores are consonant with subcultural differences.
Table 4.9. Sub-Cultural Comparison: Dream Content of Asian-
Americans and Non-Asian-Americans at Berkeley
Category
Percentages
Asian-Americans Non-Asian-Americans
Characters
Animals
01
04
Humans
97
95
Males
30
35
Females
40
33
Familiar
51
56
Unfamiliar
49
43
Setting
Indoor
49
41
Outdoor
32
32
Familiar
25
28
Unfamiliar
29*
04
Friendliness
Dreamer-involved
80
80
D as befriender
38
39
D as befriended
54
42
Emotions
D-experienced
90
81
Aggression
Dreamer-involved
79
84
D as Aggressor
27*
49
D as Victim of males
50*
36
D as Victim of females
35
35
Strona 16 z 24
Finding Meaning in Dreams: Chapter 4
2009-02-11
file://E:\prace\artykuły\sny\ksiazki\finding_meaning_in_dreams\Finding Meaning in ...

The few interesting differences aside, what stands out in the findings of these first three replication
studies is their consistency with previous findings. Dream reports collected at Case Western Reserve
(1950), the University of Richmond (1979), the University of California, Berkeley (1986), and
Salem College (1987 and 1990) all provide essentially the same results. This is an impressive record
of replications. It would seem that the norms for the Hall/Van de Castle system are a rock we can
stand on in a sea of uncertainty when it comes to studying home dream reports from European-
American and Asian-American college students.
* p < .05, two-tailed.
Note: Various percentages do not sum to 100 (e.g., indoor/outdoor,
familiar/unfamiliar, befriender/befriended) because findings for some categories are
not included in the table.
Crane Community College: An African-American Sample
In spring, 1967, an instructor in psychology at Crane Community College in Chicago, Stephen
Gornik, offered to collect dream reports for Hall in his psychology class. All of the students were
African-Americans. Students were asked, but not required, to turn in their dreams on the standard
report form. Gornik received 101 reports from 12 males and 233 reports from 25 females. The
students ranged in age from 18 to 29; most were in their early 20s. Unlike our earlier samples, many
of these students still lived at home, which may be a factor in some of the differences Hall found.
Gornik characterized these students to Hall in the following words:
The student population represents what I would call a rising Negro middle class. While they come
from poverty areas, they are strongly motivated to achieve and improve themselves, but in a
direction that is not clearly delineated for them (Personal Letter to Calvin S. Hall, August 16, 1967).
Hall analyzed the dream reports for all the Hall/Van de Castle categories except settings,
activities, and descriptive elements. The findings for males and females were compared with the
Hall/Van de Castle norms and then with each other. There were a great many similarities with the
norms, but there also were some interesting differences as well. We begin with a brief summary of
the similarities.
There were no differences between the two groups on objects, emotions, misfortunes and good
fortunes, success and failure, number of sex dreams, or number of food and eating dreams. There
were no differences between African-American males and European-American males on overall
aggression or on any of our measures relating to friendliness. Where, then, do any differences lie?
First, African-American males had five differences with European-American males, three in
character categories, two on aggression measures:
1. The male/female percent for African-American males was much lower (53/47% vs. 67/33%,
significant at the .001 level, h = .29). This means there were more female characters in their
dream reports.
2. There were more familiar characters (66% vs. 45%, significant at the .001 level, h = .43).
3. There were more family members and relatives in the dream reports of African-American
males (30% vs. 12%, significant at the .001 level, h = .45), which is the main reason why there
were more familiar characters in their dream reports.
4. African-American males had even less aggressive interactions with female characters than
European-Americans do (A/C index = 08 vs. 17, significant at the .05 level, h = .30).
5. African-American males had slightly more physical aggressions with all classes of characters
than do European-American males (59% vs. 50%, significant at the .001 level, h = .18).
Strona 17 z 24
Finding Meaning in Dreams: Chapter 4
2009-02-11
file://E:\prace\artykuły\sny\ksiazki\finding_meaning_in_dreams\Finding Meaning in ...

Before we comment on these differences, let us look at some differences between the African-
American and European-American females:
1. Like African-American males, the African-American females differed from their European-
American counterparts in having more family members in their dream reports (29% vs. 19%,
significant at the .001 level, h = .24).
2. Like African-American males, the African-American females differed from their European-
American counterparts in having a higher proportion of physical aggression (47% vs. 34%,
significant at the .01 level, h = .27).
What is most striking between the two sets of women, however, is that the African-American
females were both more friendly and more aggressive in their dream reports:
3. More total friendliness (F/C index = .31 vs. .22, .001 level, h = .21).
4. More friendliness with male characters (F/C = .38 vs. .24, .001 level, h = .30).
5. More friendliness with female characters (F/C = .23 vs. .15, .001 level, h = .21).
6. More total aggression (A/C = .39 vs. .24, .0001 level, h = .33).
7. More aggression with male characters (A/C = .29 vs. .22, .05 level, h = .16).
8. More aggression with female characters (A/C = .22 vs. .14, .01 level, h = .21).
Taken as a whole, what do these differences between European-Americans and African-
Americans seem to indicate? We are nowhere near the point in our presentation of the full range of
findings with the Hall/Van de Castle system where we want to try to make a case for a relationship
between dream content and either personality or culture. Nor do we have enough information on the
people in this sample to make a very strong argument even if we were ready to do so. Then too, the
higher percentages for family members may be due to living at home instead of in a dorm or separate
apartment.
Still, we would hazard two hypotheses, which we will immediately "test" when we compare
gender differences within the African-American sample. First, unlike the European-American
sample, women and the family seem to be as salient in the dreaming minds of the men as they are in
the minds of the women. Second, there is less of a gender difference in social interactions in the
African-American sample. Let us now see how these suggestions fit with gender findings within the
African-American sample.
For most of our categories, the gender differences within the African-American sample are similar
to those in the Hall/Van de Castle norms. This finding is in effect contained within the long list of
"no differences" between the two groups of males and two groups of females with which we began a
recounting of our findings several paragraphs ago. However, some of the differences we then
reported between the two groups of males and females also imply gender differences within the
African-American sample. These differences seem potentially quite interesting.
First, the usual gender difference in the male/female percent disappears, showing an equal
saliency of male and female characters in both genders. This point is made in Table 4.10, comparing
male and female dreamers in both samples.
Table 4.10. Male/Female Percent for African-American and
European-American College Students
Men Women
African-Americans
53/47
54/46
European-Americans 67/33
48/52
Strona 18 z 24
Finding Meaning in Dreams: Chapter 4
2009-02-11
file://E:\prace\artykuły\sny\ksiazki\finding_meaning_in_dreams\Finding Meaning in ...

Second, the gender difference on familiarity percent is reversed. For European-Americans, women
have the higher familiarity percent; for the African-Americans in this sample, men have the higher
familiarity percent. This reversal is entirely due to the difference between the two samples of males,
as can be seen in Table 4.11.
Finally, the gender difference in the A/C index is reversed. For European-Americans, the males
have a higher A/C index. For African-Americans in this sample, women have the higher A/C index.
This reversal is due to the difference between the two samples of females, as can be seen in Table
4.12.
As we noted a moment ago, we are not in a position to draw conclusions from these findings, but
there are interesting and suggestive patterns implied. There seem to be subcultural differences
between the two groups, and the findings on gender differences suggest gender relations may be very
different in the two groups. It is also noteworthy that African-American women in this sample are
both more friendly and more aggressive with each other in their dreams than European-American
women are with each other.
The foregoing paragraph is very far from an analysis. We would need behavioral information of
the kind we are going to present in chapter 8 before we would begin to take any analysis seriously.
We also would want to replicate the findings in other African-American samples. It would make the
findings even more powerful if they could be replicated in other tight-knit communities, or in other
groups where male/female power relations are thought to be more equal, whatever the race or
ethnicity of these groups.
Table 4.11. Familiarity Percent for African-American and
European-American College Students
Men Women
African-Americans
66
56
European-Americans
45
58
Table 4.12. A/C Indexes for African-American and European-
American Men and Women
Men Women
African-Americans
31
39
European-Americans
34
24
Mexican-Americans at Two Different Universities
There is one study relating to Mexican-American college students using the Hall/Van de Castle
system (Kane et al., 1993). It compares Mexican-American and Anglo-American women from four
colleges and universities in San Antonio with each other and with Mexican women from four
universities in Mexico City. The students were given dream diaries in which they were asked to
record the first five dreams they recalled in a three-week period. Many hundreds of dream reports
were collected. A random sample of 30 women was drawn from each group of between 40 and 50
women, and one dream was drawn randomly from the series provided by each of the 30 women. The
dream reports were compared for number of characters, emotions, aggressions, friendly interactions,
sexual interactions, achievement strivings, and misfortunes and good fortunes. There were no
statistically significant differences between the Mexican-American and Anglo-American women in
any category. There were two significant differences between Anglo-Americans and Mexicans: there
were more emotions and more misfortunes and good fortunes in the dream reports of the Mexicans.
There is, unfortunately, one serious drawback with this study. There are only 30 dream reports in
Strona 19 z 24
Finding Meaning in Dreams: Chapter 4
2009-02-11
file://E:\prace\artykuły\sny\ksiazki\finding_meaning_in_dreams\Finding Meaning in ...

each sample. The rest of the dream reports need to be analyzed, or else new studies need to be
done, before we can be confident of the reported findings.
Although there are no studies using the Hall/Van de Castle system that included Mexican-
American male students, Brenneis and Roll (1975) and Brenneis 1976) compared the dream reports
of Mexican-American and Anglo-American male and female students at the University of New
Mexico using the scale of "34 ego dimensions" developed by Brenneis and discussed in chapter 2.
Their results are not strictly comparable with other findings in this chapter, but there is enough
overlap in some of the scales to make several of their findings of interest.
For this study there were 42 Chicano males, 65 Chicana females, 61 Anglo males, and 74 Anglo
females. All were volunteers. The average age for all four groups was between 20 and 21. The
Chicano volunteers were accepted if Spanish was spoken in their homes and if they identified
themselves as Chicanos. There was a total of 1123 dream reports, 203 from male Chicanos, 309 from
female Chicanos, 283 from male Anglos, and 328 from female Anglos (Brenneis, 1976:281).
If we look first at the findings for the Mexican-Americans, we see there are a number of gender
differences that are by now familiar to us. There are more characters in women's dreams, and a
greater percentage of them are known to the dreamer. There is a higher percentage of male
characters in the men's dream reports. Male dreamers more often have "contentious" or "negative"
interactions; there is more aggression, sexuality, and depiction of physical injury in their dream
reports. Women are more likely to be in enclosed and familiar settings, men to be in larger and more
open settings (Brenneis and Roll, 1975:179; Brenneis, 1976:283-284).
The main cultural difference between the Mexican-Americans and Anglo-Americans was a greater
exaggeration of the gender differences in Mexican-Americans (Brenneis, 1976:287). In addition,
more familiar settings appear in the dream reports of Mexican-Americans, and there was a tendency
-- which did not reach statistical significance -- for there to be more characters (Brenneis, 1976:284).
Brenneis (1976:287) also claims "death themes" appear more frequently in the dream reports of
Mexican-Americans. He does so on the basis of earlier studies by Roll, Hinton, and Glazer (1974)
and Roll and Brenneis (1975). In the first of these two studies, there is no analysis of dream content,
nor even any dream reports, but only the results of a questionnaire in which subjects were asked
"Have You Ever Dreamed Of ..." for 48 topics.
Perhaps recognizing the weaknesses of questionnaire studies of "dream content," a second study
was done in which five dream reports were analyzed from 40 male and 40 female Mexican-
American college students and 40 male and 40 female Anglo college students at the University of
New Mexico. The study claims there is the same difference in "death themes," but the evidence for
this claim is doubtful at best. In this study the problem lies in the coding categories, which include
(1) "clear and obvious" death themes and (2) allegedly "symbolic" death themes (Roll and Brenneis,
1975:380). The "obvious" death themes were (1) dead people as though alive; (2) a relative or friend
dead; (3) seeing yourself as dead; (4) being hanged by the neck; (5) being buried alive; (6) seeing
mortuaries or graveyards; and (7) being in heaven or hell after death. The allegedly "symbolic" death
themes are (1) losing a limb; (2) being unable to breathe; (3) seeing lunatics or insane people; (4)
having teeth fall out or be pulled out; (5) being tied and unable to move; (6) seeing a creature part
animal and part human; and (7) seeing a body change grotesquely (Roll and Brenneis, 1975:380). No
evidence is presented that any of these elements relate to death, but this symbolic scale is the key to
the whole study, as we shall now show.
The alleged cultural differences achieved statistical significance for women only. However, "if the
realistic and symbolic content areas were treated separately, they do not achieve statistical
significance" (Roll and Brenneis, 1975:381). In other words, the claim stands or falls, to the degree it
can stand when males do not show the difference, on the validity of the allegedly "symbolic" death
themes. Roll and Brenneis provide no frequency counts by categories, so it is impossible to know
Strona 20 z 24
Finding Meaning in Dreams: Chapter 4
2009-02-11
file://E:\prace\artykuły\sny\ksiazki\finding_meaning_in_dreams\Finding Meaning in ...

where the two samples of women students may differ. It would be interesting to know out of
empirical curiosity just how often these students dream of seeing mortuaries, being hanged by the
neck, being in heaven or hell, losing a limb or teeth, or seeing insane people. Our guess, based on our
studies, is that it would not be very often.
Further support for the relative lack of differences between Mexican-American and Anglo-
American dreamers can be found in a study using the Hall/Van de Castle scales to study aggressions
and misfortunes in the dream reports of 140 Mexican-American and Anglo-American teenage
delinquents and non-delinquents in Tucson, Arizona (Leman, 1967). Subjects were matched for age,
intelligence, and socioeconomic level. There were no ethnic differences on either scale.
All in all, the dream reports of Mexican-Americans seem very similar to those of Anglo-
Americans. There may be some cultural differences, but the similarities and the common gender
differences seem to be greater.
Gender Changes or Flawed Methods?
Milton Kramer and his colleagues at the University of Cincinnati have applied the Hall/Van de
Castle coding system to dream reports collected in the laboratory. Most of their work is innovative
and useful. One of their studies concerned the norms for the character categories (Reichers, Kramer,
and Trinder, 1970), where they reported a very great similarity between the distribution of characters
in their sample of 418 laboratory reports and the Hall/Van de Castle norms.
Another study concerned gender differences in laboratory dream reports (Kramer, Kinney, and
Scharf, 1983). It is based on 11 males and 11 females, ages 20-25, who were students at the
University of Cincinnati. Subjects were awakened at the end of each of the first four REM periods
and asked to report what was going through their minds. In all, 1190 reports were collected from
1659 awakenings, for a recall rate of 72%.
The authors found there were no gender differences in the percentage of reports containing at least
one aggression or at least one misfortune suffered by the dreamer. Aggressions appeared in 12% of
the dream reports of both men and women. Women had misfortune to themselves in 12% of their
reports, men in 9%. The authors conclude that well-known gender differences on aggression have
thus disappeared, but their conclusion is mistaken.
According to the Hall/Van de Castle norms, 47% of male dream reports have at least one
aggression as compared to 44% of female dreams. Thus, there never was a difference between males
and females on aggression if the focus is on the percentage of reports with at least one aggression.
What the Kramer, Kinney, and Scharf findings show is a smaller percentage of aggression reports for
both sexes, which is in keeping with the differences between laboratory and home reports discussed
in the previous chapter. The same analysis obtains for misfortunes, as can be seen in Table 4.13.
Kramer, Kinney, and Scharf also coded the dream reports using Hall/Van de Castle scales for
characters (10 subscales), activities (9 subscales), and modifiers (21 subscales). They found male
dreams had more male characters and more strangers, which is consistent with the Hall/Van de
Castle norms. Males tended to mention large sizes more, also in keeping with the norms. However,
Kramer, Kinney, and Scharf also found men higher on five subscales where there had been no
gender difference previously, but the reasons are methodological, as we shall soon show. Most of
Table 4.13. Percentage of Dreams with at Least One Misfortune
Men Women
Hall/VDC Norms
36
33
Kramer, Kinney, Scharf
09
12
Strona 21 z 24
Finding Meaning in Dreams: Chapter 4
2009-02-11
file://E:\prace\artykuły\sny\ksiazki\finding_meaning_in_dreams\Finding Meaning in ...

these differences are on minor elements tending to occur infrequently in the Hall/Van de Castle
norms. We report the Hall/ Van de Castle findings on these elements in Table 4.14, then show what
Kramer, Kinney and Scharf did.
Using raw frequencies for each element, Kramer, Kinney, and Scharf turned the Hall/Van de
Castle findings into male/female ratios. They then compared these ratios to their ratios in Table 4.15.
Using the same procedure, Kramer, Kinney, and Scharf found women to be higher on two other
minor subscales in the modifier category that previously had shown no gender difference (Table
4.16).
Contrary to Kramer, Kinney, and Scharf (1983:1), their findings do not support their claim that the
"sexual revolution of the past two decades has indeed had some psychological impact in altering
some of the traditional differences" between the sexes. The different findings are in fact an artifact of
their flawed methodology.
The first problem with these findings is that the authors used raw frequencies for male and female
dreamers in the Hall/Van de Castle norms to create their M/F ratios. Such a procedure does not
correct for report length or different numbers of characters, activities, and modifiers in male and
female reports. In the Hall/Van de Castle norms, it will be recalled, the women's dreams were 8%
Table 4.14. Hall/Van de Castle Percentages on Selected
Categories
Men Women
Single characters
68.7
71.9
Auditory activity
01.6
01.4
Achromatic (C-)
03.9
04.6
Mention of old age (A+)
04.0
04.2
Mention of density (S+)
01.6
01.5
Linearity/straightness (L+) 00.4
00.4
Table 4.15. Comparison of M/F Ratios of Significant Variables
Cincinnati Norms
Single characters
1.44
.79
Male characters
2.70
1.17
Strangers
5.25
1.08
Auditory activity
2.45
1.04
Color minus
1.86
.64
Size plus
2.57
1.04
Age plus
2.33
.75
Density plus
4.88
.82
Linearity plus
3.55
.69
Table 4.16. The Normative and Cincinnati Findings on Two
Modifier Scales
Cincinnati M/F Normative M/F
Thinking activity
.05
.67
Intensity plus
.16
.75
Strona 22 z 24
Finding Meaning in Dreams: Chapter 4
2009-02-11
file://E:\prace\artykuły\sny\ksiazki\finding_meaning_in_dreams\Finding Meaning in ...

longer and contained more characters (1423 vs. 1180), more activities (2470 vs. 2362), and more
modifiers (1458 vs. 1110). Thus, ratios based on raw frequencies will be higher than a comparison
based upon indexes that control for differences in length of reports and raw frequencies. Ratios based
on raw frequencies may create "differences" where there are none when the proper corrections are
not made for differing report lengths and frequencies. For example, the percentage of single
characters for female dreamers (72%) is not much higher than for male dreamers (69%) even though
there are more single characters in women's dream reports. The Cincinnati study turned this small
difference into an M/F ratio of .79 by using raw frequencies.
With this information as a context, we can now see the second reason for the differences from the
norms in the Kramer, Kinney, and Scharf study: the men's dream reports turn out to be longer than
the women's for a change (116 words vs. 92). Thus, there is likely to be "more" of everything.
There is a third problem. It is not a good statistical practice to use ratios with very low
frequencies. Just a few cases can change ratios dramatically. Let us use the mention of straight lines
("straight plus") as an example. The M/F ratio for Cincinnati is 3.55 and only .57 for Hall/Van de
Castle, but in the Hall/Van de Castle norms we are talking about a frequency of four out of 1,110
modifiers in male dreams and a frequency of seven out of 1,458 modifiers in female dream reports.
That is, the .57 M/F ratio is based on dividing seven into four. Moreover, if we use percentages, as
we should, there is no gender difference -- "straightness" is used as a modifier 4% by males and 4%
by females in the Hall/Van de Castle norms.
We have discussed the Kramer, Kinney, and Scharf findings and claims at length for two reasons.
First, we think it is always a good idea to check for methodological differences when new findings
contradict established findings, rather than immediately to assume the differences are real and then
begin theoretical speculations. There often are real changes, but all explanations in terms of sampling
and statistical procedures should be thoroughly examined before the findings are assumed to be
different. In this particular case, the samples are different (men's reports are longer) and percentages
are not used. It is essential to follow all the rules of the system to make future findings compatible
and cumulative.
The second reason we have discussed these findings at length is that they have been used to
question the current accuracy of the Hall/Van de Castle norms (e.g., Lortie-Lussier, Schwab, and
DeKoninck, 1985:1012; Rubenstein, 1990:139; Rinfret et al., 1991:180; Lortie-Lussier et al.,
1992:81,93). There is thus a danger that those new to dream research will believe that the Hall/ Van
de Castle findings are "outdated." But they are not, as the replication studies from the 1980s cited
earlier in this chapter have demonstrated, and as a revised analysis of the Cincinnati findings also
indicates.
Conclusion
The numerous findings presented in this chapter give us very strong reason to believe that we
know what American college students dream about. The findings are robust over 45 years and
different regions of the country. They come from both male and female investigators. In short, these
findings with the Hall/Van de Castle system are the most reliable, systematic, and potentially useful
quantitative findings on dream content ever developed. They deserve to be taken seriously as a
starting point for further research investigating the possible relationships of age, class, race,
ethnicity, and nationality to dream content. Studies concerning these variables now can be done with
confidence with one Most Recent Dream from each of 100 subjects, then displayed in an h-profile.
These findings also give us our first reason to believe that there is meaning in dreams because they
show a coherence or regularity in the relatively small but consistent differences in what women and
men dream about. In that regard the findings on dream reports are similar to what is found in many
Strona 23 z 24
Finding Meaning in Dreams: Chapter 4
2009-02-11
file://E:\prace\artykuły\sny\ksiazki\finding_meaning_in_dreams\Finding Meaning in ...

other psychological studies comparing women and men. The reasons for these small differences
are many and varied, but they are not our concern here. What is important for our purposes is the
regularity of the findings in several different samples from various time periods and regions of the
country.
Continue on to Chapter 5
Go back
to the Dream Library index.
dreamresearch.net home page
dreamresearch.net contact info
Strona 24 z 24
Finding Meaning in Dreams: Chapter 4
2009-02-11
file://E:\prace\artykuły\sny\ksiazki\finding_meaning_in_dreams\Finding Meaning in ...
Wyszukiwarka
Podobne podstrony:
Domhoff, G W (1996) Finding meaning in dreams A quantitative approach r 3
SHSBC395 PSYCHOSOMATIC ITS MEANINGN IN SCN
IEEE Finding Patterns in Three Dimensional Graphs Algorithms and Applications to Scientific Data Mi
Looking for Meaning in dancehall
[Rathi & Rastogi] Meaning in life & psychological well being in pre adolescents & adolescents
Wrap your troubles in dreams (Harry Barris)
Lord Of The Rings In Dreams (sheet music)
List of Words Having Different Meanings in British and American English
Wrap Your Troubles In Dreams
LOTR In dreams
Psychological Therapies 1 Meaningful Recovery and Respectful Approaches
Nora Roberts In Dreams
In Dreams by Nora Roberts
Zen Miracles Finding Peace in an Insane World
#0416 – Finding a Niche in Business
więcej podobnych podstron