
Presented at ASA meeting in Austin, Texas (Autumn 2003)
- 1 -
ACOUSTIC ENHANCEMENT SYSTEMS
– Design approach and evaluation of room acoustical parameters based on in situ
measurements –
Bjorn van Munster
1
, Wim Prinssen
Systems for Improved Acoustic Performance B.V., Uden, the Netherlands
Abstract
Acoustic enhancement systems have evolved significantly during the years. Where the early systems only aimed
to increase the reverberation time in a hall, today the increase of the reverberation time is only one of the features
of such a system.
Contrary and additionally to passive acoustics, an acoustic enhancement system enables a designer or consultant
to change the acoustical characteristics of a hall in a more flexible way. Due to the sophisticated convolution
processes and layout of such a system besides the reverberation time also e.g. speech intelligibility and
spaciousness can be improved or special effects can be added to shows.
In this paper the applications of an enhancement system in general will be outlined in more detail. Furthermore
design approaches will be given which can be formulated for installation of such a system. These approaches can
be used to evaluate proposed designs, but also to estimate the required provisions to be included in the planning
of a system installation.
Furthermore, the paper describes a method to calculate the system gain and the results of in situ measurements of
one such system (SIAP) relative to this parameter.
I. Introduction
Acoustic enhancement systems are often referred to as reverberation enhancement systems.
Although reverberation enhancement is one of the main features of such a system, it is not the
only one. As a result of the acoustic enhancement also other acoustical parameters such as
clarity, lateral energy fraction or speech intelligibility are affected.
The most common used acoustic parameters can be divided in four main groups [1], i.e.
loudness (e.g. reverb to volume ratio, Strength ), intelligibility (e.g. Deutlichkeit and Clarity),
reverberation (e.g. reverberation time and early decay time) and envelopment (e.g. lateral
energy). Typically, most of these acoustical parameters are based on a comparison of two
time instances that can be expressed by a general equation:
(1)
=
b
a
d
c
t
t
t
t
dt
t
x
p
dt
t
x
p
t
X
)
,
(
)
,
(
)
(
Where p represents the sound pressure at a certain place x in an environment at moment t. The
parameter X(t) depends on the time instances used for the ratio. It has to be noted that besides
the straightforward energy comparison, also the type of microphone can be changed (refer to
LF measurements) or the acoustical environment (refer to Strength measurements) can be
changed.
1
E-mail to: b.v.munster@pbri.nl
Presented at ASA meeting in Austin, Texas (Autumn 2003)
- 2 -
As can be observed in equation (1) the time instances differ, however regularly t
a
is set to
zero. For instance the clarity (C
80
) compares the energy content between 0 and 80 ms relative
to the energy after 80 ms. Also the Deutlichtkeit (D
50
), Strength (G) or loudness are based on
energy comparisons between different time instances. As acoustic enhancement systems add
energy to the hall not only the reverberation is affected but also other acoustical parameters
are affected. In the next paragraphs it will be outlined how the acoustical engineer is able to
control the acoustic parameters by the application of one such a system, i.e. System for
Improved Acoustic Performance (SIAP).
II. The general philosophy of the acoustic enhancement system
Every acoustic environment has its own characteristics. A theatre sounds differs from the
sound of a living room or a concert hall. However the temporal aspects can essentially be
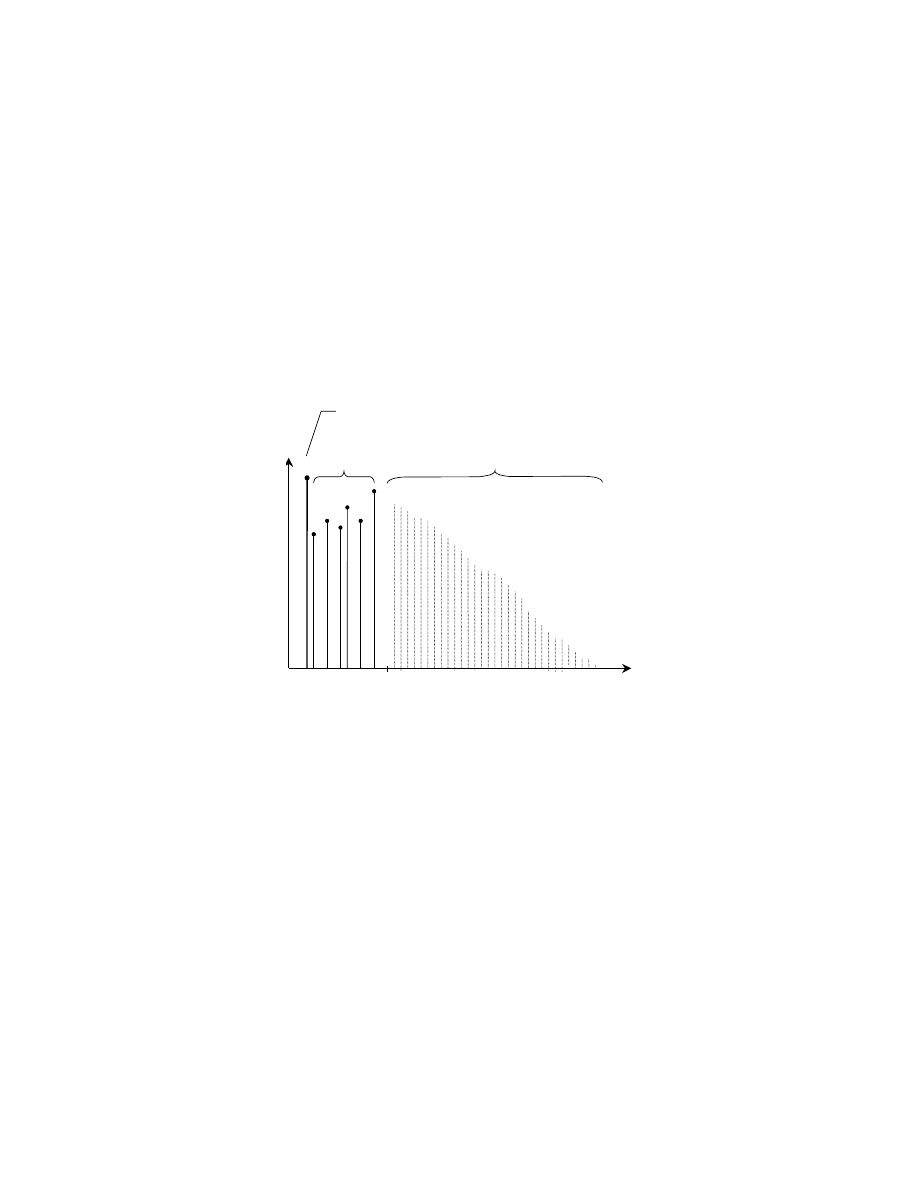
generalised for every environment. In Figure 1 a general echogram is presented whereby
every acoustic environment can be outlined.
Time [s]
So
un
d
pr
es
su
re
le
ve
l [
dB
]
Direct sound
Early reflections
Diffuse reflections
t
x
Figure 1 : General echogram of an acoustic environment
As can be observed from Figure 1 there are two important stages which are separated at t
x
, i.e.
the early sound and the late reverberant sound. The early sound consists of the direct sound
and the early reflections. This part mainly affects the intelligibility as well as early to late
ratio’s such as clarity or Deutlichkeit. The late reverberant part consists of the diffuse
reflections and mainly affects measures such as reverberation time, apparent source width
(ASW) and envelopment.
Figure 1 shows that there are three important measures concerning the temporal aspects of the
acoustic environment. Primarily it is the time at which the early part ends and the reverberant
part starts (t
x
). Furthermore the density of reflections and the level of the reflections are
important. When each of these measures can be controlled separately also most of the acoustic
parameters can be controlled separately by the designer as they are based on a energy
comparison between two time instances as been outlined in the introduction.
The concept of energy comparison will be illustrated by means of the Deutlichkeit. This
generally accepted parameter is defined as [3]:
Presented at ASA meeting in Austin, Texas (Autumn 2003)
- 3 -
(2)
∞
=
ms
ms
ms
dt
t
x
p
dt
t
x
p
D
0
50
0
50
)
,
(
)
,
(
As the equation shows, the early energy, i.e. the energy between 0 tot 50 ms, is compared to
the total amount of energy measured at a certain position x in a hall at time t.
By adding twice as much energy in the early 50 ms, the Deutlichkeit will be doubled. This can
be achieved by adding more early reflections with a same level, by adding a few specular
reflections or by extending the early part of the echogram by adding high level reflections
whereby the beginning of the decay curve will be perceived later. Reversibly also the
intelligibility can be reduced, e.g. if a more diffuse soundfield is desired, by adding more
reverberant sound to the echogram. This can be achieved by increasing the density of the
existing reverberation curve, by extending the reverberation curve or by increasing the level
of the reverberation without significantly increasing the density of the reverberant part.
As the example shows modern acoustic enhancement systems enable the designer to fully
control well known acoustical parameters, whereby they are enabled to have a great flexibility
in order to adjust an existing acoustical situation.
III. System gain
Application of an electroacoustic enhancement system increases the quality of the sound
transmission in a room between the source and the receiver. The amount of energy increase in
the sound transmission due to the addition of an electroacoustic system is known as the
system gain.
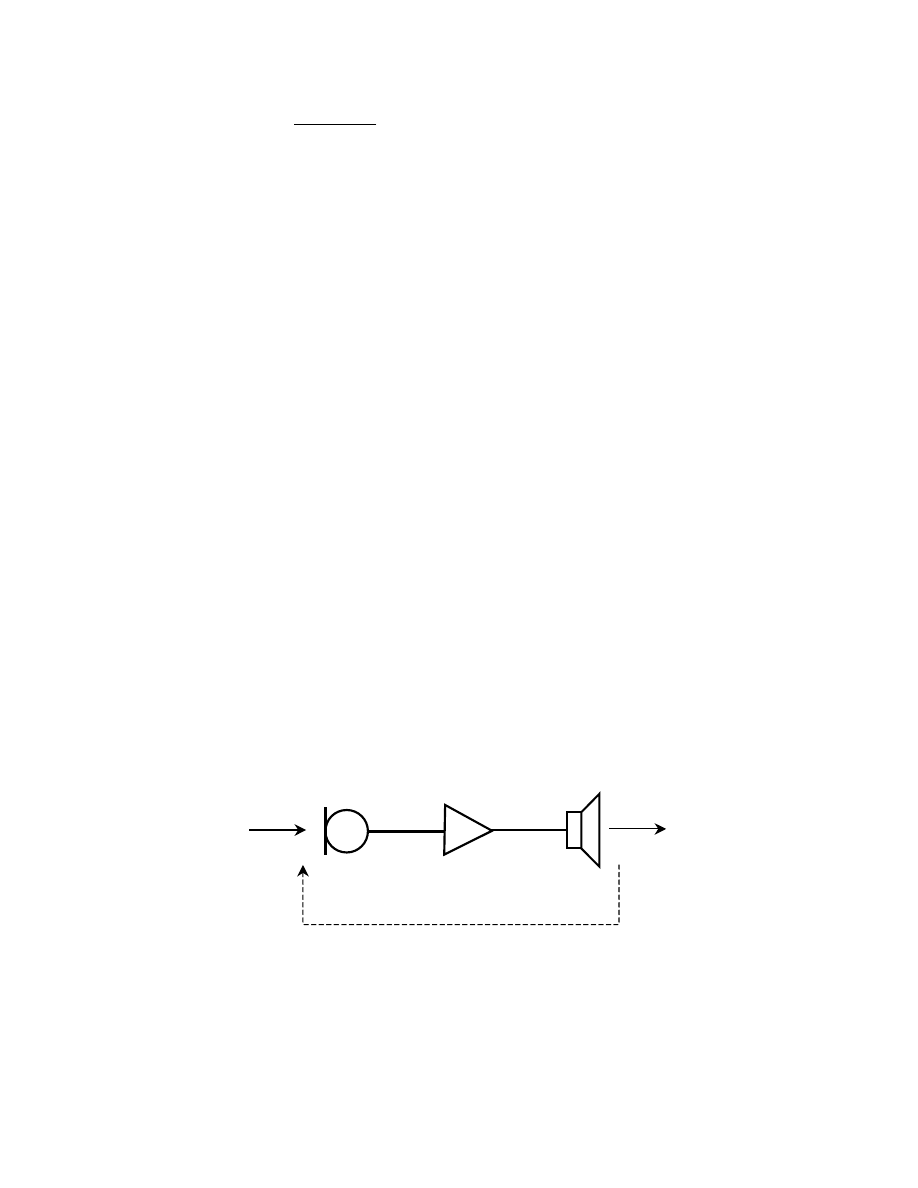
A general system layout of an enhancement system consists of three important elements: a
microphone, an amplifier and a loudspeaker. The figure below shows a simplified scheme of a
system.
p
in
p
out
µ
β
W
Figure 2: Block scheme of a single path enhancement system
A microphone with directivity Q
m
is connected to an amplifier with amplification factor
µ
.
This amplifier is connected to a loudspeaker with efficiency
η
and a directivity factor Q
l
.
The sound power W [W] is the result of the amplification of the (effective) sound pressure p
in
[Pa] at the membrane of the microphone by a factor
µ
:
Presented at ASA meeting in Austin, Texas (Autumn 2003)
- 4 -
(3)
2
2
in
p
W
µ
=
The transferfunction between the loudspeaker and the receiver in a room is given by
β
.
Assuming a loudspeaker that produces a soundpower W, then the effective soundpressure p at
a certain point in the room is given by:
(4)
W
p
2
2
β
=
It can be defined that acoustic feedback occurs when the diffuse soundfield and the direct
soundfield, thus the soundfield produced by the loudspeaker, are equal. So according to (3)
and (4) the electroacoustic feedback of the given system is equal to
µ
2
β
2
. This factor has a
maximum reduction when the microphone is located outside the critical distance r
0
of the
room and when the preference directions of the loudspeaker and microphone are opposite.
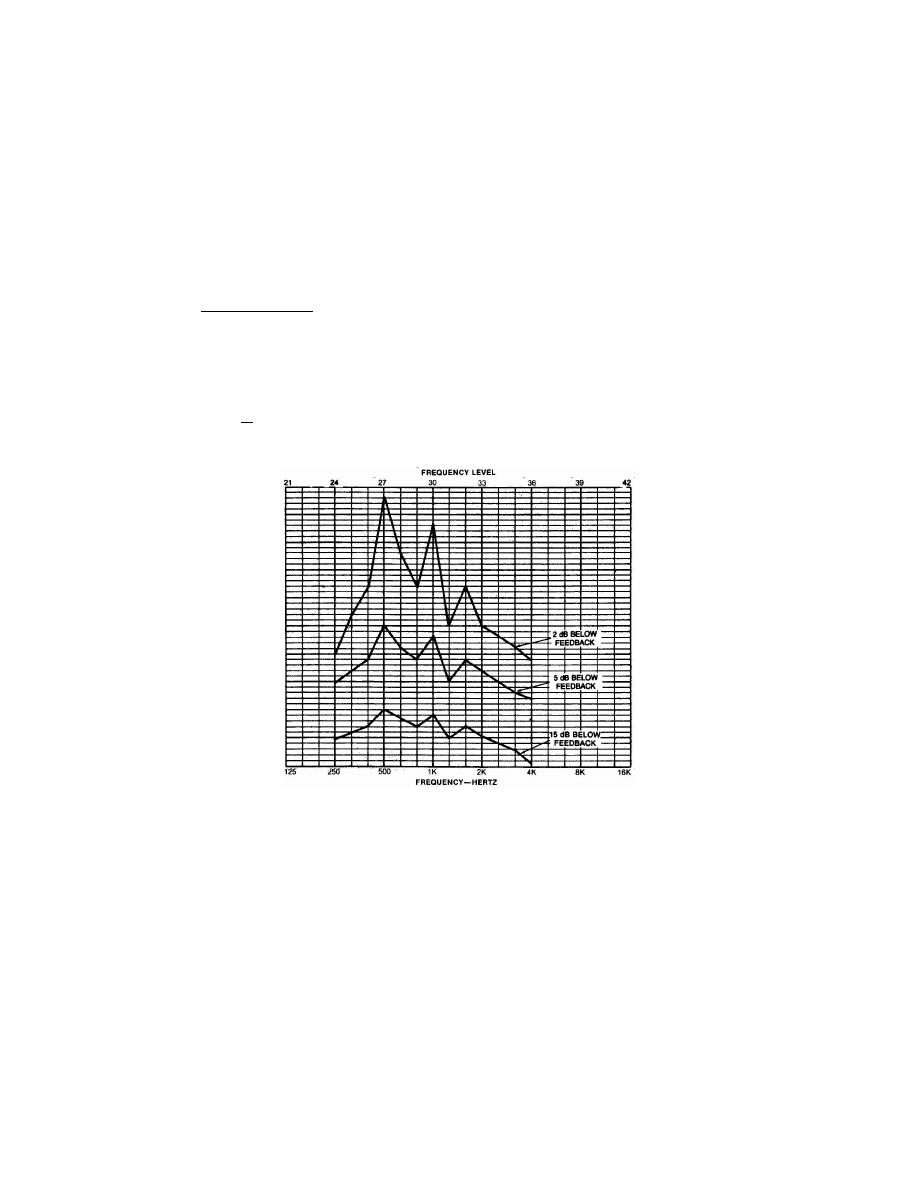
This implies that the transmission in the diffuse field is dominant. This field is characterised
by the fact that there is a large amount of preference frequencies above 100 Hz [4]. The
highest peaks of the transferfunction
β
(f) are generally 8 dB above the average
transferfunction
β
.
Figure 3: Transferfunction at oscillation frequency. [From: Davis, 1996]
In order to prevent a system becoming unstable, it is necessary that the system gain of the
average transferfunction is 8 dB below the level at the frequency at which the system starts
oscillating. In order to increase the system gain before oscillation, time variance can be used
in the signal processing. As has been outlined by Griesinger [5] this results in 6 dB extra gain
before feedback due to the fact of decorrelation of the signal paths and decorrelation of the
successive feedback transferfunctions, i.e. auto-decorrelation. Besides the problem of
feedback, acoustic enhancement systems also have to be free of coloration. Kuttruff [6] stated
that for musical settings the gain should be 13 dB below the average loop gain at oscillation
(that is 21 dB below the level at the oscillation frequency) and for speech settings 5 dB below
the average loopgain at oscillation (13 dB below the level at oscillation frequency). Therefore
the system gain of each feedback transferfunction of a normal time constant system has to be
–21 dB relative to the level at oscillation frequency for musical settings and –13 dB relative to
the level at oscillation frequency level for speech settings to be free of coloration. By
Presented at ASA meeting in Austin, Texas (Autumn 2003)
- 5 -
increasing the decorrelation as outlined by Griesinger this implies that the system gain can be
–15 dB for musical settings and –7 dB for speech settings. It can be concluded that whether a
system is time variant or time constant, a certain number of uncorrelated signal paths is
necessary to obtain an effective system gain.
III.1 Relation between system gain and reverberation time
Although the reverberation time is not the only important measure, it is still a very important
on. In the subsequent paragraphs only the reverberation time and the reverberant loudness
relative to the system gain will be outlined.
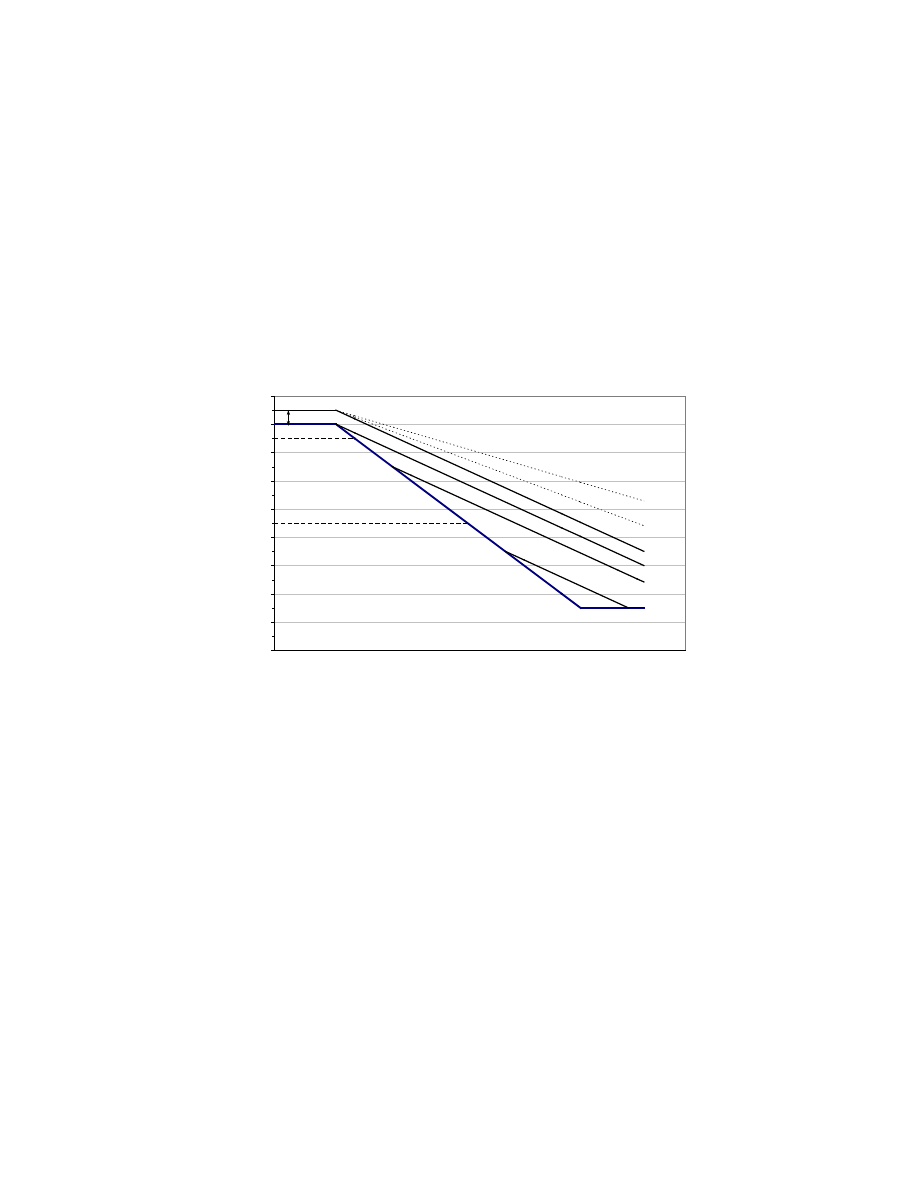
In the figure below a general graph is presented with an idealised reverberation curve (bold
line) and different situations which can be achieved by the addition of an enhancement
system.
0
10
20
30
40
50
60
70
80
90
0
200
4 00
60 0
800
100 0
1200
1400
1600
180 0
2000
Time [s]
S
o
u
n
d
p
r
e
s
s
u
r
e
l
e
v
e
l
[
d
B
] -5
-35
Figure 4: General overview of the enhancement situations
In the figure, the bold curve presents the natural reverberation curve of a certain environment.
Generally the reverberation is determined by the calculation of the time in which the sound
level decreased from –5 dB to –35 dB below stationary source level. This area is indicated
between the dotted lines.
As can be observed from the figure, five different stages can be distinguished. In the figure,
curve indicates an increase of the reverberation time. However, the level of the processed
reverberation is too low to be measured in the calculation of the reverberation time and too
low to be of use for acoustic enhancement. When the system gain increases, the level of the
reverberation will increase. As a result the reverberation time will slowly increase to the
desired, i.e. processed, reverberation time. This stage is indicated by curve .
Because of the calculation method used for the determination of the reverberation time, i.e.
analyses of the interval between –5 dB and –35 dB, the reverberation time will increase until
the processed and the resultant reverberation time are equal to each other. Curve illustrates
this situation. This is the level at which the natural level and the reverberation level are
initially equal.

Presented at ASA meeting in Austin, Texas (Autumn 2003)
- 6 -
It has to be emphasised that in actual practice a slight increase of the reverberation time in the
lower frequencies will be audible, as been outlined among others by Rettinger [7].
As a result of the increase of the reverberation time, the enhancement critical distance of the
room as indicated by Griesinger in [5] will decrease when the volume of the hall remains the
same. However the application of high directivity microphones, e.g. supercadioid
microphones (Q=4), the enhancement critical distance can increase relative to the original
situation, that is without enhancement system.
The loudspeakers are all located at certain distances of the microphones. As outlined earlier,
the level of the reverberation per feedback loop has to be –21 dB relative to the loop gain at
oscillation frequency in order to prevent feedback and coloration problems of the system for
musical settings. When the level of the enhancement system increases, and at a certain level
exceeds the given –21dB-criterion, coloration of the system is starting to occur. This implies
that the system can increase in level, i.e. the system gain can be increased, whereby the
reverberation time remains the same. This situation is illustrated in the figure by curve .
Subsequently the feedback will become more important by increasing the system gain. As a
result of the feedback in the system the reverberation time will increase. This is indicated by
curve in the figure.
Finally the system gain will be increased to a certain level whereby the system becomes
unstable. At that point the peaks of the halls transferfunction exceed the 8 dB margin of the
average loop gain and the reverberation time becomes infinitely long for certain frequencies.
The system gain can be defined as the contribution of the enhancement system to the natural
reverberation level of the hall which is given by:
(5)
=
A
L
hall
reverb
4
log
10
,
Where A is the absorbing area expressed in Sabines.
In order to determine the system gain, an early-to-late ratio has to be used to calculate the
level of the reverberation. The level of the reverberation can be determined by
(6)
∞
=
∆
e
e
e
t
t
t
dt
t
x
p
dt
t
x
p
L
)
,
(
)
,
(
0
Whereby t
e
represents the time instant at which the contribution of the direct sound ends at a
certain position x in the room under test. The calculated factor
e
t
L
∆ presents the contribution
level. For convenience the amount of energy addition in the early part can be rejected.
Therefore the clarity factor (C
80
) can be used to calculate the factor
e
t
L
∆ .
It has to be noted that the time instant t
e
differs for every position, i.e. it is unique for every
source receiver combination, but can be determined relatively easy because it can be
calculated from the distance between the source and receiver.
As the time instant t
e
remains the same when the reverberation level is increased, the system
gain can now be computed easily. Therefore the reverberation level of the hall including the
Presented at ASA meeting in Austin, Texas (Autumn 2003)
- 7 -
enhancement system (p
on
) relative to the natural reverberation level (p
off
) at a certain position
x in the hall has to be observed. This is the System Gain (
e
t
SG ), given by:
(7)
=
∞
∞
e
e
e
t
off
t
on
t
dt
t
x
p
dt
t
x
p
SG
)
,
(
)
,
(
log
10
In case the C
80
is used to calculate the factor
e
t
L
∆ , equation (7) implies that the factor
e
t
SG can be obtained by comparison of the C
80
. It has to be noted that the C
80
can only be used
if the amount of added early energy could be ignored. The use of C
10
for example could be
more accurate, but not all measurements have such a feature.
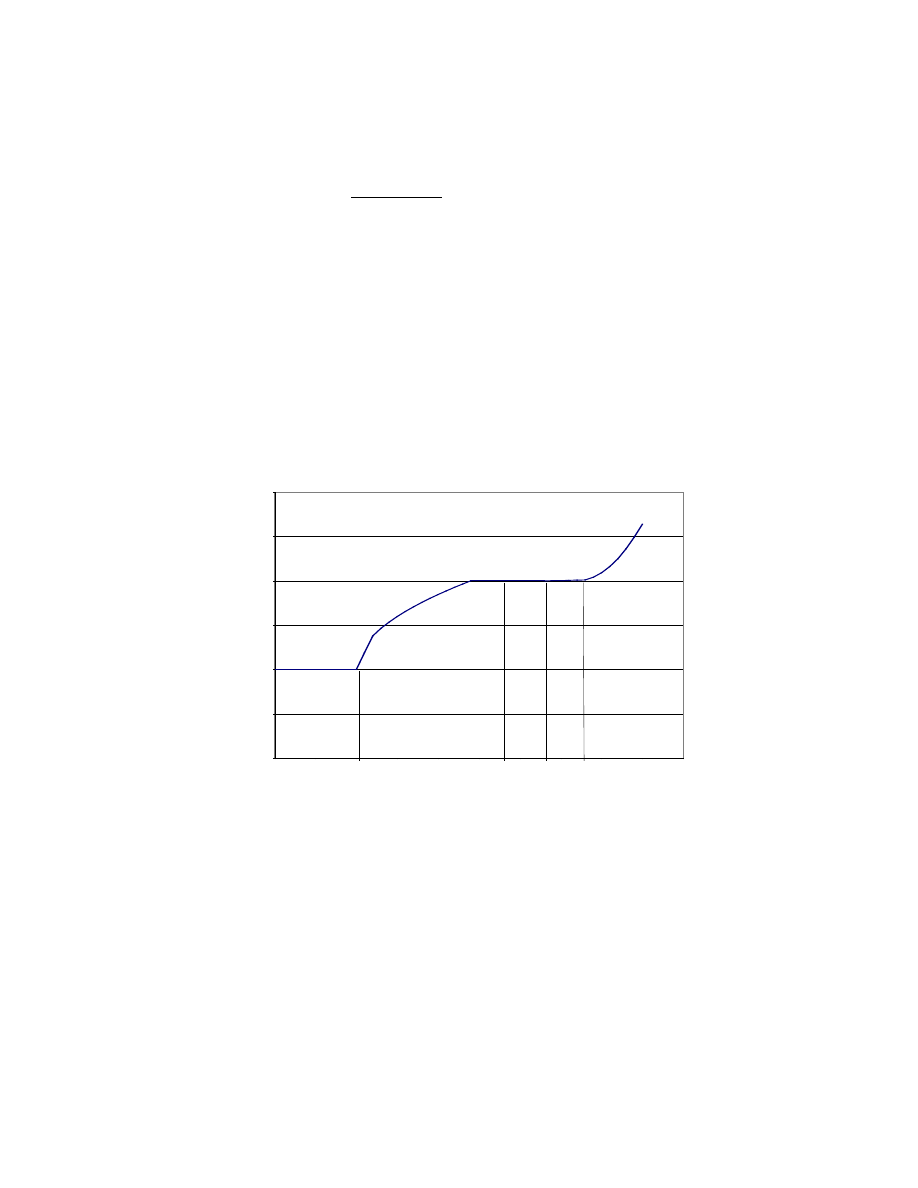
Application of this theory and the preceding graph results in a typical graph as presented in
Figure 5. Here the system gain
e
t
SG is plotted against the reverberation time. Again the five
stages as presented in Figure 4 are indicated in this plot.
0
0 , 5
1
1 , 5
2
2 , 5
3
0
5
1 0
1 5
2 0
2 5
3 0
3 5
4 0
4 5
5 0
S y s t e e m G a i n ( S G
t e
) [ d B ]
R
e
v
e
r
b
e
r
a
t
i
n
t
i
m
e
[
s
]
Figure 5: General overview System Gain (
e
t
SG
) versus the reverberation time (RT)
In the first stage ( ) the level of the reverberation is too low to be able to calculate the effect
of the added energy. Therefore the reverberation time remains constant although the factor
e
t
SG as defined in equation (7) will increase. So in this stage of the curve the resultant
reverberation time of the hall remains constant with the system gain
e
t
SG .
At a certain time instant the level of the reverberation increases whereby it will be measured
in the reverberation measurements as it is within the interval of –5 dB to –35 dB relative to
stationary source level. This is stage . When the natural reverberation level of the hall and
the processed reverberation level are equal, i.e. that is stage , there will be a plateau. This
plateau indicates that the processed reverberation time is constant relative to the increase in
system gain. In Figure 4 this refers to the stage between curve and .

Presented at ASA meeting in Austin, Texas (Autumn 2003)
- 8 -
Subsequently the system gain can be further increased until the level of the system is –21 dB
relative to the loop gain at oscillation frequency, i.e. that is stage in Figure 4.
As soon as the system gain exceeds the –21 dB criterion, the feedback starts. This refers to
stage in the earlier presented graph. Here the reverberation time will exponentially increase
by an increase of the system gain. At the moment where the system starts howling around, the
reverberation time is infinitely long.
IV. Practical relevance
It is known that the absolute reverberant sound pressure level is an important factor for the
appreciation of a concert hall. This is for example expressed in the Strength Factor (G) [8].
In a good concert hall with a reverberation time of 2 seconds, such as the Amsterdam
Concertgebouw (18,750 m
3
) the reverberant SPL is –26dB relative to the source sound power
level L
W
. This means that in a hall of the same volume but with a reverberation time of say 1
second, a 3 dB system gain is required to achieve a comparable natural loudness when the
enhanced RT is 2 seconds. As Figure 3 and 4 show, this can be achieved without acoustic
feedback associated problems.
However, it is also known that in smaller halls such a system gain can easily become
uncomfortably loud with a full symphony orchestra. There the system gain has to be carefully
and subtly limited to 1 or 2 dB whilst maintaining a decay that approaches a single slope line
as much as possible. On the other side of the scale it shows that a too high system gain results
in an unwanted significant RT increase due to acoustic feedback. Less is usually more than
sufficient, as it would sound not plausible in a very large volume to have a loudness of a space
which is, say, 5 or 10 times smaller. This also shows the importance for a system to enhance
the early reflections (frontal, medial, and lateral) as well as the reverberation. This makes an
acoustic enhancement system much more than just a reverberation enhancement system.
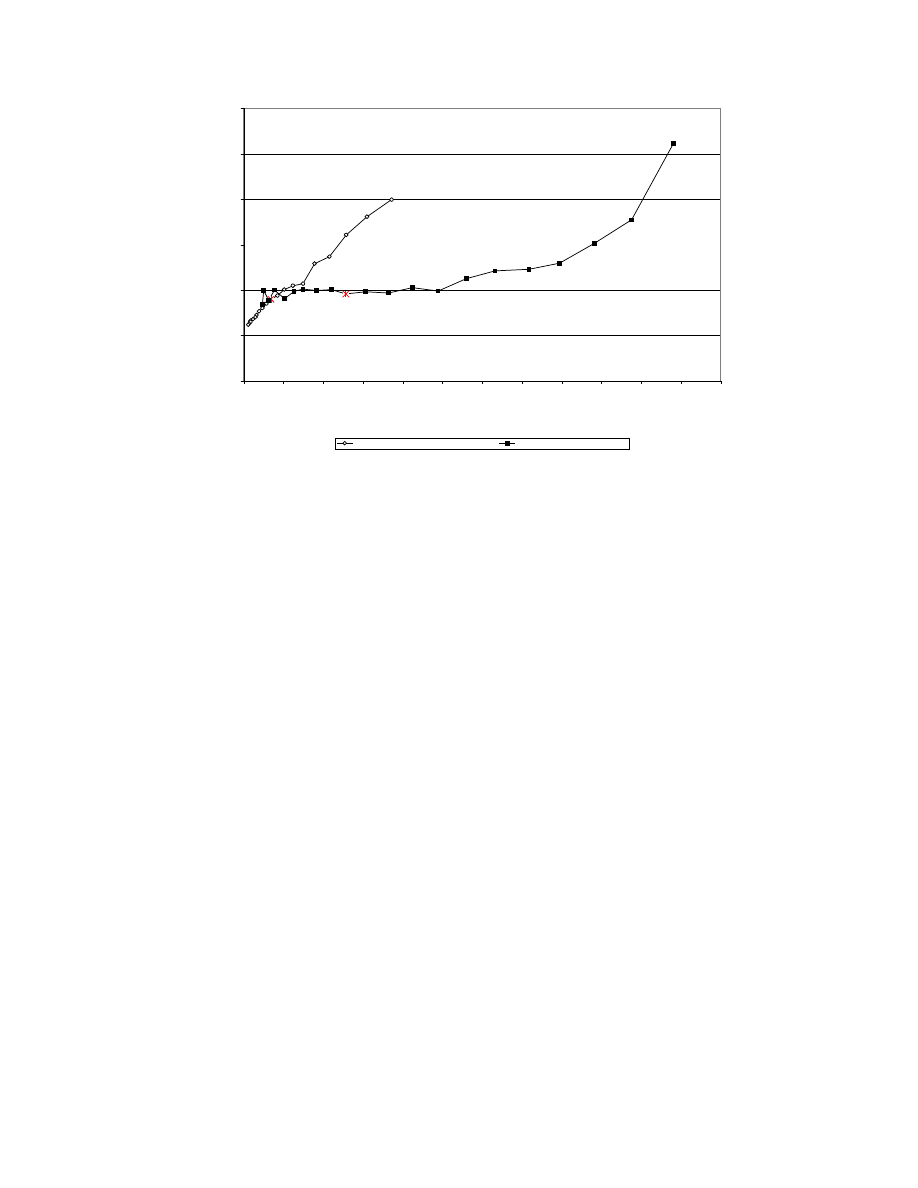
Figure 6 shows the results of increasing the gain in a large multi purpose hall with a volume
of 20,000 m
3
(RT = 1.2 sec) and a medium sized multi purpose hall with a volume of 6,000
m
3
(RT=1.0 sec). The reverberation level of the halls are –28 dB respectively –24 dB.
Furthermore it has to be noted that the large multi purpose hall has twice as much signal paths
than the medium sized multi purpose hall.
Presented at ASA meeting in Austin, Texas (Autumn 2003)
- 9 -
0,0
1,0
2,0
3,0
4,0
5,0
6,0
0
1
2
3
4
5
6
7
8
9
10
11
12
System gain [dB]
R
e
v
e
r
b
e
r
a
t
i
o
n
t
i
m
e
[
s
]
Medium sized multi purpose hall
Large multi purpose hall
Figure 6 : System gain versus reverberation time based on in situ measurements in a
large multi purpose hall and a medium sized multi purpose hall
Both measurements were performed in the 2.0 sec setting, that is regularly symphony setting
of the SIAP system. As the figure shows, the medium sized hall, which has a relatively high
reverberation level, has a curve in which the plateau is reduced to about 0.5 dB. However the
general outline of the curve presented in Figure 5 can still be observed.
Because of the fact that the natural reverberation level is relatively high in this hall, an
enhancement system will sound unnaturally relatively quick when the system gain is
increased. Compared to the large multi purpose hall, which has a low natural reverberation
level, the freedom with which the correct system gain will assess is much less.
It is known through experience that the reverberant sound level of a full (100 piece)
symphony orchestra in a 12,000 m
3
hall with a reverberation time of 2.0 seconds is the
maximum tolerable loudness for the majority of the audience.
The reverberation level is then L
W
-24 dB. In a 6,000 m
3
hall with a natural reverberation time
of 1.0 sec. this loudness is already present without the contribution of an acoustic
enhancement system. As can be observed from the graphs in the large multi purpose hall the
finally chosen system gain, marked with
×, is say 3 dB. This implies that the reverberation
level in the hall in the 2.0-sec setting will be –25 dB. For the medium sized multi purpose
hall, which has a reverberation level of 24 dB, the final reverberation level in the 2.0-sec
setting including the enhancement system is –23 dB.
This example shows the subtlety with which the system loudness has to be adjusted, which
can in fact only be fine tuned subjectively. If this hall has a fly tower with significant
absorption, a solution may be to have an orchestra shell with a ceiling that has large openings
to let sound energy escape to the fly tower.
As been outlined, the system in the large multi purpose hall has twice as much decorrelation
than the system installed in the medium sized hall. It has been found that an increase of the
amount of decorrelation in the medium sized system broadens the curve as presented. This

Presented at ASA meeting in Austin, Texas (Autumn 2003)
- 10 -
implies that the increase of decorrelation results in more freedom in choosing the correct
system gain.
Conclusions
Today enhancement systems are not only suited for reverberation enhancement but due to
sophisticated algorithms the designer is enabled to fully control a large set of common used
acoustical parameters. The approach presented in this paper reveals the flexibility of the
designer by the application of one such a system, i.e. System for Improved Acoustic
Performance (SIAP).
Inherent to an electroacoustical installation is the increase of the reverberation level in the
acoustic environment. It has been outlined that whether a system is time variant or time
constant, a certain number of uncorrelated signal paths is necessary to obtain an effective
system gain without coloration or feedback.
In order to determine the system gain a formula is proposed whereby the system gain,
expressed by
e
t
SG , can be calculated. The relevance and application of this parameter with
respect to the reverberation time has been outlined and verified by means of in situ
measurements in a medium sized and large multi purpose hall for a 2.0 sec. setting, which is
regularly suited for symphony orchestras.
References
[1]
Vries de, D., Berkhout, A.J., Physical parameters in room acoustics, NAG journal (Dutch
Acoustical Society), vol. 72, August 1984
[2]
Beranek, L.L., Music, Acoustics and Architecture, John Wiley & sons inc., New York /
London, 1963
[3]
Thiele, R., Richtungsverteilung und Zeitfolge der Schallrückwürfe in Räumen, Acustica 3,
pp. 291 – 302, (1953)
[4]
Kuttruff H., Schroeder M.R., On Frequency Response Curves in Rooms, J. Acoust. Soc.
Am., vol. 34 (1), pp. 76, (1962)
[5]
Griesinger D., Improving room acoustics through time-variant synthetic reverberation, J.
Acoust. Eng. Soc., preprint 3014 (B-2), 90th convention, Paris, (February, 1991)
[6]
Kuttruff H., Hesselmann N., Zur Klangfärbung durch akustische Rückkopplung bei
Lautsprecheranlagen, Acustica Vol. 36 (3), pp. 105 – 112, (1976/77)
[7]
Rettinger M., Acoustic considerations in the design of recording studio’s, AES preprint
153, 12th meeting, October (1960)
[8]
Beranek, L.L., Concert and Opera Halls – How they Sound –, Acoustical Society of
America, (1996)
Wyszukiwarka
Podobne podstrony:
11Rational Design, Synthesis and Evaluation Afnity Ligands
Rapid and efficient purification and refolding of a (His) tagged recombinant protein produced in E c
White Energy from Electrons and Matter from Protons A Preliminary Model Based on Observer Physics
Performance and evaluation of small
Development and Evaluation of a Team Building Intervention with a U S Collegiate Rugby Team
Specification and evaluation of polymorphic shellcode properties using a new temporal logic
Comparative testing and evaluation of hard surface disinfectants
EASE Guidelines for Authors and Translators of Scientific Articles to be Published in English june20
Specific Relationship Between Prefrontal NeuronalN Acetylaspartate and Activation of the Working Mem
An Assessment of the Efficacy and Safety of CROSS Technique with 100% TCA in the Management of Ice P
Munster Application of an acoustic enhancement system for outdoor venues
Synchronous Generator And Frequency Converter In Wind Turbine Applications System Design And Efficie
Jaekle Urban, Tomasini Emlio Trading Systems A New Approach To System Development And Portfolio Opt
AES Information Document For Room Acoustics And Sound Reinforcement Systems Loudspeaker Modeling An
Darrieus Wind Turbine Design, Construction And Testing
15427 Instrumementation system design lecture 1id 16462 ppt
administrowanie systemem linux, syslog and firewall
więcej podobnych podstron