
231
USING FIRST TO PROBE THE MAGNETIC FIELD WITH LOW-MASS MOLECULAR IONS.
Martin Houde
1
, Thomas G. Phillips
2
, Ruisheng Peng
1
, Pierre Bastien
3
and Hiroshige Yoshida
1
1
Caltech Submillimeter Observatory, 111 Nowelo Street, Hilo, HI 96720
2
California Institute of Technology, Pasadena, CA 91125
3
D´
epartement de Physique, Universit´
e de Montr´
eal, Montr´
eal, Qu´
ebec H3C 3J7, Canada
Abstract
Observations of the effects the magnetic field has on its
environment are usually achieved using techniques which
rely on its interaction with the spin of the particles un-
der study. Because of the relative weakness of this effect,
extraction of the field characteristics proves to be a most
challenging task. We have recently presented a totally dif-
ferent approach to the problem and showed how and why
a manifestation of the presence of the magnetic field can
be directly detected in the spectra of ionic molecular lines.
Our model makes predictions concerning the expected dif-
ferences between the line profiles of coexistent ion and neu-
tral molecular species and between ions of different mass.
We have already published observational evidence in sup-
port of these predictions with spectra of neutral (HCN,
H
13
CN) and ion species of relatively high mass (HCO
+
,
N
2
H
+
, H
13
CO
+
, HCS
+
) obtained in a sizeable sample
of molecular clouds. Because of its frequency coverage,
FIRST will allow us to study low-mass molecular species
(H
2
D
+
, CH
+
, H
3
O
+
) that are otherwise difficult or even
impossible to observe with ground-based telescopes. It will
then be possible to verify the applicability of our model
to such molecular species and test the mass dependencies
that it predicts.
1. Detection of the magnetic field.
It is possible to detect the presence of the magnetic field
in the core of molecular clouds through a comparison of
the line profiles of coexistent neutral and ion molecular
species. To see how this can be done, we will consider a
hypothetical region inhabited with a magnetic field where
a given ion is subjected to a flow of neutral particles. We
further assume that the plasma is weakly ionized, the neu-
tral flow is linear and all collisions between the ion and the
neutrals are perfectly elastic. Under these conditions, we
find the following set of equations for the mean and vari-
ance of the ion velocity components in directions parallel
and perpendicular to that of the mean magnetic field:
v
=
v
n
(1)
v
⊥
=
v
n
⊥
+ ω
r
−1
[
v
n
⊥
× −
→
ω
g
]
1 +
−
→
ω
g
ω
r
2
(2)
σ
2
=
a
|v
n
⊥
|
2
− v
⊥
2
+ b
σ
n
2
m
µ
− 1
(3)
σ
2
⊥
=
g
|v
n
⊥
|
2
− v
⊥
2
+ h
σ
n
2
m
µ
− 1
(4)
σ
2
T
=
|v
n
⊥
|
2
− v
⊥
2
+
σ
n
2
m
µ
− 1
(5)
with
−
→
ω
g
=
e B
mc
(6)
ω
r
µ
m
ν
c
.
(7)
v and v
n
are the ion and neutral velocity with σ
2
and
[σ
n
]
2
their respective dispersion. m, µ,
ω
r
, −
→
ω
g
and ν
c
are the ion mass, the reduced mass, the relaxation rate, the
mean ion gyrofrequency vector and the (mean) collision
rate. Under the assumption that the neutral flow consists
mainly of molecular hydrogen and has a mean molecular
mass A
n
= 2.3, we get a
0.16, b 0.67, g = 1 − a and
h = 1 − b. We refer the reader to Houde et al. (2000a) and
Houde et al. (2000b) for more details.
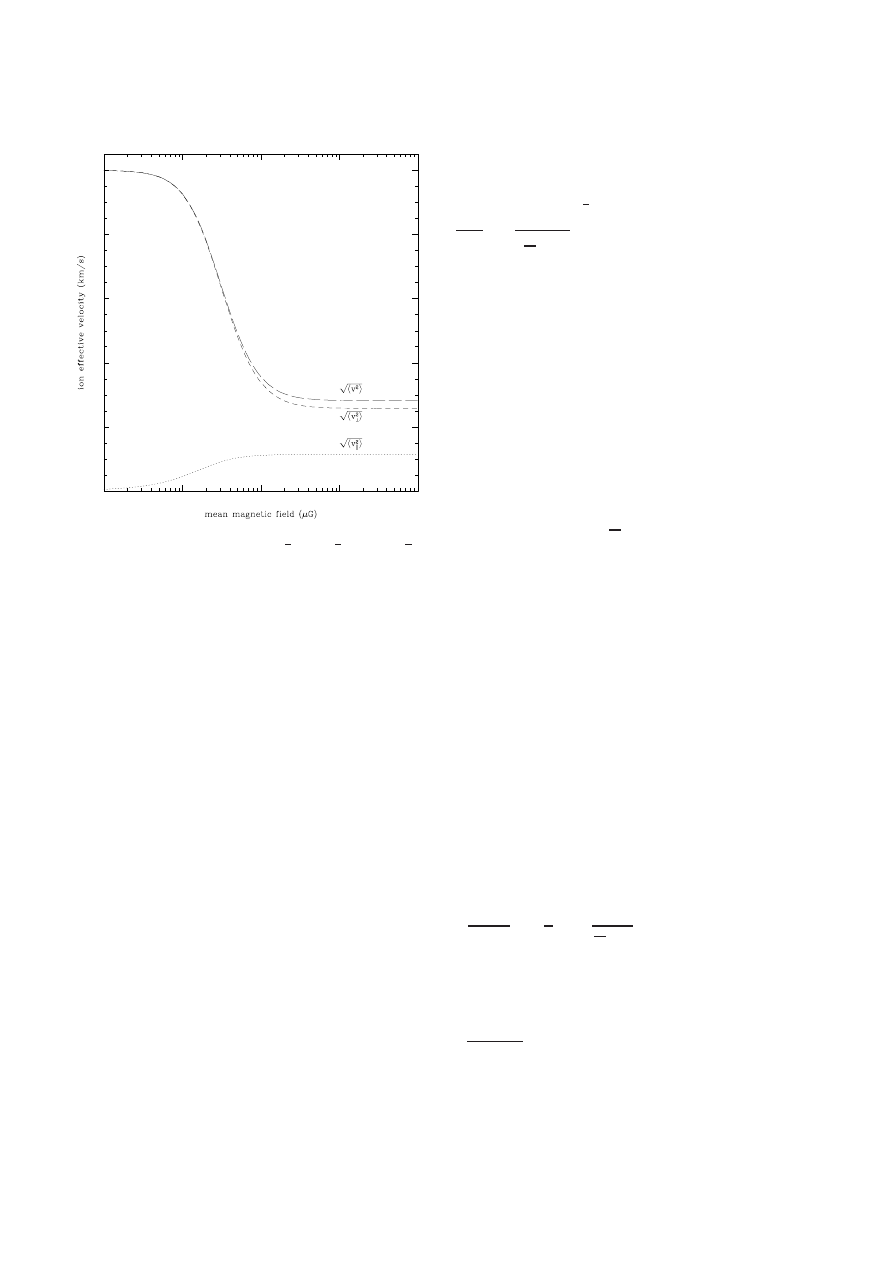
The importance of the presence of the magnetic field
can be best visualized through Figure 1 where the effec-
tive velocity of an ion is plotted against the mean magnetic
field strength for cases where the field direction is perpen-
dicular to the neutral flow. As can be seen, the ion will not
follow the neutral flow and will be captured by a magnetic
field of relatively weakintensity (a few µG at a density n
of 5
× 10
6
cm
−3
) resulting in a lower effective velocity for
the ion. The field intensities needed for this effect to come
through are much lower than what is typically measured
in molecular clouds (Crutcher et al. 1999).
If we further assume that the line profiles that are ob-
served in the core of molecular clouds arise from a large
amount of such flows (possibly of different orientations),
we then arrive to the following three conclusions:
Proc. Symposium ‘The Promise of the Herschel Space Observatory’ 12–15 December 2000, Toledo, Spain
ESA SP-460, July 2001, eds. G.L. Pilbratt, J. Cernicharo, A.M. Heras, T. Prusti, & R. Harris
232
Martin Houde et al.
0.1
1
10
100
1000
0
2
4
6
8
10
Figure 1. Ion effective velocity (
v
2
1
2
,
v
2
⊥
1
2
and
v
2
1
2
) as
a function of the mean magnetic field strength when
v
n
= 0,
|v
n
⊥
| = 10 km/s, n = 5 × 10
6
cm
−3
and
A
i
= 29. From Houde
et al. (2000a).
1. Coexistent ion and neutral species will have similar
line profiles when there is a good alignment between
the mean magnetic field and the neutral flows.
2. We can expect that in the core of molecular clouds,
molecular ions would, in general, exhibit narrower line
profiles than coexistent neutral species when there is
some misalignment between the mean magnetic field
and the neutral flows.
3. The narrowing of molecular ion lines will only happen
when
v
n
= 0.
These three predictions have been verified observationally
and the results were presented in Houde et al. (2000a),
Houde et al. (2000b) and Houde et al. (2001). We are,
however, more concerned here with our second assertion
and, to this effect, we present in table 1 line width ra-
tios obtained for fifteen molecular clouds. As can be seen,
the ion species generally exhibit a narrower profile than
the corresponding neutral species (in this case HCO
+
is
compared to HCN and H
13
CO
+
to H
13
CN).
2. Relative line widths and mass dependency.
Under the assumption of a simple geometry for the ob-
served sources (e.g., a bipolar outflow), it is possible to
make some calculations regarding the expected line width
ratios for individual sources or sample of objects.
First, for a given object, we can calculate what the
minimum line ratio should approximately be. This will
happen when the magnetic field is oriented in a direction
perpendicular to the line of sight. We get in such cases
(Houde et al. 2001):
σ
obs
σ
n
obs
g
m
µ
− 1
1
2
0.25 ,
for a comparison of H
13
CO
+
and H
13
CN, with σ
obs
and
σ
n
obs
the line widths of the ion and neutral species respec-
tively (as expressed by their standard deviation from the
mean velocity). Referring to table 1, we note this number
corresponds quite well to the minimum ratio observed in
our sample (0.22 for OMC-1 and 0.27 for OMC-2 FIR 4).
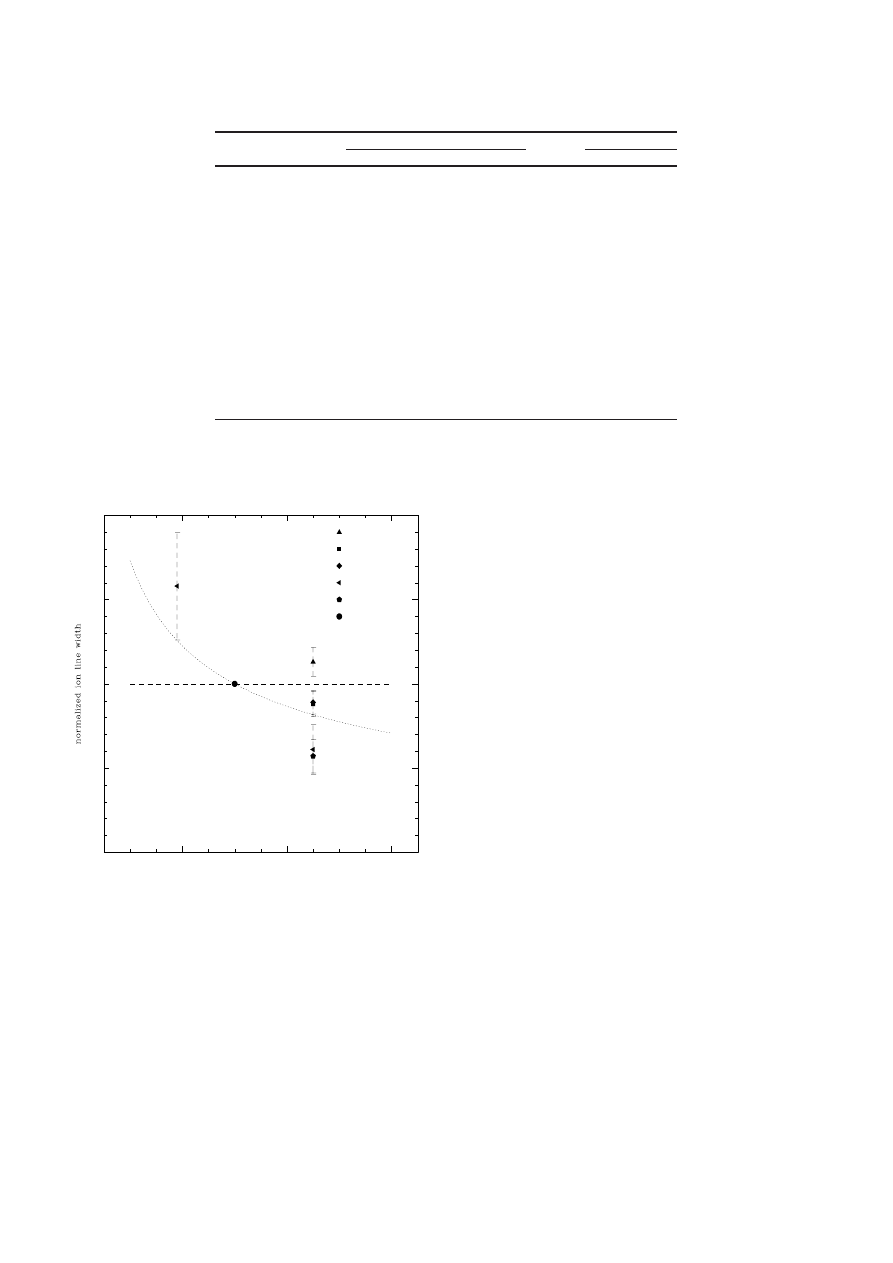
Second, it is possible to detect a mass dependency from
the spectra of different ion species obtained for a single
object. This can be seen from a study of equations (1)-(7)
where we find that, under the assumption of coexistence,
different ion species will have line profiles that exhibit:
– similar widths when the flows are aligned with the
mean magnetic field
– widths following a
m
µ
− 1
−1
mass dependency when
the flows are perpendicular to the direction of the mean
magnetic field.
These two extremes are plotted in Figure 2 along with line
widths measurements (H
3
O
+
and HCS
+
normalized to
that of H
13
CO
+
) obtained for different objects. Coexistent
species should have line widths that lie in between the two
curves plotted in Figure 2. A certain amount of scatter
is to be expected as all species will not be coexistent in
most sources, but a mass dependency seems to emerge
even with the small amount of data available at this time.
FIRST, with its ability to detect lines from low-mass ion
molecular species (e.g., H
2
D
+
, CH
+
and H
3
O
+
), will allow
us to better verify this aspect of our model.
Finally, in some cases, the expected average ratio of
the ion to neutral line widths for a given sample of molec-
ular clouds can also be calculated. For example, if we as-
sume that the neutral flows are randomly oriented (with a
uniform distribution) with respect to the direction of the
mean magnetic field, we find (Houde et al. 2000b):
[σ
obs
]
2
[σ
n
obs
]
2
1
3
1 +
2
m
µ
− 1
,
(8)
which equals 0.38 (0.72, 0.47, 0.37) for an ion of molecular
mass A
i
= 30 (4, 11, 45). For the sample of objects from
the previous table we find that:
σ
2
H
13
CO
+
σ
2
H
13
CN
= 0.41 ,
which is in good agreement with the value calculated ab-
ove. But more importantly, we again see from equation (8)
that a mass dependency is expected when comparing the
line width ratios using different ion species.
Using FIRST to Probe the Magnetic Field with Low-mass Molecular Ions.
233
Coordinates (1950)
v
ratio
Source
RA
DEC
(km/s)
thick
thin
W3 IRS 5
2
.
h
21
.
m
53
.
s
3
61
.
◦
52
.
21
.
4
-38.1
0.43
0.39
GL 490
3
.
h
23
.
m
38
.
s
8
58
.
◦
36
.
39
.
0
-13.4
0.61
. . .
HH 7-11
3
.
h
25
.
m
58
.
s
2
31
.
◦
05
.
46
.
0
8.4
1.02
. . .
NGC 1333 IRAS 4
3
.
h
26
.
m
05
.
s
0
31
.
◦
03
.
13
.
1
8.4
0.32
. . .
L1551 IRS 5
4
.
h
28
.
m
40
.
s
2
18
.
◦
01
.
41
.
0
6.3
0.89
. . .
OMC-1
5
.
h
32
.
m
47
.
s
2
−05.
◦
24
.
25
.
3
9.0
0.19
0.22
OMC-3 MMS 6
5
.
h
32
.
m
55
.
s
6
−05.
◦
03
.
25
.
0
11.3
0.51
0.48
OMC-2 FIR 4
5
.
h
32
.
m
59
.
s
0
−05.
◦
11
.
54
.
0
11.2
0.76
0.27
NGC 2071
5
.
h
44
.
m
30
.
s
2
00
.
◦
20
.
42
.
0
9.5
0.93
0.64
NGC 2264
6
.
h
38
.
m
25
.
s
6
09
.
◦
32
.
19
.
0
8.2
0.85
0.88
M17 SWN
18
.
h
17
.
m
29
.
s
8
−16.
◦
12
.
55
.
0
19.6
0.90
0.81
M17 SWS
18
.
h
17
.
m
31
.
s
8
−16.
◦
15
.
05
.
0
19.7
0.90
0.78
DR 21(OH)
20
.
h
37
.
m
13
.
s
0
42
.
◦
12
.
00
.
0
-2.6
0.80
0.69
DR 21
20
.
h
37
.
m
14
.
s
5
42
.
◦
09
.
00
.
0
-2.7
0.98
0.58
S140
22
.
h
17
.
m
40
.
s
0
63
.
◦
03
.
30
.
0
-7.0
0.80
0.85
Table 1. Ion to neutral width ratios in star forming regions. The ratios labeled as “thick” are obtained from the ratio of HCO
+
to HCN line width and those labeled as “thin” from the ratio of H
13
CO
+
to H
13
CN line width.
20
40
60
0
0.5
1
1.5
2
ion molecular mass
OMC3-MMS6
DR21OH
S140
W3IRS5
DR21MAIN
all objects
Figure 2. Ion line width as a function of the molecular mass.
The line width is normalized to that of H
13
CO
+
(
A
i
= 30) for
the cases where the neutral flows are aligned (straight broken
line) or perpendicular (dotted curve) to the the direction of the
mean magnetic field. The H
3
O
+
detection in W3 IRS 5 is taken
from Phillips et al. (1992).
We again emphasize the fact that because of its fre-
quency coverage, FIRST will allow us to study low-mass
ion molecular species that are otherwise difficult or even
impossible to observe with ground-based telescopes. It will
then become possible to verify the applicability of our
model to such molecular species and test the mass de-
pendencies predicted and presented above.
3. Summary.
We have discussed a new approach to the problem of the
detection of the magnetic field in the core of molecular
clouds and showed how and why the manifestation of its
presence can be observed in the line profiles of molecular
ion species. The main conclusions reached were:
1. Coexistent ion and neutral species will have similar
line profiles when there is a good alignment between
the mean magnetic field and the neutral flows.
2. We can expect that in the core of molecular clouds,
molecular ions would, in general, exhibit narrower line
profiles than coexistent neutral species when there is
some misalignment between the mean magnetic field
and the neutral flows.
Moreover, because of the fact that in the presence of a
strong enough magnetic field, the ions will resist in taking
part in the flow motion (reduction of their mean velocity)
and be forced into gyromotions about the magnetic field
direction, there will be an increase in their velocity disper-
sion and their line width will, therefore, be a function of
the mass of the ion. It will then be possible to use FIRST
to observe lower mass molecular ions such as H
2
D
+
, CH
+
and H
3
O
+
to test and verify this mass dependency. A few
lines of choice are presented in table 2, the H
2
D
+
line at
1370.15 GHz is currently in a frequency range not covered
by FIRST. Hopefully, this will no longer be the case upon
the commissioning of FIRST.
References
Crutcher, R. M., T roland, T . H., Lazareff, B., Paubert, G., and
Kaz`
es, I. 1999, ApJ, 514, L121

234
Species
Freq. (GHz)
n
c
(cm
−3
)
H
2
D
+
1370.15
10
6
CH
+
835.07
10
6
CH
+
1669.16
10
7
H
3
O
+
984.70
10
7
H
3
O
+
1665.81
10
7
Table 2. A few low-mass ion molecular lines which could be
detected with FIRST.
n
c
stands for the critical density of the
transition.
Houde, M., Bastien, P., Peng, R., Phillips, T. G., and Yoshida,
H. 2000a, ApJ, 536, 857
Houde, M., Peng, R., Phillips, T. G., Bastien, P., and Yoshida,
H. 2000b, ApJ, 537, 245
Houde, M., Phillips, T. G., Bastien, P., Peng, R., and Yoshida,
H. 2001, ApJ, 547
Phillips, T. G., van Dishoeck, E. F., and Keene, J. B. 1992,
ApJ, 399, 533
Wyszukiwarka
Podobne podstrony:
7 2 1 8 Lab Using Wireshark to Observe the TCP 3 Way Handshake
O'Reilly How To Build A FreeBSD STABLE Firewall With IPFILTER From The O'Reilly Anthology
Fearless Interviewing How to Win the Job by Communicating with Confidence
Effect of magnetic field on the performance of new refrigerant mixtures
Introduction to the Magnetic Treatment of Fuel
O'Reilly How To Build A FreeBSD STABLE Firewall With IPFILTER From The O'Reilly Anthology
Nathan Glazer From a Cause to a Style, Modernist Architecture s Encounter with the American City (2
With Arms to Hold the Wind Mark W Tiedemann
Whittaker E T On an Expression of the Electromagnetic Field due to Electrons by means of two Scalar
w geta26 Shine Using Brain Science to Get the Best from Your People
Fearless Interviewing How to Win the Job by Communicating with Confidence
Using an open source framework to catch the bad guy
The relationship of Lumbar Flexion to disability in patients with low back pain
Haisch Zero Point Field and the NASA Challenge to Create the Space Drive (1997)
How to read the equine ECG id 2
więcej podobnych podstron