
Ž
.
Pacific-Basin Finance Journal 7 1999 539–556
www.elsevier.comrlocatereconbase
The intraday patterns of the spread and depth in
a market without market makers: The Stock
Exchange of Hong Kong
Hee-Joon Ahn
)
, Yan-Leung Cheung
Department of Economics and Finance, Faculty of Business, City UniÕersity of Hong Kong,
Hong Kong, People’s Republic of China
Abstract
We examine the temporal behavior of the spread and depth for common stocks listed on
Ž
.
the Stock Exchange of Hong Kong SEHK , which operates as a purely order-driven
mechanism. We find U-shaped intraday and intraweek patterns in the spread and reverse
U-shaped patterns in the depth. Our finding is consistent with that of the study of Lee et al.
Ž
. w
1993 Lee, C.M.C., Mucklow, B., and Ready, M.J., 1993, Spreads, depths, and the impact
x
of earnings information: an intraday analysis, Review of Financial Studies 6, 345–374 of
Ž
.
New York Stock Exchange NYSE stocks that wide spreads are associated with small
depths and narrow spreads are associated with large depths. The negative association
between spread and depth on the SEHK implies that limit order traders actively manage
both price and quantity dimensions of liquidity by adjusting the spread and depth. Further,
larger spreads and narrower depths around the market open and close indicate a trading
strategy by limit order traders to avoid possible losses from trading with informed traders
when the adverse selection problem is severe. The paper provides further evidence that
U-shaped spread and reverse U-shaped depth patterns should not be solely attributed to
specialist market making activities. q 1999 Elsevier Science B.V. All rights reserved.
JEL classification: G10; G15
Keywords: Limit orders; Spread; Depth; Intraday patterns; The Stock Exchange of Hong Kong
)
Corresponding author. Tel.: q852-2788-7968; fax: q852-2788-8806.
Ž
.
E-mail address: efhjahn@cityu.edu.hk H.-J. Ahn .
0927-538Xr99r$ - see front matter q 1999 Elsevier Science B.V. All rights reserved.
Ž
.
PII: S 0 9 2 7 - 5 3 8 X 9 9 0 0 0 2 3 - 2

(
)
H.-J. Ahn, Y.-L. Cheung r Pacific-Basin Finance Journal 7 1999 539–556
540
1. Introduction
Nearly all North American stock markets depend on market makers for
price-setting and to provide liquidity. For example, multiple dealers in the
Ž
.
National Association of Securities Dealers Automated Quotation system Nasdaq
Ž
.
or specialists in the New York Stock Exchange NYSE and the American Stock
Ž
.
Exchange Amex assume a pivotal role in providing liquidity to the market.
However, a trading system based on market makers is the exception rather than the
rule outside North America. Only a few exchanges in continental Europe and none
in Asia operate under this trading system. In fact, among the top 37 stock
exchanges outside North America, only three use the market-maker system; the
rest rely on the order-driven mechanism without designated market makers.
1
Even in trading systems that still rely on market makers, their dependence has
been steadily diminished by the introduction of various computer-assisted trading
systems that automatically match buy and sell orders.
Although the majority of the world exchanges have adopted the order-driven
mechanism, the extant market microstructure literature has primarily focused on
the market-maker system without paying much attention to the order-driven
system. Only a few studies have so far empirically examined the order-driven
trading mechanism,
2
and relatively little is known about its market microstructure.
In this paper, we examine the liquidity-provision role of limit order traders in
an order-driven market using intraday data from the Stock Exchange of Hong
Ž
.
Kong SEHK . Specifically, we analyze the spread and depth patterns in the
SEHK’s limit-order system, compare them with those of the NYSE specialist
system, and draw implications from the comparison.
The SEHK provides an ideal setting to examine the behavior of limit order
traders for several reasons. First, the SEHK relies solely on limit-order placement.
There are no market makers or floor traders with special obligations or differential
access to trading opportunities. Second, the generated data fully capture the order
flow and execution processes since the market is centralized and computerized.
Third, the market is very transparent. There are no ‘‘hidden orders’’ that are
invisible to traders unlike the limit order book of the Paris Bourse or the
Stockholm Stock Exchange.
3
The order and trade information is instantaneously
disseminated to the public through an electronic screen on a real-time basis.
Ž
Our primary finding is that the spread measured in both quoted and effective
.
spreads in the limit-order book of the SEHK exhibits a U-shaped intraday pattern
while the depth displays a reverse U-shape. The spread is largest at the market
1
Data from The 1994 Handbook of World Stock and Commodity Exchanges.
2
Ž
.
These studies include Niemeyer and Sandas 1993 on the Stockholm Stock Exchange, Lehmann
˚
Ž
.
Ž
.
and Modest 1994 and Hamao and Hasbrouck 1995 on the Tokyo Stock Exchange, Biais et al.
Ž
.
Ž
.
1995 on Paris Bourse, and Hedvall et al. 1997 on the Finnish Stock Exchange.
3
Ž
.
Ž
.
See Lehmann and Modest 1994 and Niemeyer and Sandas 1993 for details.
˚

(
)
H.-J. Ahn, Y.-L. Cheung r Pacific-Basin Finance Journal 7 1999 539–556
541
opening and declines almost monotonically throughout the trading day before it
picks up slightly at the market close. Market depth, measured as the dollar amount
Ž
.
of bid and ask orders submitted at the best i.e. inside bid and offer prices, on the
other hand, shows the opposite pattern. It is lowest at the opening and then rises
monotonically until the close, at which point it suddenly drops. We also identify a
similar U-shaped intraweek pattern in the spread and a reverse U-shaped intraweek
Ž
.
Ž
.
pattern in the depth. The bid–ask spread depth is lowest largest on Tuesdays
Ž
.
and Wednesdays and highest smallest on Fridays.
The generally negative relation between spread and depth on the SEHK
Ž
.
limit-order book is consistent with findings in the NYSE by Lee et al. 1993 —
that wide spreads are associated with small depths, and narrow spreads are
associated with large depths. The negative correlation between spread and depth is
most pronounced on the market opening and close, and remains significant even
after we control for the intraday effects. This negative association implies that
limit order traders actively manage both price and quantity dimensions of liquidity
by adjusting the spread and depth.
The intraday and intraweek spread and depth patterns in the SEHK are broadly
Ž
consistent with information asymmetry models of market microstructure Cope-
land and Galai, 1983; Glosten and Milgrom, 1985; Easley and O’Hara, 1987;
.
Foster and Viswanathan, 1990, among others . These models predict that greater
information asymmetry between informed traders and uninformed liquidity
providers leads to wider spreads and lower depths as uninformed liquidity traders
attempt to minimize losses from trading with informed traders. According to
Ž
.
Glosten 1994 , discretionary uninformed traders who act as liquidity providers are
more likely to choose limit orders than market orders. As long as limit order
traders have an informational disadvantage relative to informed traders, the
adverse selection problem is likely to be more serious around the market open and
close, due to concentrated informed trading around these periods.
4
Thus, limit
order traders are likely to maintain wider spreads and lower depths in order to
avoid losses from trading with the informed. Likewise, around the beginning and
the end of the week, the spread could be wider and the depth smaller for the same
reason.
The trading pattern of limit order traders on the SEHK is similar to the
quote-posting behavior of the specialist on the NYSE, as documented by Foster
Ž
.
Ž
.
Ž
.
and Viswanathan 1993 , Lee et al. 1993 , and McInish and Wood 1992 , among
others. Our results suggest that the intraday U-shaped spread and the reverse
U-shaped depth patterns are not solely attributable to specialists’ market-making
behavior, as many microstructure studies assume. Specialist participation on the
4
Ž
.
Foster and Viswanathan 1993 find that adverse selection costs are higher at the market open and
close on the NYSE.

(
)
H.-J. Ahn, Y.-L. Cheung r Pacific-Basin Finance Journal 7 1999 539–556
542
NYSE is typically less than 20% of the total volume.
5
The remaining volume is
the result of public and member firms’ orders meeting directly. In a recent study,
Ž
.
Chung et al. 1999 suggest that the U-shaped intraday spread pattern on the
NYSE represents the trading behavior of limit order traders rather than that of
specialists. Our paper also provides evidence suggesting that limit-order trading
alone produces the U-shaped intraday pattern of spreads.
The paper is organized as follows: Section 2 describes the SEHK trading
mechanism and the data, Section 3 presents empirical finding, and Section 4
concludes.
2. Description of the market and the dataset
2.1. Structure of the Stock Exchange of Hong Kong
The SEHK is a limited company owned by its member brokers. In terms of
market capitalization, it forms the seventh largest equity market in the world and is
the second largest in Asia after the Tokyo Stock Exchange.
6
The SEHK has a
single main board: There is currently no second section, nor an OTC market.
Trading is carried out on the exchange floor in two sessions each day — from
7
Ž
10:00 to 12:30, and from 14:30 to 15:55 — on weekdays excluding Saturdays
.
and public holidays .
Trading is conducted through terminals in the Exchange’s trading hall, and also
Ž
.
since January 25, 1996 through terminals at the members’ offices. Investors
place orders in the computerized market through brokers. Share trading originates
from an investor order in the form of either a market order or limit order, but the
trading system only accepts limit orders.
Orders are executed through an automated trading system, known as the
Ž
.
Automatic Order Matching and Execution System AMS , which is a computer-
ized limit-order driven trading system. All brokers are directly connected to the
AMS system. The AMS displays the five best bid and ask prices, along with the
Ž
.
broker identity broker code of those who submit orders at the respective bidrask
prices being shown, and the number of shares demanded or offered at each of the
five bid and ask queues. The AMS currently supports both automatic order
matching and the manual execution method. Under this dual operational mode, all
securities are traded through the AMS and are divided into two categories;
automatch stocks and non-automatch stocks. As of March 1997, all stocks traded
5
Ž
For example, specialists participated in 17% of the NYSE volume traded in 1994 The 1994 NYSE
.
Fact Book .
6
Ž
The comparison is based on the statistics at the end of 1996. Source: The 1996 Stock Exchange of
.
Hong Kong Fact Book
7
There is no afternoon trading session on the eves of New Year and Lunar New Year.

(
)
H.-J. Ahn, Y.-L. Cheung r Pacific-Basin Finance Journal 7 1999 539–556
543
Table 1
Frequency distributions of trade types
Trade type
No. of trades in 1000
Share volume in million
Dollar volume in HK$ million
Ž
.
Ž
.
Ž
.
Automatched
6695 97.7%
229,558 88.9%
792,933 85.9%
Ž
.
Ž
.
Ž
.
Manual
47 0.7%
5193 2.0%
22,536 2.4%
Ž
.
Ž
.
Ž
.
Semi-odd
0 0.0%
2 0.0%
6 0.0%
Ž
.
Ž
.
Ž
.
Special
30 0.4%
12,463 4.8%
59,917 6.5%
Ž
.
Ž
.
Ž
.
Special-odd
80 1.2%
10,881 4.2%
44,508 4.8%
Ž
.
Ž
.
Ž
.
Overseas
5 0.0%
206 0.1%
3766 0.4%
Ž
.
Ž
.
Ž
.
Total
6852 100.0%
258,303 100.0%
923,670 100.0%
This table presents the frequency distributions of six trade types in number of trades, share volume,
and dollar volume. The respective percentage frequencies of individual trade types are reported in
parentheses. The sample consists of common stocks listed on the Stock Exchange of Hong Kong during
the six-month period between October 1, 1996 and March 27, 1997.
Ž
on the SEHK were registered for automatching through the AMS although this
.
system also permits them to be traded manually .
Orders in automatch stocks are executed on a strict price and time priority
basis. Orders are matched in the order in which they are entered into the AMS,
based on the best price. An order entered into the system at an earlier time must be
executed in full before an order at the same price, but entered at a later time, can
be executed. An order with a price equal to the best opposite order will match with
opposite orders at the best price queue in the system, one by one according to time
priority. The maximum order size for automatch stocks is 200 board lots.
8
The
queue position in the system is maintained until the order is either completely
filled or canceled, or the end of the trading day, whichever comes first. At the end
of the trading day, all orders are purged from the AMS.
Table 1 reports the frequency distributions of the number, share volume, and
dollar volume of all transactions of all stocks traded on the SEHK between
October 1, 1996 and March 27, 1997. The SEHK classifies each trade as one of
the following: automatch, manual, semi-odd, special, special-odd, or overseas.
Table 1 shows that the percentage of automatched trades is 97.7%. Automatched
share and dollar volumes represent 88.9% and 85.9% of all transactions, respec-
tively.
9
The SEHK maintains a finer tick size schedule than any other major stock
exchange in the world. The SEHK tick size is a step function of the stock price:
Each stock traded is assigned a tick size, which represents the permissible price
increments, at which the stock may be quoted, and deals struck. The SEHK has
8
Ž
.
On the SEHK, the board lot size the generally accepted unit of trading on the exchange is not
uniform across firms. Each firm chooses its own lot size.
9
Since orders exceeding the size limit of 200 board lots are to be traded manually, the percentages
of share and dollar volume of transactions are lower.

(
)
H.-J. Ahn, Y.-L. Cheung r Pacific-Basin Finance Journal 7 1999 539–556
544
Table 2
Tick sizes by stock price
Ž
.
Ž
.
Price range in HK$
Tick size HK$
0.01–0.25
0.001
0.25–0.50
0.005
0.50–2.00
0.010
2.00–5.00
0.025
5.00–30.00
0.050
30.00–50.00
0.100
50.00–100.00
0.250
100.00–200.00
0.500
200.00–1000.00
1.000
1000.00 and over
2.500
This table presents the exchange-mandated minimum price variations across ten different price
ranges in the Stock Exchange of Hong Kong.
probably the most extreme version of a step function, with ten different tick sizes.
Table 2 reports the tick sizes across different price levels. Tick size ranges from
HK$0.001 for securities with share prices between HK$0.01 and HK$0.25, to
HK$2.50 for securities with share prices over HK$1000.
2.2. Data
Our data sources for this study are the Trade Record and the Bid and Ask
Record, both published by the SEHK. The Trade Record data set includes all
transaction prices and volume records with a time stamp recorded to the nearest
second. The Bid and Ask Record contains intraday bid–ask information recorded
at 30-second intervals. The Bid and Ask Record shows limit-order prices, order
quantity, and the number of orders in the same queue up to five queues. All
information in our data set is available to market participants in real time through
the computerized information dissemination system. We use the six-month period
from October 1, 1996 to March 27, 1997. We include only common stocks. We
eliminate from our sample any stock with fewer than 60 listing days during that
six-month period. We also drop firms priced below HK$0.25 or above HK$100.
Our final sample comprises 471 common stocks.
Table 3 reports the cross-sectional averages of price levels, daily number of
trades, share volume, and dollar turnover. Columns 1 and 2 show the price ranges
and the number of stocks traded in each price range.
10
Most stocks trade in the
range of HK$0.50 and HK$5. The average stock price is HK$5.47, which is quite
low compared with average stock price levels in other markets. For example, the
10
The classification of the price range for each stock is based on the average price of the stock over
the six-month sample period.

()
H.-J.
Ahn,
Y.-L.
Cheung
r
Pacific-Basin
Finance
Journal
7
1999
539
–
556
545
Table 3
Summary statistics of price, daily number of trades, share volume, and dollar turnover
Price range
N
Price
Daily number of trades
Daily share volume
Daily turnover
Ž
.
Ž
.
Ž
.
HK$
1000 shares
HK$1000
Ž
.
Ž
.
Ž
.
Ž
.
0.25–0.50
54
0.37 0.01 0.37
102.11 19.46 53.84
9163 2083 3299
3748 879 1595
Ž
.
Ž
.
Ž
.
Ž
.
0.50–2
196
1.10 0.03 1.07
85.62 8.92 43.74
4241 575 1657
4739 569 1817
Ž
.
Ž
.
Ž
.
Ž
.
2–5
118
3.01 0.07 2.78
112.57 14.89 54.91
4010 569 1891
11,941 1745 5461
Ž
.
Ž
.
Ž
.
Ž
.
5–30
82
11.30 0.65 9.98
128.33 17.45 60.56
2309 429 865
23,245 3629 9396
Ž
.
Ž
.
Ž
.
Ž
.
30–50
12
35.39 1.54 34.51
303.49 97.83 95.86
2075 645 692
78,520 25,641 27,312
Ž
.
Ž
.
Ž
.
Ž
.
50–100
9
70.43 4.86 69.45
355.33 85.55 468.81
2361 650 2974
169,885 44,523 205,680
Ž
.
Ž
.
Ž
.
Ž
.
All
471
5.47 0.53 1.79
112.40 7.41 52.28
4320 383 1712
14,686 1742 3041
Ž
.
Ž
.
This table reports the cross-sectional means, standard errors in parentheses , and medians in italics for price, daily number of trades, daily share volume,
and daily turnover for 471 common stocks listed on the Stock Exchange of Hong Kong. Stocks with the average price below HK$0.25 or above HK$100 are
not included in the sample. For a given stock, the statistics are calculated for the six-month period from October 1, 1996 to March 27, 1997.

(
)
H.-J. Ahn, Y.-L. Cheung r Pacific-Basin Finance Journal 7 1999 539–556
546
average price of the NYSE stocks is over US$30. If we apply the fixed Hong
Kong to US currency exchange rate of 7.8, the SEHK mean price of HK$5.47 is
equivalent to approximately US$0.70.
Table 3 also shows that the average and median daily number of trades are 112
and 52, respectively. The daily number of trades generally increases with stock
price, suggesting that high-priced stocks tend to be more liquid. The average daily
volume is 4.3 million shares. The average dollar turnover for all stocks is
HK$14.7 million.
3. Empirical evidence
In this section, we examine the empirical evidence on the temporal variations of
the spread, depth, and trading volume in the SEHK limit order book. We also
compare the SEHK findings with documented facts on the NYSE market mi-
crostructure.
3.1. Spreads
Ž
.
Table 4 presents the cross-sectional means, standard errors in parentheses , and
Ž
.
medians in italics of the quoted and effective spreads both in Hong Kong dollars
and in the percentage of stock price. The quoted spread is defined as the best ask
price minus the best bid price on the book. The average and median dollar quoted
spreads for the entire sample are HK$0.044 and HK$0.026, respectively. The
average dollar quoted spreads across different price levels are about two times
larger than the corresponding tick sizes. The average and median percentage
Table 4
The average quoted and effective spreads
Price range
Quoted spread
Effective spread
Ž
.
HK$
HK$
% Price
HK$% Price
Ž
.
Ž
.
Ž
.
Ž
.
0.25–0.50
0.011 0.001 0.009
2.920 0.162 2.453
0.005 0.000 0.005
1.911 0.092 1.732
Ž
.
Ž
.
Ž
.
Ž
.
0.50–2
0.020 0.001 0.016
1.955 0.066 1.692
0.010 0.000 0.010
1.447 0.039 1.324
Ž
.
Ž
.
Ž
.
Ž
.
2–5
0.042 0.002 0.034
1.437 0.053 1.253
0.025 0.001 0.024
1.138 0.039 1.073
Ž
.
Ž
.
Ž
.
Ž
.
5–30
0.086 0.004 0.068
0.956 0.059 0.856
0.052 0.002 0.050
0.744 0.038 0.730
Ž
.
Ž
.
Ž
.
Ž
.
30–50
0.161 0.017 0.138
0.448 0.047 0.414
0.111 0.006 0.105
0.363 0.022 0.350
Ž
.
Ž
.
Ž
.
Ž
.
50–100
0.389 0.082 0.264
0.594 0.142 0.413
0.266 0.008 0.259
0.474 0.054 0.415
Ž
.
Ž
.
Ž
.
Ž
.
All
0.044 0.003 0.026
1.733 0.046 1.426
0.027 0.002 0.013
1.275 0.028 1.130
Ž
.
Ž
.
This table reports cross-sectional means, standard errors in parentheses , and medians in italics
for the dollar as well as percentage quoted and effective spreads for 471 common stocks listed on the
Stock Exchange of Hong Kong. Stocks priced below HK$0.25 or above HK$100 are not included in
the sample. For a given stock, the statistics are calculated for the six-month period from October 1,
1996 to March 27, 1997.
(
)
H.-J. Ahn, Y.-L. Cheung r Pacific-Basin Finance Journal 7 1999 539–556
547
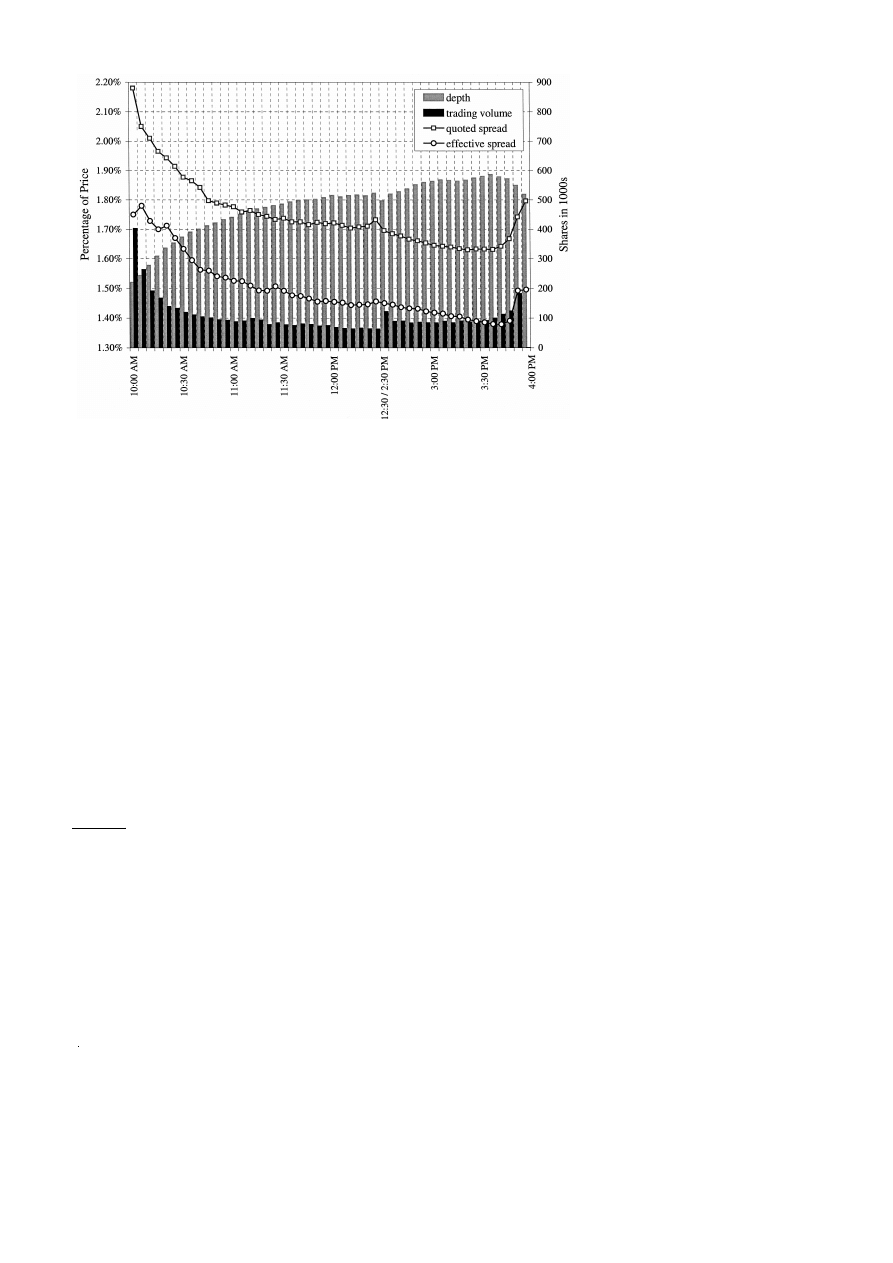
Fig. 1. Intraday patterns of percentage quoted and effective spreads, depths and volume.
quoted spreads are 1.73% and 1.43%. As the price level increases, the percentage
quoted spread decreases from 2.92% for the lowest-priced stocks to 0.59% for the
highest-priced stocks. The mean percentage spread of 1.73% on the SEHK seems
to be significantly higher than the average bid–ask spread on the NYSE, which is
around 0.6%.
11
This discrepancy could be due to differences in the average stock
prices, liquidity characteristics of the listed stocks, or different institutional
features of the two exchanges.
The effective spread for a round trip trade is defined as
<
<
ES s 2 p y q ,
1
Ž .
t
t
where p is the transaction price at time t, and q is the midpoint of the bid and
t
t
ask quotes recorded nearest to t. As we expected, the effective spread on the
Ž
SEHK is much smaller than the quoted bid–ask spread. The mean dollar per-
.
Ž
.
centage effective spread for the entire sample is $0.027 1.28% . The median
Ž
.
Ž
.
dollar percentage effective spread is $0.013 1.13% .
Fig. 1 shows the 5-minute intraday patterns of the percentage quoted and
effective spreads, market depth, and trading volume. The market depth and trading
volume are measured in number of shares. Both quoted and effective spreads
11
The average NYSE spread figure is from The 1994 NYSE Fact Book.

(
)
H.-J. Ahn, Y.-L. Cheung r Pacific-Basin Finance Journal 7 1999 539–556
548
exhibit U-shaped intraday patterns over the trading day. Both spreads reach their
peak when the market opens and then fall during the rest of the day, picking up
again during the last 15-minute trading session. Trading volume also exhibits a
similar U-shaped intraday pattern. However, the depth displays a reverse U-shaped
pattern. The depth increases during the trading day, reaching a peak at 3:35 PM
before it declines. The Exchange’s lunch break seems to affect the variables. The
Ž
.
Ž
.
spread and trading volume depth show an increase a decrease at the first 5
Ž
.
12
minutes of the afternoon session 2:30 to 2:35 PM .
The magnitudes of the
changes however are relatively small.
Fig. 1 clearly shows systematic relations among the spread, volume, and depth
on the SEHK. The spread, measured by the quoted as well as effective spreads, is
positively associated with trading activity. At the same time, the spread is
negatively associated with the depth. The combination of a wider spread and
smaller depth around the open and the close of the SEHK implies a decrease in
Ž
.
liquidity around these periods. Lee et al. 1993 report similar patterns on the
NYSE. They report U-shaped intraday patterns of spreads and trading volume and
a reverse U-shaped pattern of depth on the NYSE. A detailed discussion of the
negative relation between spread and depth on the SEHK is provided later in
Section 3.4.
To corroborate statistically the evidence of intraday spread pattern, we estimate
Ž
.
a dummy-variable regression model following Lehmann and Modest 1994 :
10
5
8
spread s a q
b dmktval
q
g dweek q
u dtime q ´
,
Ý
Ý
Ý
i , t
h
h , t
j
j, t
l
l , t
i , t
hs1
js1
ls1
10
5
8
subject to
b s 0,
g s 0,
and
u s 0,
2
Ž .
Ý
Ý
Ý
h
j
l
hs1
js1
ls1
where spread
denotes the average percentage quoted or effective spread of stock
i ,t
i for a half-hour trading interval t, and ´
is a random error with the usual
i ,t
normality properties. The dummy variables, dmktval, dweek, and dtime denote the
firm size, day of the week, and time of the day, respectively. The dummy variables
take the value of one if the observation of the dependent variable belongs to the
relevant group, and zero otherwise. The Greek symbols denote the parameters to
be estimated. Since the explanatory variables consist of linearly dependent dummy
variables, we impose the constraint that all within-group coefficients should total
zero.
Table 5 reports the estimation results of the dummy-variable regression. The
t-statistics are based on the White heteroskedasticity-consistent standard errors.
The average quoted spread across all stocks, all time intervals, and all days is
12
The increases in spreads and volume around the lunch break are consistent with the W-shaped
Ž
.
intraday pattern of return volatility on the SEHK documented by Cheung et al. 1994 .

(
)
H.-J. Ahn, Y.-L. Cheung r Pacific-Basin Finance Journal 7 1999 539–556
549
Table 5
Spread dummy variable regression results
Variable
Quoted spread
Effective spread
Coefficient
t-statistic
Coefficient
t-statistic
Intercept
1.73
748.30
1.23
490.28
Ž
.
dmktval
smallest
2.02
145.10
0.98
63.27
1
dmktval
0.97
106.72
0.52
56.88
2
dmktval
0.35
51.65
0.26
39.23
3
dmktval
0.06
9.02
0.08
13.76
4
dmktval
y
0.01
y
2.58
0.07
11.18
5
dmktval
y
0.30
y
61.77
y
0.12
y
24.27
6
dmktval
y
0.30
y
58.37
y
0.18
y
35.38
7
dmktval
y
0.67
y
183.14
y
0.33
y
90.76
8
dmktval
y
0.90
y
282.57
y
0.52
y
164.44
9
Ž
.
dmktval
largest
y
1.22
y
448.94
y
0.75
y
270.57
10
Monday
0.00
y
0.13
0.01
3.81
Tuesday
y
0.02
y
4.91
0.00
1.13
Wednesday
y
0.02
y
4.06
y
0.01
y
3.43
Thursday
0.00
0.61
y
0.01
y
2.48
Friday
0.03
8.09
0.00
0.89
10:00–10:30 AM
0.32
51.78
0.06
8.22
10:30–11:00 AM
0.11
19.75
0.03
6.16
11:00–11:30 AM
0.01
1.51
y
0.01
y
0.95
11:30–12:00 AM
y
0.05
y
9.88
y
0.03
y
6.70
12:00–12:30 PM
y
0.05
y
10.03
y
0.04
y
8.77
2:30–3:00 PM
y
0.14
y
28.28
y
0.01
y
2.45
3:00–3:30 PM
y
0.17
y
34.77
y
0.03
y
6.04
3:30–3:55 PM
y
0.02
y
4.18
0.03
6.11
2
Adj. R
0.31
0.17
The dependent variables used in the regression are the average percentage quoted spread and
average percentage effective spread, both measured during the 30-minute intraday interval. All
within-group dummy variable coefficients are restricted so that they total zero in order to avoid linear
dependency among the independent variables. The t-statistics are based on the White heteroskedasticity
consistent standard errors.
1.73%. The average effective spread is 1.23%. Both the quoted and effective
spreads decrease monotonically as firm size increases. Averages of the quoted
Ž
.
Ž
.
spread effective spread range from 0.51% 0.48% for the largest stocks to
Ž
.
3.75% 2.21% for the smallest stocks.
The weekday dummy coefficients indicate that the spread is lower during the
Ž
.
middle of the week. The average quoted spread is highest 1.76% on Fridays and
Ž
.
lowest 1.71% on Tuesdays and Wednesdays. The average effective spread is
Ž
.
Ž
.
highest 1.24% on Mondays and lowest 1.22% on Wednesdays and Thursdays.
The intraweek spread pattern documented on the SEHK is consistent with the
Ž
U-shaped intraweek pattern documented for the NYSE Foster and Viswanathan,
.
1993; McInish and Wood, 1992 .

(
)
H.-J. Ahn, Y.-L. Cheung r Pacific-Basin Finance Journal 7 1999 539–556
550
Coefficients of the intraday dummy variables clearly show a U-shaped intraday
variation in the spread. Both the quoted and effective spreads are highest during
the first half-hour of the trading session, averaging 2.05% for the quoted spread
and 1.29% for the effective spread across all stocks. Both spreads decline after the
Ž
first half-hour, reaching their lowest level 1.56% for the quoted spread and 1.20%
.
for the effective spread just before the last half-hour of trading. During the last
half-hour of trading, however, the quoted spread increases by 0.15% to 1.71% and
the effective spread increases by 0.06% to 1.26%.
The spread pattern reflected in the SEHK order book is virtually identical to the
Ž
.
bid–ask spread pattern quoted on the NYSE. McInish and Wood 1992 , Foster
Ž
.
Ž
.
and Viswanathan 1993 , and Chung et al. 1999 document a similar U-shaped
Ž
.
intraday pattern of the NYSE spread. In particular, Chung et al. 1999 suggest
that the U-shaped intraday spread pattern on the NYSE is attributable to the
trading behavior of limit order traders rather than that of specialists. They find that
spreads established by limit order traders exhibit a rise both at the open and the
close, while spreads by specialists are widest at the open and level off during the
rest of the day. The results in Table 5 also suggest that limit-order trading alone
produces the U-shaped intraday pattern of spreads.
3.2. Depth
Most studies on the intraday behavior of market microstructure focus on the
spread alone. However, the spread is only one dimension of liquidity. Liquidity
Ž
.
Ž
.
has both the price aspect i.e., the spread and the quantity aspect i.e., the depth .
For example, on the NYSE, one-half of all quote changes made by specialists
involve only depth changes. Hence, we need to look at both spread and depth to
fully understand the behavior of liquidity providers.
Table 6 presents the results of dummy-variable regressions in which we use
market and cumulative depths as dependent variables. The market depth is the sum
of the dollar amounts of the buy and sell orders submitted at the best bid and offer
prices. The cumulative depth is the sum of the dollar amounts of orders at the five
queues on both sides of the book. We average both depth measures during each
half-hour interval. Then, we log-transform them because of skewness in their
distributions. Other than for dependent variables, the model specification is
identical to that for the spread dummy regression documented in the previous
section.
The average market depth and cumulative depth across all stocks, all time
intervals, and all days are 6.18 and 7.85, respectively. When transformed back to
HK dollars, the intercepts of 6.18 for market depth and 7.85 for cumulative depth
are equivalent to HK$483,000 and HK$2,566,000, respectively. Market depth
increases monotonically as the firm size increases. The coefficients of the firm-size
dummy variable range from 4.33 for the largest stocks to y2.25 for the smallest
stocks. Cumulative depth also exhibits a similar positive relation to firm size.

(
)
H.-J. Ahn, Y.-L. Cheung r Pacific-Basin Finance Journal 7 1999 539–556
551
Table 6
Depth dummy variable regression results
Variable
Market depth
Cumulative depth
Coefficient
t-statistic
Coefficient
t-statistic
Intercept
6.18
2123.25
7.85
2925.32
Ž
.
dmktval
smallest
y
2.25
y
188.31
y
2.21
y
202.63
1
dmktval
y
1.86
y
201.58
y
1.80
y
207.50
2
dmktval
y
1.65
y
201.33
y
1.61
y
211.28
3
dmktval
y
1.04
y
137.23
y
0.99
y
140.54
4
dmktval
y
0.91
y
110.61
y
0.89
y
117.00
5
dmktval
y
0.06
y
7.43
y
0.01
y
0.87
6
dmktval
0.26
30.18
0.25
31.96
7
dmktval
1.17
153.04
1.12
163.69
8
dmktval
2.00
275.53
1.89
287.08
9
Ž
.
dmktval
largest
4.33
521.06
4.22
543.74
10
Monday
y
0.01
y
0.92
y
0.02
y
3.28
Tuesday
0.03
4.55
0.01
1.01
Wednesday
0.03
5.16
0.03
6.28
Thursday
y
0.02
y
3.20
0.00
y
0.25
Friday
y
0.03
y
5.46
y
0.02
y
3.66
10:00–10:30 AM
y
0.20
y
21.93
y
0.18
y
20.93
10:30–11:00 AM
y
0.07
y
8.77
y
0.08
y
10.40
11:00–11:30 AM
0.01
0.86
y
0.01
y
1.92
11:30–12:00 AM
0.04
5.71
0.03
3.83
12:00–12:30 PM
0.03
4.43
0.04
6.53
2:30–3:00 PM
0.10
14.33
0.07
10.37
3:00–3:30 PM
0.14
20.55
0.10
15.37
3:30–3:55 PM
y
0.05
y
7.70
0.03
4.69
2
Adj. R
0.72
0.75
The dependent variables used in the regressions are market depth and cumulative depth, both in
HK$1000, over the five best queues on both sides of the order book measured during the 30-minute
intraday interval. The dependent variables are log-transformed. All within-group dummy variable
coefficients are restricted to total zero in order to avoid linear dependency among the independent
variables. The t-statistics are based on the White heteroskedasticity consistent standard errors.
In Table 6, depth displays the opposite intraday pattern to spread, following a
Ž
.
reverse U-shaped pattern during the trading day. Market depth cumulative depth
is lowest during the first half-hour of the trading session with a coefficient of
Ž
.
y
0.20 y0.18 . Depth rises, reaching its highest level during the 30-minute
interval just before the last half-hour trading period of the afternoon session.
Ž
.
During the last half-hour of trading, depth decreases. Lee et al. 1993 report depth
to display a reverse pattern of the spread. Our results also confirm that the intraday
pattern of the depth is a reverse image of the spread. Overall, the intraday patterns
of spread and depth indicate that liquidity on the SEHK is lowest around market
open and close and highest during the middle of the trading day.

(
)
H.-J. Ahn, Y.-L. Cheung r Pacific-Basin Finance Journal 7 1999 539–556
552
Finally, the weekday dummy coefficients also exhibit a reverse U-shaped
pattern. Market depth is low at the beginning and the end of the week. This is
consistent with the finding that on the NYSE liquidity is lowest on Mondays and
Fridays and highest during the middle of the week. The regression result on
weekday dummies using cumulative depth as the dependent variable is similar to
the result using market depth as the dependent variable.
3.3. Trading actiÕities
Table 7 reports estimation results of the dummy-variable regression models of
trading activity measures. The dependent variables are the number of transactions,
Table 7
Number of trades, dollar volume, and trade size dummy variable regression results
Variable
Number of trades
Dollar volume
Trade size
Coefficient
t-statistic
Coefficient
t-statistic
Coefficient
t-statistic
Intercept
2.36
794.16
6.19
1709.08
3.84
2670.33
Ž
.
dmktval
smallest
y
0.58
y
47.78
y
1.18
y
75.18
y
0.60
y
91.75
1
dmktval
y
0.40
y
40.38
y
0.88
y
72.72
y
0.48
y
102.00
2
dmktval
y
0.17
y
19.06
y
0.65
y
62.88
y
0.49
y
125.57
3
dmktval
y
0.20
y
24.57
y
0.48
y
47.86
y
0.28
y
72.43
4
dmktval
y
0.07
y
7.84
y
0.33
y
32.08
y
0.26
y
65.69
5
dmktval
y
0.10
y
12.75
y
0.07
y
7.83
0.02
6.01
6
dmktval
y
0.17
y
21.85
y
0.07
y
7.11
0.10
23.60
7
dmktval
0.34
43.53
0.58
65.11
0.24
69.47
8
dmktval
0.34
46.10
0.83
93.38
0.48
133.88
9
Ž
.
dmktval
largest
1.01
170.58
2.27
292.43
1.26
359.71
10
Monday
0.00
y
0.06
0.00
y
0.39
0.00
y
0.84
Tuesday
y
0.01
y
0.97
y
0.01
y
1.06
0.00
y
0.67
Wednesday
y
0.01
y
1.22
0.00
y
0.07
0.01
2.23
Thursday
0.01
2.36
0.01
2.12
0.00
0.48
Friday
0.00
y
0.15
0.00
y
0.62
0.00
y
1.22
10:00–10:30 AM
0.24
25.52
0.28
24.91
0.04
8.62
10:30–11:00 AM
0.09
11.44
0.08
8.36
y
0.01
y
3.08
11:00–11:30 AM
y
0.08
y
11.21
y
0.11
y
12.95
y
0.03
y
9.19
11:30–12:00 AM
y
0.20
y
29.83
y
0.23
y
27.55
y
0.03
y
8.03
12:00–12:30 PM
y
0.30
y
44.02
y
0.32
y
38.34
y
0.03
y
7.22
2:30–3:00 PM
0.06
8.55
0.03
3.88
y
0.03
y
7.70
3:00–3:30 PM
0.00
y
0.21
0.02
2.54
0.02
6.52
3:30–3:55 PM
0.19
30.96
0.26
33.12
0.07
19.64
2
Adj. R
0.15
0.35
0.49
The dependent variables used in the regressions are the number of transactions as well as dollar
volume and average trade size, both in HK$1000, measured during the 30-minute intraday interval. All
of the dependent variables are log-transformed. All within-group dummy variable coefficients are
restricted to total zero in order to avoid linear dependency among the independent variables. The
t-statistics are based on the White heteroskedasticity consistent standard errors.

(
)
H.-J. Ahn, Y.-L. Cheung r Pacific-Basin Finance Journal 7 1999 539–556
553
dollar volume, and average trade size measured during half-hour intervals. All of
the dependent variables are log-transformed because of skewness in their distribu-
tions. The average number of transactions, dollar volume, and trade size are 2.36,
6.19, and 3.84, respectively. These figures are equivalent to 11 transactions and
HK$488,000 in volume during a typical half-hour interval, with an average trade
size of HK$47,000. The regression results suggest that trading volume and trade
size increase with firm size.
The weekday dummies’ coefficients do not exhibit any discernible patterns for
any of the three trading activity measures. However, the coefficients of the
intraday dummy variables show a clear U-shaped intraday pattern. The trading
Ž
activities, measured by all three proxies, are concentrated at the beginning 10:00
.
Ž
.
to 10:30 AM of the morning and at the end of the afternoon 3:30 to 3:55 PM
sessions.
13
The number of trades and dollar volume are smallest during the
half-hour interval right before the lunch break.
The U-shaped intraday pattern in trading activity reported in Table 7 is
generally consistent with the U-shaped spread and reverse U-shaped depth patterns
reported in the earlier sections. If trading activity is positively related to informed
trading, then increased informed trading around the market open and close will
worsen the adverse selection problem for limit order traders, thus leading to a
U-shaped spread and a reverse U-shaped depth pattern.
3.4. Relation between spread and depth
It may be difficult to make inferences about liquidity on the basis of either
Ž
.
spreads or depth alone. Lee et al. 1993 argue that the combination of wider
Ž
.
Ž
.
Ž
narrower spreads and smaller greater depths is sufficient to infer a decrease an
.
increase in liquidity. Although the empirical results reported in the previous
sections suggest a negative relation between spread and depth, it is not clear
whether the generally negative relation between spread and depth would hold,
even if we controlled the pronounced intraday effects.
To determine the extent of the negative relation between spread and depth after
controlling for the intraday patterns, we examine the correlation between them
during each 30-minute interval of the trading day at the individual-firm level. If a
stock’s liquidity is lowest at the open and close of the trading day, we would
expect to find higher negative correlations between spread and depth, at the open
and the close than during the rest of the trading day.
Ž
.
We focus on the 33 Hang Seng Index HSI component stocks. HSI component
stocks are the most actively traded stocks on the SEHK. They provide a reasonable
representation of the market, since they account for more than 75% of market
capitalization and 70% of total dollar volume. Limiting the analysis to the most
actively traded stocks minimizes possible biases caused by thin trading.
13
Ž
.
Chan 1997 also reports similar findings in the trading volume pattern on the SEHK.

()
H.-J.
Ahn,
Y.-L.
Cheung
r
Pacific-Basin
Finance
Journal
7
1999
539
–
556
554
Table 8
Correlation between spreads and depths
Time
10:00–
10:30–
11:00–
11:30 AM–
12:00–
2:30–
3:00–
3:30–
All
10:30 AM
11:00 AM
11:30 AM
12:00 PM
12:30 PM
3:00 PM
3:30 PM
3:55 PM
Mean
y
0.135
y
0.028
y
0.051
y
0.025
y
0.050
y
0.069
y
0.004
y
0.081
y
0.123
S.D
0.242
0.251
0.234
0.197
0.215
0.308
0.211
0.148
0.213
Min.
y
0.852
y
0.314
y
0.748
y
0.371
y
0.745
y
0.841
y
0.396
y
0.232
y
0.620
1st Q
y
0.256
y
0.215
y
0.191
y
0.141
y
0.166
y
0.212
y
0.396
y
0.192
y
0.250
Med.
y
0.141
y
0.073
y
0.052
y
0.056
y
0.079
y
0.041
y
0.144
y
0.104
y
0.140
3rd Q
0.005
0.048
0.070
0.079
0.093
0.140
y
0.019
y
0.032
y
0.010
Max.
0.287
0.832
0.430
0.371
0.365
0.459
0.543
0.460
0.400
Ž
.
p-value sign test
0.013
0.089
0.019
0.027
0.060
0.089
0.016
0.004
0.005
The correlation between spreads and depths is computed for each stock and for each 30-minute trading interval of the day. Cross-sectional summary
statistics are reported. The sample consists of the 33 Hang Seng Index component stocks.

(
)
H.-J. Ahn, Y.-L. Cheung r Pacific-Basin Finance Journal 7 1999 539–556
555
Table 8 reports the summary statistics of correlations between spread and depth
at the individual firm level for each half-hour interval of the day. The last column
Ž
.
‘‘All’’ of the table reports the summary statistics of correlations computed for
each firm without controlling for the time of the day.
The mean and median correlations for all of the eight intraday intervals are
negative, confirming the negative relation between spread and depth. The non-
parametric sign test result indicates that the negative median correlations for the
eight half-hour intervals are all statistically significant at the 10% level. The
average and median of correlations for the entire day are y0.123 and y0.140,
respectively. Table 8 also shows that these negative correlations are strongest at
the opening and closing half-hour intervals, suggesting that the negative relation
between spread and depth is most pronounced during these periods.
4. Conclusion
This study analyzes the behavior of the spread and depth, using information
found in the Trade Record and the Bid and Ask Record of the 471 stocks traded
on the SEHK between October 1996 and March 1997. We find that spreads are
negatively associated with depths. Spreads exhibit U-shaped intraday and in-
traweek patterns, and depths display reverse U-shaped intraday and intraweek
patterns. The negative relation between spread and depth is significant even after
we control for the time-of-the-day effect.
The negative association between spread and depth on the SEHK implies that
limit order traders actively manage both the price and quantity dimensions of
liquidity by adjusting the spread and depth. The combination of a wider spread and
smaller depth around the SEHK’s open and close is consistent with the trading
strategy adopted by limit order traders. These traders attempt to minimize losses
from trading with the informed when they face a severe adverse selection problem
around these periods.
The general patterns of the spread and depth on the SEHK are similar to those
observed on the NYSE. Most of the studies that investigate the market microstruc-
ture of the NYSE attribute the U-shaped intraday pattern of spreads to the optimal
quoting behavior of specialists. However, the evidence presented in this paper
suggests that the intraday pattern should not be solely attributed to specialists’
market-making activities because the SEHK does not operate with the market-
maker system.
Acknowledgements
We would like to thank an anonymous referee, as well as Kee-Hong Bae,
Kalok Chan, and Violet Torbey for their helpful suggestions and comments. We

(
)
H.-J. Ahn, Y.-L. Cheung r Pacific-Basin Finance Journal 7 1999 539–556
556
also thank Karen Lam of the Stock Exchange of Hong Kong for her description of
the exchange trading system. Hee-Joon Ahn acknowledges financial support from
the City University of Hong Kong’s strategic grant No. 7000892. Any remaining
errors are our own.
References
Biais, B., Hillton, P., Spatt, C., 1995. An empirical analysis of the limit order book and the order flow
in the Paris Bourse. Journal of Finance 50, 1655–1689.
Chan, Y.C., 1997. Adverse selection, inventory cost and market depth: An empirical analysis of
intraday price movement in the Stock Exchange of Hong Kong, Ph.D. Thesis, The Hong Kong
University of Science and Technology, Hong Kong.
Cheung, Y.-L., Ho, R.Y.-K., Pope, P., Draper, P., 1994. Intraday stock return volatility: The Hong
Kong evidence. Pacific-Basin Finance Journal 2, 261–276.
Chung, K.H., Van Ness, B.F., Van Ness, R.A., 1999. Limit orders and the bid–ask spread. Journal of
Financial Economics 53, 255–287.
Copeland, T., Galai, D., 1983. Information effects on the bid–ask spread. Journal of Finance 38,
1456–1469.
Easley, D., O’Hara, M., 1987. Price, trade size, and information in securities market. Journal of
Financial Economics 19, 69–90.
Foster, F.D., Viswanathan, S., 1990. A theory of interday variations in volumes, variances and trading
costs in securities markets. Review of Financial Studies 3, 593–624.
Foster, F.D., Viswanathan, S., 1993. Variations in trading volume, return volatility, and trading costs:
Evidence on recent price formation models. Journal of Finance 48, 187–211.
Glosten, L.R., 1994. Is the electronic open limit order book inevitable? Journal of Finance 49,
1127–1161.
Glosten, L.R., Milgrom, P., 1985. Bid, ask, and transaction prices in a specialist market with
heterogeneously informed traders. Journal of Financial Economics 14, 71–100.
Hamao, Y., Hasbrouck, J., 1995. Securities trading in the absence of dealers: Trades and quotes in the
Tokyo Stock Exchange. Review of Financial Studies 8, 849–878.
Hedvall, K., Niemeyer, J., Rosenqvist, G., 1997. Do buyers and sellers behave similarly in a limit order
book? A high-frequency data examination of the Finnish Stock Exchange. Journal of Empirical
Finance 4, 279–293.
Lee, C.M.C., Mucklow, B., Ready, M.J., 1993. Spreads, depths, and the impact of earnings informa-
tion: An intraday analysis. Review of Financial Studies 6, 345–374.
Lehmann, B.N., Modest, D.M., 1994. Trading and liquidity on the Tokyo Stock Exchange: A bird’s
eye view. Journal of Finance 48, 1595–1628.
McInish, T., Wood, R., 1992. An analysis of intraday patterns in bidrask spreads for NYSE stocks.
Journal of Finance 47, 753–764.
Niemeyer, J., Sandas, P., 1993. An empirical analysis of the trading structure at the Stockholm Stock
˚
Exchange. Journal of Multinational Financial Management 3, 63–101.
The 1994 Handbook of World Stock and Commodity Stock Exchanges.
The 1994 New York Stock Exchange Fact Book. New York Stock Exchange.
The 1996 Stock Exchange of Hong Kong Fact Book. Stock Exchange of Hong Kong.
Wyszukiwarka
Podobne podstrony:
Lee, Fok And Liu Explaining Intraday Pattern Of Trading Volume From The Order Flow Data
Glądalski, Michał Patterns of year to year variation in haemoglobin and glucose concentrations in t
Adorno Freudian Theory and the Pattern of Fascist Propaganda
Intraindividual stability in the organization and patterning of behavior Incorporating psychological
Richard Bandler And John Grinder Patterns Of The Hypnotic Techniques Of Milton Erickson
Donald H Mills The Hero and the Sea, Patterns of Chaos in Ancient Myth (pdf)(1)
Intraindividual stability in the organization and patterning of behavior Incorporating psychological
DANN Changing patterns of violence at Qustul and Ballana in the post Meroitic period Part One The Hu
Nukariya; Religion Of The Samurai Study Of Zen Philosophy And Discipline In China And Japan
Phoenicia and Cyprus in the firstmillenium B C Two distinct cultures in search of their distinc arch
Contrastic Rhetoric and Converging Security Interests of the EU and China in Africa
20 Seasonal differentation of maximum and minimum air temperature in Cracow and Prague in the period
Derrida, Jacques Structure, Sign And Play In The Discourse Of The Human Sciences
SHSBC 289 PATTERN OF THE GPM
Glińska, Sława i inni The effect of EDTA and EDDS on lead uptake and localization in hydroponically
The Pernicious Blend of Rumination and Fearlessness in NSSI
The Presentation of Self and Other in Nazi Propaganda
więcej podobnych podstron